Article

Effects of Media Nutrient Variation on Microalgae Productivity and Economics During Semi-Continuous Cultivation

1
Microbial and Biome Sciences Group, Bioscience Division, Los Alamos National Laboratory, Los Alamos, NM 87545, USA
2
Catalytic Carbon Transformation and Scale-Up Center, National Laboratory of the Rockies, Golden, CO 80401, USA
3
Chemical Diagnostics and Engineering Group, Chemistry Division, Los Alamos National Laboratory, Los Alamos, NM 87545, USA
4
Arizona Center for Algae Technology and Innovation, Arizona State University, Mesa, AZ 85212, USA
*
Author to whom correspondence should be addressed.
Processes 2026, 14(11), 1770; https://doi.org/10.3390/pr14111770
Submission received: 9 March 2026 / Revised: 14 May 2026 / Accepted: 15 May 2026 / Published: 28 May 2026

Abstract

The development of large-scale microalgae growth for biofuel production is currently limited by the cost of biomass production. However, new approaches to infrastructure and cultivation practices are bringing the field closer to realization. Macronutrients in the cultivation media contribute significant costs, especially since their concentrations have not been optimized for specific strains and conditions. Environmental photobioreactors (ePBRs) were used to simulate cultivation under outdoor conditions, during which the nitrogen and phosphorus levels in the media were varied. The growth of two potential biofuel production strains, Picochlorum celeri and Tetraselmis striata, with varying nutrient inputs during summer and winter scripts, respectively, was studied. This study demonstrated that nitrogen and phosphorus in f/2 media could be reduced by more than 60% from the standard formulation, while maintaining growth rates in a semi-continuous harvesting approach. Experiments comparing the standard and reduced nutrient input concentrations were also conducted for both species in 820 L outdoor raceway ponds, in Mesa, AZ. P. celeri grown in these ponds in October had a growth rate of 10.6 ± 0.7 g/m2/day and 10.6 ± 0.3 g/m2/day for the standard and low-nutrient P. celeri ponds, respectively. T. striata grown in April–May had a growth rate of 16.6 ± 1.4 g/m2/day for the standard nutrient input ponds and 17.4 ± 1.1 g/m2/day for the low-nutrient input ponds, and in October 14.5 ± 0.6 g/m2/day for standard nutrient ponds and 14.4 ± 0.6 g/m2/day for low-nutrient ponds. These outdoor data therefore confirmed the indoor ePBR data. Techno-economic analysis shows that, if high growth rates can be attained at lower nutrient concentrations, a reduction of at least 60% in nutrient costs can be achieved. Such results highlight the importance of managing macronutrient media inputs, as these have a considerable contribution to biomass production costs in large-scale facilities. The analysis also points to the importance of maintaining high spent medium recycling rates in an industrial deployment, so as to minimize the losses of nitrogen and phosphorus compounds.

1. Introduction

There has been a large push to investigate additional sources of energy, with biological feedstocks being an important contributor to future supplies of liquid fuels and products [1,2]. Microalgae are a promising platform for multi-product biorefineries, due to their ability to quickly accumulate biomass with desirable composition, including lipids, particularly fatty acids that can be converted to biofuels and high-value coproducts [3,4,5]. The choice of product pathway is dependent on the carbon chain length and degree of saturation, with fuels being generated primarily from saturated fatty acids, mixed with some unsaturated fatty acids depending on the desired properties [6,7]. Carbon chains with greater degrees of unsaturation (polyunsaturated fatty acids—PUFAs) may be converted to other products, including nutritional supplements or polyurethane [8,9]. Additionally, microalgae can be grown in a variety of climates, with non-potable water sources, and are not restricted to arable land, making them valuable for broad use without competing for traditional food crop resources. However, improvements in productivity and decreases in the cultivation costs are still needed to make the large-scale implementation of microalgae feasible [10].
Temperature and light intensity are significant factors in the productivity of microalgae [11]; however, the composition of their growth media is also essential [12]. Due to their photosynthetic capacity, in addition to light, microalgae only require minimal growth media, which contains nitrogen, phosphorus, trace metals, and carbon, generally introduced as carbon dioxide. Though the basic components of media for microalgae seem simple, the sources of these elements, as well as their concentration, can be highly variable [13,14,15]. Importantly, media composition can have a significant impact on culture growth and cellular composition [16,17]; the depletion of individual nutrients, such as nitrogen, triggers increases in carbohydrate and/or lipid content and an eventual reduction in growth rate [18,19]. Maintaining high growth rates, which generally requires sufficient nutrients, and balancing that with higher-value biomass, which is typically achieved by shifting to higher lipid content, is essential to improving the economics of microalgae-based biorefineries [10]. In addition to increasing growth rates, it is essential to target the reduction in cultivation costs using other levers so that the resulting minimum biomass selling price (MBSP) can ultimately enable an economic conversion of algae biomass. Such mechanisms are inclusive of the nutrient costs and capital expenditures incurred by algae farms, as both affect MBSP [20]. Included in this is the consideration of media recycling, where nutrients in the reused media would continue to be made available for algae consumption and resulting biomass accumulation [21]. Benchmarking shows MBSPs ranging from $400/tonne ash-free dry weight (AFDW) [10,22] up to values an order of magnitude higher [23,24]. It is noteworthy, though, that such estimates can vary considerably depending on areal biomass productivity, compositional profile, algae farm scale, cost year of analysis, and nutrient management strategy, among other factors [25].
Many microalgae species are being investigated for their ability to produce biomass and accumulate biofuel precursors; these potential production strains are grown in both brackish and marine environments, as well as across seasons [11,26,27]. Two of the species currently showing high productivity in outdoor testbed trials conducted under the portfolio of the US Department of Energy (DOE) Bioenergy Technologies Office are Tetraselmis striata and Picochlorum celeri [28]. Both species are of marine origin, with T. striata being a top cold weather strain and P. celeri a warm weather strain, allowing the rotation of the two to cover the full year [29]. T. striata shows a growth rate in outdoor testbed ponds in Mesa, AZ, of 7.9 g/m2/day during the winter, increasing to 15.6 g/m2/day in the spring. During the hotter summer months P. celeri has shown a productivity of 31 g/m2/day, up to 36 g/m2/day in August [28]. Within the testbed experiments originally conducted to develop the State of Technology (SOT) for production [30,31], cultures have typically been grown with excess nutrients in the media, unless shifting of the biochemical composition is the primary goal of the cultivation. However, this practice results in the nutrients that are not taken up by the cells becoming part of the waste stream when media is not recycled.
Here, the aim was to determine if the excess nitrogen and phosphorus generally added to algae growth media to keep cultures in a nutrient replete state under semi-continuous cultivation are necessary to maintain biomass productivity. Techno-economic analysis (TEA) was then performed for varying concentrations of nitrogen and phosphorus in the cultivation media to determine the economic impact of changing these nutrient inputs. To do this, varying concentrations of nitrogen and phosphorus were added to the growth media for T. striata and P. celeri and the effect of these starting inputs on biomass growth rates was assessed. This study demonstrated that the inputs of the macronutrients nitrogen and phosphorus can be reduced without affecting culture growth, within a semi-continuous harvesting approach. Additionally, the use of indoor experimentation in environmental photobioreactors (ePBRs) was shown to predict outcomes in outdoor test ponds. This data on nutrient uptake was then used to model the production of algae biomass in large-scale farms using process simulation software [25], with the goal of understanding how nutrient management in cultivation media affects biomass production costs.

2. Materials and Methods

2.1. Strains

Two species of marine green algae were selected from the Development of the Integrated Screening, Cultivar Optimization, and Verification Research Program (DISCOVR) SOT cultivation trials: Picochlorum celeri TG2 and Tetraselmis striata LANL1001 [28]. P. celeri was isolated from the gulf of Texas, through high light selection and clonal isolation, and is the current top performing hot weather marine strain by biomass accumulation [28,32]. For these experiments P. celeri was acquired from the Colorado School of Mines, CO, USA. Tetraselmis striata was originally isolated from an outdoor culture of Nannochloropsis salina 1776 and in outdoor trials performs as the best marine strain in fall–winter–spring [33].

2.2. Cultivation in Environmental Photobioreactors

2.2.1. Media Formulation

Picochlorum celeri and Tetraselmis striata were grown in modified f/2 media with a salinity of 50 parts per thousand (ppt) or 35 ppt, respectively, achieved with the addition of Instant Ocean Sea Salt (Spectrum Brands, Blacksburg, VA, USA). Trace metals were added to the media at concentrations of 3.15 mg/L FeCl3·6H2O, 4.36 mg/L Na2EDTA·2H2O, 10 µg/L CuSO4·5H2O, 6 µg/L Na2MoO4·2H2O, 22 µg/L ZnSO4·7H2O, 10 µg/L CoCl2·6H2O, and 180 µg/L MnCl2·4H2O (all from Sigma-Aldrich, St. Louis, MO, USA). Vitamin B12 (Sigma-Aldrich) at a concentration of 0.5 µg/L was added to the media for T. striata cultivation only. Nitrogen and phosphorus (both from J.T. Baker Avantor, Phillipsburg, NJ, USA) concentrations in the media varied depending on the nutrient condition being tested, with nitrogen concentrations ranging from 20 ppm to 140 ppm from NH4HCO3 and phosphorus concentrations of 2.2 ppm to 19 ppm from NaH2PO4·H2O. Media was vacuum filter sterilized with a 0.2 µm pore size.
Starter cultures were maintained in media containing sufficient nitrogen and phosphorus concentrations to maintain growth, nutrient replete. For experimental setup and dilutions, the ammonia and phosphate concentration measurements were made immediately following dilution. That measurement was used to calculate the amount of nitrogen (NH4HCO3) and phosphorus (NaH2PO4·H2O) to add to the cultures to reach the desired nutrient starting concentration for each condition being tested.

2.2.2. Cultivation Conditions

Cultures were grown in ePBRs (Algaemetrics, Marblehead, MA, USA) at a volume of 0.5 L using light and temperature scripts that mimic outdoor conditions from Mesa, Arizona, and a pond depth of 20 cm (Figure 1A) [34]. Picochlorum celeri cultures were grown using a summer script, simulating diurnal light and temperature conditions during the period of 7–14 August 2020. Tetraselmis striata cultures were grown using a winter script, simulating light and temperature conditions for 24 January–3 February 2022. Air was constantly bubbled into the cultures and pH was maintained at a setpoint of 7.0 (±0.05) using on-demand injection of 100% CO2 through a gas dispersion tube. Cultures were magnetically stirred to allow for continuous mixing and to keep the cells suspended.
A semi-continuous harvesting method was used for cultivation in ePBRs, simulating cultivation at the Arizona Center for Algae Technology and Innovation (AzCATI, Mesa, AZ, USA) during the script period [28]. A portion of each culture was harvested on a set schedule, every 2–4 days, throughout the course of the experiment, correlating to a 2× or 3×/week harvest schedule, and cultures were reset back to an optical density of 0.4 at 750 nm (OD750) for T. striata or 0.5 for P. celeri. At every harvest, fresh media containing trace metals was added to attain the target OD. The amounts of NH4HCO3 and NaH2PO4·H2O were calculated and added to reach the target N and P concentrations for each experimental condition, ranging from 20 to 140 ppm N and 2.2 to 19 ppm P. For P. celeri, the cultures were partially harvested on Days 3 and 5, and harvested completely on Day 7. For T. striata, the cultures were partially harvested on Days 3 and 7, and harvested completely on Day 10. Linear growth rates were calculated by applying a linear regression to the OD750 measurements for each of the three growth periods per experiment. Significance was determined via Welch’s t-test in Prism v. 10.6.0 (GraphPad Software, Boston, MA, USA).

2.2.3. Nutrient Analysis and Addition

Nutrient measurements for both ammonia (N) and phosphate (P) in the medium were taken daily during growth; on days that cultures were harvested, samples were taken from each culture both before and after dilution, as well as after nutrient addition. The after-dilution samples were used to determine the amount of N and P added to each culture at reset to reach the desired starting levels. For nutrient analysis, samples were syringe-filtered through a 0.22 µm PES membrane to separate cells from the media; the filtered media for each sample was used. Nutrient measurements were performed using HACH TNTplus Vial Test Kits, including the Ammonia TNTplus Vial Tests, LR (1–12 mg/L NH3-N) and Phosphorus (Reactive) TNTplus Vial Tests, LR (0.15–4.50 mg/L PO4), measured on a HACH DR3900 spectrophotometer (Loveland, CO, USA). If nutrient concentrations were estimated to be outside the range of the HACH kit, the samples were diluted with Milli-Q water to reach the linear range.

2.3. Raceway Pond Growth

2.3.1. Media Composition

P. celeri and T. striata were cultivated in a modified f/2 media with the same formulation as was used in Section 2.2, and 38.5 g of Instant Ocean® Sea Salt was added to 1 L media to adjust salinity to 35 ppt. Outdoor cultivation utilized reverse osmosis (RO) water. Standard macro-nutrients were a 16:1 molar ratio of N:P, matching the Redfield ratio for ocean waters [35,36] of approximately 70 ppm NH4HCO3 and 9.7 ppm NaH2PO4 (‘standard nutrients’), and adjusted for ‘low nutrients’; conditions per run are listed in Table 1. Nitrogen and phosphorus concentrations were determined using a SEAL AQ400 Discrete Analyzer and manufacturer’s standard protocols for ammonia and phosphate quantification.

2.3.2. Cultivation

Cultivation systems utilized outdoors at AzCATI for this study are as described in McGowen et al. 2017 [30]. Briefly, outdoor fiberglass ponds (Commercial Algae Professionals, Peachtree City, GA, USA) of 820 L nominal volume at a depth of 20 cm and a total surface area of 4.2 m2 were operated in triplicate for each experimental condition (e.g., standard/low nutrients) (Figure 1B). Pond mixing was with a stainless-steel paddlewheel driven by a 1/3 hp motor (Leeson, Milwaukee, WI, USA, model # 191201) and gearbox (IPTS, Riviera Beach, FL, USA, model IBLCS050, 80:1 gear ratio) controlled by a variable-frequency drive (KB, Santa Fe Springs, CA, USA, Model KBDA-24D) operated at 20 Hz. Ponds were inoculated after seed scale-up in indoor flat panel reactors and operated as described previously [30]. The primary mode of operation was to operate the ponds in a semi-continuous fashion, with experiments beginning with an inoculation target density ≥ 0.05 g AFDW L−1 and subsequent grow-out to 0.3–0.5 g AFDW L−1 to trigger harvesting operations. Ponds were then harvested two to three times a week depending on the growth rate, with higher productivity leading to more frequent harvests. On days that the ponds were not harvested ponds were filled to 20 cm with RO water prior to sampling. On harvest days, ponds were sampled to determine biomass density (g AFDW L−1), the target percent of pond volume was removed, ponds were refilled with fresh media, allowed to mix, and sampled again to quantify the change in various metrics due to the harvest (e. g., decrease in OD750 and AFDW, added macronutrients of N (NH4HCO3) and P (NaH2PO4)). Routine daily samples were taken for optical density, AFDW, nutrients (N and P), pH, salinity, and microscopy. Water quality monitoring and pH control was through the use of a YSI 5200A-DC (YSI Inc., Yellow Springs, OH, USA) water quality monitoring system simultaneously measuring pH, pond water temperature (°C), dissolved oxygen saturation (%), and salinity (g L−1) recorded at 15 min intervals. The pH setpoint of 7.0 was maintained by on-demand sparging with CO2 through a ceramic micro-bubbler diffuser (Sweetwater® Model# DYPFP4, available online: www.pentairaes.com (accessed on 9 March 2026)) triggered by the YSI pH probe. The CO2 supply was turned off at night. Weather data was collected on site using a HOBO RX3000 Weather Station (Onset Computer Corporation, Bourne, MA, USA), including sensors for air temperature (°C), relative humidity (%), rainfall (mm), photosynthetically active radiation (PAR), solar radiation (W m−2), wind speed (m s−1) and direction (degrees), and was collected at 5 min intervals.

2.4. Biochemical Analysis

2.4.1. Ash-Free Dry Weight

AFDW values are determined using the AzCATI Gravimetric Method for Determination of Dry Weight (DW) and AFDW for Algal Samples method which allows for determination of the organic component of the dried biomass [37]. Filter papers were pre-washed with 5 mL Milli-Q water on a vacuum manifold and pre-ashed in a muffle furnace at 500 °C for at least 4 h. Filters were weighed and 35–50 mL pre-measured liquid samples were filtered using a vacuum manifold. Filters with biomass were dried overnight in an oven at 105 °C. The filters were removed from the oven and weighed. Filters were then placed in a muffle furnace using a ramping protocol, the samples were ashed at 500 °C for at least 4 h and then removed and weighed. DW measurements are determined by subtracting the filter weight from the filter plus biomass weight and multiplying it by 1000 divided by the mL in sample filtered. AFDW determinations were calculated by subtracting the filter plus ash weight from the filter plus biomass weight and multiplying it by 1000 divided by the mL in sample filtered. AFDW was used to calculate the Areal Harvest Yield Productivity (AHYP), a measure of g of biomass produced per square meter per day (g/m2/d); these calculations are detailed in Knoshaug 2016 [31,38].

2.4.2. Fatty Acid Methyl Ester Analysis

Lipid content was determined as fatty acid methyl esters (FAMEs) by gas chromatography coupled with flame ionization detection (GC-FID) [39]. Briefly, 5–10 mg of freeze-dried biomass was used for the analysis. Biomass was treated with 200 µL of chloroform:methanol (2:1, v/v) and 300 μL of 0.6 M HCl:methanol. Then 25 µL of 10 mg/mL tridecanote (C13:0ME) was added to the extract as the internal standard. The samples were heated at 85 °C for 1 h and FAMEs were extracted with 1 mL of hexane. The hexane extracts were analyzed by an Agilent 7890A Series GC-FID equipped with a DB-WAX column (30 m length × 0.25 mm inner diameter × 0.25 μm film thickness) (Agilent Technologies, Santa Clara, CA, USA). Helium was used as the carrier gas at a flow rate of 1 mL/minute and 2 μL samples were loaded onto the column at a split ratio of 10:1. The initial column temperature was 100 °C. The temperature was then ramped to 200 °C at 25 °C/minute, held for 1 min, again ramped to 242 °C at 1.5 °C/minute and held for 1 min. The inlet and the detector temperatures were maintained at 250 and 280 °C, respectively. Chromatographic signals from the samples were matched with those of a GLC 461C 30-component FAME standard mix containing C8:0–C24:0 (Nu-Chek Prep, Inc., Elysian, MN, USA), and FAMEs were quantified using C13:0ME as the internal standard.

2.4.3. Carbohydrate Measurement

Carbohydrate content was determined using two-step sulfuric acid hydrolyzation followed by spectrophotometric measurement [40]. Briefly, 25 mg of freeze-dried biomass was used for the analysis and 250 µL of 72% (w/w) sulfuric acid was added to the samples and incubated in a 30 °C water bath for 1 h, while vortexing each sample every 10 min. Then the samples were diluted with 18.2 MΩ-cm water to a sulfuric acid concentration of 4% (w/w) and autoclaved at 121 °C for 1 h. Then the acidic hydrolysate was isolated from the biomass by filtration through 0.2 µm nylon filters. Spectrophotometric determination of monosaccharides was achieved by complexing the free aldehyde group of the monosaccharide with MBTH (3-methyl-2-benzothiazolinone hydrazone) and measuring the absorbance of the resultant blue color complex at 620 nm using a BioRad SmartSpec UV-Vis Spectrometer. Total monosaccharides in the samples were quantified using a D(+) glucose calibration curve.

2.5. Techno-Economic Analysis (TEA)

Process modeling was carried out using Aspen Plus V14 (AspenTech) for hypothetical 5000-acre algae farms based on the cultivation of either P. celeri or T. striata. The general design of algae farms followed that provided in [25], with a harvested density setpoint of 0.5 g/L and a three-step dewatering approach to recover algae biomass at 20 wt% solids. All scenarios were assessed as having a year-round flat productivity, based on experimental data from ePBRs, for two main reasons: (1) avoiding the addition of an uncertainty factor to the analysis in the form of productivity variability among seasons, and (2) providing results that can be more directly leveraged by researchers as assays carried out at a small scale usually yield individual productivity numbers [10]. In this sense, the minimum biomass selling prices (MBSPs) determined in this study are useful metrics, mainly for comparative benchmarking of different nutrient management practices and medium recycling scenarios. Nutrient levels were also varied following the data collected in ePBRs: simulations were designed so that initial and final N and P concentrations derived from experimental cultivations matched those at the inlet and outlet, respectively, of the algae ponds in Aspen Plus. As is standard for this model, the composition of microalgae biomass was considered to be equal to that of the mid-harvest Scenedesmus scenario reported by Davis et al. 2016 [25] for C, H, O, and S. In order to match the nutrient uptake observed experimentally, N and P content in the biomass were adjusted on a case-by-case basis. Additionally, N and P requirements are considered to be supplied by ammonia and diammonium phosphate, respectively. An associated TEA spreadsheet based on discounted cash flow rate of return (DCFROR) analysis was employed to retrieve all pertinent mass and energy balance data and to generate estimates of the MBSP for algae cultivated in each scenario. MBSPs are given in US dollars per ton of AFDW algae biomass, using 2016 as the cost year. The general assumptions to determine the capital expenditures, operational expenses, and fixed costs associated with the algae farms, as well as the parameters required to carry out the DCFROR analysis, were set consistent with those in [25].

3. Results and Discussion

3.1. Environmental Photobioreactor Growth

“Standard SOT f/2” media contains 70 ppm N as ammonia and 9.7 ppm P as phosphate and has been used across a wide range of marine cultivars within the DOE BETO portfolio trials; at AzCATI these nutrient inputs are sometimes reduced to half the standard concentration during winter months, when growth is slower. In this work, these nutrient input conditions (70 ppm N, 9.7 ppm P) were defined as the standard summer nutrient inputs, and 35 ppm N, 4.7 ppm P were defined as the standard winter nutrient inputs, due to the extensive use of these conditions in outdoor trials at the AzCATI site. In the current work, a range of conditions were used, with near-standard nutrients as the “standard condition”, increasing to 2× the standard and dropping to less than half of the standard, for the two potential biofuel species of Picochlorum celeri and Tetraselmis striata.
P. celeri is recognized as a top biomass production species, showing the greatest productivity from the late spring to early fall seasons [11]. For this reason, a script was chosen for the ePBRs that simulated the light and temperature conditions in August 2020 (Figure S1A,C), where high productivity, 32.6 g/m2/day, was observed at the AzCATI outdoor raceway testbed in Mesa, Arizona [41]. These summer conditions included a salinity of 50 ppt, the standard nutrient concentrations of 70 ppm N and 9 ppm P, and a pH of 7. Because daily measurements of biomass concentration by ash-free dry weight required the removal of a notable fraction of the culture from the ePBRs, comparisons between the ePBR and outdoor raceway data were made using optical density (OD750) values. Since OD values can vary across instruments, and because growth rates were more reflective of biomass productivities than direct OD comparisons, linear growth rates were calculated by conducting a curve fit of the OD values for each grow-out, resulting in growth rates expressed as OD/day. The average observed linear growth rate in the ePBRs using 70 ppm N and 9 ppm P was 0.61 ± 0.07 OD/day (Figure 2A,B). The tested range of nutrient inputs did not result in any significant change in growth rates, with all other conditions ranging from 0.53 ± 0.04–0.59 ± 0.04 OD/day. For this same period in the AzCATI ponds in 2020, the observed growth by OD was 0.55 ± 0.04 OD/day, which was not significantly different than the standard condition in the ePBRs. When the growth rates of each of the three growth periods were examined individually (Figure S2A), small differences were observed between growth periods, but there was not a trend between conditions. These growth rate data of P. celeri demonstrate that the ePBRs closely mimic outdoor algae productivity when using a retrospective light and temperature script from the outdoor location (Figure 2A and Figure S2A). Other systems with idealized growth parameters, including constant light, 18 ppt salinity, and temperature at 33 °C, have shown maximum specific growth rates of this species to be much higher, up to 7.9 day−1, based on total carbon in the biomass, when diluted daily and kept at a low density [41]. While it is important to know the maximum growth capacity of a species to understand its productivity under ideal conditions, lab setups do not necessarily reflect performance in larger, outdoor production systems, where cultures frequently demonstrate linear growth [41]. The ability to mimic the actual biomass productivity of outdoor cultivation systems at a laboratory scale (here, 0.5 L) is essential to be able to test a variety of relevant cultivation conditions, in order to identify the best inputs and controls and to enable operational decision making for outdoor experiments.
In order to closely track nutrient uptake by the algae during cultivation, nutrient concentrations in the medium for both N and P were measured daily. To select the lowest nutrient input condition the amount of N taken up under the standard condition was measured. For P. celeri N uptake was found to be 25 ppm N in a three-day grow-out; with this knowledge, 25 ppm N was used as the lowest [N] condition for growth experiments, so that cultures would reach approximately 0 ppm N at the end of the three-day growth period. All other conditions remained replete for N, not reaching 0 ppm (Figure 2C). However, 25 ppm N on two-day grow-outs and all conditions with a starting [N] of ≤40 ppm dropped to <5 ppm N on harvest days, resulting in very few nutrients being left in the media that would go to waste should it not be recycled. That low [N] in the media has been shown in related Picochlorum species to induce accumulation of both carbohydrates and lipids in laboratory flask experiments [19]. Likewise, a [P] of 2.2 ppm was selected for use in the lowest condition, because growth was maintained in the 40 ppm N/2.2 ppm P condition, despite the cultures depleting P within one day.
The concentration of P in the media depleted after just one day of a 2–3 day grow-out at the lowest starting concentration of 2.2 ppm; however, the biomass growth rate was maintained, showing that even with this lack of availability of P in the media, the growth rate was unaffected (Figure 2B,D). Multiple species of microalgae have been shown to take up excess phosphorus when it is available in the environment. During these periods of “luxury uptake”, the cells store the phosphate, primarily in the form of polyphosphate granules, that can be accessed by the cell for use when environmental levels are low [42,43,44]. These phosphate stores allow the cells to continue to grow unimpeded for a period of time after P in the media is depleted, as seen in these experiments. When a culture of P. celeri is growing in P-depleted media and phosphate is added, there is a rapid uptake of the nutrient; the observed P uptake rate was 1.6 ppm P/hour for the first 10 min after addition, 0.27 ppm/hour between 10 min and 4 h, then 0.05 ppm/hour between hours 4 and 24, after which the media P concentration was 0 ppm (Figure S3A,C).
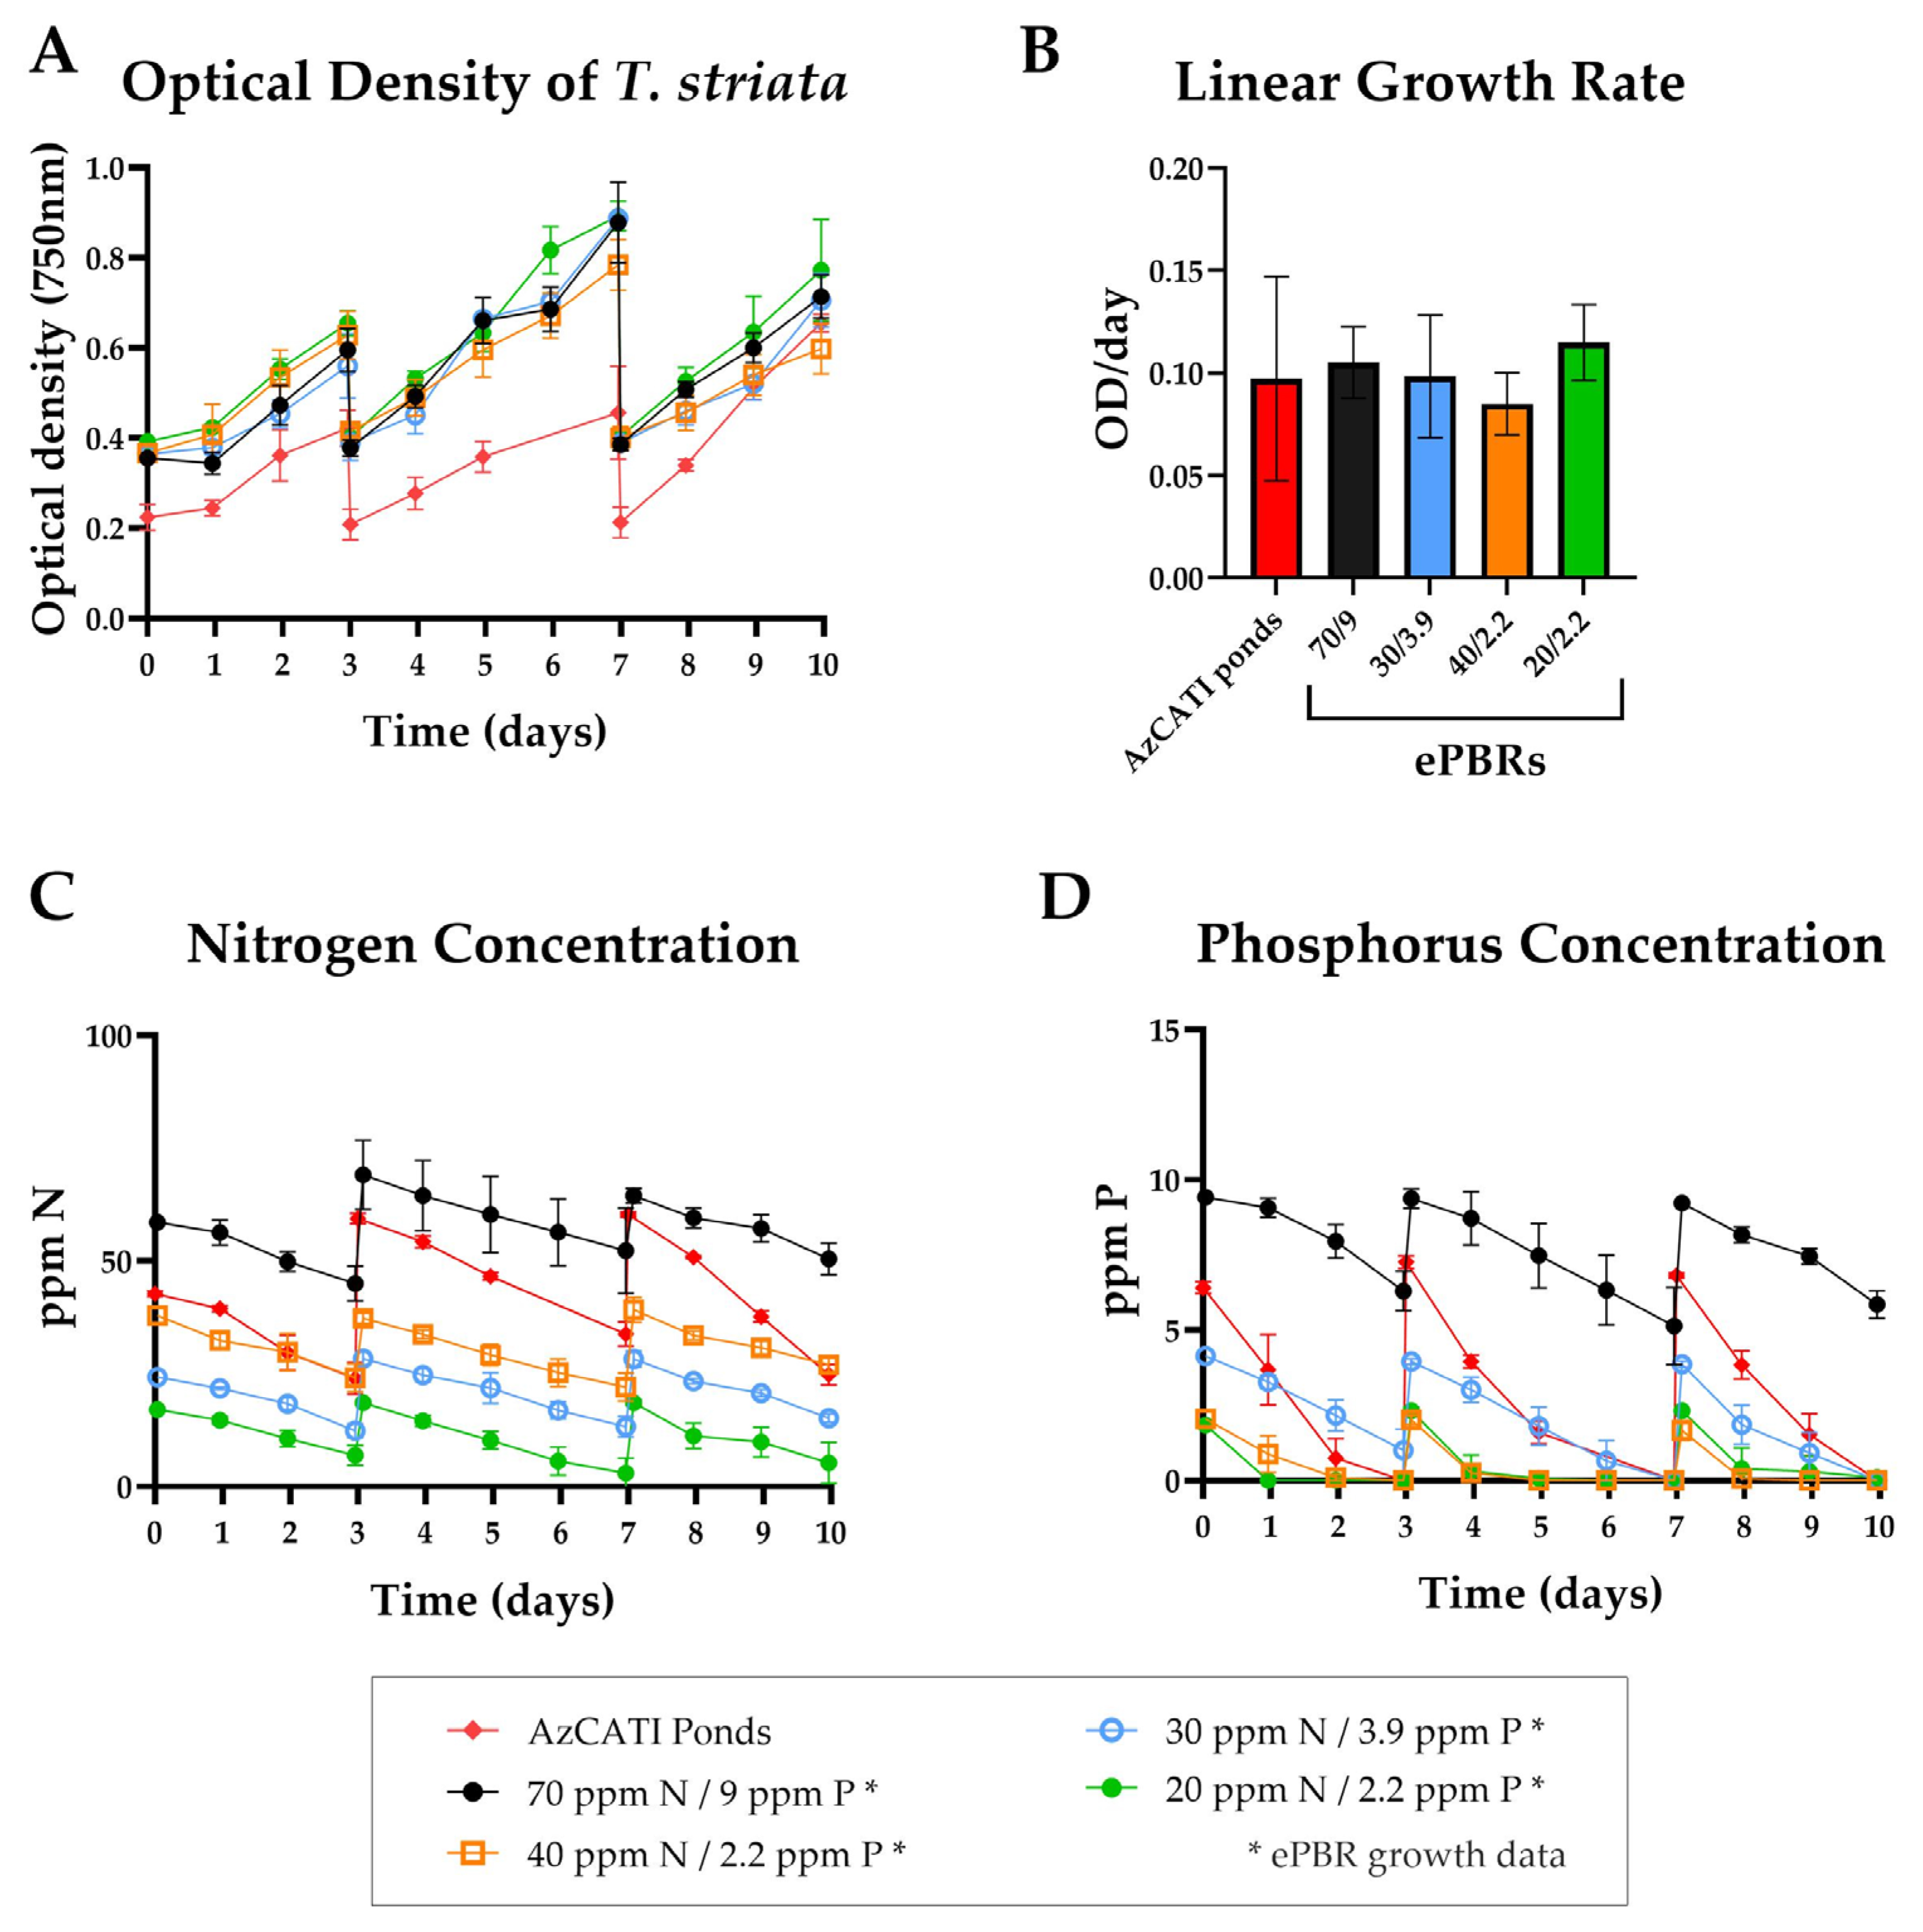
Like P. celeri, T. striata is a top production strain; however, it shows relatively strong productivity in cooler temperatures, and as such is being grown as a cool weather strain [11,28]. Accordingly, a retrospective winter script from January 2022 in Mesa, AZ, was chosen (Figure S1B,D), during which T. striata showed an average daily productivity of 8.6 g/m2/day at AzCATI. During this simulated period in the ePBRs a linear growth rate of 0.09 ± 0.02 OD/day was observed, across conditions, matching that of the linear growth rates observed in the outdoor ponds of 0.10 ± 0.05 OD/day. In addition to colder temperature, the winter season also has lower light intensity and duration, as compared to the summer season, which contributes to lower productivity (Figure S1) [28]. As compared to P. celeri, more variability was seen in the productivity across nutrient conditions in T. striata; however, these differences were not statistically significant and did not follow a particular pattern (Figure 3A,B and Figure S2B). Here again, the ePBRs simulated the productivity of the 4.2 m2 ponds at AzCATI and within the range of tested nutrients, the growth rates of these cultures are maintained, even when provided with much lower starting nutrient inputs.
The lowest nutrient condition tested for T. striata was 20 ppm N and 2.2 ppm P. The N concentration was selected based on the observed nutrient uptake in the standard condition of approximately 20 ppm over the longest growth period of 4 days. The low P concentration was selected after observing that the P depleted without affecting biomass growth at 2.2 ppm in the 40 ppm N/2.2 ppm P condition. For biomass growth under these low-nutrient conditions, a final N concentration of 3.0 ± 3.3 ppm and P depleting in the first 1–2 days was observed (Figure 3C,D). However, even with both these major nutrients dropping to near or at 0 ppm, the cultures maintained their growth rates, relative to the standard.
Both P. celeri and T. striata show robust culture growth across a range of N and P nutrient inputs, including those that are at or near depletion at harvest. These experiments demonstrate that cultures under this type of semi-continuous cultivation regime can thrive and achieve maximum productivity across a wide range of nutrient conditions. Under batch cultivation, where cultures are grown without intermittent dilution, the amount of N and P fed to cultures affects total biomass accumulation as well as altering biochemical composition, with the total cultivation length, starting nutrient and biomass concentrations, and biomass growth rates affecting those end points [19,45,46]. When the nutrients in these batch cultures deplete, biomass productivity is eventually reduced, resulting in productivity loss. Semi-continuous harvesting with carefully controlled nutrient addition at each reset circumvents the loss of biomass growth by limiting the time the culture spends in nutrient deplete conditions, leading to continued biomass productivity.

3.2. Outdoor Raceway Ponds

To determine if the ePBR outcomes from the nutrient management tests translated to a larger scale, both P. celeri and T. striata were cultured in 4.2 m2 (820 L) outdoor raceway ponds at AzCATI. Two concentrations each for N and P were tested: one condition reflective of the standard SOT f/2 outdoor cultivation media and one with reduced N and P inputs, aimed at minimizing the N and P left in the media at each pond harvest to reduce excess nutrient use. When media is not recycled these nutrients would be disposed with the water, wasting this valuable asset. Even when the intention is to recycle the media it may not be able to be recycled continually, or only a percentage might be reused, which would still result in nutrient loss [47]. The conservation of nutrients is essential as efforts continue towards increasing the sustainability of microalgae as a cultivation system from both a cost and environmental standpoint [42,48].
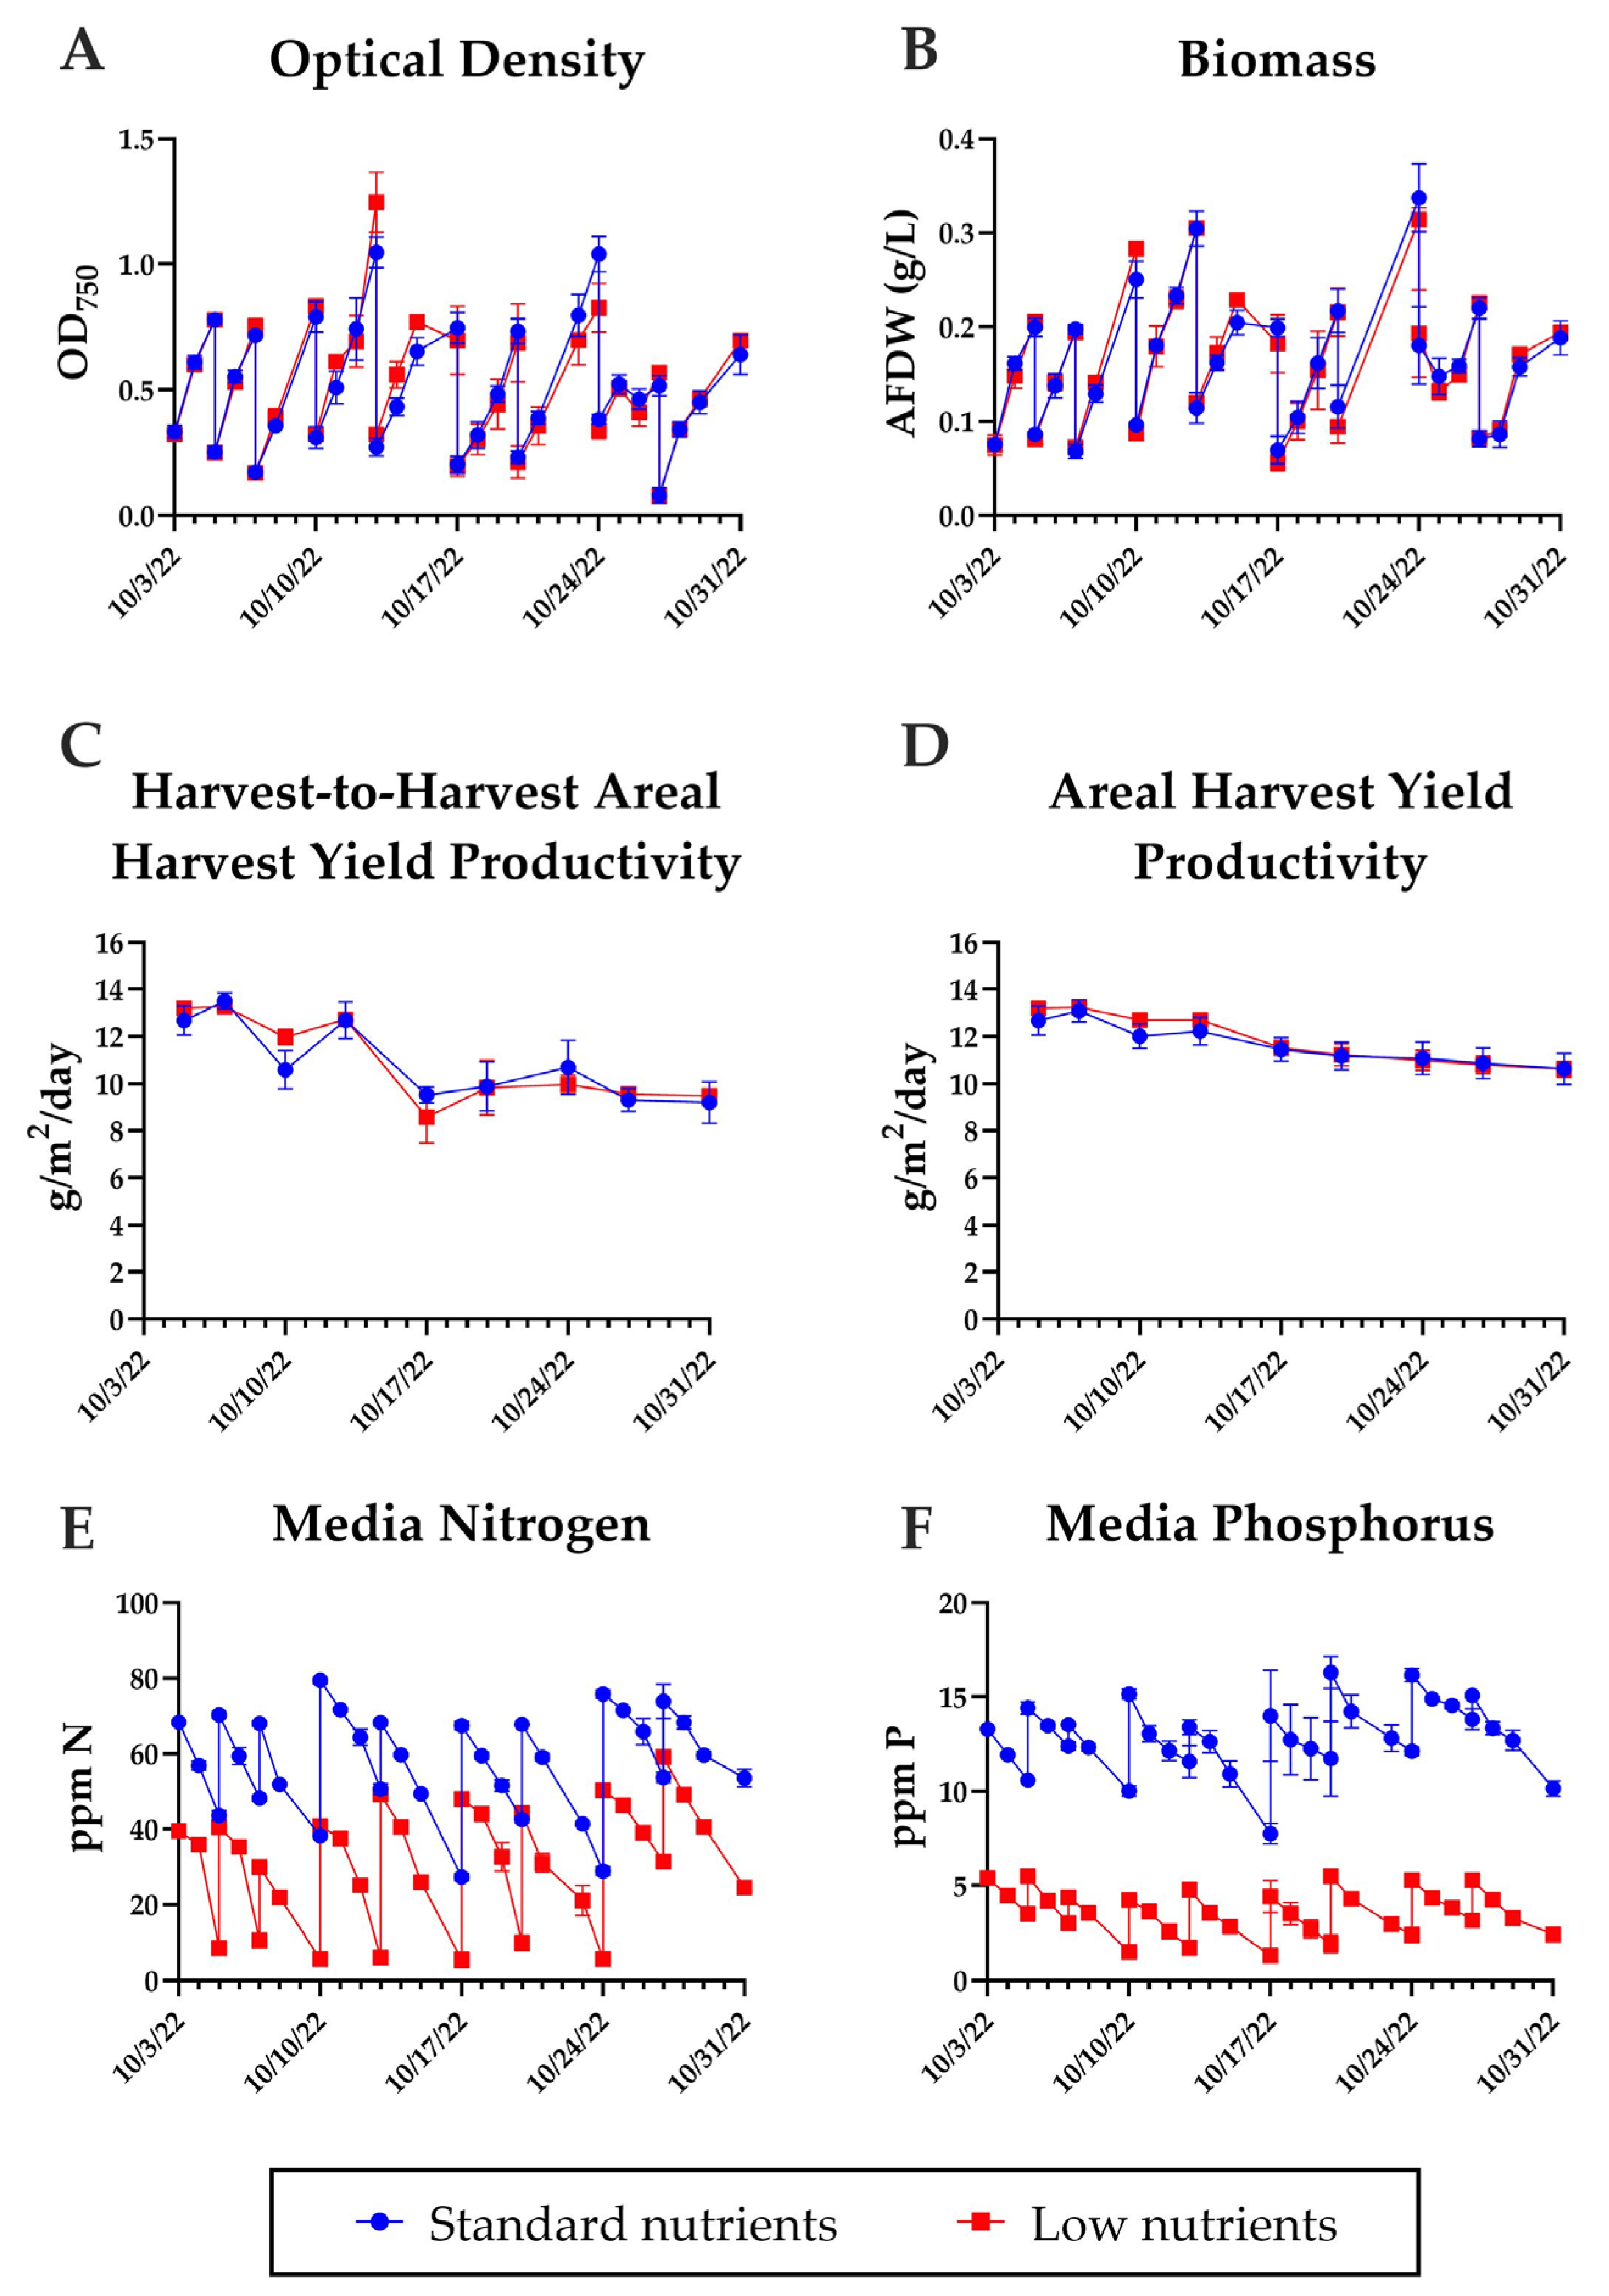
First, the biomass growth of P. celeri was tested in ponds in October of 2022. Cultures were grown for 28 days and managed using a semi-continuous harvesting approach, harvesting and adding fresh media every 2–4 days. During this period biomass growth was tracked daily by OD and AFDW (Figure 4A,B). Throughout this experiment the starting [N] averaged 71 ppm for the standard condition, and 45 ppm for the low condition, with the [P] starting at 15 ppm and 5 ppm, respectively. The AHYP was calculated for each harvest, and productivity declined slightly over the study period as temperature and light decreased (Figure 4C,D and Figure S4A,D). However, the productivity over the course of the experiment between the standard and low-nutrient ponds was the same, at 10.6 ± 0.7 g/m2/day and 10.6 ± 0.3 g/m2/day, respectively. Across all nine growth periods for the 28-day experiment, there was an average of 43 ppm nitrogen left in the standard nutrient ponds at harvest, while the low-nutrient ponds had 12 ppm remaining nitrogen at harvest (Figure 4E). For phosphorus, the standard condition ponds dropped to 11 ppm at harvest and the low-nutrient ponds were measured at 2 ppm (Figure 4F). Between these conditions the low-nutrient ponds had considerably less N and P left in the media at the end of each growth period than the standard approach, which at scale is a significant reduction in excess nutrients in the remaining media.
P. celeri grown with two different starting nutrient concentrations in the media showed consistent growth across conditions. This approach was also tested in T. striata to assess whether similar results are observed across strains. T. striata was tested at standard and low-nutrient concentrations for four weeks in the spring and two weeks in the fall of 2023 (light and temperature, Figure S4B,C,E,F). Cultures at both nutrient conditions were monitored by both OD and AFDW and showed similar growth (Figure 5A–D). AzCATI uses reduced nutrient inputs in the winter, as cultures grow slower during the colder periods. During the first outdoor cultivation period for T. striata, in April 2023, the standard nutrient condition was the lower winter input for the first four growth periods, averaging 40 ppm N and 5 ppm P, and increasing to approximately 65 ppm N and 10 ppm P as the nutrient and growth approach switched to summer conditions. During the spring growth the starting low-nutrient condition averaged 30 ppm N and 4 ppm P across the full growth period (Figure 5E,F). In the middle of the experimental run the uptake of N was inconsistent and outside the bounds of what was expected from previous experimental data, likely from an initially undetected error in the readings; however, the early data showed that the low nutrients were at or close to 0 ppm at harvests (Figure 5E). The P levels consistently depleted by each harvest but were replete for the majority of the growth period (Figure 5F). This resulted in an experimental productivity of 16.6 ± 1.4 g/m2/day for the standard nutrient ponds and 17.4 ± 1.1 g/m2/day for the low-nutrient ponds, which are not significantly different (Figure 5C,D).
The T. striata outdoor experiment was repeated for two weeks in October 2023, but with even lower nutrient inputs in the low condition. Here, a consistent biomass productivity was observed between both the standard and low-nutrient conditions, with an overall productivity of 14.5 ± 0.6 g/m2/day for the standard nutrient ponds and 14.4 ± 0.6 g/m2/day for the low-nutrient ponds (Figure 6A–D). The average starting N concentration in the low-nutrient condition was less than half that of the standard, at 20 ppm, compared to 42 ppm (Figure 6E). For P, the starting standard nutrient concentration was 6 ppm and the calculated addition for the low-nutrient condition was 2.2 ppm; however, these cultures had depleted P the day following nutrient addition and because of the rapid uptake of nutrients “post-addition”, as mentioned above and also shown in Figure S3 in ePBR experiments, an even lower measured starting concentration was observed of ≤1.1 ppm for multiple starting measurements (Figure 6F and Figure S3B,D).
Outdoor raceway pond experiments of both P. celeri and T. striata demonstrated that significantly lower levels of N and P nutrients can be added to ponds while maintaining high growth rates (Table 1). This matches the earlier experiments in ePBRs, further demonstrating the value of this growth system for predicting pond performance.

3.3. Biochemical Composition

The cultures in the low-nutrient condition spend more time in very low, <5 ppm N and <1 ppm P, to nutrient deplete, 0 ppm, conditions, as compared to those with standard nutrient conditions. Nutrient depletion is known to cause biochemical shifts in the biomass, leading to the accumulation of lipids and/or carbohydrates [49]. Thus, to see if there was a difference in the composition of biomass from the AzCATI raceway ponds grown under these varying nutrient inputs, the harvested biomass across the growth periods was measured by GC-FID for lipid, primarily from triacylgycerols (TAGs), converted and measured as FAME, and via colorimetric assay for carbohydrate content [50]. The measured FAME from P. celeri pond samples varied from 3.5 to 6.5% of DW; however, there was not a consistent or significant difference between the nutrient conditions (Figure 7A). All P. celeri ponds showed some variation over time in the carbohydrate content of the cells, varying from 5 to 15% of DW, but this difference in content was across time, not between conditions (Figure 7B). Similar to the P. celeri ponds, there was no consistent significant difference for either carbohydrates or FAME measurements between conditions for the T. striata ponds (Figure 8).
The consistent biomass FAME and carbohydrate composition measurements across the standard and low-nutrient conditions for both P. celeri and T. striata show that, within the applied semi-continuous harvesting approach, the cultures in the low-nutrient condition have not reached the state of nutrient depletion that would induce the accumulation of carbon storage products. The compositional shift in biomass following nutrient depletion is usually seen as an increase in carbohydrate and/or lipid content, as compared to cells growing in nutrient replete media, and the amplitude of this shift increases with increased time after depletion, which is why it is commonly seen in batch cultivation [19,51]. In the DISCOVR strain pipeline screening it was shown that, depending on the season, T. striata had a −7–to-32% increase in FAME and a 113–to-139% increase in carbohydrate content following nutrient depletion, while P. celeri, in summer conditions, showed a 52% increase in FAME and a 184% increase in carbohydrates [49]. The compositional shifts in both T. striata and P. celeri were reported over extended periods of nutrient depletion; however, the changes in rates of that accumulation within the study period are not known. The potential compositional change in these species shows that it is feasible that feeding even lower concentrations of nutrients, or increasing the time between harvests, would create a shift, resulting in changes to the biomass value [19,49,52].

3.4. TEA Outcomes

To determine the effect on biomass production costs of reducing N and P nutrient inputs from the standard, the MBSP at four starting nutrient conditions—70 ppm N/9 ppm P, 30/3.9, 40/2.2, and 20/2.2—was assessed. Experimental data was used and at harvest the higher nutrient concentrations had nutrients remaining in the media while the lowest concentrations had depleted to 0 ppm. These concentrations were combined with media recycling rates of 90%, 50%, and 10%, which indicates the percentage of media from the ponds modeled to be recycled back into cultivation ponds indefinitely. If nutrients remain in the medium at harvest, then those nutrients would be recycled back into the pond for further algae growth or disposed of with the media. A level of 100% media recycling would assume indefinite recycling of the media into new growth ponds. While complete media recycling is ideal from a nutrient management perspective, it may not be practical to implement, since, for example, the recycled media can accumulate compounds that can inhibit algal growth without significant efforts in media cleanup [53].
The results derived for P. celeri and T. striata based on the ePBR data shown in Figure 2 and Figure 3 is presented in Figure 9A and Figure 9B respectively. In view of algae biomass productivity being largely invariant with respect to the nutrient level considered in each experimental run presented herein, this parameter was kept fixed at 32.6 and 8.7 g/m2/day for P. celeri and T. striata, respectively, following the productivities observed in outdoor cultures during the script growth periods at AzCATI. Lower MBSPs were estimated for P. celeri in comparison to T. striata, mainly in view of the higher areal productivity of the former, since areal productivity is often ranked as the main driver of the economic performance of an algae farm [25]. Nutrient requirements are responsible for 13–33% and 4–16% of the total MBSP of P. celeri and T. striata biomass, respectively, with the remainder of costs accounting for the CO2 and electricity requirements, utilities, fixed costs (e.g., labor and maintenance), and capital investment. For either strain, Figure 9 shows a clear reduction in the contribution of N and P towards the MBSP as the initial nutrient concentrations are progressively reduced. Finally, Figure 9 also depicts the influence of recycling spent medium after biomass dewatering on algae farm economics—a metric with significant potential impact in large-scale facilities. As expected, a decrease in the recycling of the media containing leftover nutrients, following biomass dewatering and return to cultivation ponds, entails the need for additional fresh nutrient makeup, thus increasing MBSPs in the process. This occurs independently of the chosen strain, with the impact being more pronounced in scenarios with higher initial and final N and P concentrations. Such insight is an additional value proposition of the nutrient management work detailed in this study: if the recycling of nutrients within the algae farm is subject to substantial uncertainty due to a multitude of factors (such as N and P losses to mineralization and/or volatilization processes or water contamination by pests), then reducing the starting concentration of nutrients in algae cultivation is a safe strategy that ultimately leads to lower biomass production costs. It is noteworthy, however, that such conclusions remain valid as long as the impact on biomass productivity brought by lower nutrient addition to the ponds is kept at a minimum (ideally zero).
Additionally, further context should be given towards current biomass selling prices: in general, these may attain tens or hundreds of U.S. dollars per kilogram, mainly as a function of the production plants having either a small scale or incipient processing technology, or because the main compound of interest in microalgae biomass is a high value one (such as a pigment) [54,55]; projections estimate, however, that microalgae biomass feedstocks should be priced at around $0.50/kg or less for an economic production of microalgal biofuels [55]. The MBSPs shown in Figure 9, while not directly comparable to microalgae biomass prices in the market, are a convenient metric to guide future experimental efforts towards achieving a rational nutrient management practice alongside effective nutrient recycling ratios.

4. Conclusions

The optimal growth of microalgae is essential for maximizing the overall viability of producing algae biomass for biofuels and other products. To do this, it is essential that the cultures receive the nutrients that they require; however, upon scale-up, overfeeding can significantly increase costs. The procurement of ammonia and phosphate, or other sources of N and P, contribute significantly to the cost of biomass production. This work shows that N and P input can be reduced by more than 60% while maintaining the growth and biomass productivity of both P. celeri and T. striata. This work also demonstrates that algae biomass growth in ePBRs translated to outdoor testbed ponds, showing the value of this indoor laboratory system for testing outdoor conditions. The advantages brought by this nutrient management approach were further confirmed by TEA, which found that the economic impact of adding N and P compounds to algae cultivation media can be mitigated either through a reduction in the employed nutrient concentrations or by means of an increase in the recycling of spent medium from biomass dewatering operations back to production ponds.

Supplementary Materials

The following supporting information can be downloaded at: https://www.mdpi.com/article/10.3390/pr14111770/s1, Figure S1: light and temperature plots from ePBR scripts, Figure S2: linear growth rates per growth period in ePBRs, Figure S3: phosphorus uptake following nutrient addition, Figure S4: light and temperature plots from raceway pond cultivation at AzCATI.

Author Contributions

Conceptualization, T.D.; methodology, C.K.S., T.D., B.C.K. and N.S.; software, B.C.K.; validation, C.K.S.; formal analysis, C.K.S., E.Y.Q., B.C.K. and S.L.P.; investigation, C.K.S., E.Y.Q., B.C.K., S.L.P., N.S., J.M. and J.F.; data curation, C.K.S., B.C.K. and J.M.; writing—original draft preparation, C.K.S. and B.C.K.; writing—review and editing, T.D., E.Y.Q., S.L.P., N.S. and J.M.; visualization, C.K.S., E.Y.Q., B.C.K. and S.L.P.; supervision, C.K.S. and T.D.; project administration, C.K.S. and T.D.; funding acquisition, C.K.S., T.D. All authors have read and agreed to the published version of the manuscript.

Funding

This research was funded by the U.S. Department of Energy, Office of Energy Efficiency and Renewable Energy (EERE), specifically the Bioenergy Technologies Office under Annual Operating Plan project NL0038924. This work was authored in part by the National Laboratory of the Rockies (NLR) for the U.S. Department of Energy (DOE) under Contract No. DE-AC36-08GO28308. The views expressed in the article do not necessarily represent the views of the DOE or the U.S. Government. The U.S. Government retains and the publisher, by accepting the article for publication, acknowledges that the U.S. Government retains a nonexclusive, paid-up, irrevocable, worldwide license to publish or reproduce the published form of this work, or allow others to do so, for U.S. Government purposes.

Data Availability Statement

The original contributions presented in this study are included in the article. Further inquiries can be directed to the corresponding author.

Conflicts of Interest

The authors declare no conflicts of interest. The funders had no role in the design of the study; in the collection, analyses, or interpretation of data; in the writing of the manuscript; or in the decision to publish the results.

Abbreviations

The following abbreviations are used in this manuscript:
AFDWash-free dry weight
AHYPareal harvest yield productivity
AzCATIArizona Center for Algae Technology and Innovation
BETOBioenergy Technologies Office
DCFRORdiscounted cash flow rate of return
DISCOVRDevelopment of the Integrated Screening, Cultivar Optimization, and Verification Research Program
DOEUS Department of Energy
DWdry weight
EEREOffice of Energy Efficiency and Renewable Energy
ePBRenvironmental photobioreactor
FAMEfatty acid methyl ester
GC-FIDgas chromatography coupled with flame ionization detection
MBSPminimum biomass selling price
OD750optical density at 750 nm
PARphotosynthetically active radiation
ROreverse osmosis
SOTState of Technology
TAGtriacylglycerol
TEATechno-economic analysis

References

  1. U.S. Department of Energy. 2023 Billion-Ton Report: An Assessment of U.S. Renewable Carbon Resources; Oak Ridge National Laboratory: Oak Ridge, TN, USA, 2024. [CrossRef]
  2. Mousavi-Avval, S.H.; Sahoo, K.; Nepal, P.; Runge, T.; Bergman, R. Environmental Impacts and Techno-Economic Assessments of Biobased Products: A Review. Renew. Sustain. Energy Rev. 2023, 180, 113302. [Google Scholar] [CrossRef]
  3. Atnoorkar, S.; Wiatrowski, M.; Newes, E.; Davis, R.; Peterson, S. Algae to HEFA: Economics and Potential Deployment in the United States. Biofuels Bioprod. Biorefining 2024, 18, 1121–1136. [Google Scholar] [CrossRef]
  4. Klein, B.C.; Chagas, M.F.; Davis, R.E.; Watanabe, M.D.B.; Wiatrowski, M.R.; Morais, E.R.; Laurens, L.M.L. A Systematic Multicriteria-Based Approach to Support Product Portfolio Selection in Microalgae Biorefineries. Chem. Eng. J. 2024, 481, 148462. [Google Scholar] [CrossRef]
  5. Nelson, R.S.; Knoshaug, E.P.; Spiller, R.; Nagle, N.; VanWychen, S.; Wiatrowski, M.; Davis, R.; Pienkos, P.T.; Kruger, J.S. Muconic Acid Production from Algae Hydrolysate as a High-Value Co-Product of an Algae Biorefinery. Algal Res. 2023, 75, 103300. [Google Scholar] [CrossRef]
  6. Kumar, M.; Ansari, N.A.; Gautam, R. Algae Biodiesel as a Alternative Green Fuel: A Futuristic Scope. Clean. Chem. Eng. 2025, 11, 100178. [Google Scholar] [CrossRef]
  7. Manning, S.R. Microalgal Lipids: Biochemistry and Biotechnology. Curr. Opin. Biotechnol. 2022, 74, 1–7. [Google Scholar] [CrossRef] [PubMed]
  8. Chen, W.; Li, T.; Du, S.; Chen, H.; Wang, Q. Microalgal Polyunsaturated Fatty Acids: Hotspots and Production Techniques. Front. Bioeng. Biotechnol. 2023, 11, 1146881. [Google Scholar] [CrossRef]
  9. Wnuk-Fink, K.M.J.; Jaisingh, A.; Hudecek, C.; Halloran, M.W.; Chambers, R.J.; Chan, W.C.; Bruckbauer, A.; Luppi, E.; Chakravarthy, N.A.; Pomeroy, R.S.; et al. Advancing Renewable Materials via Microalgae-Derived Thermoplastic Polyester Polyurethanes. ACS Sustain. Chem. Eng. 2025, 13, 21622–21632. [Google Scholar] [CrossRef]
  10. Klein, B.C.; Davis, R.E.; Laurens, L.M.L. Quantifying the Intrinsic Value of Algal Biomass Based on a Multi-Product Biorefining Strategy. Algal Res. 2023, 72, 103094. [Google Scholar] [CrossRef]
  11. Huesemann, M.; Edmundson, S.; Gao, S.; Negi, S.; Dale, T.; Gutknecht, A.; Daligault, H.E.; Carr, C.K.; Freeman, J.; Kern, T.; et al. DISCOVR Strain Pipeline Screening—Part 1: Maximum Specific Growth Rate as a Function of Temperature and Salinity for 38 Candidate Microalgae for Biofuels Production. Algal Res. 2023, 71, 102996. [Google Scholar] [CrossRef]
  12. Panahi, Y.; Khosroshahi, A.Y.; Sahebkar, A.; Heidari, H.R. Impact of Cultivation Condition and Media Content on Chlorella vulgaris Composition. Adv. Pharm. Bull. 2019, 9, 182–194. [Google Scholar] [CrossRef]
  13. Maltsev, Y.; Kulikovskiy, M.; Maltseva, S. Nitrogen and Phosphorus Stress as a Tool to Induce Lipid Production in Microalgae. Microb. Cell Fact. 2023, 22, 239. [Google Scholar] [CrossRef]
  14. Guillard, R.R.L. Culture of Phytoplankton for Feeding Marine Invertebrates. In Culture of Marine Invertebrate Animals; Springer: Boston, MA, USA, 1975. [Google Scholar] [CrossRef]
  15. Kuo, C.M.; Yang, Y.C.; Zhang, W.X.; Wu, J.X.; Chen, Y.T.; Lin, C.H.; Lin, M.W.; Lin, C.S. A Low-Cost Fertilizer Medium Supplemented with Urea for the Lutein Production of Chlorella sp. and the Ability of the Lutein to Protect Cells against Blue Light Irradiation. Bioengineering 2023, 10, 594. [Google Scholar] [CrossRef] [PubMed]
  16. Yeh, K.-L.; Chang, J.-S. Effects of Cultivation Conditions and Media Composition on Cell Growth and Lipid Productivity of Indigenous Microalga Chlorella vulgaris ESP-31. Bioresour. Technol. 2012, 105, 120–127. [Google Scholar] [CrossRef] [PubMed]
  17. George, B.; Pancha, I.; Desai, C.; Chokshi, K.; Paliwal, C.; Ghosh, T.; Mishra, S. Effects of Different Media Composition, Light Intensity and Photoperiod on Morphology and Physiology of Freshwater Microalgae Ankistrodesmus falcatus—A Potential Strain for Bio-Fuel Production. Bioresour. Technol. 2014, 171, 367–374. [Google Scholar] [CrossRef]
  18. Zhang, B.; Ogden, K. Nitrogen Balances and Impacts on the Algae Cultivation-Extraction-Digestion-Cultivation Process. Algal Res. 2019, 39, 101434. [Google Scholar] [CrossRef]
  19. Gonzalez-Esquer, C.R.; Wright, K.T.; Sudasinghe, N.; Carr, C.K.; Sanders, C.K.; Turmo, A.; Kerfeld, C.A.; Twary, S.N.; Dale, T. Demonstration of the Potential of Picochlorum soloecismus as a Microalgal Platform for the Production of Renewable Fuels. Algal Res. 2019, 43, 101658. [Google Scholar] [CrossRef]
  20. Wiatrowski, M.; Klein, B.; Ngan Do, T.; Ou, L.; Cai, H.; Carlson, N.; Davis, R. Technology Case Study: Techno-Economic and Life Cycle Analysis for Microalgae Conversion Pathways to Fuels and Products; National Renewable Energy Laboratory (NREL): Golden, CO, USA, 2025. [Google Scholar] [CrossRef]
  21. Farooq, W. Sustainable Production of Microalgae Biomass for Biofuel and Chemicals through Recycling of Water and Nutrient within the Biorefinery Context: A Review. GCB Bioenergy 2021, 13, 914–940. [Google Scholar] [CrossRef]
  22. Hoffman, J.; Pate, R.C.; Drennen, T.; Quinn, J.C. Techno-Economic Assessment of Open Microalgae Production Systems. Algal Res. 2017, 23, 51–57. [Google Scholar] [CrossRef]
  23. Banerjee, S.; Ramaswamy, S. Comparison of Productivity and Economic Analysis of Microalgae Cultivation in Open Raceways and Flat Panel Photobioreactor. Bioresour. Technol. Rep. 2019, 8, 100328. [Google Scholar] [CrossRef]
  24. Branco-Vieira, M.; Mata, T.M.; Martins, A.A.; Freitas, M.A.V.; Caetano, N.S. Economic Analysis of Microalgae Biodiesel Production in a Small-Scale Facility. Energy Rep. 2020, 6, 325–332. [Google Scholar] [CrossRef]
  25. Davis, R.; Markham, J.; Kinchin, C.; Grundl, N.; Tan, E.C.D.; Humbird, D. Process Design and Economics for the Production of Algal Biomass: Algal Biomass Production in Open Pond Systems and Processing Through Dewatering for Downstream Conversion; National Renewable Energy Laboratory (NREL): Golden, CO, USA, 2016. [Google Scholar] [CrossRef]
  26. Sánchez-Saavedra, M.P.; Castro-Ochoa, F.Y. Bioprospecting for Lipid Production of Eleven Microalgae Strains for Sustainable Biofuel Production. Bioenergy Res. 2024, 17, 1118–1132. [Google Scholar] [CrossRef]
  27. Singh, V.; Ikram, S.F.; Tripathi, B.N. Exploring the Potential of Freshwater Algal Species for Biofuel Production. Front. Energy Res. 2023, 11, 1271660. [Google Scholar] [CrossRef]
  28. McGowen, J.; Knoshaug, E.P.; Laurens, L.M.L.; Forrester, J. Outdoor Annual Algae Productivity Improvements at the Pre-Pilot Scale through Crop Rotation and Pond Operational Management Strategies. Algal Res. 2023, 70, 102995. [Google Scholar] [CrossRef]
  29. Gao, S.; Edmundson, S.; Huesemann, M.; Gutknecht, A.; Laurens, L.M.L.; Van Wychen, S.; Pittman, K.; Greer, M. DISCOVR Strain Screening Pipeline—Part III: Strain Evaluation in Outdoor Raceway Ponds. Algal Res. 2023, 70, 102990. [Google Scholar] [CrossRef]
  30. McGowen, J.; Knoshaug, E.P.; Laurens, L.M.L.; Dempster, T.A.; Pienkos, P.T.; Wolfrum, E.; Harmon, V.L. The Algae Testbed Public-Private Partnership (ATP3) Framework; Establishment of a National Network of Testbed Sites to Support Sustainable Algae Production. Algal Res. 2017, 25, 168–177. [Google Scholar] [CrossRef]
  31. Knoshaug, E.P.; Wolfrum, E.; Laurens, L.M.L.; Harmon, V.L.; Dempster, T.A.; McGowen, J. Unified Field Studies of the Algae Testbed Public-Private Partnership as the Benchmark for Algae Agronomics. Sci. Data 2018, 5, 180267. [Google Scholar] [CrossRef]
  32. Weissman, J.C.; Likhogrud, M.; Thomas, D.C.; Fang, W.; Karns, D.A.J.; Chung, J.W.; Nielsen, R.; Posewitz, M.C. High-Light Selection Produces a Fast-Growing Picochlorum celeri. Algal Res. 2018, 36, 17–28. [Google Scholar] [CrossRef]
  33. Steadman Tyler, C.R.; Hovde, B.T.; Daligault, H.E.; Zhang, X.L.; Kunde, Y.; Marrone, B.L.; Twary, S.N.; Starkenburg, R. High-Quality Draft Genome Sequence of the Green Alga Tetraselmis striata (Chlorophyta) Generated from PacBio Sequencing. Microbiol. Resour. Announc. 2019, 8, e00780-19. [Google Scholar] [CrossRef]
  34. Lucker, B.F.; Hall, C.C.; Zegarac, R.; Kramer, D.M. The Environmental Photobioreactor (EPBR): An Algal Culturing Platform for Simulating Dynamic Natural Environments. Algal Res. 2014, 6, 242–249. [Google Scholar] [CrossRef]
  35. Loladze, I.; Elser, J.J. The Origins of the Redfield Nitrogen-to-Phosphorus Ratio Are in a Homoeostatic Protein-to-RRNA Ratio. Ecol. Lett. 2011, 14, 244–250. [Google Scholar] [CrossRef] [PubMed]
  36. Tyrrell, T. Redfield Ratio. In Encyclopedia of Ocean Sciences; Elsevier: Amsterdam, The Netherlands, 2001; pp. 2377–2387. [Google Scholar] [CrossRef]
  37. Zhu, C.; Lee, Y. Determination of Biomass Dry Weight of Marine Microalgae. J. Appl. Phycol. 1997, 9, 189–194. [Google Scholar] [CrossRef]
  38. Knoshaug, E.; Laurens, L.; Kinchin, C.; Davis, R. Use of Cultivation Data from the Algae Testbed Public Private Partnership as Utilized in NREL’s Algae State of Technology Assessments; National Renewable Energy Laboratory (NREL): Golden, CO, USA, 2016. [Google Scholar] [CrossRef]
  39. Van Wychen, S.; Ramirez, K.; Laurens, L.M. Determination of Total Lipids as Fatty Acid Methyl Esters (FAME) by In Situ Transesterification: Laboratory Analytical Procedure (LAP); National Renewable Energy Laboratory (NREL): Golden, CO, USA, 2015. [Google Scholar] [CrossRef]
  40. Van Wychen, S.; Laurens, L.M. Determination of Total Carbohydrates in Algal Biomass: Laboratory Analytical Procedure (LAP); National Renewable Energy Laboratory (NREL): Golden, CO, USA, 2016. [Google Scholar] [CrossRef]
  41. Krishnan, A.; Likhogrud, M.; Cano, M.; Edmundson, S.; Melanson, J.B.; Huesemann, M.; McGowen, J.; Weissman, J.C.; Posewitz, M.C. Picochlorum celeri as a Model System for Robust Outdoor Algal Growth in Seawater. Sci. Rep. 2021, 11, 11649. [Google Scholar] [CrossRef]
  42. Solovchenko, A.; Plouviez, M.; Khozin-Goldberg, I. Getting Grip on Phosphorus: Potential of Microalgae as a Vehicle for Sustainable Usage of This Macronutrient. Plants 2024, 13, 1834. [Google Scholar] [CrossRef]
  43. Solovchenko, A.E.; Ismagulova, T.T.; Lukyanov, A.A.; Vasilieva, S.G.; Konyukhov, I.V.; Pogosyan, S.I.; Lobakova, E.S.; Gorelova, O.A. Luxury Phosphorus Uptake in Microalgae. J. Appl. Phycol. 2019, 31, 2755–2770. [Google Scholar] [CrossRef]
  44. Plouviez, M.; Guieysse, B.; Buwalda, O.; Wolmarans, K.; Thånell, K.; Beinik, I.; Tuyishime, J.R.M.; Mitchell, V.; Kappen, P.; Haverkamp, R.G. Phosphorus Storage in Microalgae: STXM and XAS P K-Edge Investigation. ACS Sustain. Resour. Manag. 2024, 1, 1270–1278. [Google Scholar] [CrossRef]
  45. Hsieh, C.H.; Wu, W.T. Cultivation of Microalgae for Oil Production with a Cultivation Strategy of Urea Limitation. Bioresour. Technol. 2009, 100, 3921–3926. [Google Scholar] [CrossRef]
  46. Kumari, K.; Samantaray, S.; Sahoo, D.; Tripathy, B.C. Nitrogen, Phosphorus and High CO2 Modulate Photosynthesis, Biomass and Lipid Production in the Green Alga Chlorella vulgaris. Photosynth. Res. 2021, 148, 17–32. [Google Scholar] [CrossRef]
  47. Arora, N.; Lo, E.; Legall, N.; Philippidis, G.P. A Critical Review of Growth Media Recycling to Enhance the Economics and Sustainability of Algae Cultivation. Energies 2023, 16, 5378. [Google Scholar] [CrossRef]
  48. Illakwahhi, D.T.; Vegi, M.R.; Srivastava, B.B.L. Phosphorus’ Future Insecurity, the Horror of Depletion, and Sustainability Measures. Int. J. Environ. Sci. Technol. 2024, 21, 9265–9280. [Google Scholar] [CrossRef]
  49. Huesemann, M.; Gao, S.; Edmundson, S.; Laurens, L.M.L.; Van Wychen, S.; Beirne, N.; Gutknecht, A.; Kruk, R.; Pittman, K.; Greer, M.; et al. DISCOVR Strain Pipeline Screening—Part II: Winter and Summer Season Areal Productivities and Biomass Compositional Shifts in Climate-Simulation Photobioreactor Cultures. Algal Res. 2023, 70, 102948. [Google Scholar] [CrossRef]
  50. Laurens, L.M.L.; Quinn, M.; Van Wychen, S.; Templeton, D.W.; Wolfrum, E.J. Accurate and Reliable Quantification of Total Microalgal Fuel Potential as Fatty Acid Methyl Esters by In Situ Transesterification. Anal. Bioanal. Chem. 2012, 403, 167–178. [Google Scholar] [CrossRef]
  51. LaPanse, A.J.; Krishnan, A.; Dennis, G.; Karns, D.A.J.; Dahlin, L.R.; Van Wychen, S.; Burch, T.A.; Guarnieri, M.T.; Weissman, J.C.; Posewitz, M.C. Proximate Biomass Characterization of the High Productivity Marine Microalga Picochlorum celeri TG2. Plant Physiol. Biochem. 2024, 207, 108364. [Google Scholar] [CrossRef]
  52. Fattore, N.; Bellan, A.; Pedroletti, L.; Vitulo, N.; Morosinotto, T. Acclimation of Photosynthesis and Lipids Biosynthesis to Prolonged Nitrogen and Phosphorus Limitation in Nannochloropsis gaditana. Algal Res. 2021, 58, 102368. [Google Scholar] [CrossRef]
  53. Jwa, E.; Na, O.S.; Jeung, Y.C.; Jeong, N.; Nam, J.Y.; Lee, S. Recycling of Nutrient Medium to Improve Productivity in Large-Scale Microalgal Culture Using a Hybrid Electrochemical Water Treatment System. Water Res. 2023, 246, 120683. [Google Scholar] [CrossRef] [PubMed]
  54. Araújo, R.; Vázquez Calderón, F.; Sánchez López, J.; Azevedo, I.C.; Bruhn, A.; Fluch, S.; Garcia Tasende, M.; Ghaderiardakani, F.; Ilmjärv, T.; Laurans, M.; et al. Current Status of the Algae Production Industry in Europe: An Emerging Sector of the Blue Bioeconomy. Front. Mar. Sci. 2021, 7, 1247. [Google Scholar] [CrossRef]
  55. Maroušek, J.; Maroušková, A.; Gavurová, B.; Tuček, D.; Strunecký, O. Competitive Algae Biodiesel Depends on Advances in Mass Algae Cultivation. Bioresour. Technol. 2023, 374, 128802. [Google Scholar] [CrossRef] [PubMed]
Figure 1. (A) Algaemetrics environmental photobioreactors (ePBRs), shown operating at a 20 cm culture depth (500 mL). The maximum working depth of the ePBRs is 25 cm (640 mL). (B) Raceway testbed ponds from Commercial Algae Professionals, shown operating at a 20 cm culture depth (820 L). The maximum working depth of the raceways is 30 cm (1230 L).
Processes 14 01770 g001
Figure 2. P. celeri semi-continuous cultivation in ePBRs under a Mesa, AZ, light and temperature retrospective script starting 7 August 2020. (A) Optical density taken at 750 nm; (B) linear growth rate in OD/day across the course of the experiment; (C) media nitrogen concentration over time; (D) media phosphorus concentration over time. Measurements are the mean of 3–4 replicates, except for 140 ppm N/19 ppm P which is 2 replicates; error bars are the standard deviation of the mean.
Processes 14 01770 g002
Figure 3. T. striata semi-continuous cultivation in ePBRs under a Mesa, AZ, light and temperature retrospective script starting 24 January 2022. (A) Optical density taken at 750 nm; (B) linear growth rate OD/day across the course of the experiment; (C) media nitrogen concentration over time; (D) media phosphorus concentration over time. Measurements are the mean of 3–4 replicates, error bars are the standard deviation of the mean.
Processes 14 01770 g003
Figure 4. P. celeri growth in outdoor raceway ponds at AzCATI in Mesa, AZ, conducted in October 2022. (A) Optical density taken at 750 nm; (B) ash-free dry weight; (C) harvest-to-harvest Areal Harvest Yield Productivity (g/m2/day); (D) experimental average Areal Harvest Yield Productivity (g/m2/day); (E) media nitrogen concentration; (F) media phosphorus concentration. Measurements are the mean of 3 replicates; error bars are the standard deviation of the mean.
Processes 14 01770 g004
Figure 5. T. striata growth in outdoor raceway ponds at AzCATI in Mesa, AZ, conducted in April–May 2023. (A) Optical density taken at 750 nm; (B) ash-free dry weight; (C) harvest-to-harvest Areal Harvest Yield Productivity (g/m2/day); (D) experimental average Areal Harvest Yield Productivity (g/m2/day); (E) media nitrogen concentration; (F) media phosphorus concentration. Measurements are the mean of 3 replicates; error bars are the standard deviation of the mean.
Processes 14 01770 g005
Figure 6. T. striata growth in outdoor raceway ponds at AzCATI in Mesa, AZ, conducted in October 2023. (A) Optical density taken at 750 nm; (B) ash-free dry weight; (C) harvest-to-harvest Areal Harvest Yield Productivity (g/m2/day); (D) experimental average Areal Harvest Yield Productivity (g/m2/day); (E) media nitrogen concentration; (F) media phosphorus concentration. Measurements are the mean of 3 replicates; error bars are the standard deviation of the mean.
Processes 14 01770 g006
Figure 7. FAME (converted from lipids, primarily TAGs) and carbohydrate content of P. celeri grown in outdoor raceway ponds at AzCATI in Mesa, AZ, conducted in October 2022. (A) FAME as % DW; (B) carbohydrates as % DW. Measurements are the mean of 3 replicates; error bars are the standard deviation of the mean.
Processes 14 01770 g007
Figure 8. FAME (converted from lipids, primarily TAGs) (A,C) and carbohydrate (B,D) content as % DW of T. striata grown in outdoor raceway ponds at AzCATI in Mesa, AZ, in April–May (A,B) or October (C,D) 2023. Measurements are the mean of 1–3 replicates, error bars are the standard deviation of the mean.
Processes 14 01770 g008
Figure 9. Techno-economic analysis for P. celeri (A) and T. striata (B), considering productivities of 32.6 g/m2/day and 8.7 g/m2/day, respectively, for the standard nutrient condition of 70 ppm N and 9 ppm P, as well as lower nutrient conditions of 30 N/3.9 P, 40 N/2.2 P, 20 N/2.2 P, with media recycling levels of 10%, 50%, and 90% considered.
Processes 14 01770 g009
Table 1. Nutrient inputs and productivity for cultivation of P. celeri and T. striata in outdoor 820 L raceway ponds at AzCATI.
P. celeriT. striata
October 2022Run 1: April–May 2023Run 2: October 2023
Nutrient ConditionStandardLowStandardLowStandardLow
Starting N (ppm)714540 (first 4 growth periods)
65 (remaining)
304220
Starting P (ppm)1555 (first 4 growth periods)
10 (remaining)
462.2 (calculated)
Productivity (g/m2/day)10.6 ± 0.710.6 ± 0.316.6 ± 1.4317.4 ± 1.114.5 ± 0.614.4 ± 0.6
Disclaimer/Publisher’s Note: The statements, opinions and data contained in all publications are solely those of the individual author(s) and contributor(s) and not of MDPI and/or the editor(s). MDPI and/or the editor(s) disclaim responsibility for any injury to people or property resulting from any ideas, methods, instructions or products referred to in the content.