Article

Numerical Simulation of Icing on UHV DC Ground Wires Under the Coupled Effect of Flow Field and Electric Field

1
Electric Power Research Institute, State Grid Anhui Electric Power Co., Ltd., Hefei 230601, China
2
State Grid Anhui Electric Power Co., Ltd., Hefei 230022, China
3
College of Engineering and Technology, Southwest University, Chongqing 400715, China
*
Author to whom correspondence should be addressed.
Processes 2026, 14(11), 1757; https://doi.org/10.3390/pr14111757
Submission received: 24 April 2026 / Revised: 13 May 2026 / Accepted: 26 May 2026 / Published: 28 May 2026
(This article belongs to the Section Energy Systems)

Abstract

Due to their higher installation position and smaller diameter compared to conductors, DC overhead ground wires are more susceptible to severe icing during cold waves. To investigate the icing growth characteristics of ultra-high voltage (UHV) DC ground wires under the coupled effect of flow and electric fields, this study considers the unique operational conditions of UHV DC ground wires. Based on the physical processes of charged droplet motion, flow-around, collision, and freezing around the ground wire, a numerical model for simulating icing under the coupled flow-electric field interaction is established. The influence of factors such as wind speed, droplet size, and icing morphology on icing development under the coupled field is numerically analyzed. Furthermore, observations of icing morphology on UHV ground wires under natural conditions were conducted. The results indicate that under icing conditions, charged droplets of different sizes exhibit significant differences in trajectory deviation during flow-around and collision with the ground wire, with larger droplets being more significantly affected by the electric field force. Under the influence of the electric field, the local droplet collision coefficient on the ground wire surface can increase by 3.4% to 128.9%. Compared to uncharged conditions, icing coverage under charged conditions extends from the windward side to the leeward side, and the icing rate increases accordingly. Natural observations reveal that icing on the ground wire surface under the DC electric field often forms protruding ice tips, which enhance electric field concentration, leading to increased local droplet collision coefficients and icing rates. This, in turn, further promotes the formation of irregular and rough ice accretion. The findings of this study provide technical insights for predicting and simulating icing on UHV DC ground wires.

1. Introduction

The issue of ice accretion on transmission line conductors and ground wires has been a long-standing concern. With global climate change and the rapid development of Ultra-High Voltage (UHV) long-distance power transmission technology, icing disasters on power grids during winter have become increasingly prominent in China. Particularly in remote and inaccessible mountainous regions [1,2,3,4], the rapid growth of ice can lead to wire breakages, damage to line fittings, and tower collapses. These incidents result in power and communication outages, traffic disruption, and significant difficulties in emergency repairs, ultimately leading to immense economic losses and social impact. Following the large-scale grid icing disaster in 2008, domestic universities and research institutions have conducted extensive studies on conductor icing mechanisms and anti-/de-icing methods, achieving several major breakthroughs [5]. However, compared to conductors, ground wires often experience more severe ice accretion under identical environmental conditions. During the freezing weather at the end of 2015, the Jibei Electric Power Company recorded 24 instances of conductor-to-ground wire discharge on 500 kV lines, with four overhead ground wires suffering from ice-induced breakages. Similarly, during the cold waves of 2021–2022, multiple ice-related faults on UHV transmission lines were closely associated with ground wire icing [6]. Despite these observations, research into the icing mechanisms and anti-/de-icing strategies for overhead ground wires continues to face numerous challenges.
Understanding the growth patterns of ice accretion on conductors and ground wires and achieving high-precision predictions are fundamental to proposing effective anti-/de-icing methods. Currently, extensive research has been conducted domestically and internationally on prediction models for transmission line conductor icing, yielding substantial results. Since the icing of both conductors and ground wires results from the combined effects of various environmental conditions and the structural characteristics of the lines, existing conductor icing models provide significant reference value for predicting ground wire icing. Early conductor icing predictions primarily relied on empirical formula fitting. For example, Masoud Farzaneh et al. [7] analyzed field data collected from the Mont Bélair icing test station in Quebec, Canada, statistically examining the correlations between ambient temperature, wind speed, precipitation rate, and icing rate, and proposed a calculation formula for the icing rate. Michał Tomaszewski et al. [8] established an assessment model for conductor icing states and risk levels by analyzing historical meteorological data from Katowice and Krakow, Poland. With the advancement of computer technology and the rise of Computational Fluid Dynamics (CFD), the establishment of icing prediction models began to incorporate physical processes and machine learning. Shunjie Han et al. [9] developed a correlation model between multi-dimensional meteorological data and line icing severity based on the Support Vector Machine (SVM) algorithm. Reda Snaiki et al. [10] utilized feed-forward neural networks, implementing fast line icing prediction through stochastic gradient descent and various meta-heuristic optimization algorithms. However, machine learning-based icing prediction cannot intuitively reveal the underlying growth mechanism of line icing, nor can it precisely evaluate the influence of single factors, such as conductor structure, on icing development. Makkonen proposed a conductor icing calculation model based on the collision, sticking, and accretion coefficients of water droplets, known as the widely applied Makkonen model [11]. Building on this, many scholars have improved and optimized the model. For instance, He Qing et al. [12] proposed a high-precision calculation method for the water droplet accretion coefficient on the bundled conductors; Liang Xidong et al. [13] established a simulation model for conductor icing under time-varying conditions; Wang Qiang et al. [1] optimized the numerical calculation of conductor icing by considering the influence of time-varying meteorological conditions; and Zhu Yongcan et al. [14] developed a calculation model for non-uniform icing on ground wires based on the finite element method, reducing the calculation error for equivalent ice thickness on ground wires.
Most of the aforementioned studies were conducted specifically on conductors and did not consider the influence of electric fields on ice accretion. Compared to conductors, ground wires are installed at higher positions, carry no load current, and have smaller diameters, leading to faster ice development [15]. Research by Yuyao Hu et al. [16,17] found that both the mass and length of ice accretion on insulators under DC electric fields significantly increase compared to those under AC electric fields. Xingbo Han et al. [18] established an insulator icing growth model by coupling the DC electric field; their study demonstrated that the motion of external water droplets is affected by the DC electric field, leading to changes in the collision positions and concentration of droplets on the insulator surface, which in turn increases the icing rate. Conversely, Zhou Chao et al. [19] suggested that during the icing process of DC conductors, some water droplets in the air move away from the conductor due to polarization forces, resulting in a decrease in the droplet collision coefficient on the conductor surface. He Gaohui et al. [20] discovered through corona cage experiments that under a DC electric field, the growth rate of glaze ice pendants on conductors is faster, and the ice morphology suffers from severe distortion. In addition to electric field factors, the smaller diameter of the ground wire is also a key factor affecting its icing growth rate. While studying anti-icing methods for expanded-diameter conductors, Wu Haitao et al. [21] found that under icing conditions, a smaller conductor diameter leads to a larger droplet collision coefficient on the surface and higher icing efficiency. The comparison of previous conductor/ground wire icing models with the present work is shown in Table 1.
To further investigate the comparative characteristics of ice accretion on UHVDC ground wires relative to conductors, and to achieve numerical simulation and prediction based on the combined effects of environmental conditions, structural parameters, and the DC electric field environment, this paper considers the specific operating conditions of UHVDC ground wires. Based on the physical processes of motion, airflow bypass, collision, and freezing of external charged water droplets, a numerical calculation model for ground wire icing under the coupled effect of gas–liquid two-phase flow and electric fields is established. The influence of factors such as wind speed, droplet median volume diameter (Dd), and ice morphology evolution on the development of ground wire icing under the coupled field is numerically analyzed. Furthermore, the proposed icing model is validated through observations of UHV ground wire ice morphology under natural conditions. This study aims to reveal the icing mechanism of ground wires and provide a technical reference for the development of effective anti-/de-icing methods.
The remainder of this paper is organized as follows. Section 2 describes the ±800 kV UHV DC conductor-ground wire system, including the structural parameters and the computational domain for simulation. Section 3 presents the charging and force analysis of supercooled water droplets during the ground wire icing process. Section 4 establishes the flow-electric field coupled calculation model and analyzes the droplet collision coefficients under different conditions. Section 5 presents the numerical calculation model for ground wire icing and discusses the simulation results of ice accretion morphology and icing rates. Section 6 provides field observations of UHV DC ground wire icing to qualitatively validate the proposed model. Finally, Section 7 summarizes the main conclusions of this study.

2. UHVDC Conductor and Ground Wire System

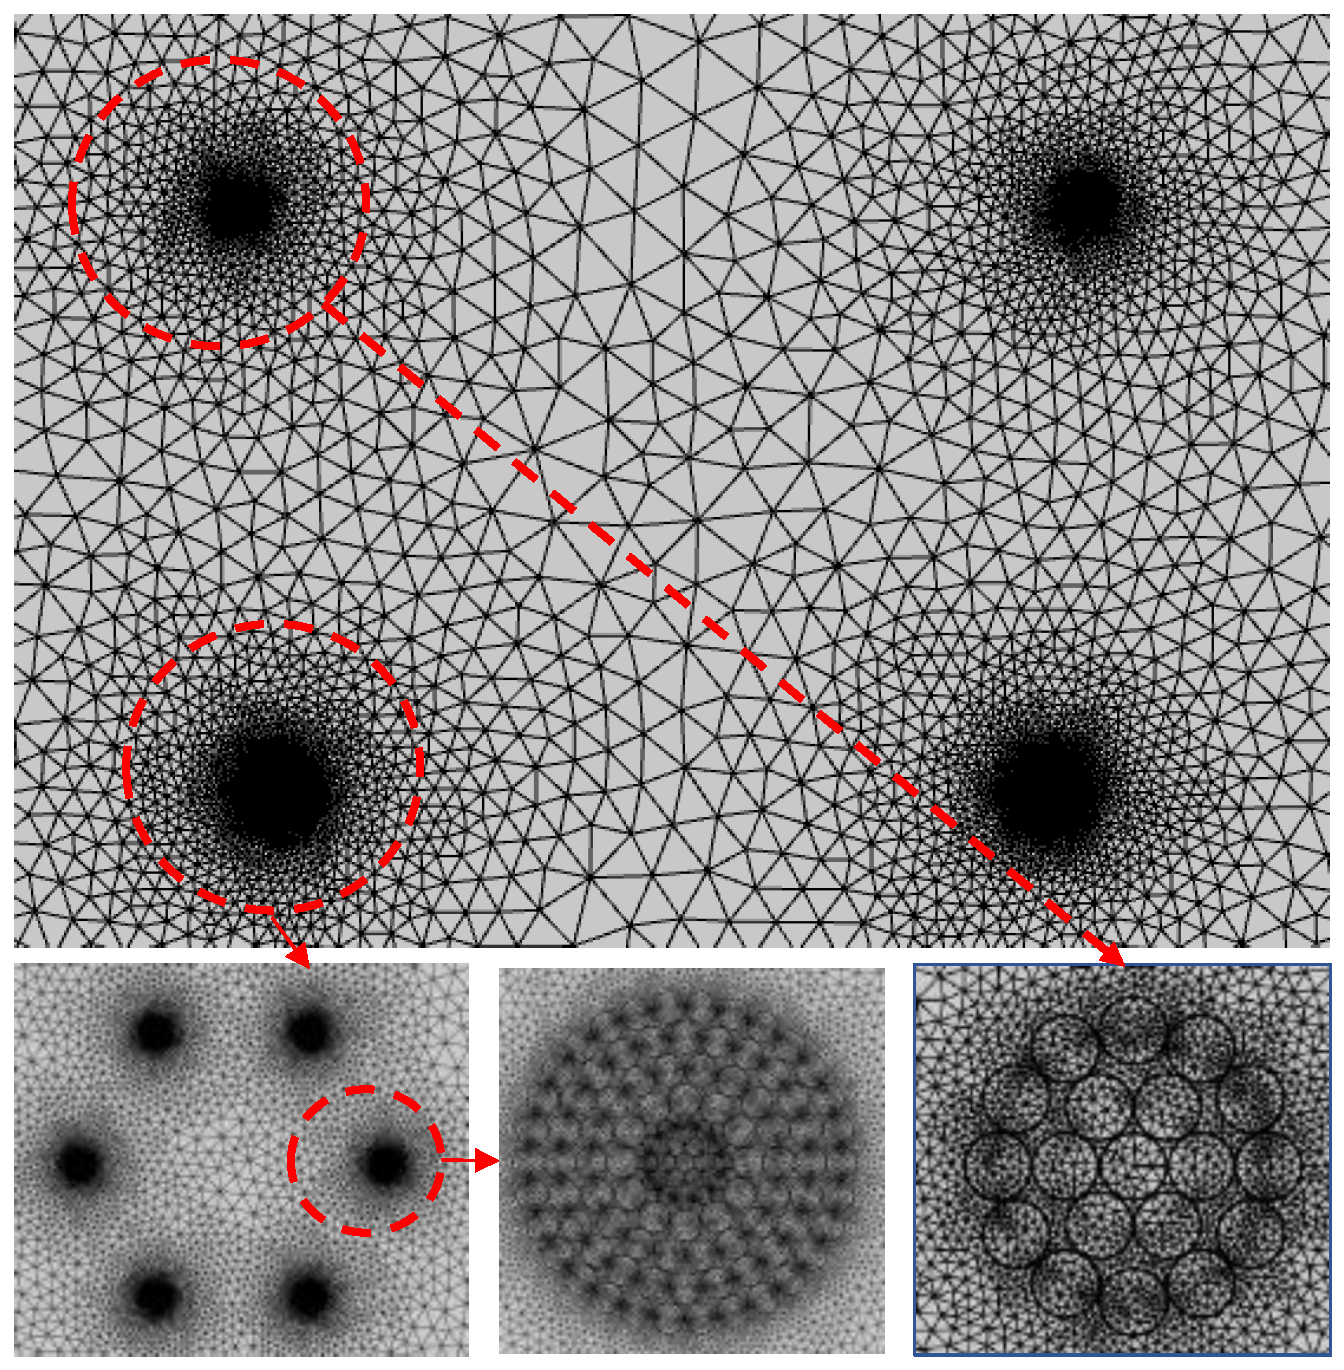
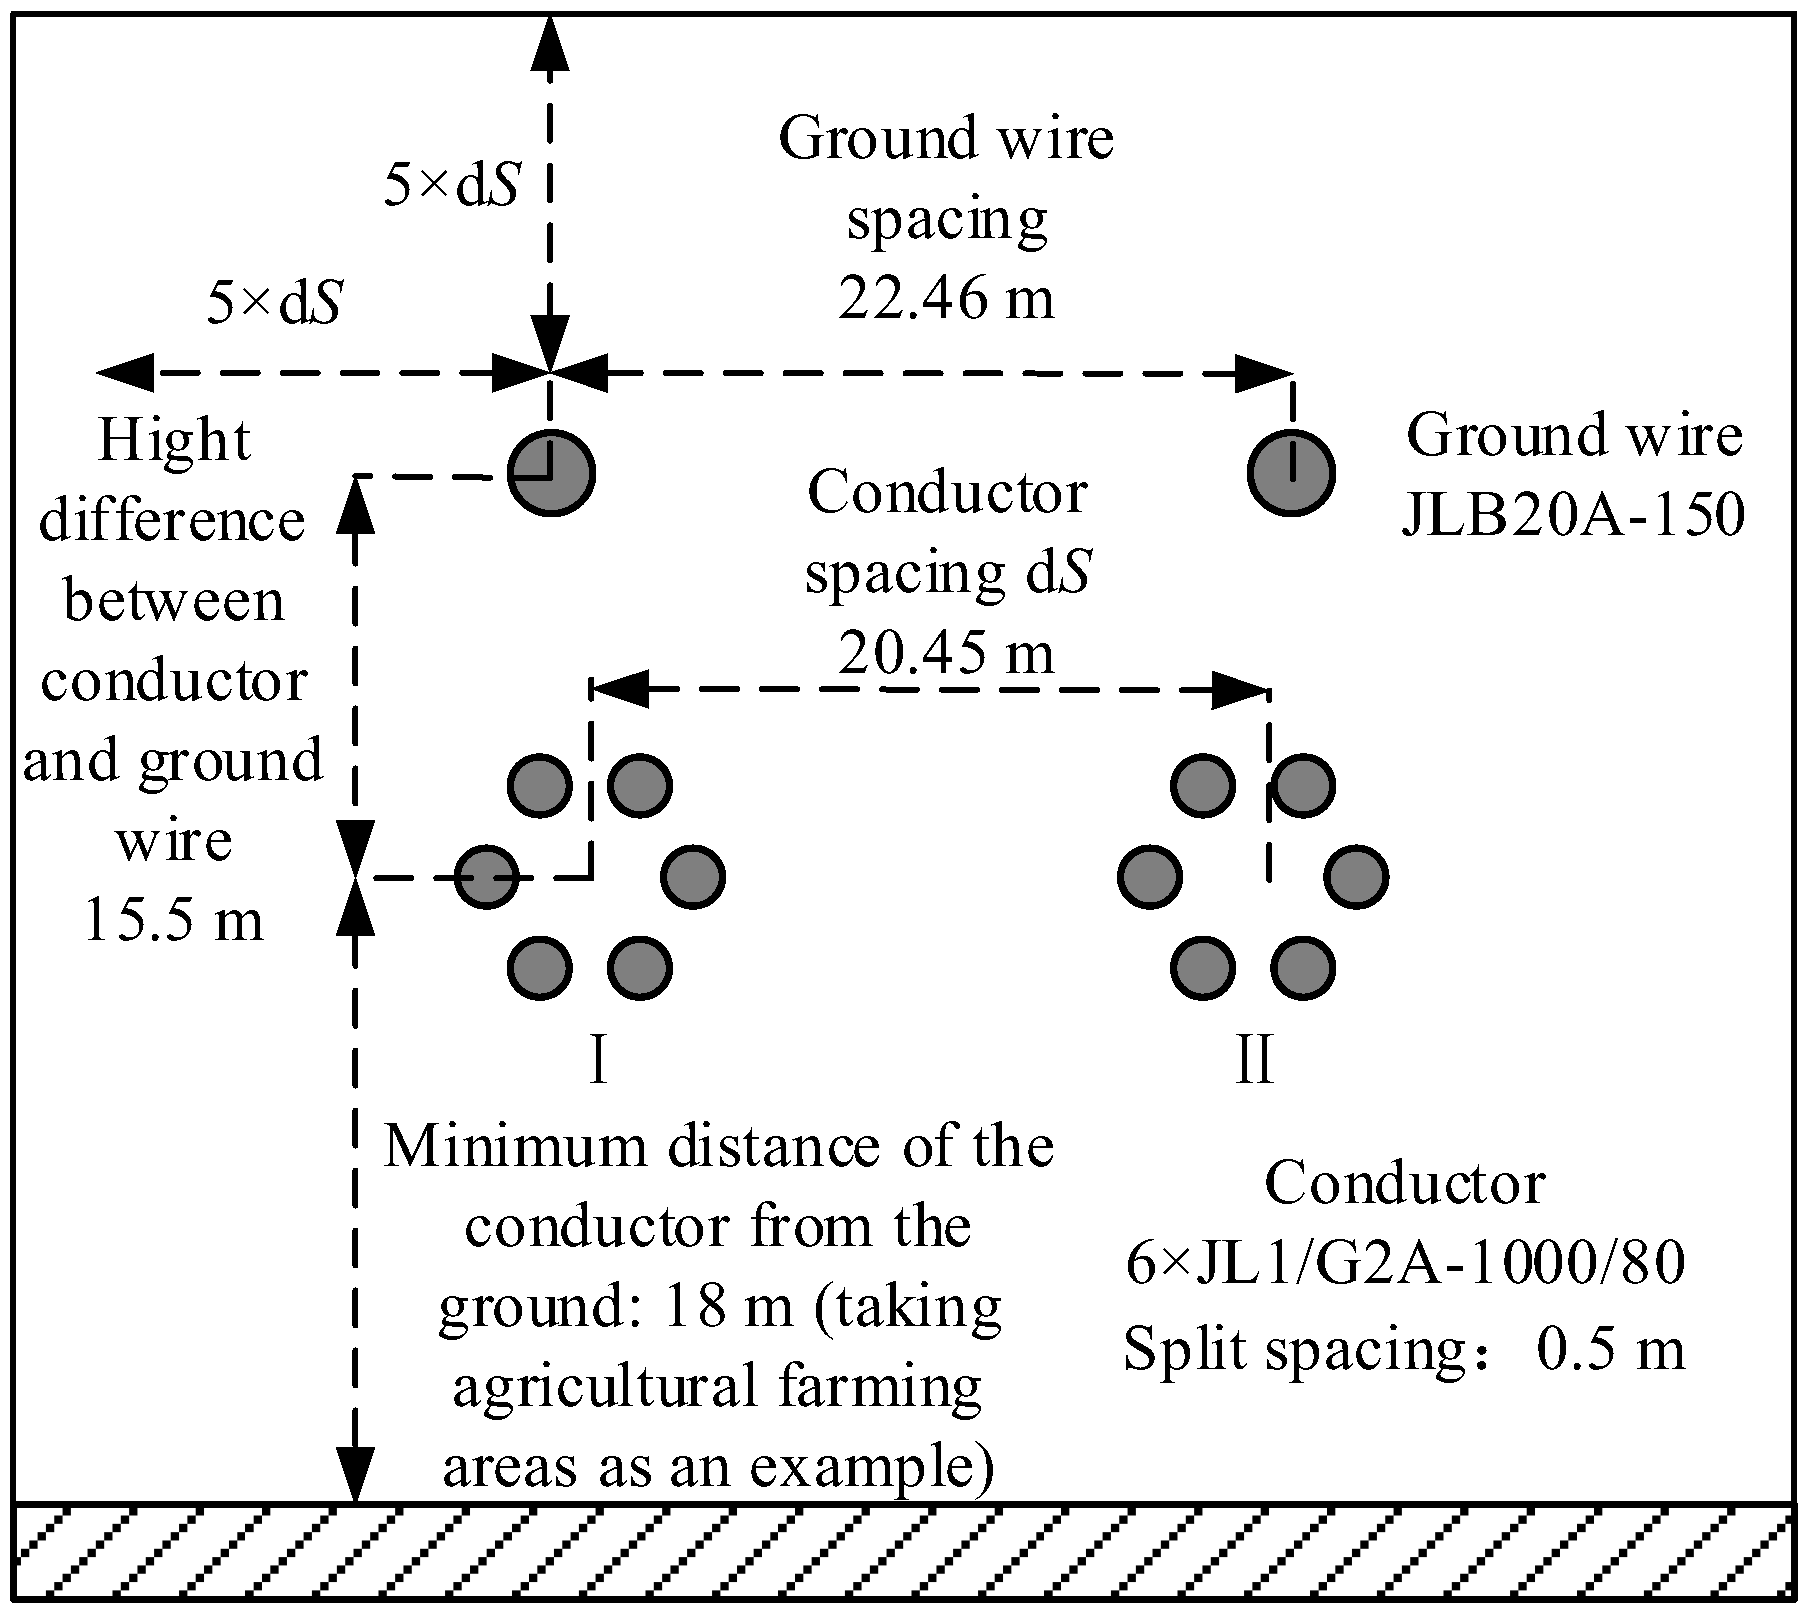
A 2D model of the ±800 kV DC conductor-ground wire system is established. The model focuses on six-bundle bipolar DC conductors; the layout relationship between the conductors and ground wires is illustrated in Figure 1, and their structural parameters are listed in Table 2 and Table 3, including the number and diameter of aluminum strands (abbreviated as Aluminum-strand/mm), the number and diameter of steel strands (abbreviated as Steel-strand/mm), the cross-sectional areas of aluminum, steel, and the total (abbreviated as Aluminum Area/mm2, Steel Area/mm2, and Total Area/mm2, respectively), the outer diameter of the conductor and ground wire (abbreviated as Outer diameter/mm), the installation height above ground of the conductor and ground wire (abbreviated as Height above ground/m), the bundle spacing of the conductor (abbreviated as Bundle spacing/m), and the pole spacing of conductor (abbreviated as Pole spacing/m). Modeling is performed using finite element analysis software, where the geometry is constructed based on the relative spatial relationships and structural dimensions of the conductors and ground wires. The height and width of the external computational domain (the distance from the top and sides of the domain to the ground wires) are set to five times the conductor spacing. The bottom boundary is designed according to the standard height of conductors above the ground in agricultural cultivation areas. Subsequently, the computational domain is meshed, with local mesh refinement applied to the positions of the conductors and ground wires (as shown in Figure 2).

3. Charging and Force Analysis of Supercooled Water Droplets During the Ground Wire Icing Process

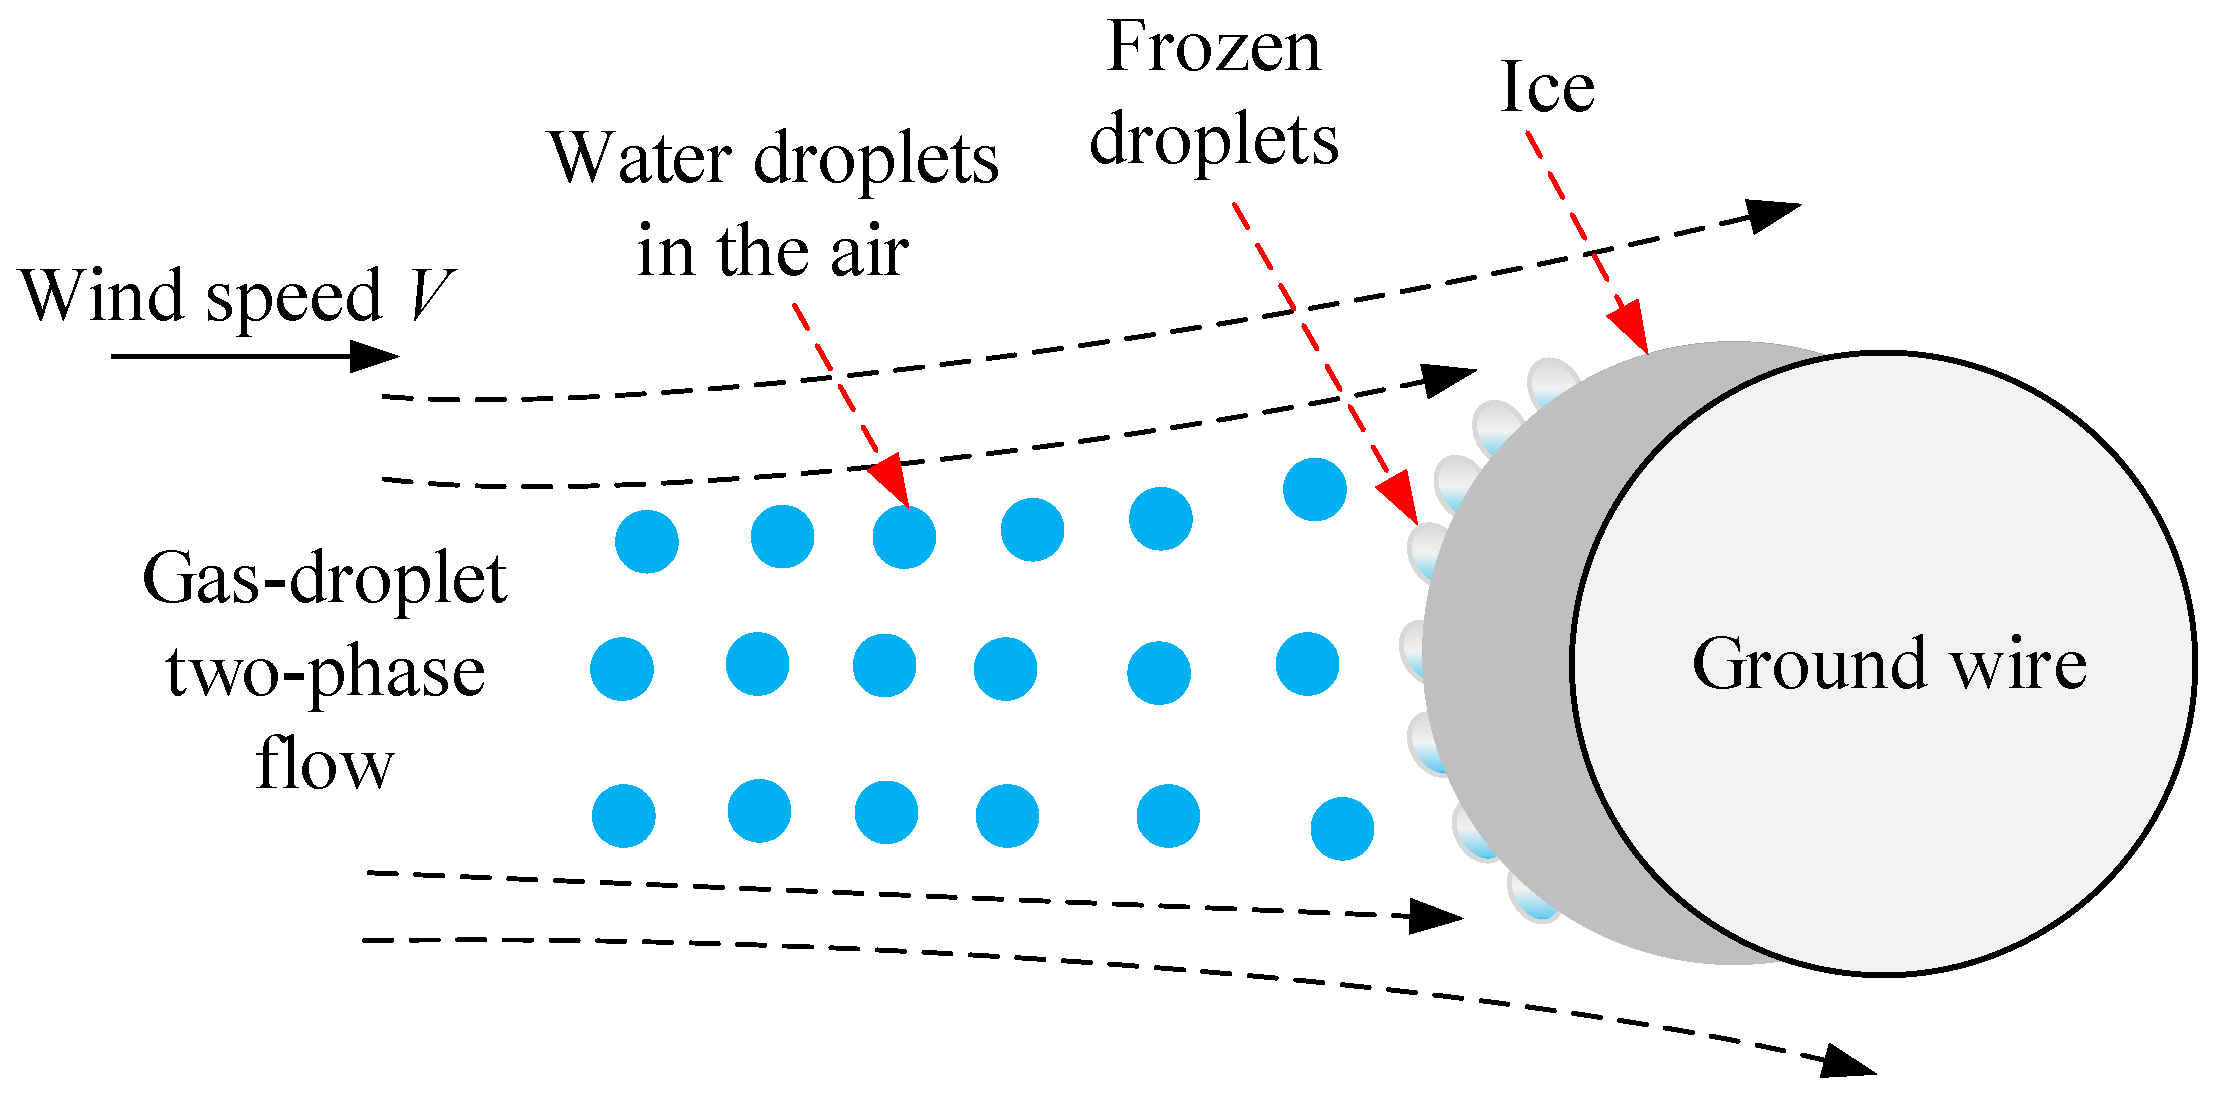
As illustrated in Figure 3, during the icing process of DC ground wires, supercooled water droplets in the air are transported by the airflow from a distance toward the surface of the ground wire. Upon impacting the wire surface, these droplets are captured and frozen into ice accretion. To achieve quantitative calculation and morphological simulation of the ice, it is essential to solve for the collection efficiency of the ground wire for supercooled water droplets. This involves conducting a force analysis on the droplets to determine their trajectories outside the ground wire, as well as their collision positions and the degree of concentration on the wire surface.
Before colliding with the ground wire, water droplets entering the DC electric field along with the airflow are primarily subjected to gravity G, air drag force Fd, electric field force Fe, polarization force Fp, and the Coulomb force between charged droplets Fc. Compared to the electric field force, the magnitude of the Coulomb force between droplets is 4 to 5 orders of magnitude smaller and can thus be neglected [22]. Consequently, the resultant force F acting on a droplet is given by:
F = G + F d + F e + F p
The air drag force exerted on water droplets in the air depends on their velocity relative to the airflow, and the specific calculation formula is as follows:
F d = 1 2 ρ a S w C a u v u v
where ρa is the air density (kg/m3); Sw = πRd2 is the maximum cross-sectional area of the water droplet (m2); Ca is the air drag coefficient; and u and v represent the velocities of the airflow and the water droplet, respectively (m/s).
The electric field force Fe and the polarization force Fp acting on the water droplets can be respectively expressed as:
F e = Q E
F p = M 0 ( E )
where Q is the charge of the water droplet (C); E is the electric field intensity (V/m); and M0 is the dipole moment generated by the water droplet (C·m).

4. Trajectory Tracking and Collision Coefficients of Water Droplets Outside Ground Wires Under Coupled Fields

4.1. Flow-Electric Field Coupled Calculation Model

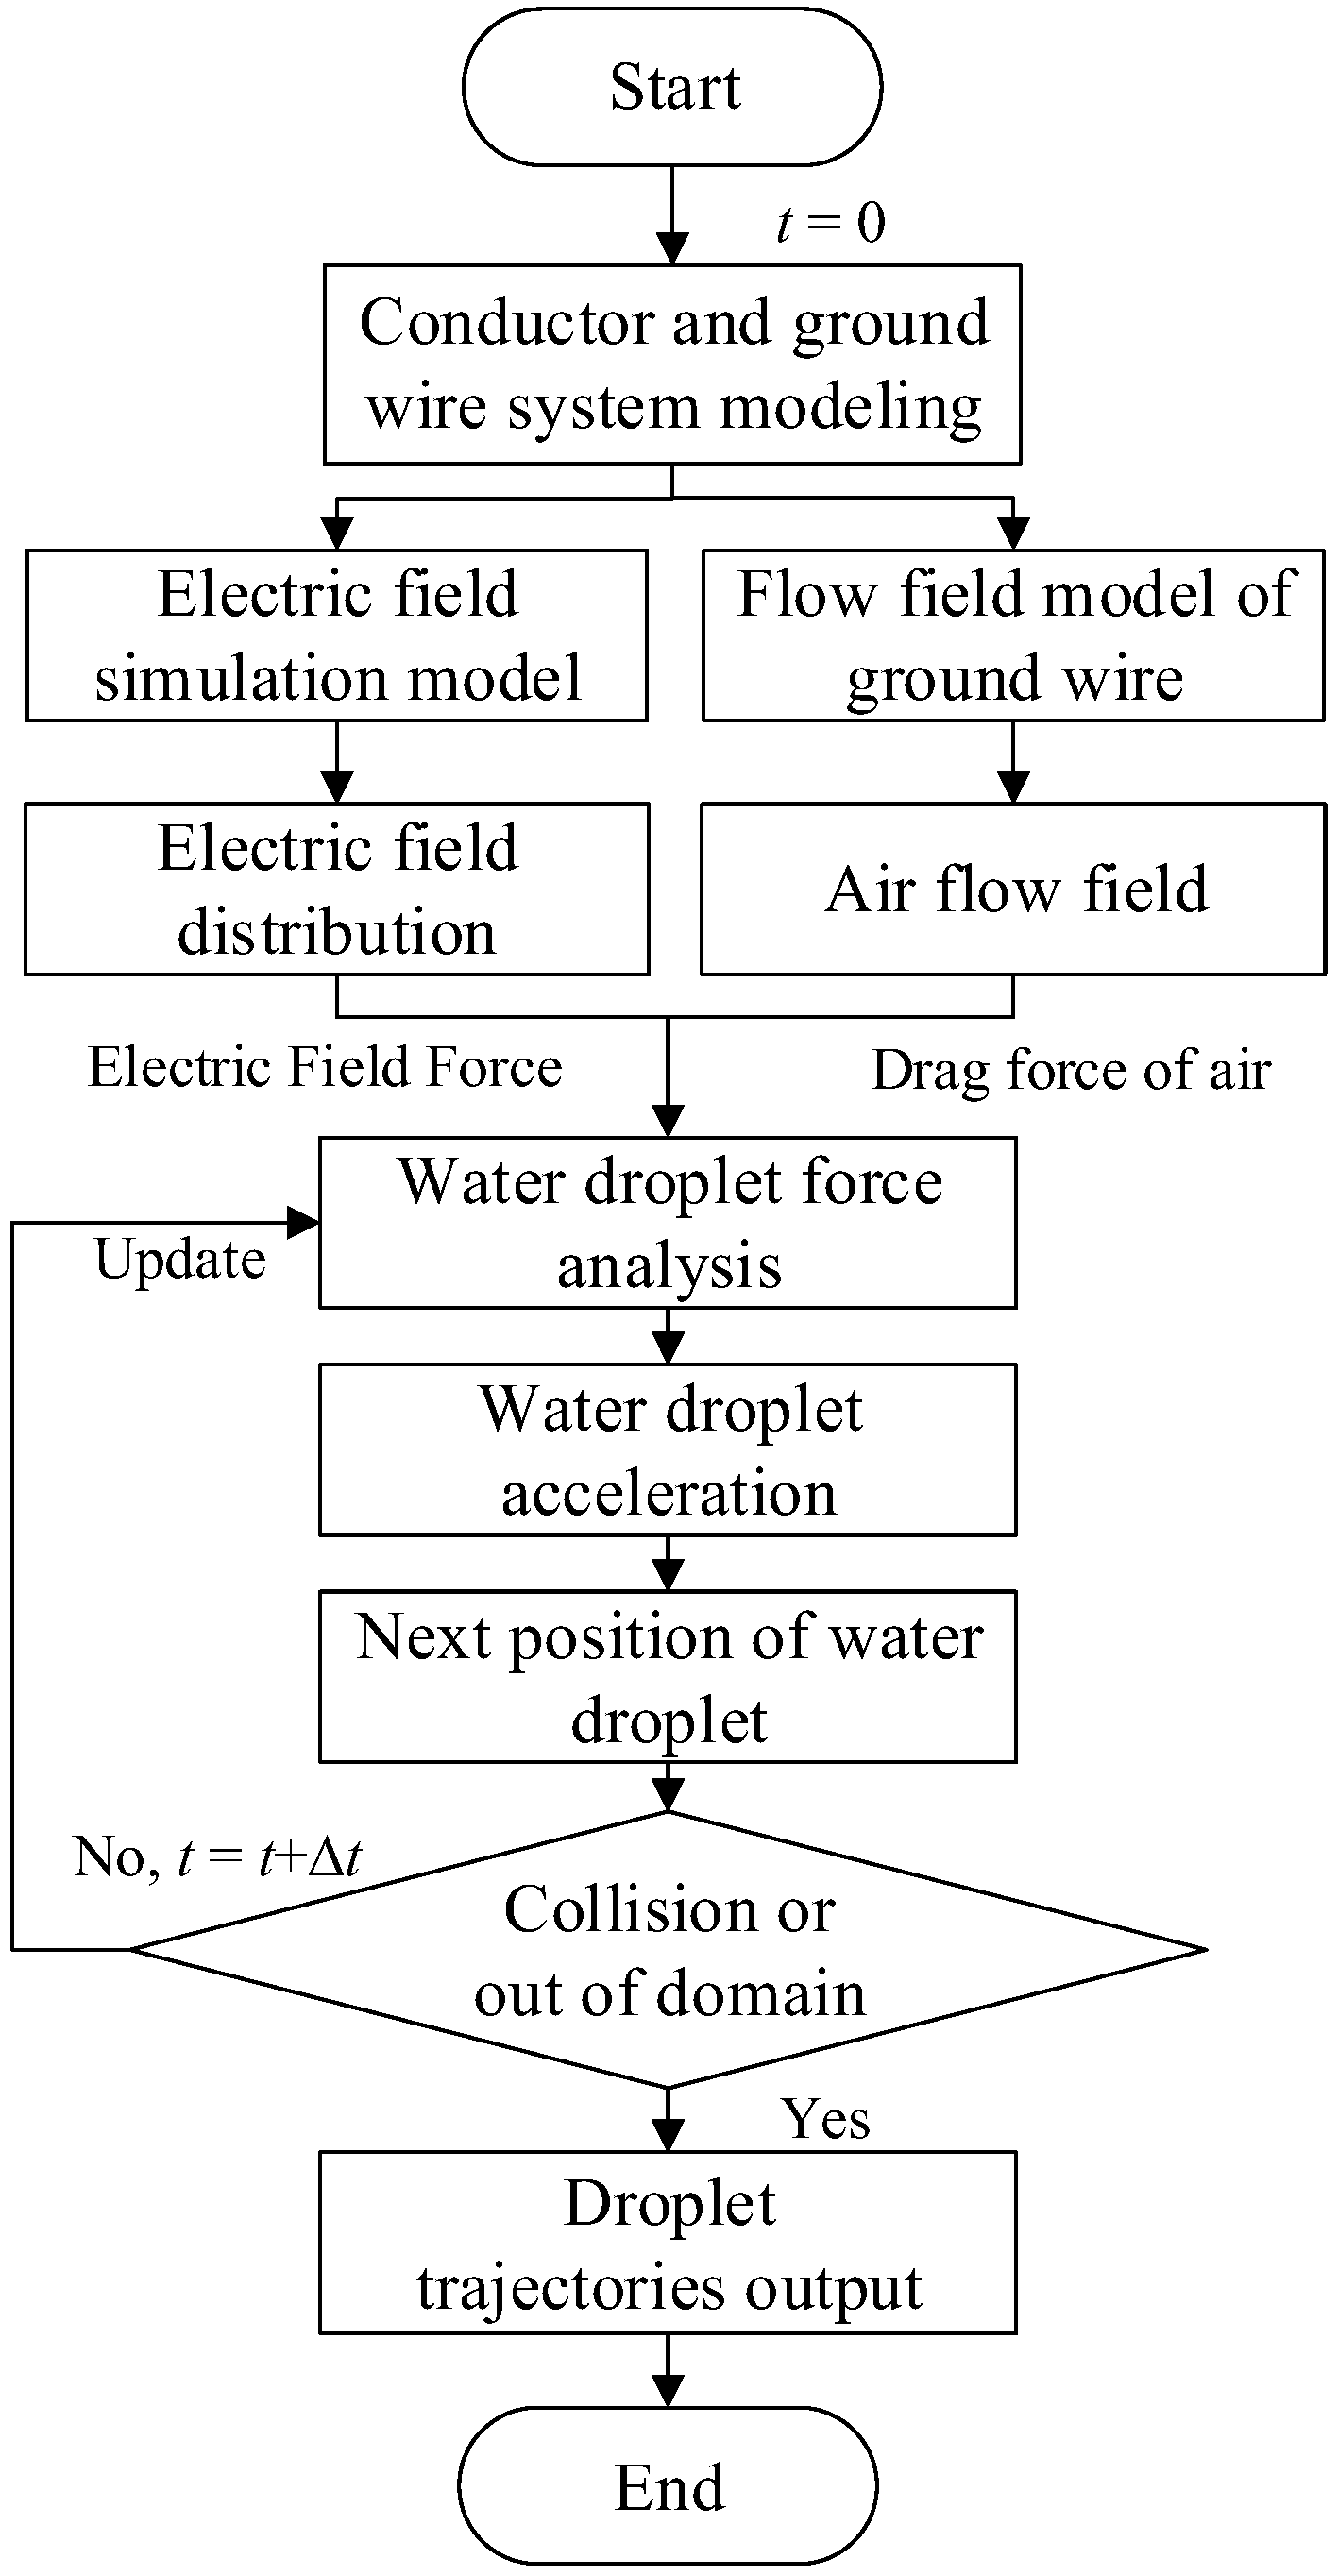
An external flow field calculation model for ground wire icing is established and coupled with the aforementioned electric field simulation model. The electric field simulation results are applied to the water droplet trajectory tracking within the flow field model. Based on the droplet’s real-time position, its charge and the variations in forces acting upon it are updated to calculate the droplet’s acceleration, from which its position at the next time step is derived. Through iterative calculations, the movement trajectories and final collision positions of the water droplets outside the ground wire are obtained; the calculation flowchart is shown in Figure 4. The process begins by setting the initial positions and velocities of water droplets at the inflow boundary of the computational domain. At each time step, the following steps are performed sequentially:
(1)
The flow field around the ground wire is solved to obtain the air velocity distribution.
(2)
The DC electric field distribution (including the effects of the conductor and ground wire voltages) is solved.
(3)
The charge quantity of each water droplet is calculated based on its size and the local electric field intensity.
(4)
The resultant force acting on each droplet (including drag force, electric field force, polarization force, and gravity) is computed using Equations (2)–(4).
(5)
The acceleration, velocity, and position of each droplet are updated using Equation (5).
(6)
The updated droplet position is checked against the ground wire surface: if collision occurs, the collision position and angle are recorded; otherwise, the iteration continues until the droplet exits the computational domain.
The velocity of the water droplet can be updated according to the following equation:
m w d v d t = F d + F e + G
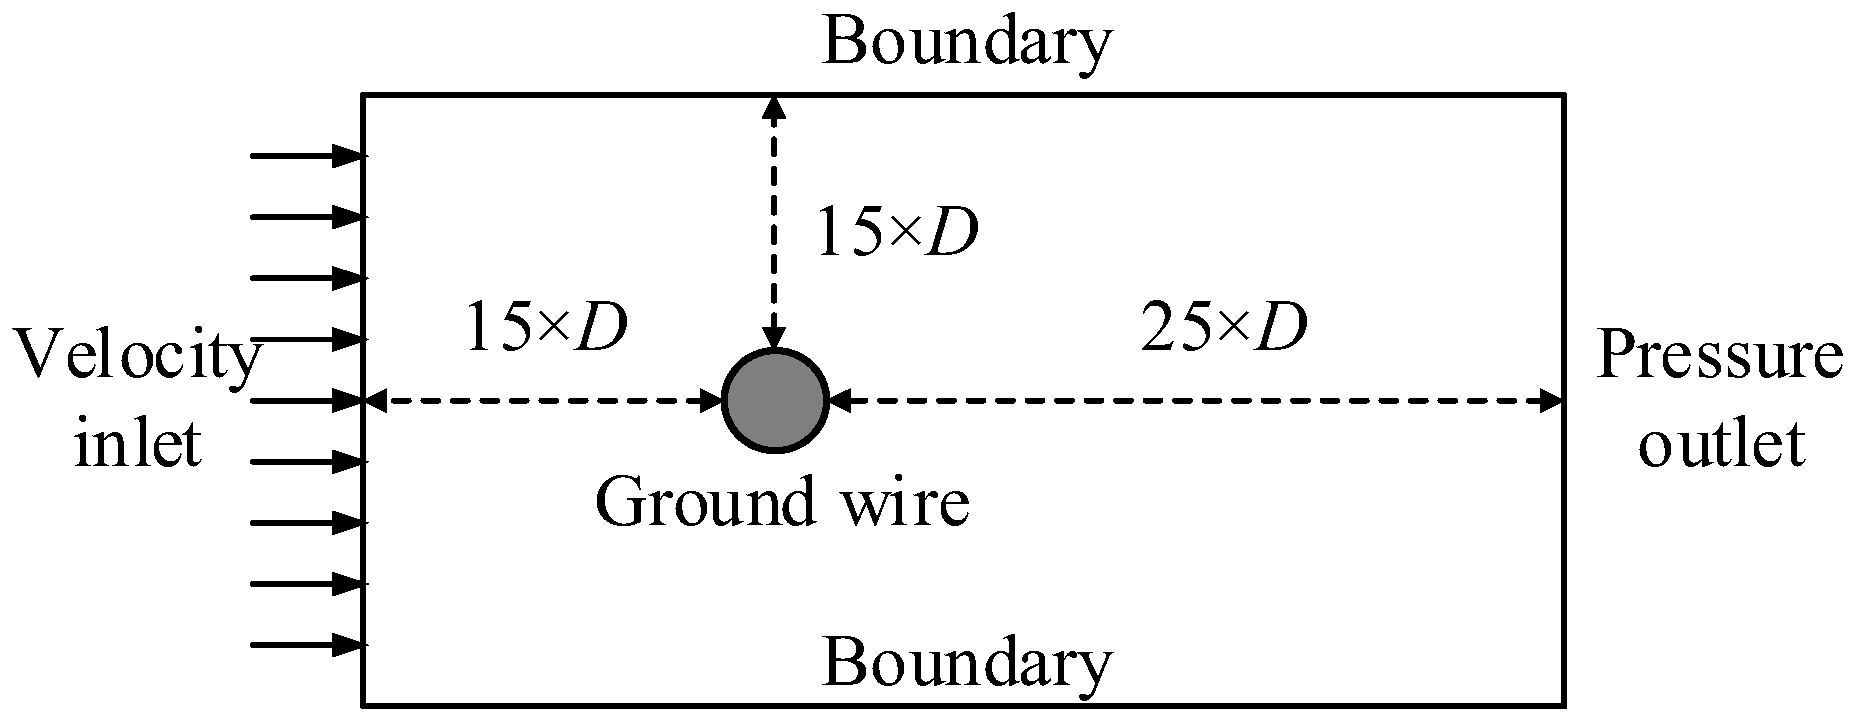
where mw is the mass of the water droplet (kg). It is worth noting that the computational domain for the electric field simulation of the ±800 kV conductor-ground wire system is relatively large. Directly utilizing this domain for the flow field simulation could lead to a rapid increase in computational load, reduced calculation accuracy, and non-convergence. Therefore, a different computational domain is employed in this study for the calculation of the external flow field around the ground wire, as detailed in Figure 5. The external flow field region is designed to be 40D × 30D, where D represents the diameter of the ground wire. Specifically, the flow field inlet is positioned 15D from the ground wire, while the outlet is located 25D away.

4.2. Water Droplet Collision Coefficients on the Ground Wire Surface

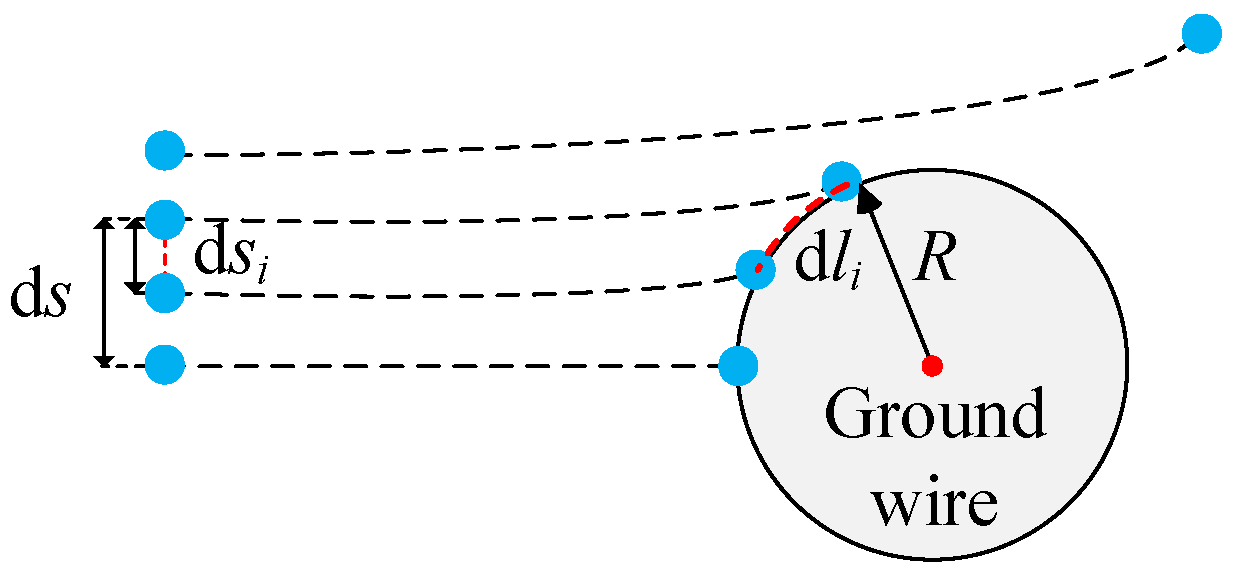
The collection efficiency of supercooled water droplets during the icing process of ground wires can be quantified by the droplet collision coefficient. This is further divided into the overall droplet collision coefficient α1 and the local droplet collision coefficient β1. The former is primarily used for calculating the total icing rate and mass of the ground wire, while the latter is mainly applied to local icing calculations. As shown in Figure 6 [21], these can be calculated based on the concentration of droplet collisions on the ground wire. Assuming that water droplets on the windward side move toward the surface with an equal initial spacing dsi, and the spacing between two adjacent droplets after collision is dli, the local droplet collision coefficient at the central position between these two droplets is β1 = dsi/dli. If the initial spacing between the droplet colliding at the central stagnation point and the one at the outermost edge of one side is ds, then the overall droplet collision coefficient of the ground wire surface is α1= ds/R.
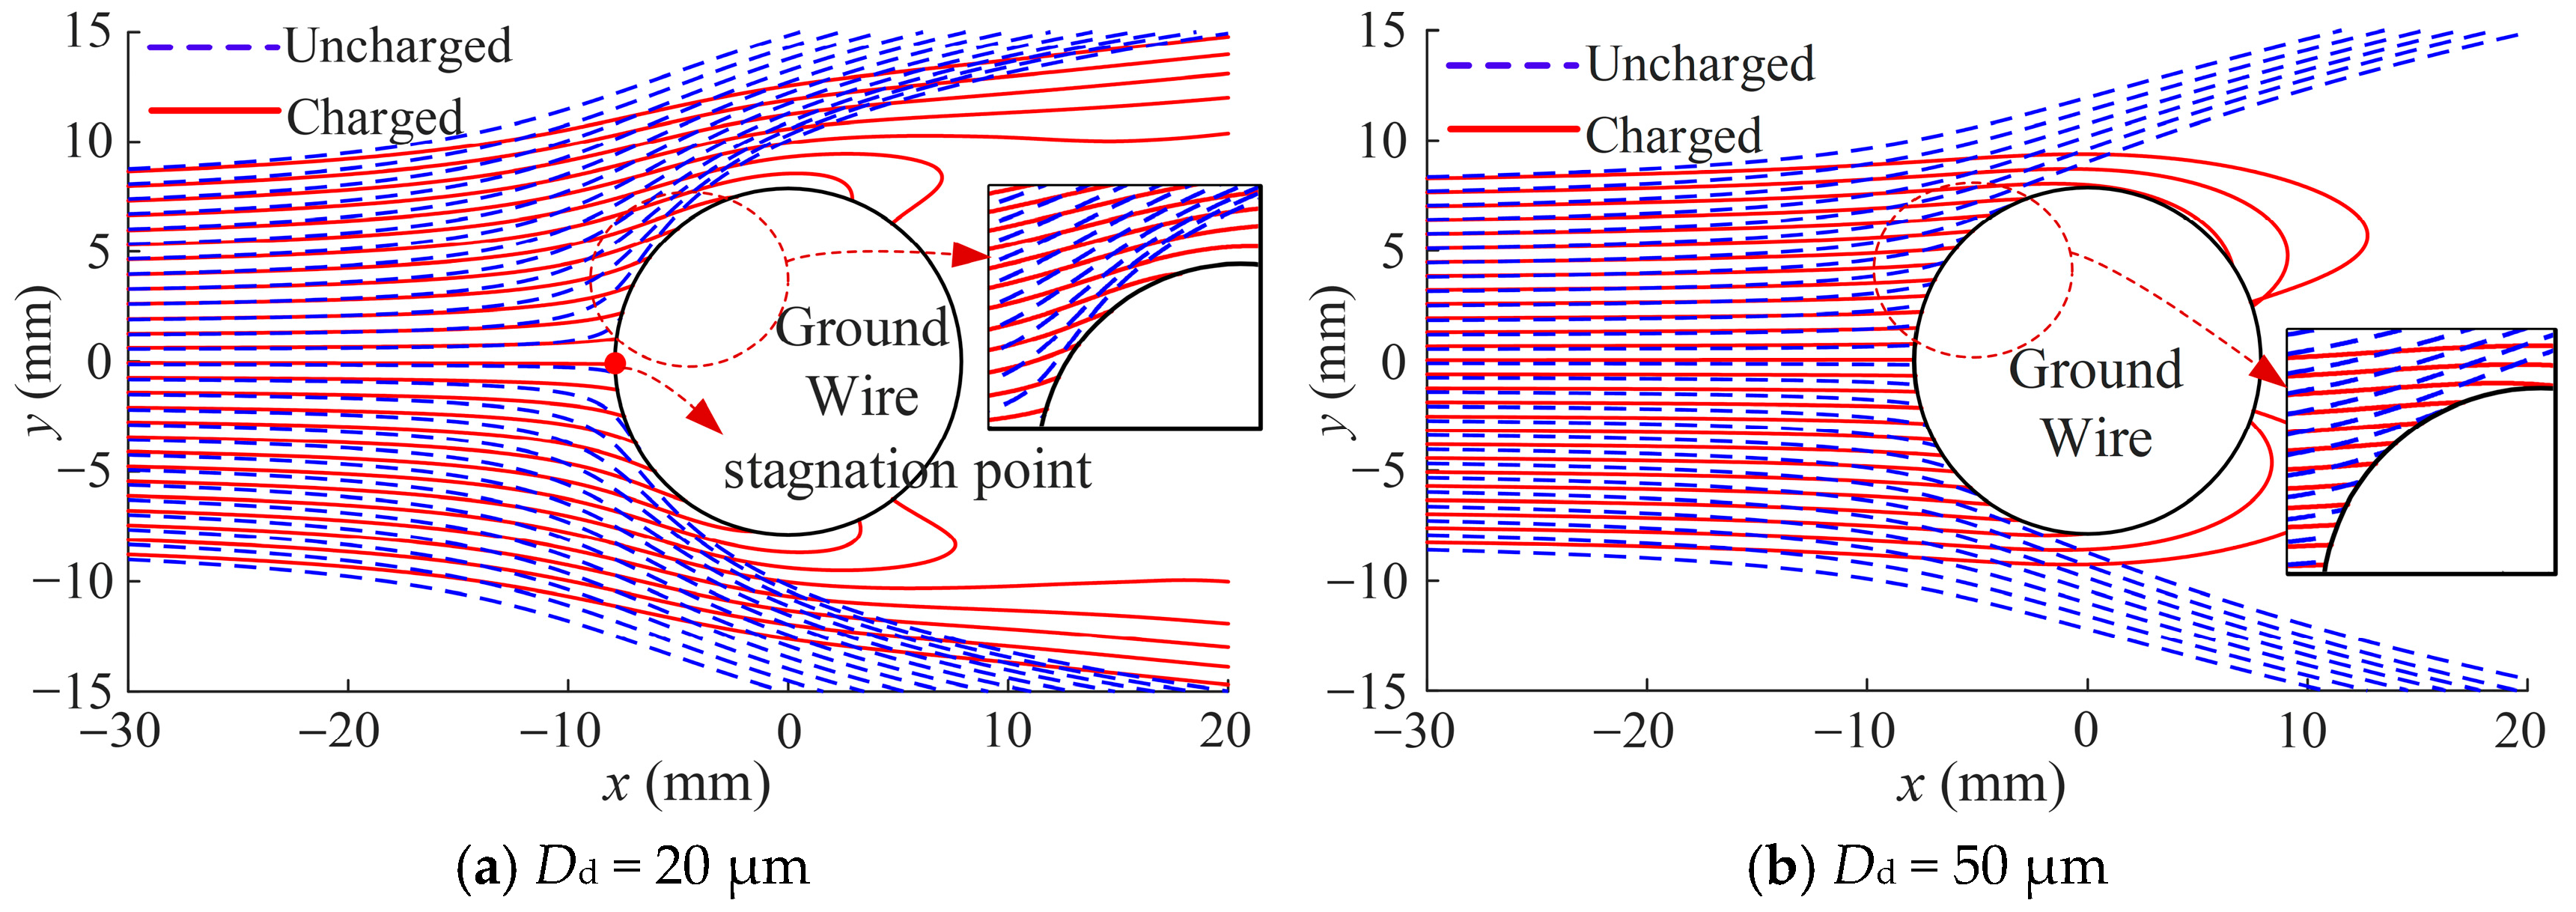
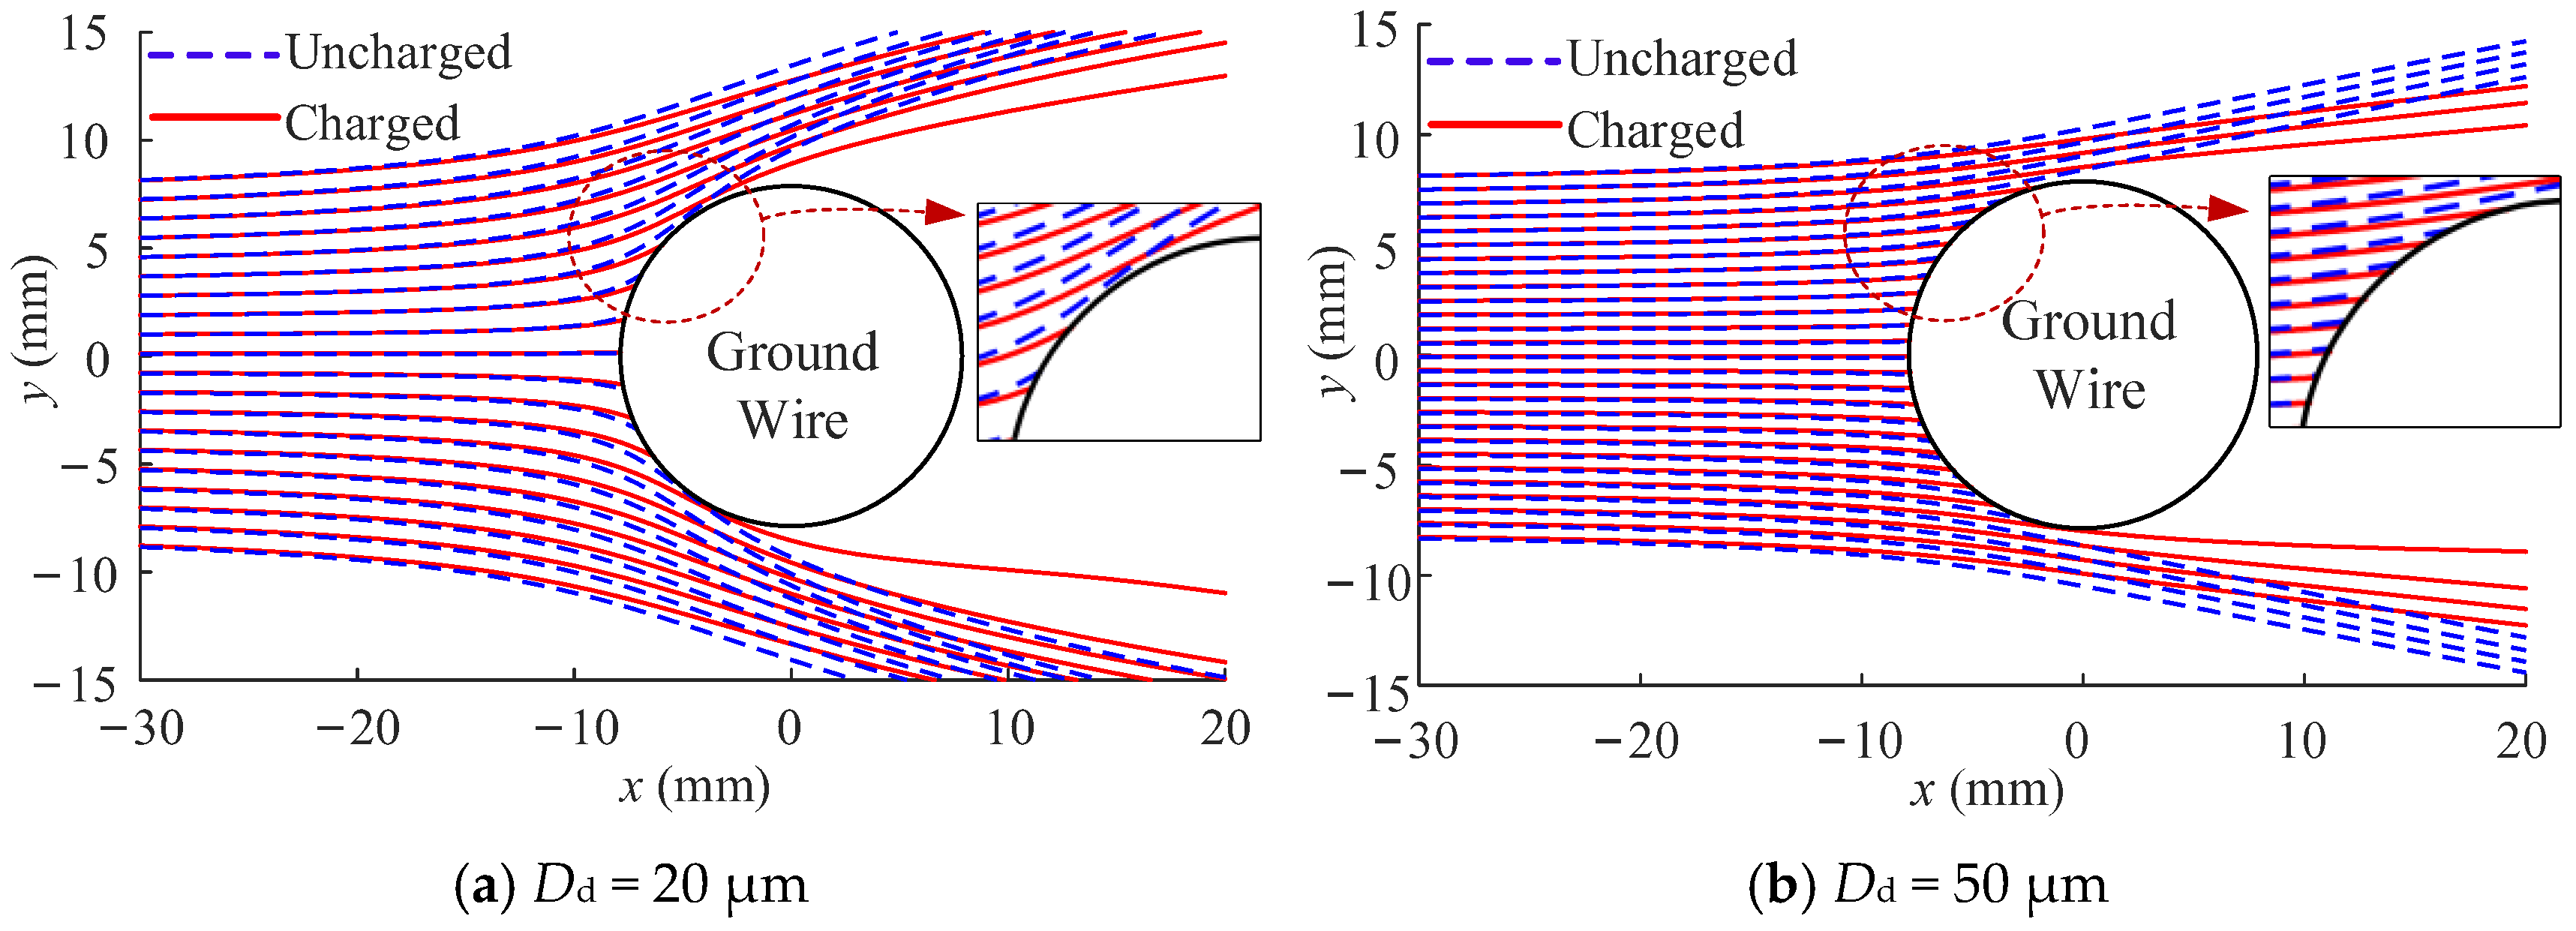
The airflow bypass and collision trajectories of 20 μm and 50 μm water droplets outside the ground wire were calculated under wind speeds of 3 m/s and 8 m/s, respectively; the results are shown in Figure 7 and Figure 8. Under the influence of the electric field force, the trajectories of charged water droplets deviate relative to those of uncharged droplets, altering the original collision quantity and angles. At a low wind speed of 3 m/s, the trajectory deviation of charged water droplets toward the ground wire surface is more pronounced. Larger droplets (50 μm) exhibit a significantly greater deviation than smaller droplets (20 μm), leading to an increased number of collisions. Furthermore, some droplets bypass the wire and collide with the leeward side of the ground wire. This occurs because at lower wind speeds, the inertia of the water droplets is weaker, and the air drag force Fd and electric field force Fe dominate the degree of trajectory deviation. When the droplet diameter is small, the charge quantity is low, resulting in a smaller Fe. Consequently, the droplets move primarily under the dominance of Fd, and the trajectory deviation of charged droplets is relatively minor. As the droplet diameter increases, both the charge quantity and Fe increase, enhancing the influence of the electric field force and leading to a greater degree of trajectory deviation.
Compared to the low wind speed case, the degree of trajectory deviation for charged water droplets is weakened at a wind speed of V = 8 m/s. However, the deviation for small droplets (20 μm) is more pronounced than that for large droplets 50 μm), which is the opposite of the trend observed under low wind speed conditions. This phenomenon can be attributed to the fact that at high wind speeds, droplet inertia becomes the dominant factor governing the trajectory, while air drag force and electric field force become secondary factors. Consequently, a significant trajectory deviation is only observable when the droplet diameter is reduced—specifically, when the droplet inertia is lower.
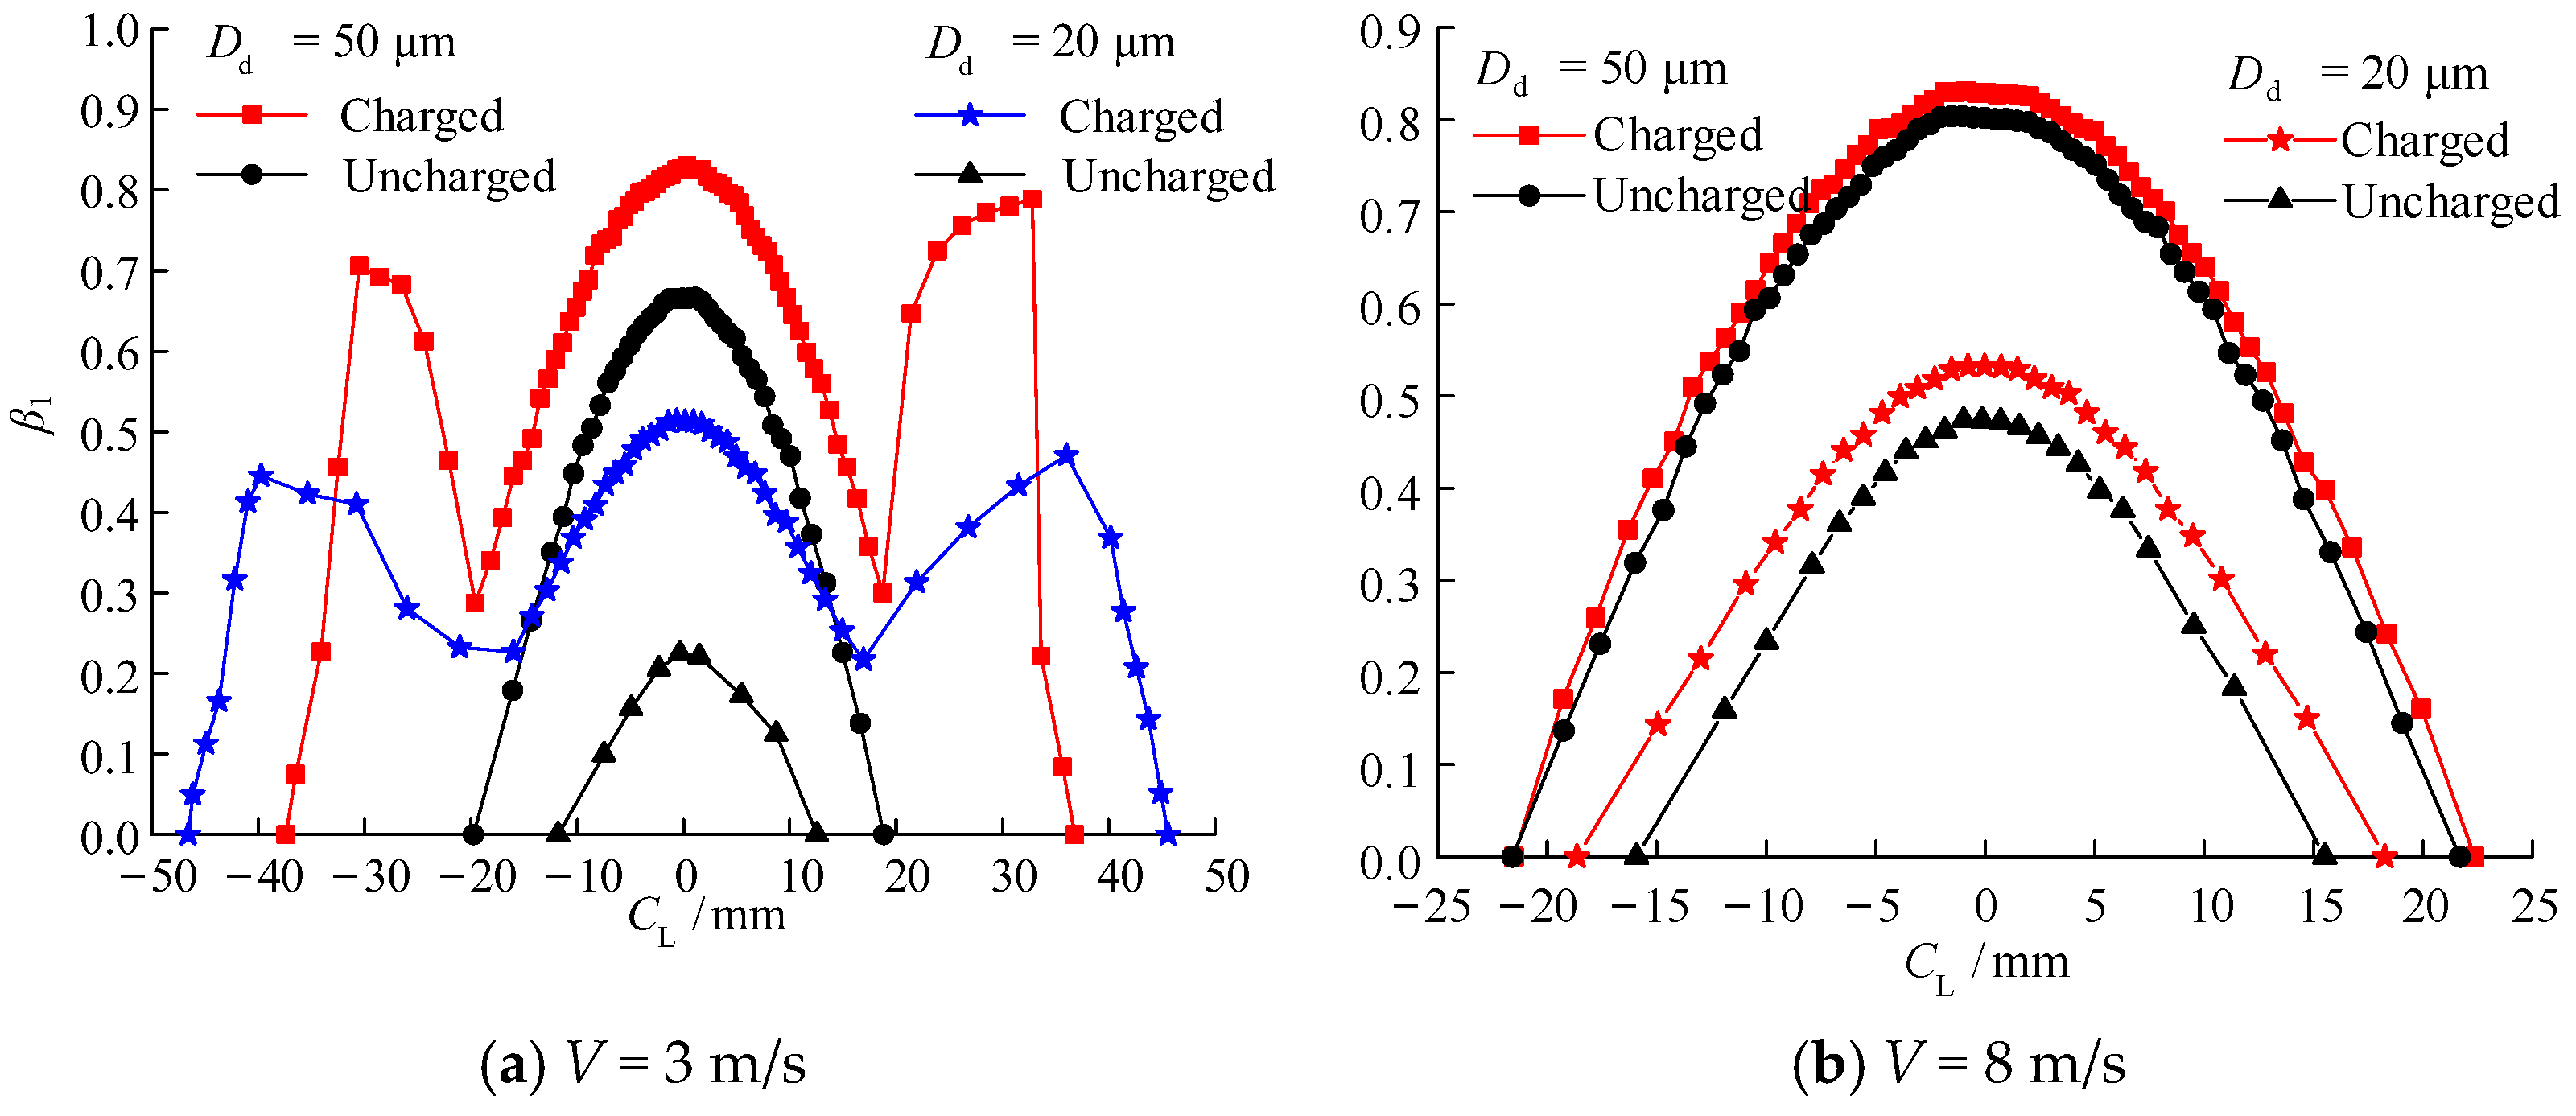
The local water droplet collision coefficient β1 on the ground wire surface was further calculated for different wind speeds and droplet diameters, with the results shown in Figure 9. In Figure 9, the horizontal axis CL represents the arc length from the collision point to the stagnation point on the windward side of the ground wire. Taking the y = 0 line as the reference, CL is positive in the clockwise direction along the ground wire and negative otherwise (at the stagnation point, CL = 0). Under various operating conditions, the β1 values for charged water droplets are consistently higher than those for uncharged droplets. However, the magnitude and range of the increase in β1 for charged droplets relative to uncharged droplets vary under different conditions. For example, at a wind speed of 8 m/s, charged droplets show only a small increase in collision range compared to the uncharged droplets (corresponding to a longer CL range), with collisions entirely concentrated on the windward side. β1 reaches its maximum at the stagnation point and gradually decreases to zero on both sides. At Dd = 50 μm and 20 μm, the maximum β1 for charged droplets increased by 3.4% and 12.3%, respectively, compared to uncharged droplets.
At a wind speed of 3 m/s, the collision range of charged droplets increases substantially compared to that of uncharged droplets, and the collision position of charged droplets extends to the leeward side. β1 reaches its maximum at the stagnation point and exhibits a trend of decreasing first and then increasing toward both sides. At Dd = 50 μm and 20 μm, the maximum values of β1 for charged droplets increased by 128.9% and 23.7%, respectively, relative to uncharged droplets. This is consistent with the conclusions regarding the trajectory deviation of charged water droplets. When both the wind speed and droplet diameter are small, the collision range and the corresponding β1 for charged droplets are significantly enhanced under the dominant influence of the electric field force. As the wind speed and droplet diameter increase, the influence of the electric field force on the droplet trajectories weakens, resulting in a corresponding decrease in both the collision range and β1 for charged droplets.
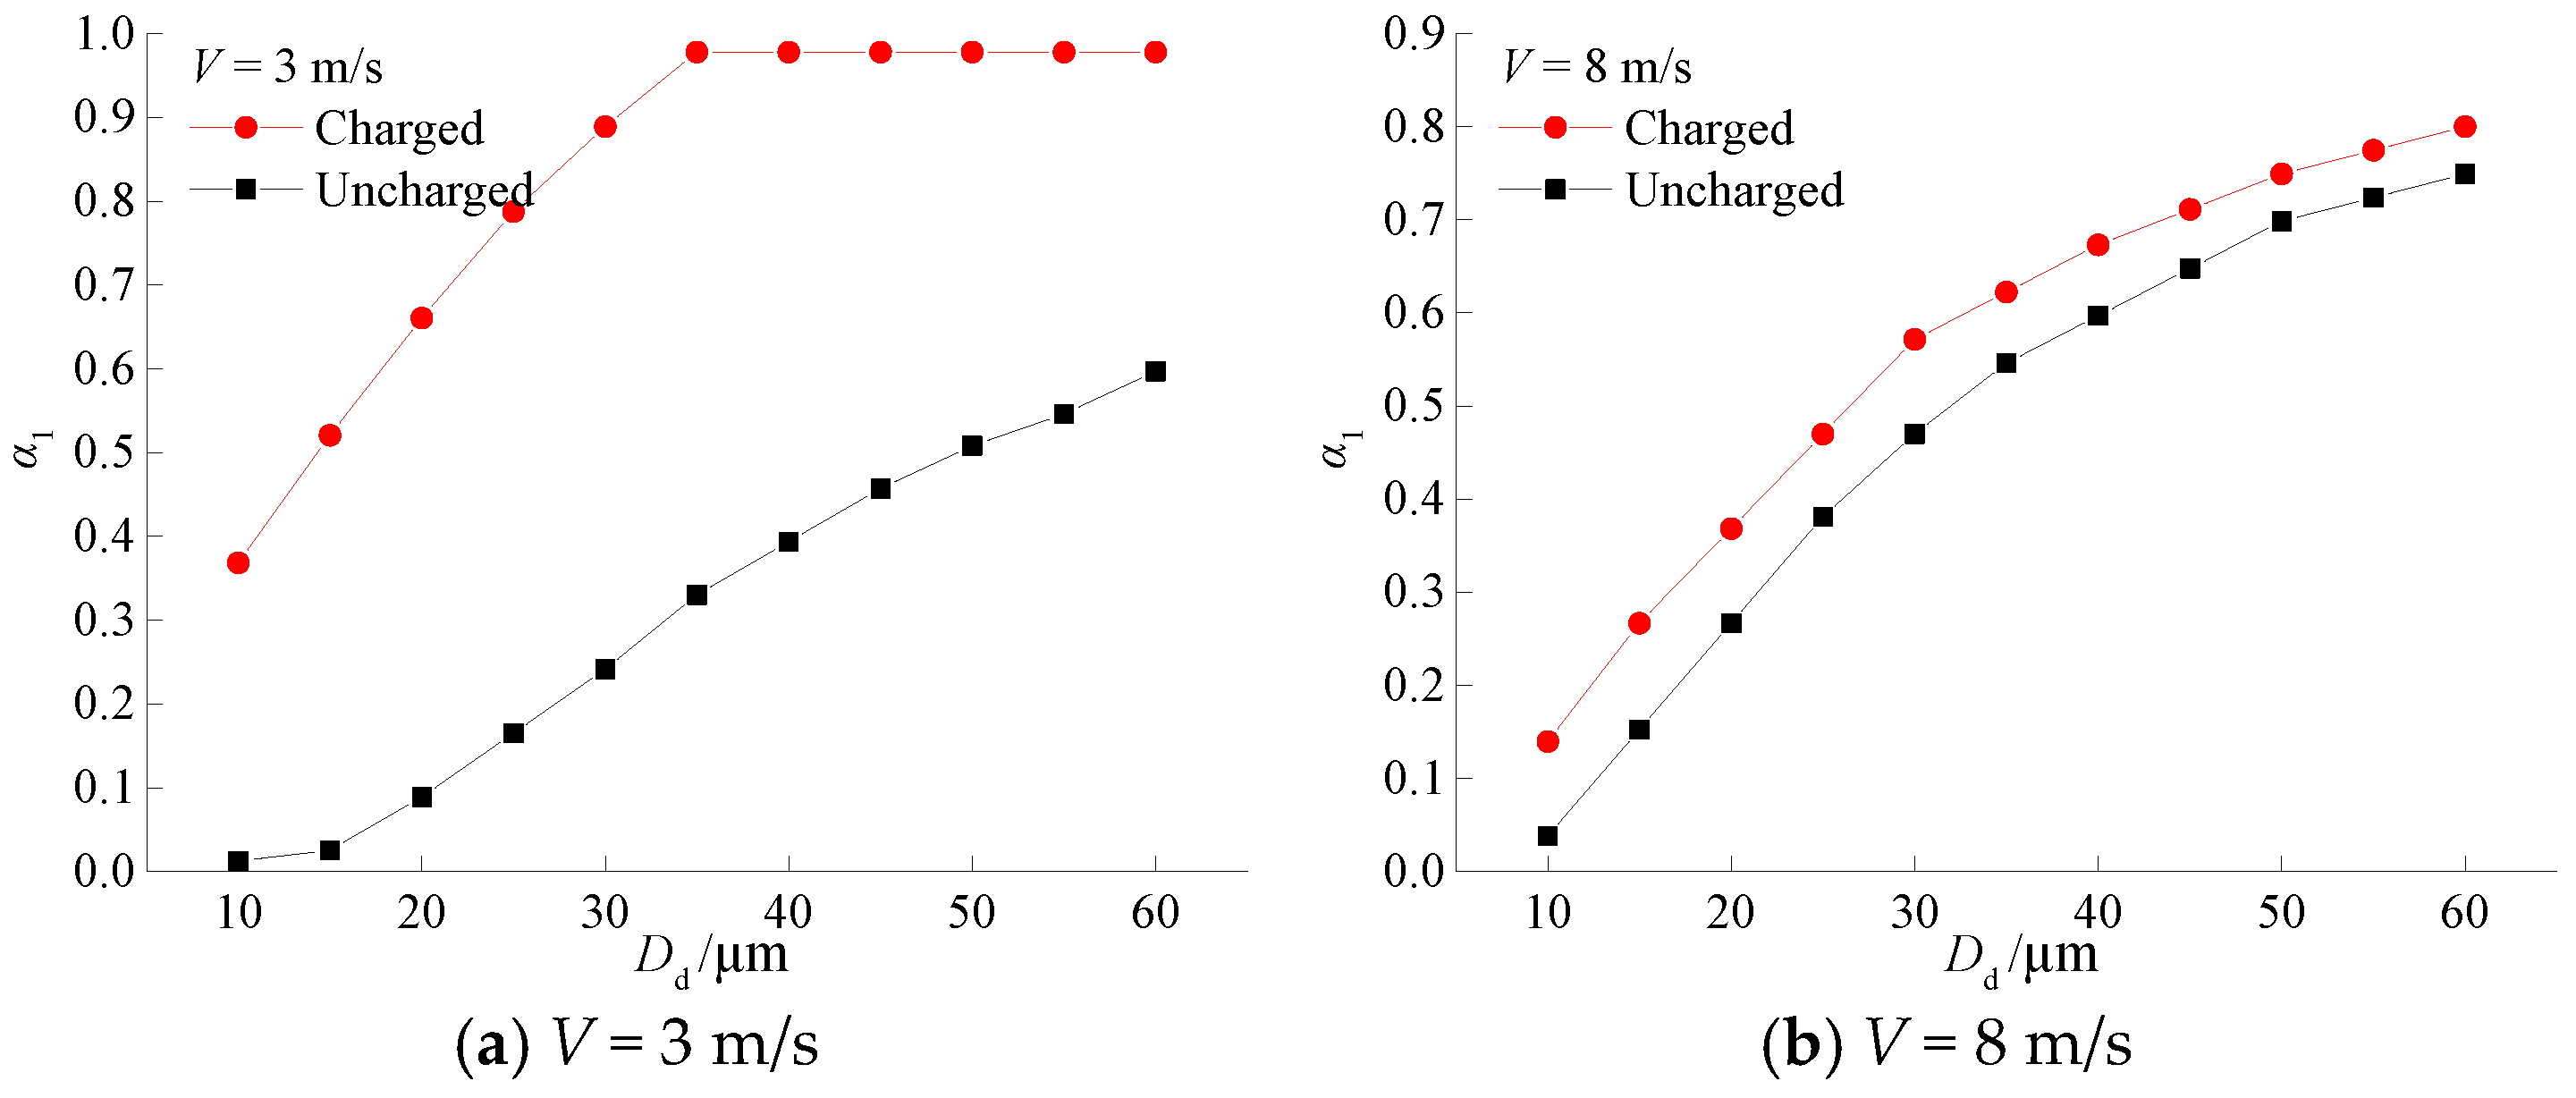
The overall droplet collision coefficients α1 for both charged and uncharged water droplets on the ground wire surface were calculated under various wind speeds and droplet diameters, as illustrated in Figure 10. At a wind speed of 8 m/s, the gap Δα1 between the α1 values of charged and uncharged droplets across different diameters is relatively small, ranging from only 0.05 to 0.11; furthermore, Δα1 gradually decreases as Dd increases. In contrast, at a wind speed of 3 m/s, Δα1 exhibits a trend of first increasing and then decreasing with the increase in Dd, with values ranging from 0.35 to 0.65. The maximum Δα1 of 0.65 is observed at approximately Dd = 35 μm. Combining these findings with the previously discussed variation patterns of β1 on the ground wire surface, it can be inferred that under conditions of low wind speed and small droplet diameters (i.e., rime ice or mixed rime ice), the electric field can significantly alter both the icing rate and the ice morphology on the ground wire surface.

5. Numerical Calculation Model for Ground Wire Icing Under Coupled Fields

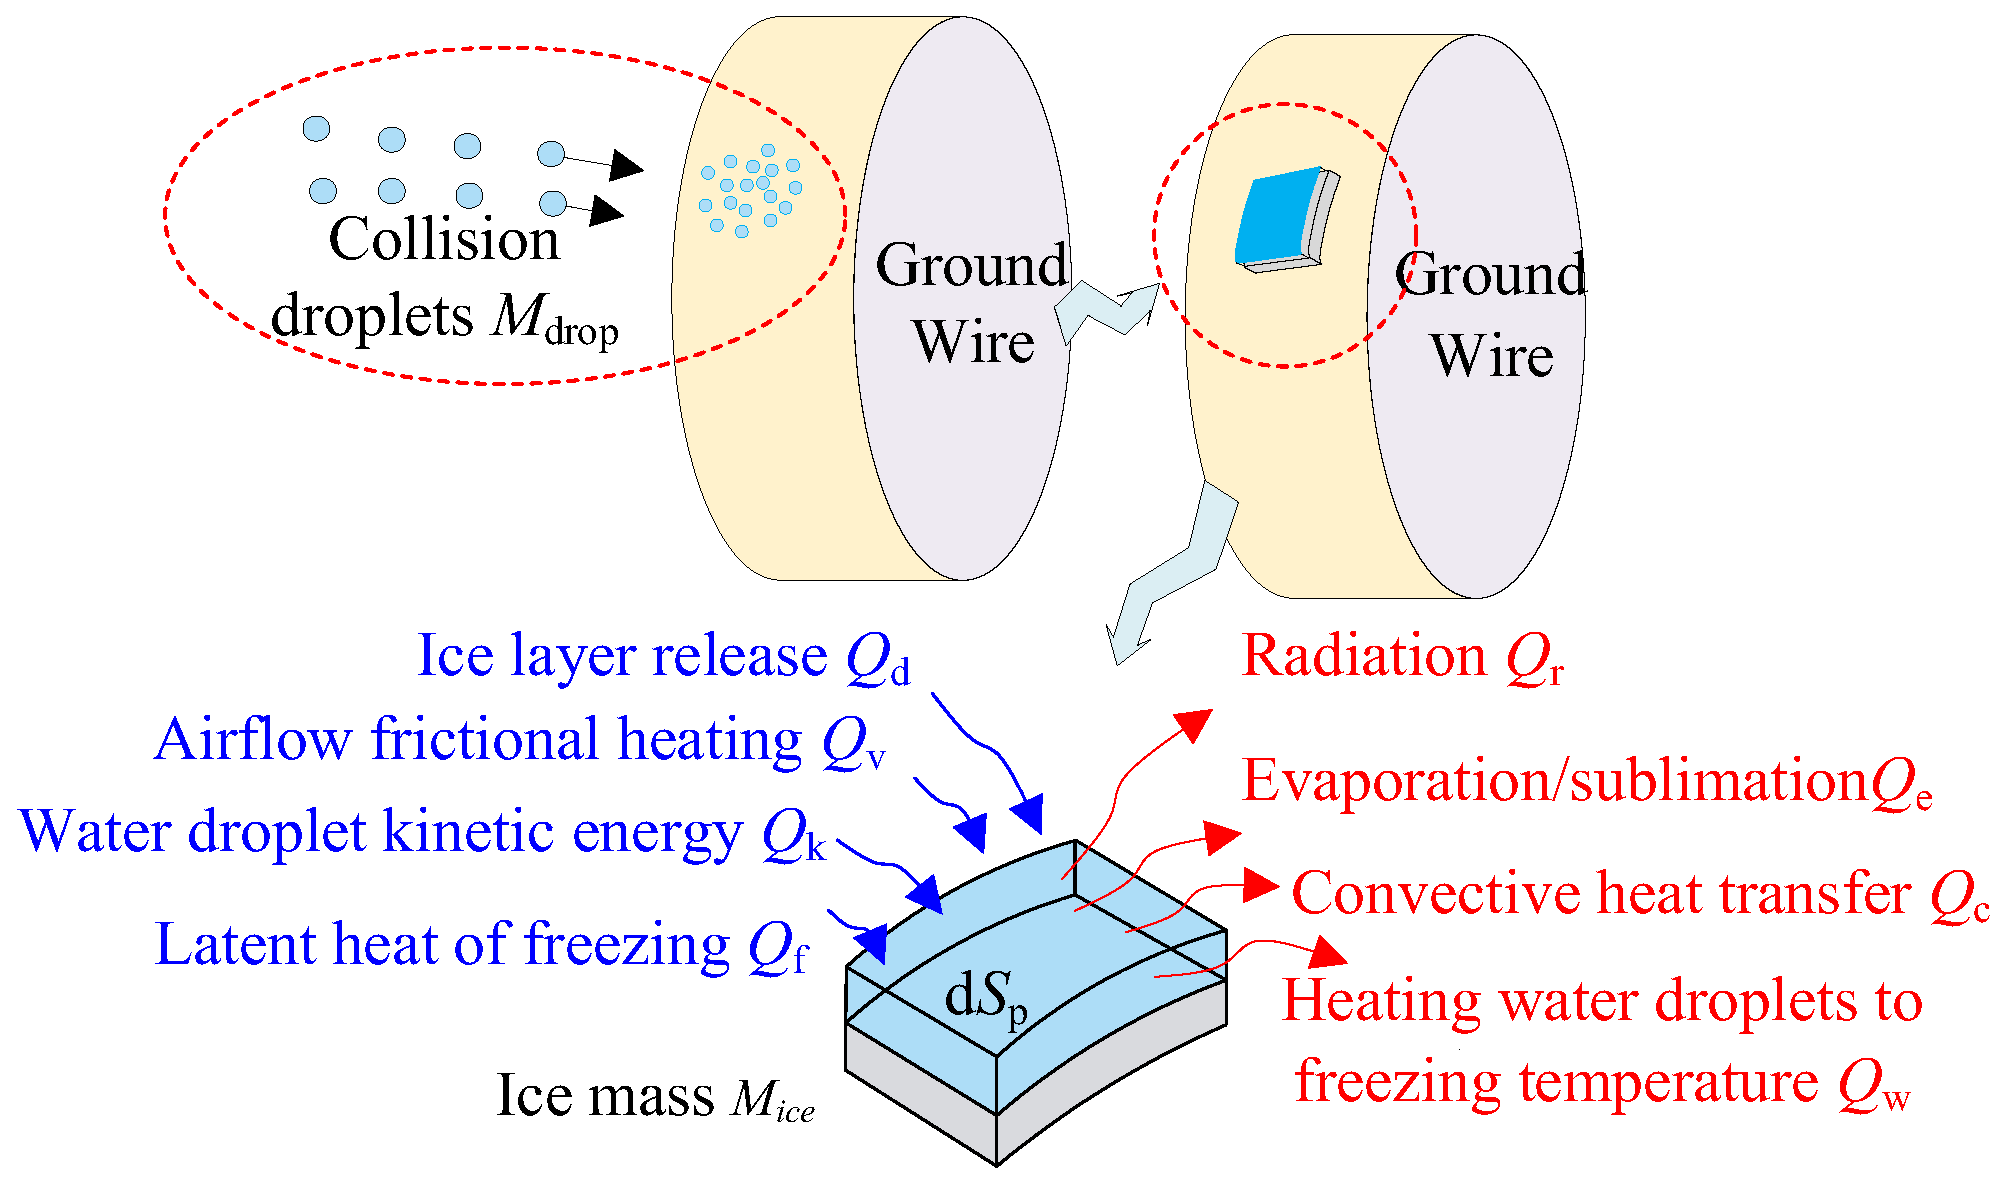
The freezing process of water droplets after colliding with the ground wire follows the mass and energy balance equations, as shown in Equation (6). For a specific computational unit Sj on the ground wire surface, the ice accretion increment Mice is obtained by adding the mass of water droplets captured from the air Mdrop and the mass of the water film inflowing from other units Min, then subtracting the outflowing water film mass Mout and the mass change caused by variations in water film thickness Mfilm. In the energy balance equation, the left side represents the energy lost by the computational unit, while the right side represents the energy gained. Here, Qd denotes the heat released by the ice layer as it cools from the freezing temperature (0 °C) to the equilibrium temperature; when a water film exists on the ice surface, Qd = 0 J. The specific meanings of other energy balance terms are illustrated in Figure 11. The water droplet freezing coefficient (accretion fraction) β3 on the wire surface can be obtained by solving Equation (6) [23]. According to the Makkonen model [24], the icing growth rate dM/dt can be solved by combining the local collision coefficient β1 on the ground wire surface, as expressed in Equation (7), where w is the liquid water content (w) in the air (kg/m3), and dSp is the area of the target computational position on the ground wire (m2).
M drop + M in = M out + M film + M ice Q e + Q c + Q w + Q r = Q v + Q f   + Q d + Q k
d M d t = β 1 β 3 w d S p V

5.1. Ice Accretion Morphology on the Ground Wire Surface Under Different Operating Conditions

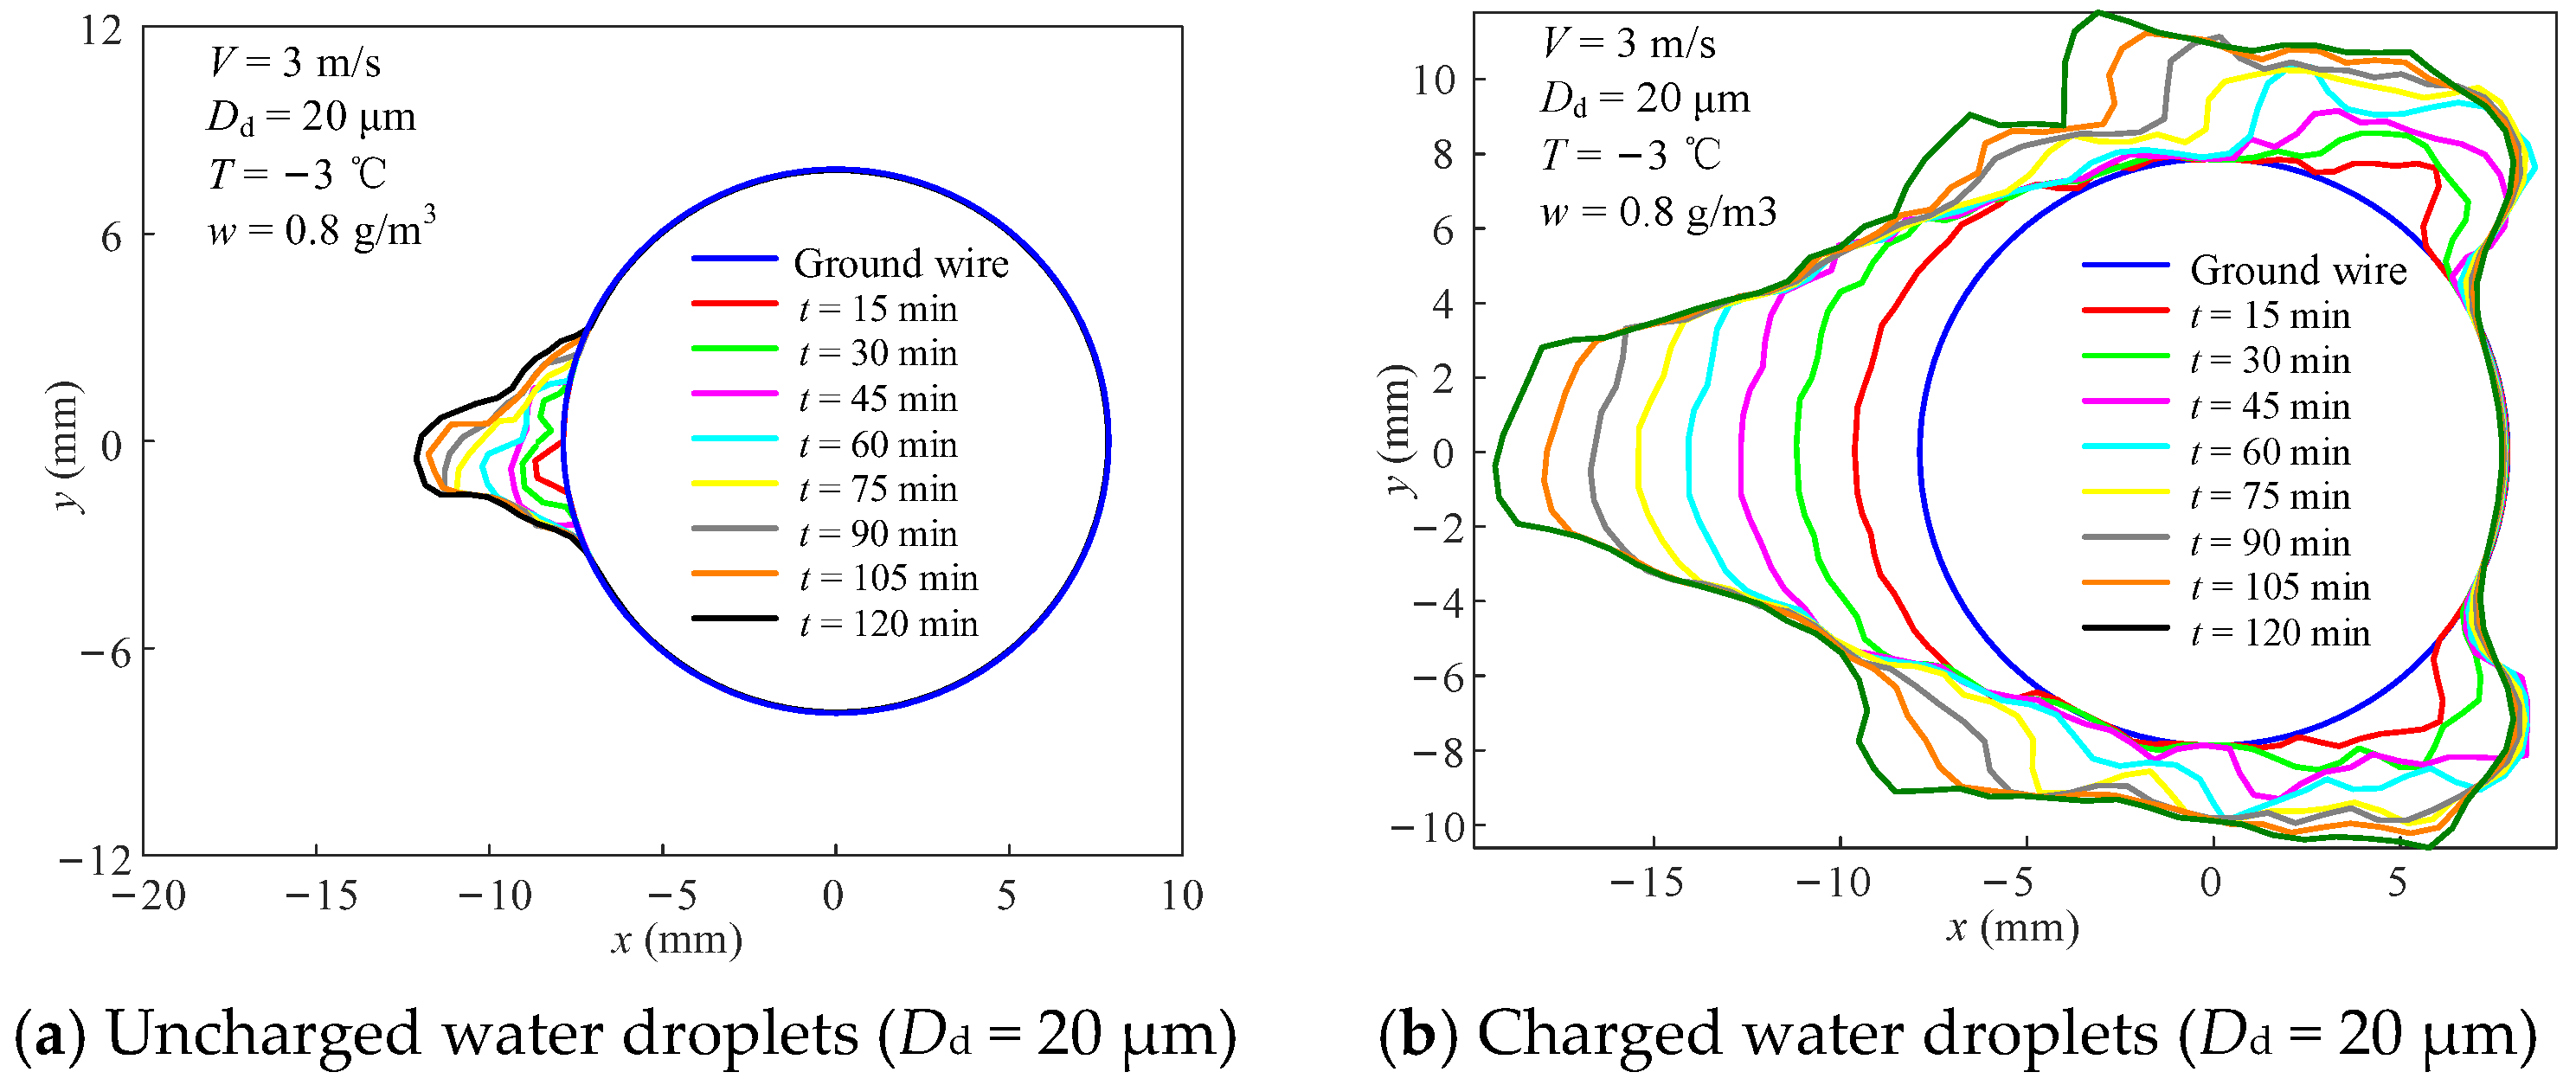
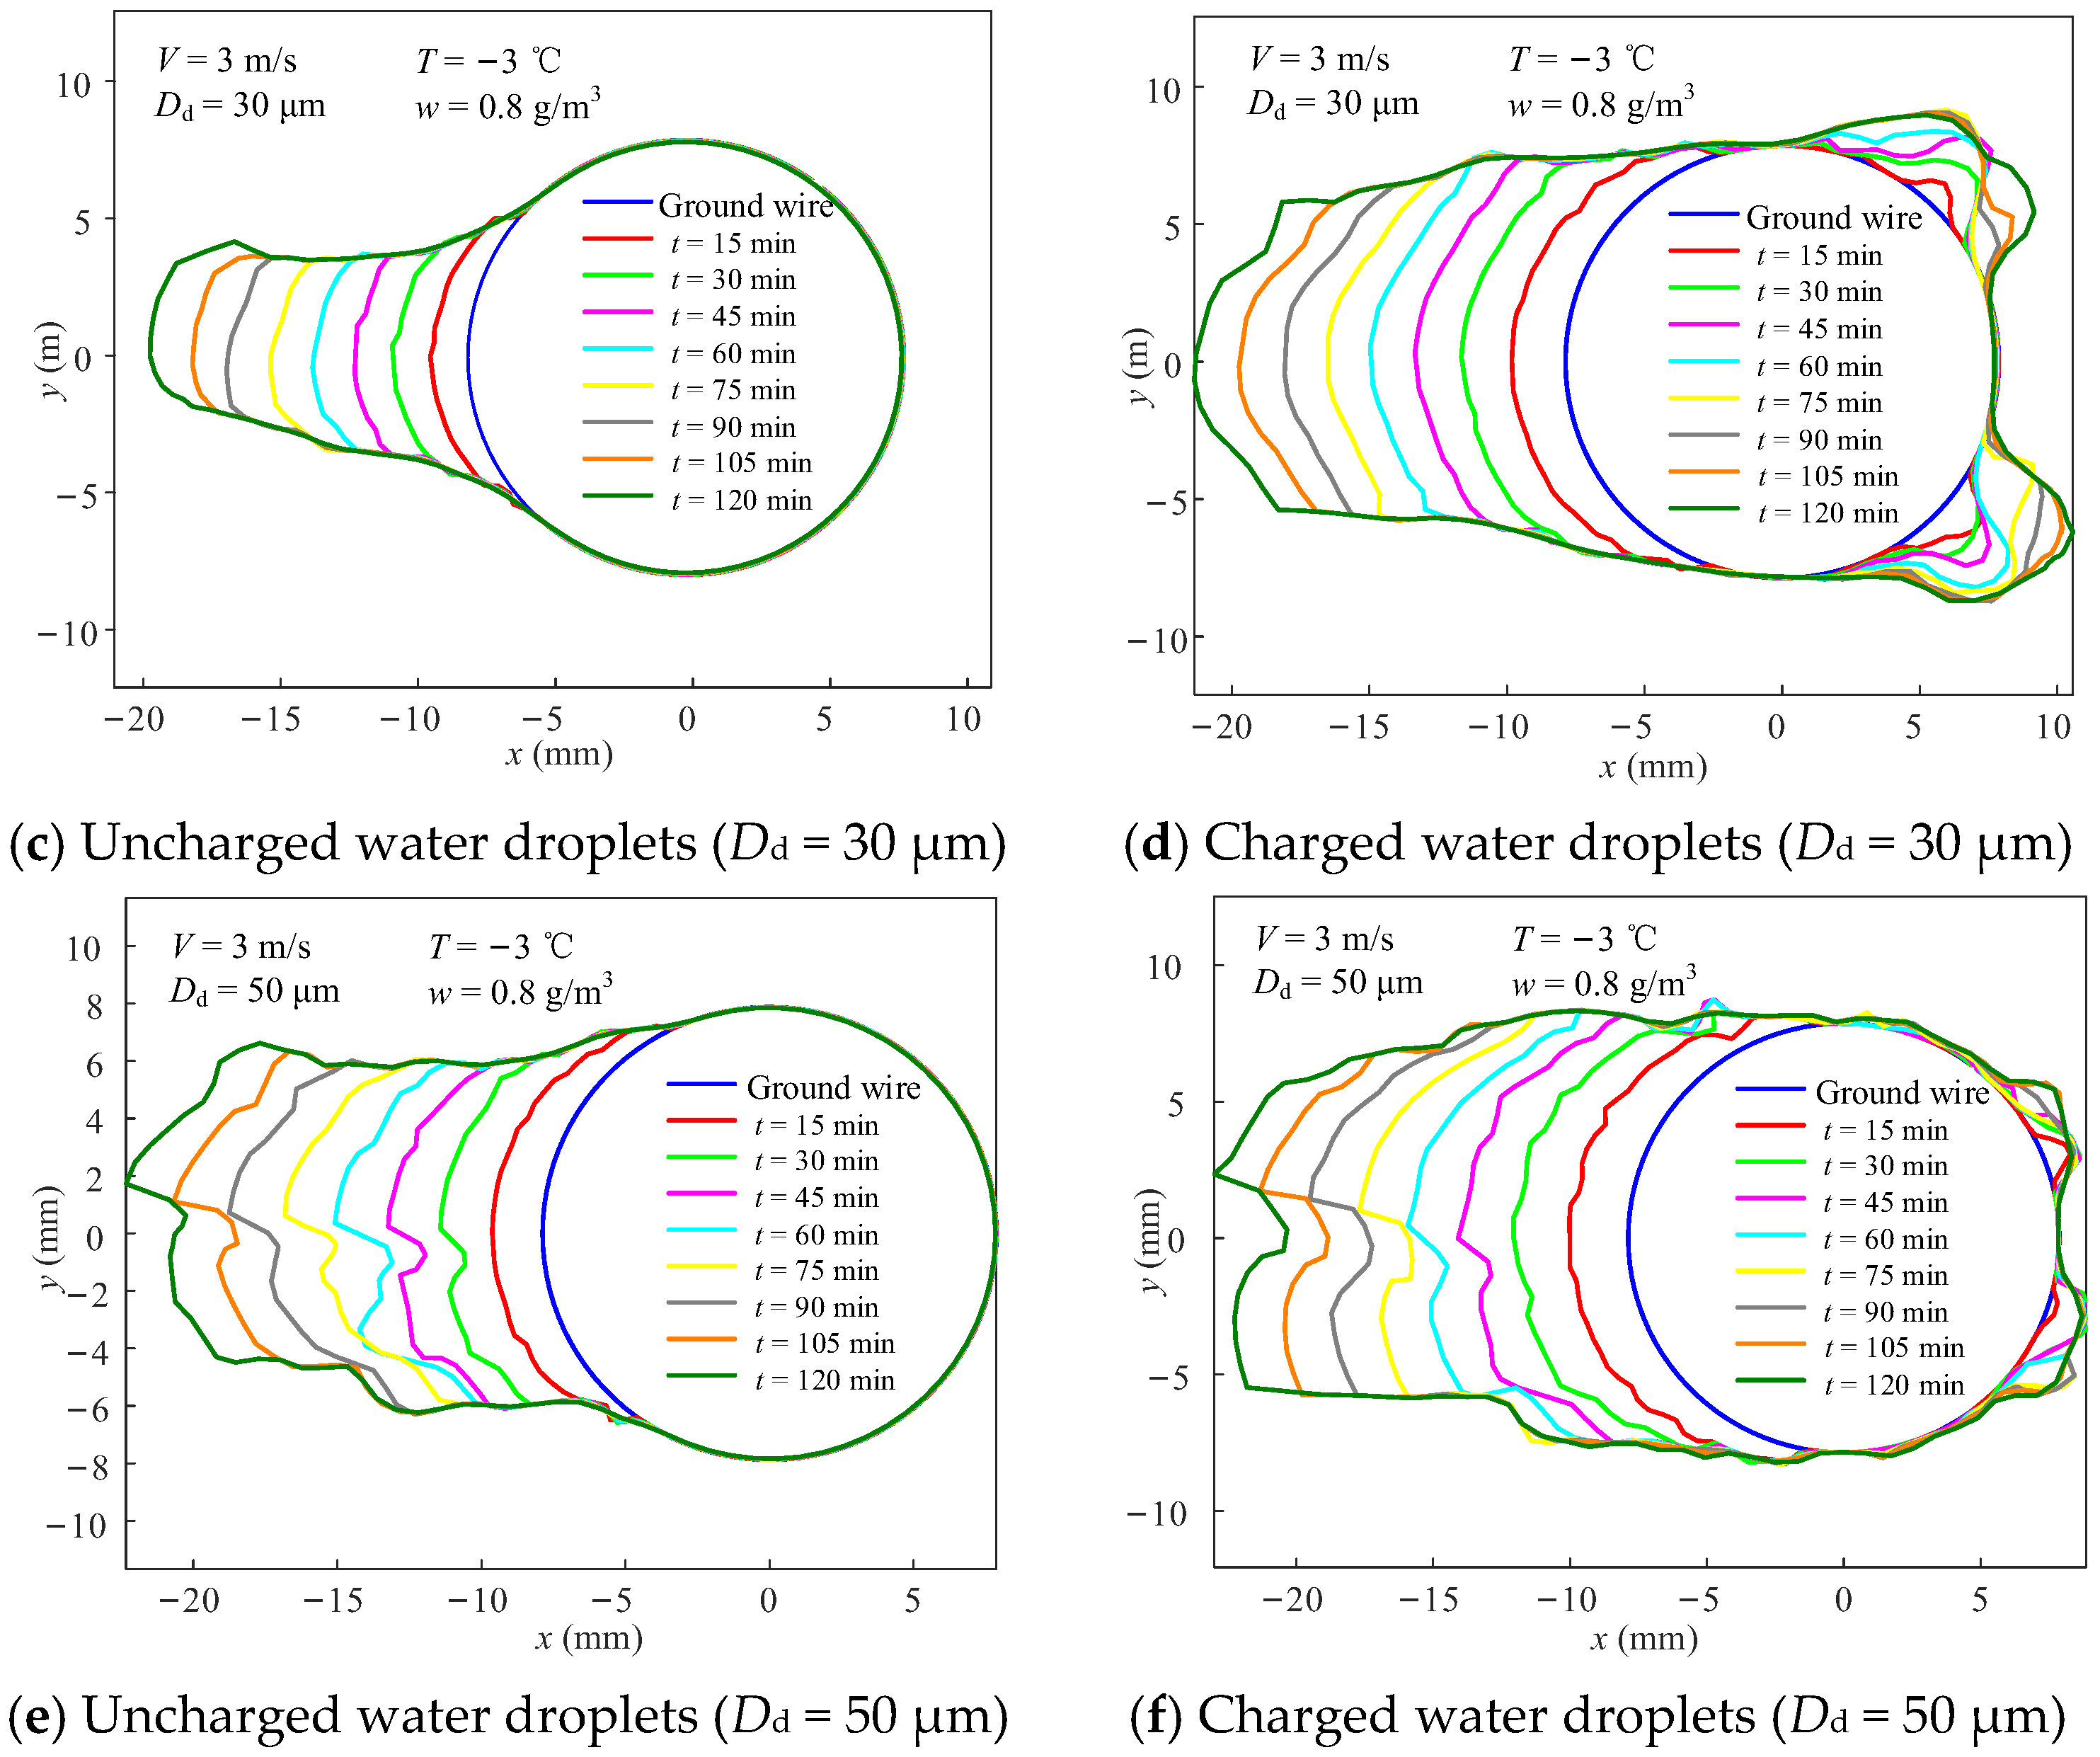
The growth morphology of ice accretion on the ground wire surface under various operating conditions was simulated using the proposed model, with the results illustrated in Figure 12. The following observations can be made:
(1)
Under low wind speed (V = 3 m/s), if the water droplets are not charged, the smaller the water droplet particle size (the smaller the Dd), the smaller the water droplet collision and freezing range. For example, at Dd = 20 μm (Figure 12a), because the water droplets are not charged, ice accretion only freezes near the stagnation point on the windward side of the ground wire; as the water droplet particle size gradually increases (as shown in Figure 12c,e), the ice accretion range on the windward side of the ground wire gradually increases, but all are limited to the windward side of the ground wire.
(2)
At a low wind speed (V = 3 m/s), when water droplets are charged, the combined effect of the electric field force and air drag force causes the collision positions to expand from the windward side toward the leeward side. Consequently, the icing range of the ground wire is larger under identical conditions.
(3)
Under charged conditions, different droplet diameters lead to varying degrees of icing range expansion. Interestingly, smaller droplet diameters result in a larger collision and freezing extent. For example, at Dd = 20 μm (Figure 12b), the collision and freezing range is significantly larger than those at Dd = 30 μm and Dd = 50 μm (Figure 12d,f).
(4)
Under charged conditions, the positions of droplet collision and freezing migrate as the ice morphology evolves. In Figure 12b, some charged droplets bypass the windward side and freeze on the leeward side (at t = 15 min) due to the electric field. Defining this position as the initial leeward collision position, as the icing iteration progresses, the subsequent collision positions gradually shift and migrate toward the windward side. This causes the region between the initial freezing position and the windward freezing position to be gradually filled with ice, forming distinct ice protrusions. However, this phenomenon weakens as the droplet diameter increases, and the migration direction of the collision positions changes. For instance, in Figure 12d, during the 120-min iteration, the collision positions on the leeward side primarily shift toward the leeward side relative to the initial position (at t = 15 min), with a smaller displacement. As the droplet diameter increases further (Figure 12f), this displacement decreases even more.
(5)
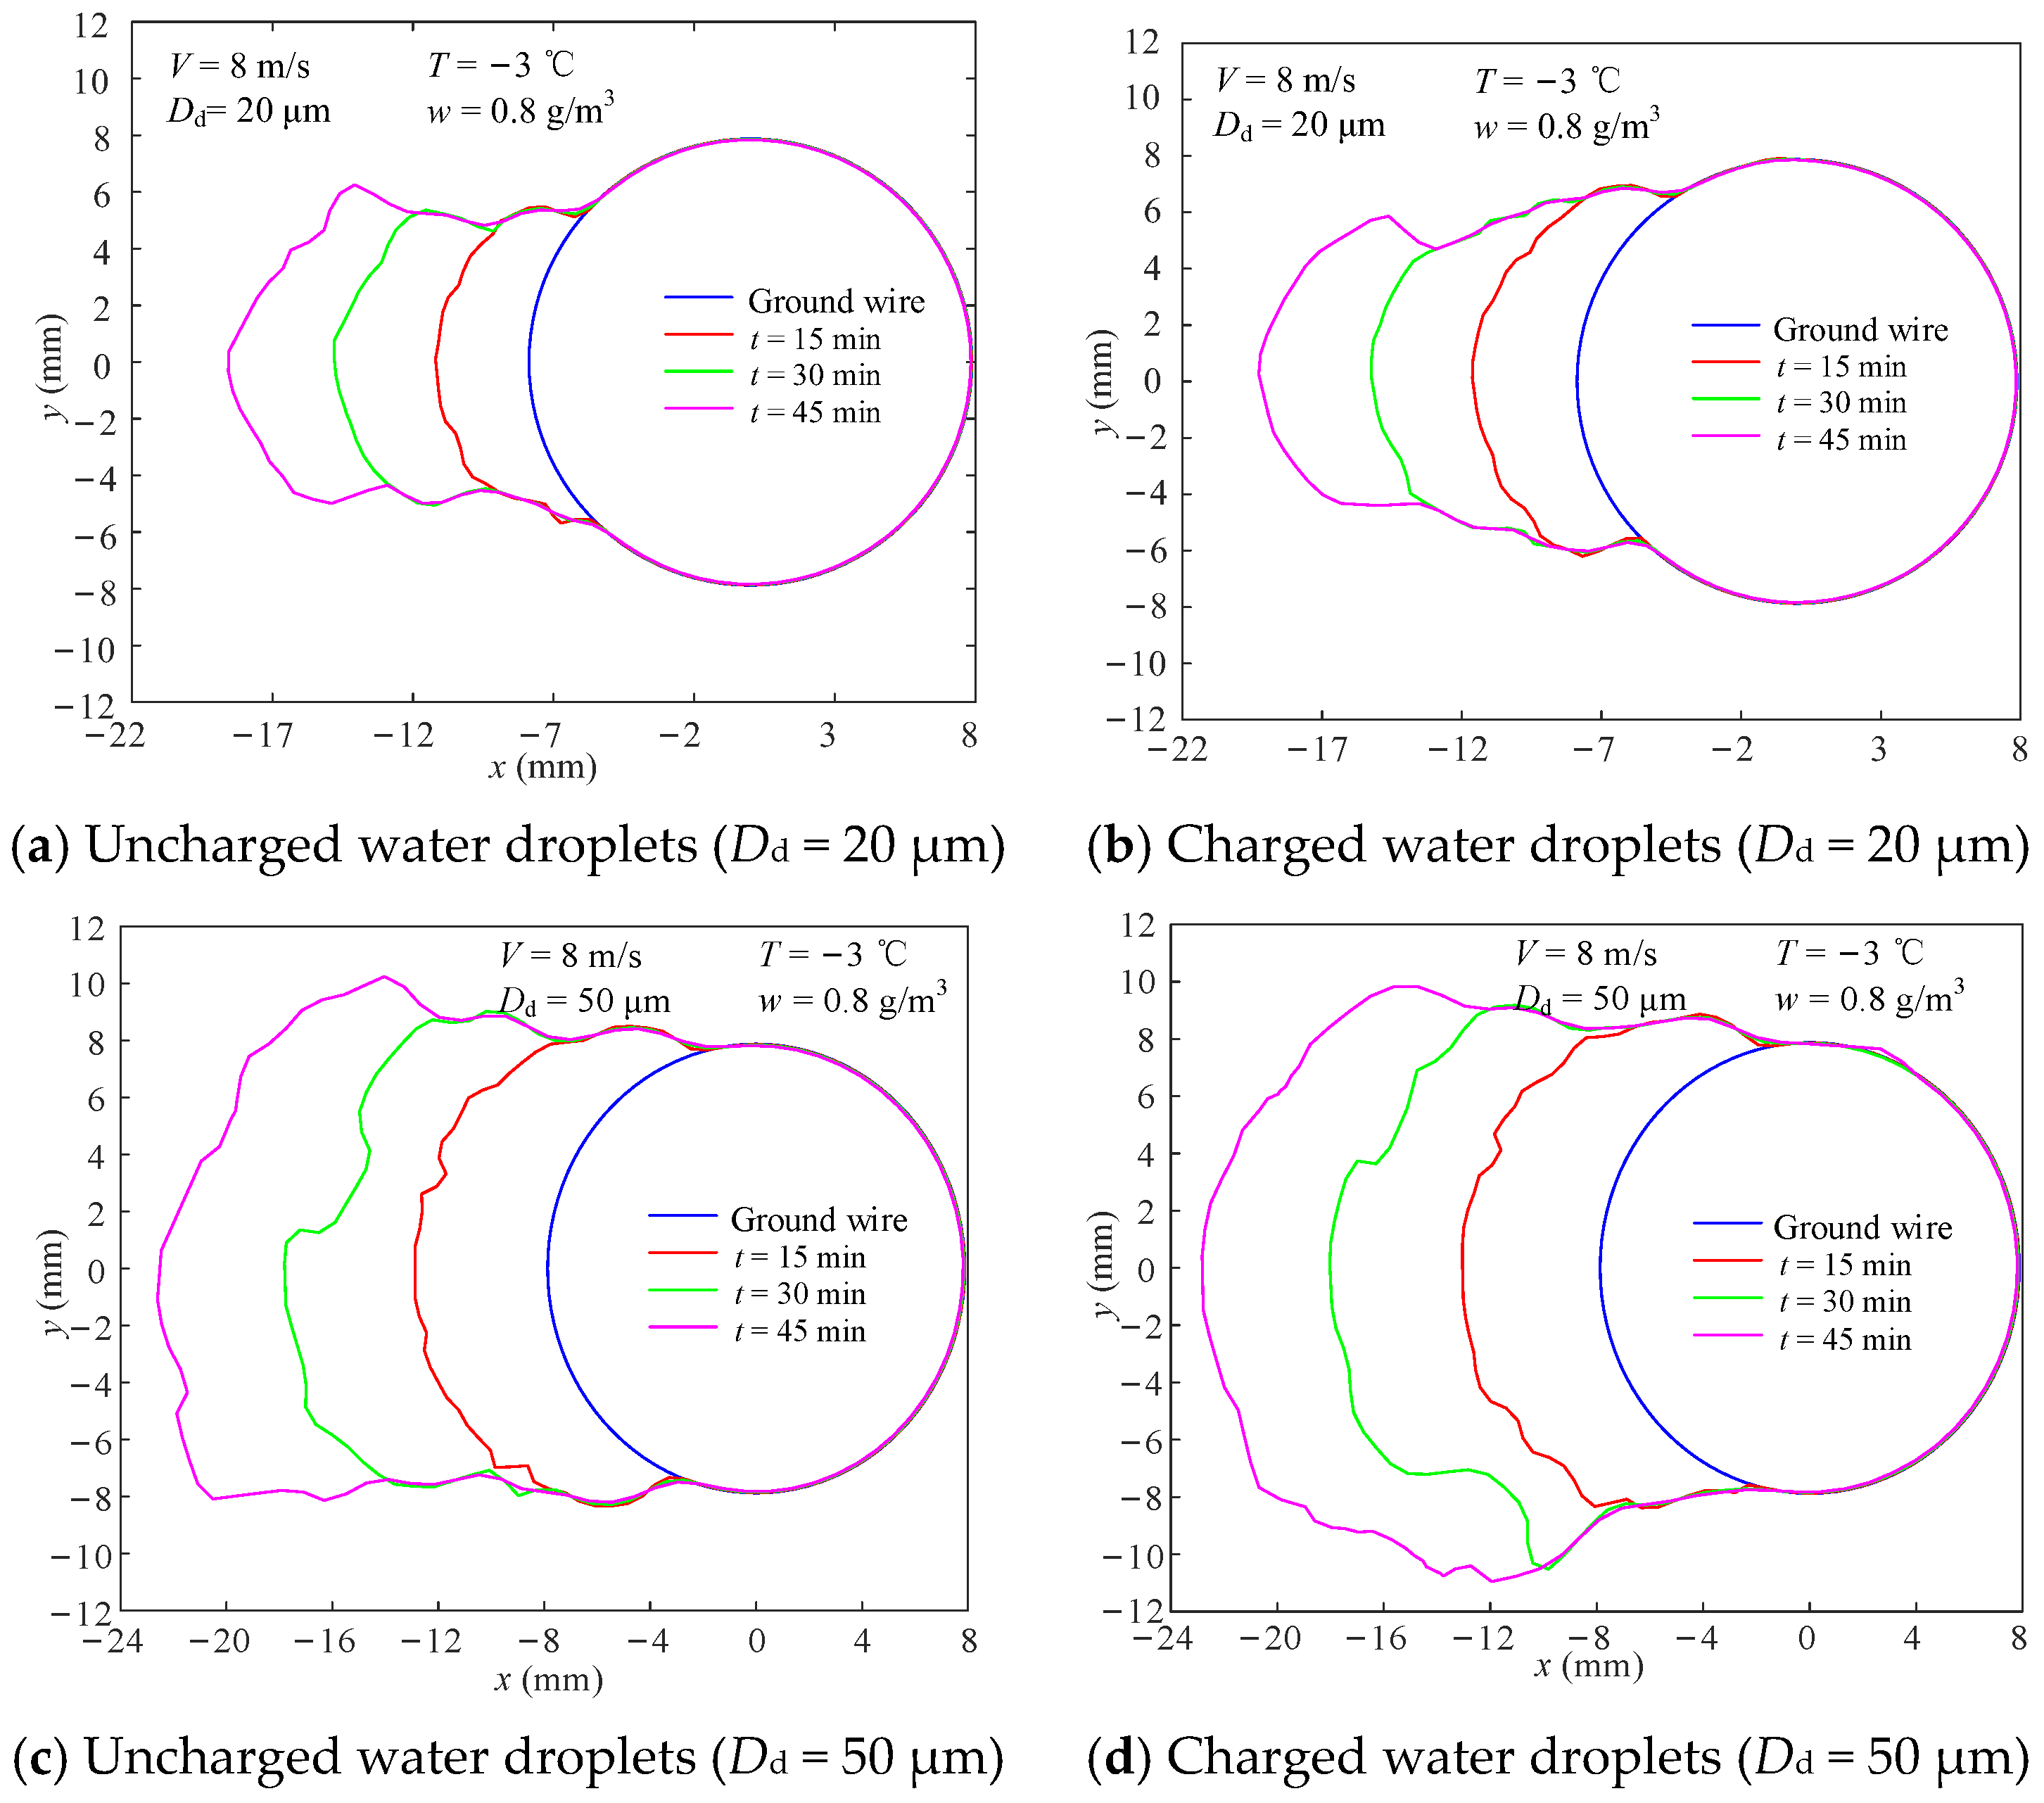
At a higher wind speed (V = 8 m/s), the influence of the electric field force on the droplet trajectories weakens, making it difficult for droplets to bypass the wire and collide with the leeward side. Therefore, even charged droplets primarily collide and freeze on the windward side. As shown in Figure 13, at a wind speed of 8 m/s, water droplets with Dd of 20 μm and 50 μm only produce ice on the windward side. However, a comparative analysis between charged and uncharged conditions reveals that the icing range under charged conditions remains larger than that under uncharged conditions, though the difference is reduced.

5.2. Ice Accretion Rates on the Ground Wire Surface Under Different Operating Conditions

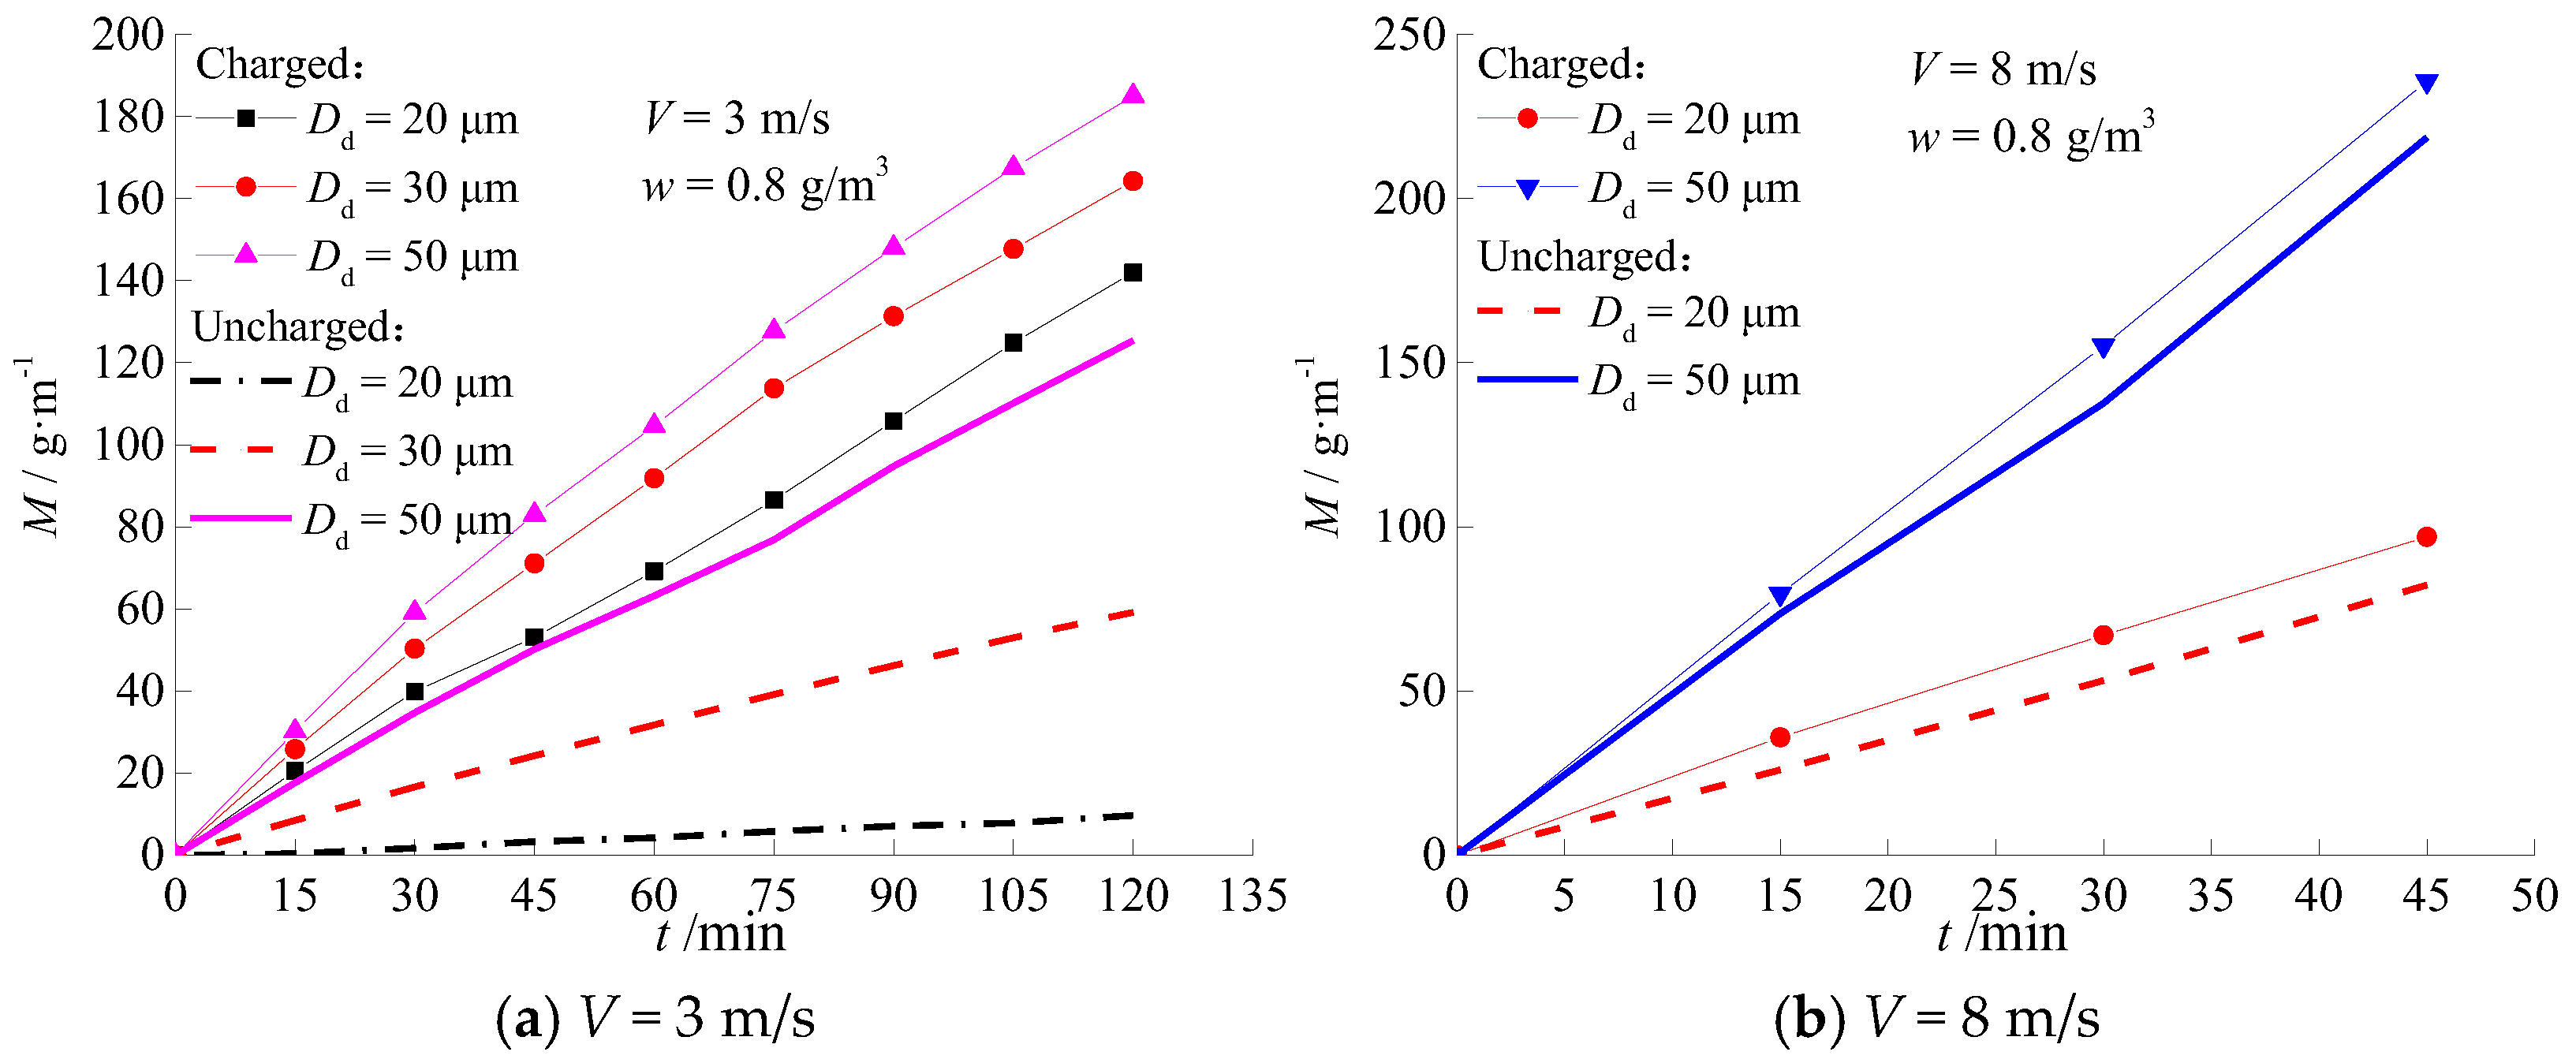
According to the ice accretion growth situation on the surface of the ground wire above, the ice accretion growth rate of the iteration process is extracted, and the results are shown in Figure 14. The vertical axis M/g·m−1 represents the ice accretion mass per unit length of the ground wire. As shown in Figure 14a, when the wind speed is 3 m/s, w = 0.8 g/m3, and T = −3 °C, the ice accretion mass of the ground wire grows relatively slowly, and the total simulation time is 2 h. The ice accretion mass growth rate under the condition of charged water droplets is obviously faster than that under the condition of uncharged water droplets, and the smaller the water droplet particle size, the larger the gap. For example, at Dd = 20 μm, the ice accretion rate per unit length of the ground wire under the condition of charged water droplets is approximately 1.18 g/min, which is 14.8 times that under the condition of uncharged water droplets. When Dd is 30 μm and 50 μm, this value decreases to 2.8 times and 1.5 times.
As shown in Figure 14b, when increasing the wind speed to Dd = 20 μm, the ice accretion mass growth rate of the ground wire obviously increases. The ice accretion rate per unit length of the ground wire under the condition of charged water droplets is still larger than the uncharged condition, but the gap between the two is not large. For example, at Dd = 20 μm, the ice accretion rate per unit length of the ground wire under the condition of charged water droplets is approximately 2.2 g/min, which is 1.2 times that of the uncharged water droplet condition. When increasing Dd to 50 μm, the ice accretion rate is 5.2 g/min, which is 1.1 times that of the uncharged water droplet condition. This phenomenon is mainly determined by the influence law of electric field force on water droplet trajectories. When the wind speed increases, the collision number and concentration level of water droplets on the surface of the ground wire are mainly affected by water droplet inertia, and the degree of action of the electric field force weakens; whether or not the water droplets are charged have an influence on the ice accretion rate of the ground wire surface being small.

6. Field Observation of UHVDC Ground Wire Icing

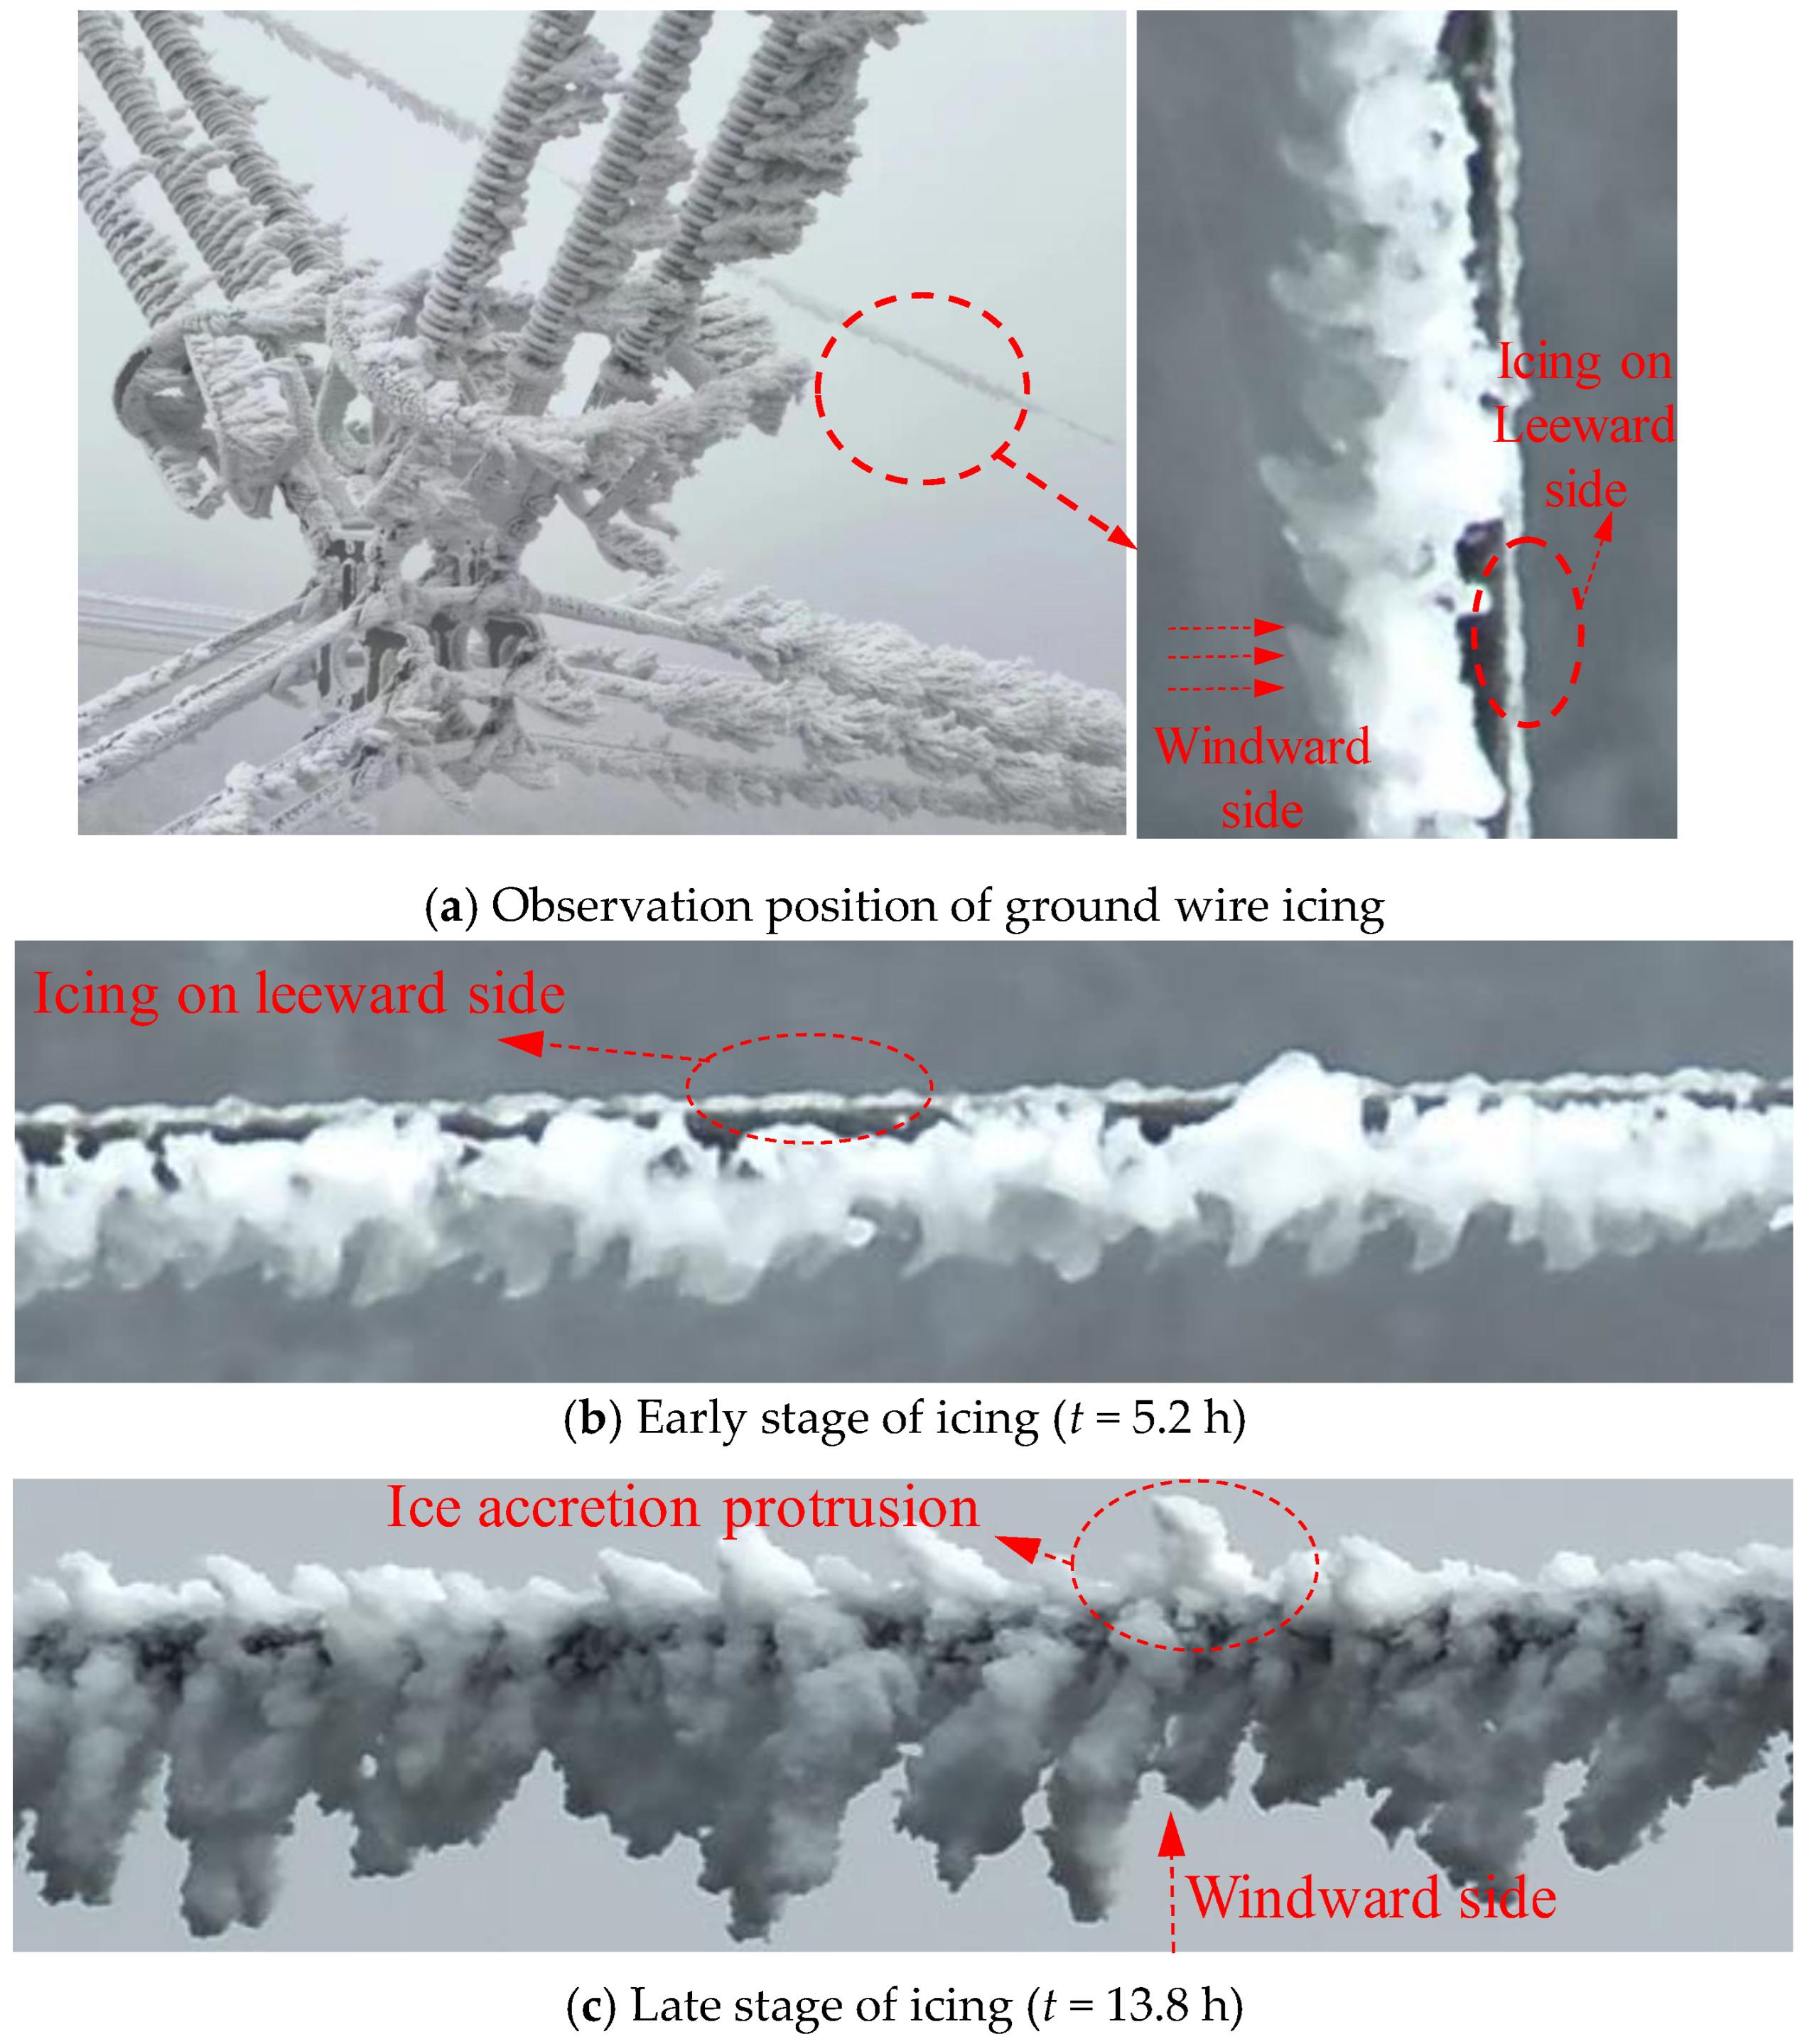
To validate the accuracy of the proposed model in predicting ground wire ice morphology, field observations were conducted in January 2025 at the Yihua Line Icing Observation Station, located in Zhangchong Township, Jinzhai County, Lu’an City, Anhui Province. Situated in the Dabie Mountains, this station is characterized by a prevailing northeast wind in winter and is recognized as a typical icing-prone region. The subject of observation was the ground wire of a ±800 kV UHVDC transmission line, with structural parameters consistent with those listed in Table 2. During an intermittent icing event lasting 13.8 h, the measured ambient wind speed ranged from 0.5 to 8 m/s, and the ambient temperature fluctuated between −5 °C and 1 °C. An unmanned aerial vehicle (UAV) was utilized to monitor the ice morphology on the ±800 kV ground wire; the observed results are presented in Figure 15.
The following observations can be made: During the initial stage of ice accretion (Figure 15a), the ice type is mixed rime, with parts of the ice layer exhibiting a translucent milky-white appearance. Due to the presence of an unfrozen flowing water film on the surface, numerous short icicles are visible beneath the ice layer. The ice thickness on the leeward side of the ground wire is relatively small, with accumulation primarily concentrated on the windward side. It is inferred that this may be due to the large droplet size (Dd) of the water droplets in the air, which results in a diminished influence from the electric field. As the icing process develops (Figure 15b), rime ice becomes dominant in the later stage, and the ice structure becomes sparse and fluffy. The influence of the DC electric field gradually becomes apparent, leading to an increase in ice thickness on the leeward side. The protruding ice spikes and the roughened surface facilitate electric field concentration, which increases the droplet collision intensity. This further amplifies the disparity in ice thickness at different positions around the ground wire, eventually forming a highly irregular ice accretion morphology.

7. Conclusions

(1)
Considering the complex icing conditions of UHVDC ground wires under the influence of coupled flow-DC electric fields, the motion and force equations for supercooled water droplets in the air—the primary source of ground wire icing—were derived and determined under the action of the coupled fields.
(2)
Under conditions of ground wire icing, the trajectory deviations of charged water droplets with different particle sizes show significant differences during the process of bypassing and colliding with the ground wire. At low wind speeds, small-diameter droplets are primarily affected by the airflow drag force (flow field influence) with minimal impact from the DC electric field, whereas larger-diameter droplets carry a higher charge quantity, making their trajectories more susceptible to deviation under the action of the electric field. At high wind speeds, this disparity weakens.
(3)
Compared to uncharged conditions, the overall droplet collision coefficient α1 on the ground wire surface under charged conditions can increase by 0.05 to 0.65, and the local droplet collision coefficient can increase by 3.4% to 128.9%. The enhancement effect of the electric field on the droplet collision coefficients becomes more pronounced as the wind speed and the water droplet diameter decrease.
(4)
An icing calculation model for ground wires was established based on the energy balance equation, achieving a dynamic simulation of ice accretion growth on the ground wire surface under the action of coupled fields. The results indicate that, compared to uncharged conditions, the icing range under charged conditions expands from the windward side toward the leeward side, and the icing rate increases accordingly.
(5)
Field observation results of the ice morphology on ±800 kV DC ground wires show that ice accretion does indeed grow progressively on the leeward side under the influence of the DC electric field. Especially under rime icing conditions, protruding ice spikes promote electric field concentration, leading to an increase in the local droplet collision coefficient and icing rate. The unbalanced icing rate further increases the roughness and non-uniformity of the ice surface.

8. Research Limitations and Future Work

The main limitation for the work in this paper is as follows: In the current 2D numerical model, the torsional effect of the ground wire under asymmetric ice loads is not considered. In practice, the ground wire has a certain torsional stiffness. When a significant ice thickness difference exists between the windward and leeward sides, the ground wire may twist, continuously altering the relative positions of the windward and leeward surfaces. This, in turn, affects subsequent droplet collision locations and the final ice morphology. Neglecting this effect may lead to an underestimation of the icing range and the degree of ice non-uniformity.
Future work will focus on: (1) developing a 3D coupled flow-electric-mechanical model to include the torsional degree of freedom of the ground wire, thereby improving the prediction accuracy of ice accretion morphology; (2) conducting quantitative validation using artificial climate chamber experiments and field observations with specialized LWC/MVD instruments; and (3) extending the model to other DC components (e.g., insulators and fittings) to support anti-icing/de-icing strategies.

Author Contributions

Conceptualization, Y.F. and Y.C.; methodology, P.G.; investigation, P.G. and S.C.; data curation, D.S. and S.C.; writing—original draft preparation, G.H.; writing—review and editing, Y.F. and Y.C. All authors have read and agreed to the published version of the manuscript.

Funding

This study was funded by the Science and Technology Project of State Grid Anhui Electric Power Co., Ltd. (AHDLKJXMRWS2025054).

Data Availability Statement

The data presented in this study are available upon request from the corresponding author.

Conflicts of Interest

Authors Y.F., Y.C., P.G., D.S. and S.C. were employed by the State Grid Anhui Electric Power Co., Ltd. The remaining authors declare that the research was conducted in the absence of any commercial or financial relationships that could be construed as a potential conflict of interest. The authors declare that this study received funding from the Science and Technology Project of State Grid Anhui Electric Power Co., Ltd. (AHDLKJXMRWS2025054). The funder was not involved in the study design, collection, analysis, interpretation of data, the writing of this article or the decision to submit it for publication.

References

  1. Wang, Q.; Luo, W.; Xu, H.; Wang, L. Numerical simulation of icing on transmission conductors considering time-varying meteorological parameters. J. Harbin Inst. Technol. 2022, 54, 11–21. [Google Scholar] [CrossRef]
  2. Hao, Y.; Wang, X.; Liang, W.; Zhang, W.; He, J.; Wang, J.; Li, H.; Wen, Y.; Mao, X.; Wu, J. Ice Types Identification and Prediction of Overhead Transmission Lines Driven by Micro-Meteorological Data of Three Consecutive Days Icing. South. Power Syst. Technol. 2023, 17, 107–116. [Google Scholar] [CrossRef]
  3. Han, X.; Wu, H.; Guo, S.; Jiang, X.; Wang, Y. Analysis of Interaction Mechanism between Icing and Torsion of Single Transmission Lines. Trans. China Electrotech. Soc. 2022, 37, 4508–4516. [Google Scholar] [CrossRef]
  4. Chen, Y.; Cai, Y.; Xie, Q.; Wan, J.; Sun, Q. Combined effects of icing and wind on transmission lines in mountainous areas. J. Constr. Steel Res. 2024, 223, 109042. [Google Scholar] [CrossRef]
  5. Jiang, X.; Zhang, Z.; Hu, Q.; Hu, J.; Shu, L. Thinkings on the Restrike of Ice and Snow Disaster to the Power Grid. High Volt. Eng. 2018, 44, 463–469. [Google Scholar] [CrossRef]
  6. Chen, Y.; Fan, S.; Wang, X.; Yu, J.; Song, P.; Lu, Y. Anti-icing Technology for Transmission Lines Based on New Ground Wire Structures and Operation Modes. High Volt. Eng. 2024, 50, 4933–4941. [Google Scholar] [CrossRef]
  7. Farzaneh, M.; Savadjiev, K. Statistical Analysis of Field Data for Precipitation Icing Accretion on Overhead Power Lines. IEEE Trans. Power Deliv. 2005, 20, 1080–1087. [Google Scholar] [CrossRef]
  8. Tomaszewski, M.; Ruszczak, B.; Michalski, P.; Zator, S. The study of weather conditions favourable to the accretion of icing that pose a threat to transmission power lines. Int. J. Crit. Infrastruct. Prot. 2019, 25, 139–151. [Google Scholar] [CrossRef]
  9. Han, S.; Li, D.; Li, K.; Wu, H.; Gao, Y.; Zhang, Y.; Yuan, R. Analysis and Study of Transmission Line Icing Based on Grey Correlation Pearson Combinatorial Optimization Support Vector Machine. Measurement 2024, 236, 115086. [Google Scholar] [CrossRef]
  10. Snaiki, R.; Jamali, A.; Rahem, A.; Shabani, M.; Barjenbruch, B.L. A metaheuristic-optimization-based neural network for icing prediction on transmission lines. Cold Reg. Sci. Technol. 2024, 224, 104249. [Google Scholar] [CrossRef]
  11. Makkonen, L.; Zhang, J.; Karlsson, T.; Tiihonen, M. Modelling the Growth of Large Rime Ice Accretions. Cold Reg. Sci. Technol. 2018, 151, 133–137. [Google Scholar] [CrossRef]
  12. Qing, H.; Jian, Z.; Mengyan, D.; Dongmei, D.; Makkonen, L.; Tiihonen, M. Rime icing on bundled conductors. Cold Reg. Sci. Technol. 2019, 158, 230–236. [Google Scholar] [CrossRef]
  13. Liang, X.; Li, Y.; Zhang, Y.; Liu, Y. Time-dependent Simulation Model of Ice Accretion on Transmission Line. High Volt. Eng. 2014, 2, 336–343. [Google Scholar] [CrossRef]
  14. Zhu, Y.C.; Shu, X.; Tian, Y.; Xie, S.L.; Zhang, Y.; Liu, Y.P. Research on the Improvement Method of OPGW Ground Uneven Icing Calculation Model under Micro-terrain. Electr. Power 2023, 56, 55–63. [Google Scholar] [CrossRef]
  15. Yang, J.; Wang, K.; Liu, C.; Du, P. Research on method and device of overhead ground wire resonance deicing. J. Univ. Electron. Sci. Technol. China 2025, 54, 832–839. [Google Scholar] [CrossRef]
  16. Hu, Y.; Chi, M.; Jiang, X.; Xian, R.; Liu, X.; Geng, K. Movement Characteristics of Supercooled Water Droplets Under AC and DC Electric Fields and Its Effect on Rime Ice Accretion on the Insulator. High Volt. Eng. 2025, 51, 1663–1673. [Google Scholar] [CrossRef]
  17. Gao, Y.; Hu, Y.; Jiang, X.L.; Xian, R.C.; Li, L.Z. Influence of AC Electric Field on the Movement of Charged Water Droplets and Glaze Ice Accretion on the Insulator. Power Syst. Technol. 2025, 49, 4438–4447. [Google Scholar] [CrossRef]
  18. Han, X.; Jiang, X. Effect of DC electric field on water droplets’ movement and icing process on insulator. Cold Reg. Sci. Technol. 2019, 164, 102780. [Google Scholar] [CrossRef]
  19. Zhou, C.; Sun, J.F. Collision Coefficient of Ultra-high-voltage Transmission Lines under Direct Current Electric Field. Sci. Technol. Eng. 2022, 22, 15641–15649. [Google Scholar] [CrossRef]
  20. He, G.; Cai, D.; Huang, H.; Yang, X.; Yang, C.; Wang, S.; Hu, Q. The corona loss and audible noise characteristics of rime-covered conductors formed in different positive DC electric field strength. Electr. Power Syst. Res. 2026, 252, 112431. [Google Scholar] [CrossRef]
  21. Wu, H.; Han, X.; Jiang, X.; Guo, S. Analysis of Anti-Icing Characteristics of Expanded Diameter Conductor Based on Water Droplet Collision and Freezing Efficiency. Trans. China Electrotech. Soc. 2023, 38, 3033–3040+3051. [Google Scholar] [CrossRef]
  22. Yin, F.; Masoud, F.; Jiang, X. The Influence of Electric Field on the Collision Efficiency of Water Droplets. In Proceedings of the 17th International Workshop on Atmospheric Icing of Structures, Chongqing, China, 25–29 September 2017; pp. 421–424. [Google Scholar]
  23. Han, X.; Jiang, X.; Bi, C.; Yang, Z.; Huang, Y. Prediction of Icing Environment Parameters Based on Decentralized Rotating Conductors. Trans. China Electrotech. Soc. 2019, 34, 1096–1105. [Google Scholar] [CrossRef]
  24. Makkonen, L. A Model of Icicle Growth. J. Glaciol. 1988, 34, 64–70. [Google Scholar] [CrossRef][Green Version]
Figure 1. Typical layout of conductors and grounds for a ±800 kV UHVDC line.
Processes 14 01757 g001
Figure 2. 800 kV UHVDC line calculation domain and grid division.
Processes 14 01757 g002
Figure 3. Schematic diagram of DC ground wire icing.
Processes 14 01757 g003
Figure 4. Calculation of droplet motion trajectory using coupling of ground wire external flow field and electric field.
Processes 14 01757 g004
Figure 5. Calculation domain of ground wire outflow field.
Processes 14 01757 g005
Figure 6. Schematic diagram for calculating the collision coefficient of water droplets on the ground wire surface.
Processes 14 01757 g006
Figure 7. Comparison of trajectories of charged and uncharged water droplets outside the ground wire (V = 3 m/s).
Processes 14 01757 g007
Figure 8. Comparison of trajectories of charged and uncharged water droplets outside the ground wire (V = 8 m/s).
Processes 14 01757 g008
Figure 9. Local water droplet collision coefficient β1 on the surface of the ground wire.
Processes 14 01757 g009
Figure 10. Overall water droplet collision coefficient α1 on the surface of the ground wire.
Processes 14 01757 g010
Figure 11. Energy balance during ground wire icing process.
Processes 14 01757 g011
Figure 12. Icing shapes of the ground wire under different water droplet sizes (V = 3 m/s).
Processes 14 01757 g012aProcesses 14 01757 g012b
Figure 13. Icing shapes of the ground wire under different water droplet sizes (V = 8 m/s).
Processes 14 01757 g013
Figure 14. Icing rate on grounding wires.
Processes 14 01757 g014
Figure 15. The icing shape of the ±800 kV ground wire.
Processes 14 01757 g015
Table 1. Comparison of previous conductor/ground wire icing models with the present work.
ReferenceElectric
Field
Considered
Ground Wire SpecificKey BenefitsLimitations
Makkonen [11] (2018)NoNoSimple, widely used; defines collision, sticking, accretion coefficientsNo electric field effect; no ice morphology evolution
He et al. [12]. (2019)NoNoImproved collision coefficient calculation for bundled conductorsElectric field effect neglected
Han et al. [18]. (2019)YesNoAccounts for droplet trajectory deviation under DC fieldFocuses on insulators, not ground wires
Zhou et al. [19]. (2022)YesNoConsiders electric field influence on droplet collisionOnly collision coefficient, no full ice morphology simulation
Wu et al. [21]. (2023)NoNoProvides droplet collision and freezing efficiencyNo electric field coupling
Present workYesYesFully coupled flow and DC electric field; simulates ice morphology evolution; validated by field observations; reveals leeward-side icing and ice tip effects2D assumption; torsional effect neglected; quantitative validation pending
Table 2. Conductor parameters of ±800 kV DC transmission line (Tebian Electric Apparatus Stock Co., Ltd., Changji City, Xinjiang, China).
Conductor TypeAluminum-Strand/mmSteel-Strand/mmAluminum Area/mm2Steel Area/mm2Total Area/mm2Outer Diameter/mmHeight Above Ground/mBundle Spacing/mPole Spacing/m
6×JL1/G2A-1000/8084/3.8919/2.34998.3281.711080.0342.82180.520.45
Table 3. Ground wire parameters of ±800 kV DC transmission line (Tebian Electric Apparatus Stock Co., Ltd., Changji City, Xinjiang, China).
Ground Wire TypeSteel-Strand/mmAluminum Area/mm2Steel Area/mm2Total Area/mm2Height/mSpacing/mOuter Diameter/mmHeight Above Ground/m
JLB20A-15019/3.15 3711114833.522.4615.7533.5
Disclaimer/Publisher’s Note: The statements, opinions and data contained in all publications are solely those of the individual author(s) and contributor(s) and not of MDPI and/or the editor(s). MDPI and/or the editor(s) disclaim responsibility for any injury to people or property resulting from any ideas, methods, instructions or products referred to in the content.