Article

Numerical Investigation of Flow and Heat Transfer Characteristics on Tubes with Triangular Internal Fins
1
State Key Laboratory of Materials-Oriented Chemical Engineering, College of Chemical Engineering, Jiangsu National Synergetic Innovation Center for Advanced Materials, Nanjing Tech University, Nanjing 211816, China
2
College of Mechanical and Power Engineering, Nanjing Tech University, Nanjing 211816, China
*
Author to whom correspondence should be addressed.
Processes 2026, 14(11), 1748; https://doi.org/10.3390/pr14111748
Submission received: 17 April 2026 / Revised: 21 May 2026 / Accepted: 26 May 2026 / Published: 27 May 2026
(This article belongs to the Special Issue Advances in Heat Transfer and Fluid Dynamics of Energy Systems)

Abstract

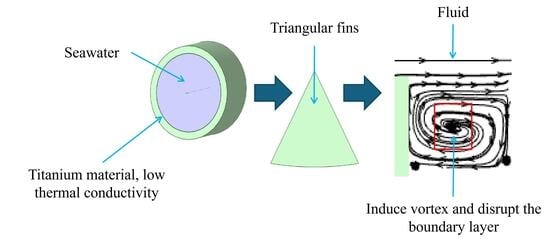
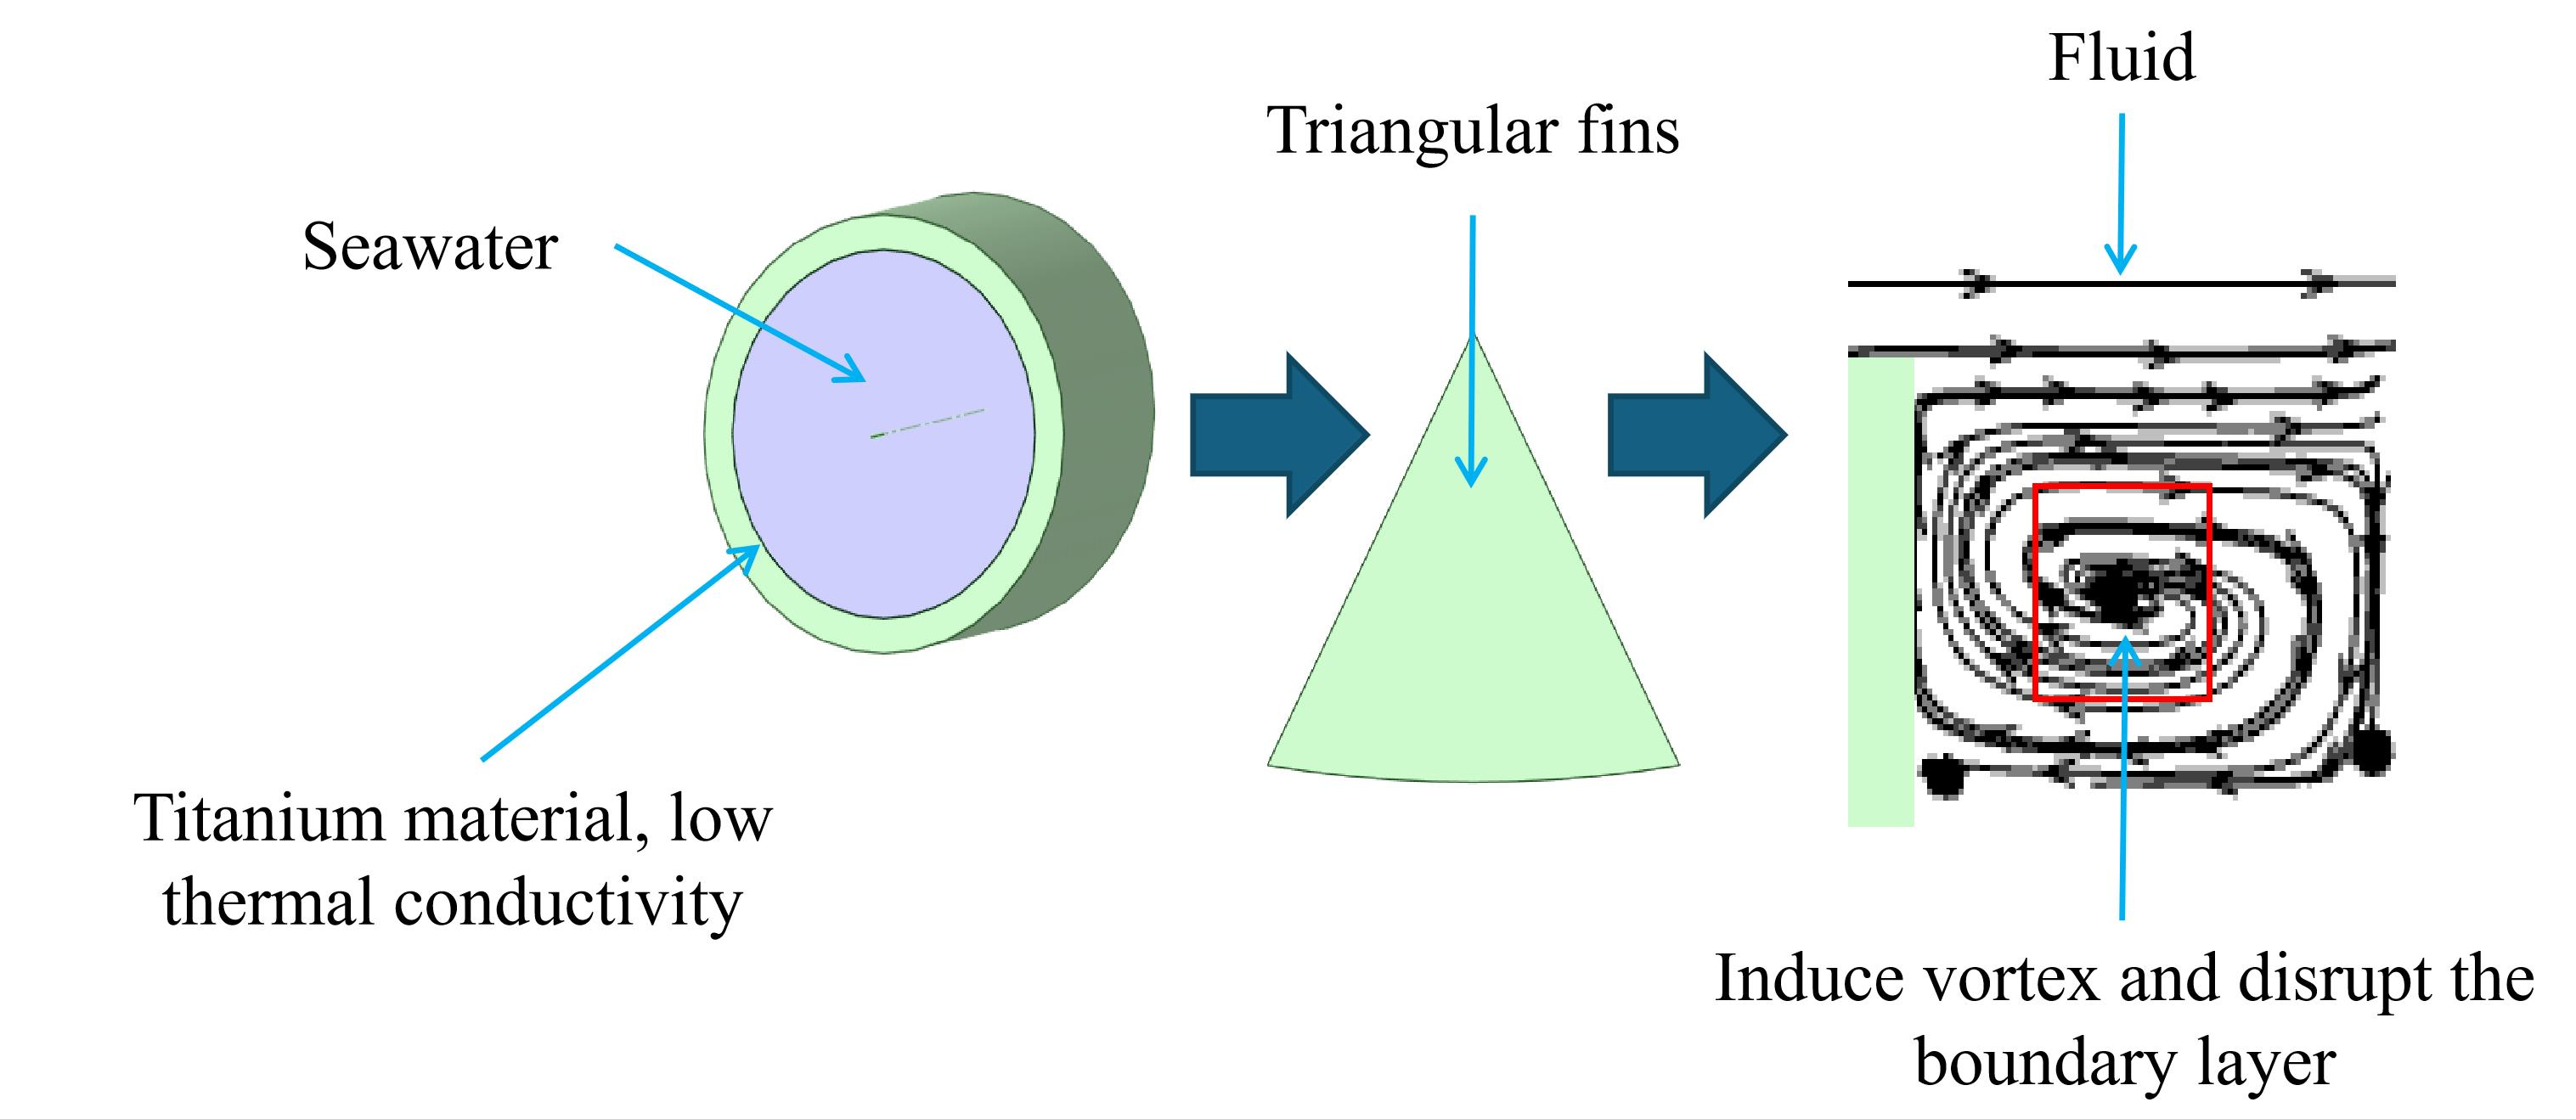
To overcome the low heat-transfer efficiency on the seawater side of the intermediate fluid vaporizer (IFV), a triangular inner-finned heat-transfer enhancement tube suitable for low to medium-flow-velocity conditions was designed. The influence of triangular internal fins’ axial spacing, height, radial arrangement number, and inclination angle on the flow and heat transfer characteristics inside the tube was numerically investigated. The tube performance was evaluated and optimized by performance evaluation criteria (PEC). The results indicated that triangular internal fins induced vortex structures, which disrupted the boundary layer, thereby enhancing momentum and energy exchange between the hot fluid within the boundary layer and the cold fluid outside it. Heat transfer was improved with reduced fin distance, increased height, and increased the number of radial arrangements. The optimal comprehensive performance was achieved at an inclination angle of 75°. The Nusselt number (Nu) increased by 66.02%, the friction factor (f) increased by 162.23%, and PEC reached up to 1.203 when Re was 9545. The results provided a theoretical reference for the structural optimization of efficient heat-exchange tubes.

Graphical Abstract

1. Introduction

In the context of the dual carbon strategy, liquefied natural gas (LNG) has seen continuous growth in its consumption. The cold energy released by LNG had the potential for recovery [1,2,3,4,5]. The use of ORC to recover LNG cold energy has become a key way to improve the economic benefits of a liquefied natural gas receiving station [6,7]. The Intermediate Fluid Vaporizer (IFV), as the core heat-exchange equipment at this station, operated based on the phase-change cycle of intermediate fluids such as propane. It transferred the heat from seawater to LNG, completing the vaporization process of LNG [8,9]. IFV consisted of the evaporator, condenser, and thermostat. The fluid on the tube side of both the evaporator and thermostat was seawater, which played a crucial role in transferring heat to the intermediate fluid (propane) and natural gas [10,11]. However, the tube was composed of titanium materials with low thermal conductivity. This limited the thermal efficiency of IFV. Therefore, developing enhanced heat-transfer tubes that were suitable for seawater was important for improving the comprehensive performance of IFV.
Enhanced heat transfer technology was categorized into active [12,13], passive [14,15], and compound technology [16,17]. Passive technology has gained widespread application in industry due to its advantages, such as simple structure, convenient implementation, and low cost. By altering the geometric structure of the tube wall or adding internal inserts, the flow field was disturbed, thereby enhancing the heat transfer coefficient [18,19,20,21,22,23]. In recent decades, computational fluid dynamics has evolved from an auxiliary tool to an indispensable methodology in heat transfer research. Zheng et al. [24] compared one-way and two-way FSI for a supersonic cascade with ultra-thin blades at high inlet angles. Validated by experiments, two-way FSI reduced aerodynamic errors by over 50% and captured shock structures accurately. Ouyang et al. [25] analyzed the performance of two types of corrugated finned tubes: those with staggered fins and those with equidistant fins through experiments and numerical simulations. The results showed that equidistant corrugated finned tubes were superior to misaligned corrugated finned tubes. Torbarina et al. [26] studied the impact of fin pitch, fin thickness, and slot height on the slotted finned tubes. The results showed that increasing fin pitch slightly enhanced heat flux but greatly reduced pressure drop up to a point, after which further pitch increases brought no significant heat flux improvement. Also, thicker fins improved heat flux but caused a higher air-side pressure drop. Deeb et al. [27] combined circular and drop-shaped pin fins. The results showed that circular and drop-shaped pin fins are 7.33% to 37.1% and 2.93% to 54.89% higher than smooth tubes.
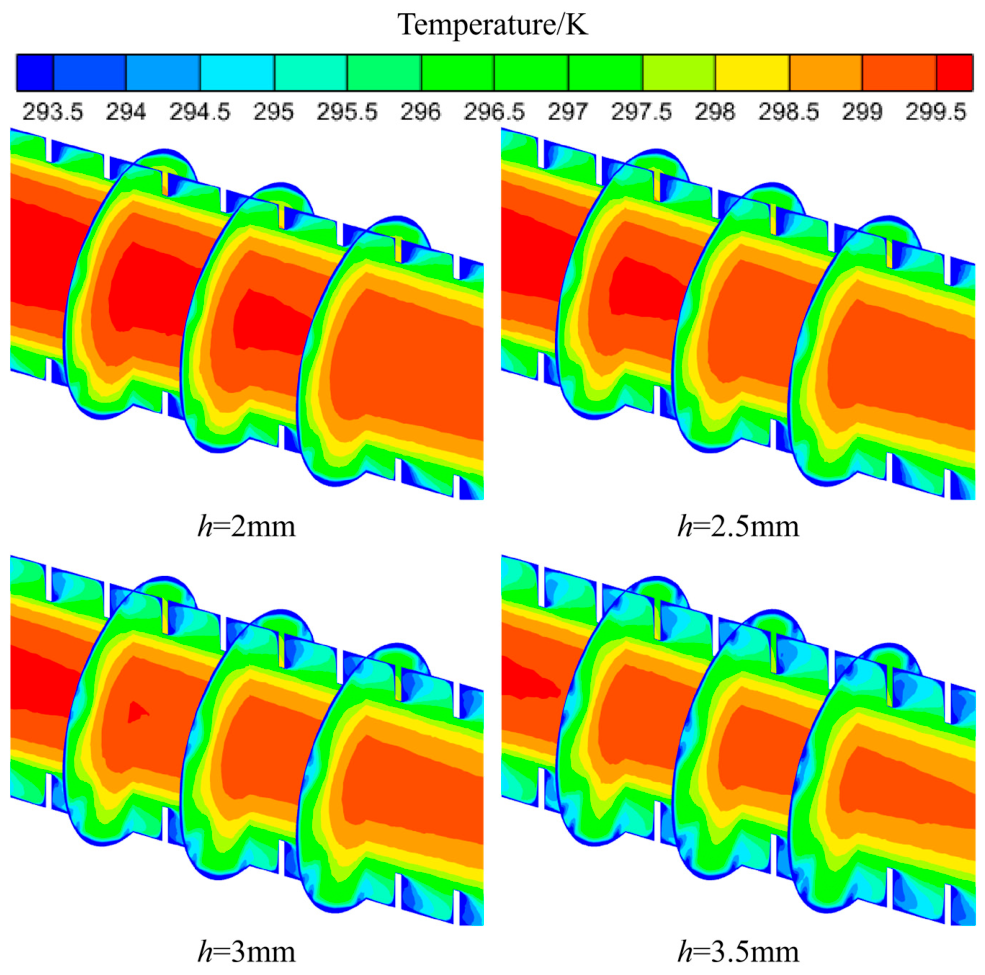
Numerous studies showed that the core of heat transfer enhancement lies in disrupting or thinning the thermal boundary layer. However, systematic research on the multiparameter synergistic mechanism and optimization rules governing comprehensive performance for triangular internal fins, a specific geometric structure with heat-transfer enhancement capabilities, was still lacking. Compared to traditional rectangular internal fins, triangular fins cause lower pressure loss [28] and exhibit excellent anti-fouling capabilities due to the absence of sharp corners where fouling tends to accumulate. Based on this, a triangular internal finned tube was proposed. This structure utilized triangular internal fins to induce vortex flow, effectively disrupting the boundary layer and promoting the exchange of hot and cold fluids, thereby significantly enhancing convective heat transfer performance.
This paper investigated the impact of key structural parameters on the performance of triangular inner finned tubes. It elucidated the mechanism of heat transfer enhancement through a comprehensive analysis of the flow, temperature, and field synergy. The structure of inner finned tubes was evaluated and optimized by using performance evaluation criteria (PEC).

2. Physical Model and Numerical Method

2.1. Tube Model

Triangular inner fins were shown in Figure 1. The outer diameter was 25 mm and the thickness was 2 mm. The fin structure was optimized by varying axial space (l), height (h), radial arrangement number (n) and inclination angle (α) of the fins. The physical structural parameters of the triangular internal fins were listed in Table S1.

2.2. Governing Equations

The equations and the realizable k-ε turbulence equations [29] were listed:
· u = 0
ρ ( u · u ) = P + μ 2 u + F
· ( ρ u T ) = · ( λ C p T ) + S r
· ( ρ k u ) = · ( Γ k · k ) + G k + G b ρ ε Y M
· ( ρ ε u ) = · ( Γ ε · ε ) + ρ C 1 E ε ρ C 2 ε ε 2 k + v ε + C 1 ε ε k G 3 ε C b
The Coupled algorithm was employed for the coupled calculation of velocity and pressure. The QUICK scheme was used to discretize the momentum equation, while the second-order upwind scheme was used to discretize other equations. To determine whether the calculation had converged, a series of residual criteria needed to be set. When the residuals of these equations were less than 10−6, and the flow deviation at the inlet and outlet was less than 10−3, it could be considered that the calculation had reached convergence.
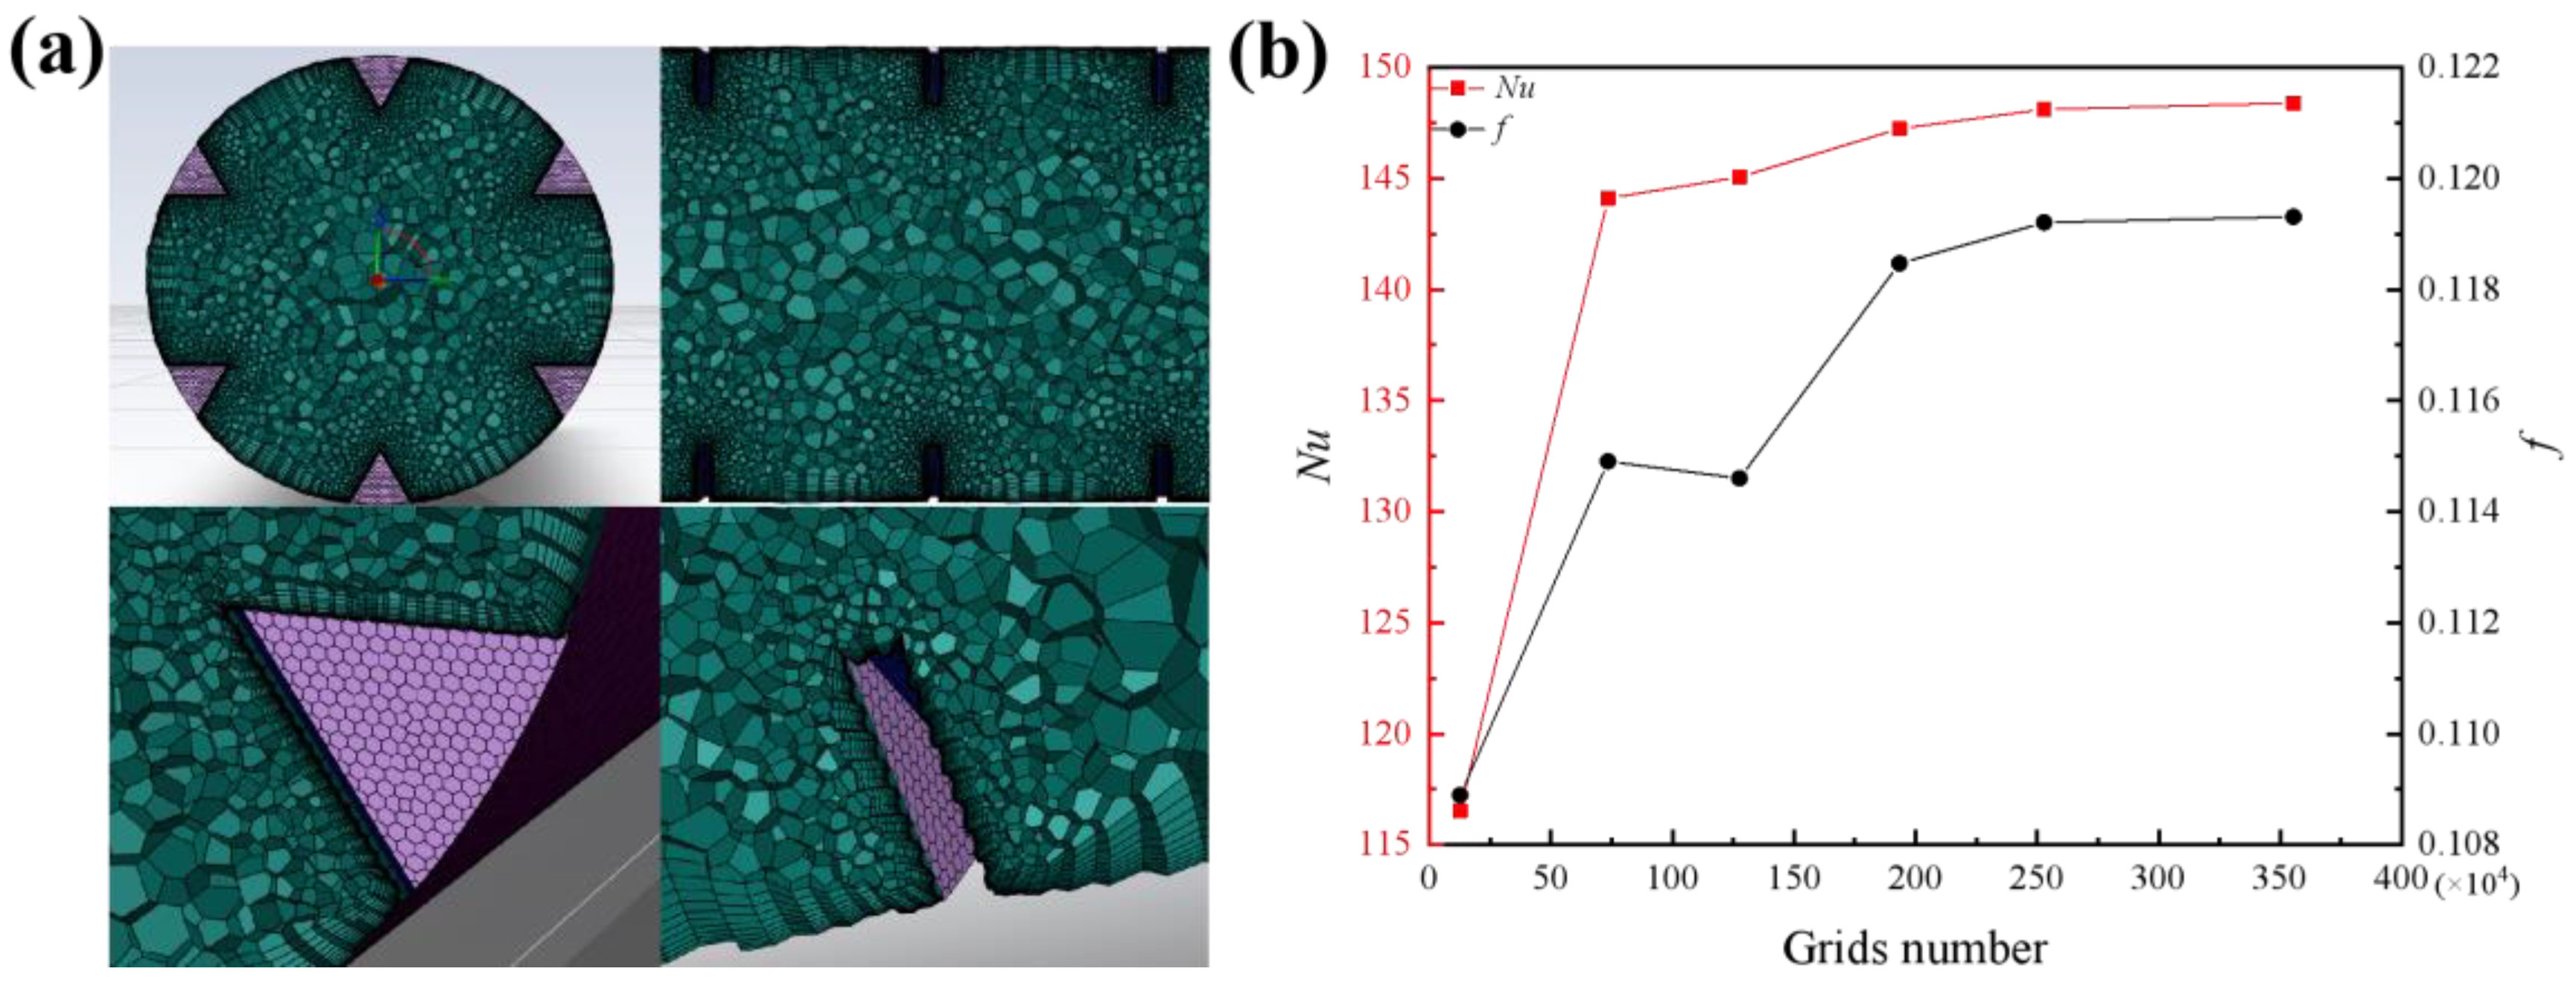
The mesh generation was performed by using Fluent meshing, with 10 boundary layers, y+ of 1, and a minimum orthogonal quality of 0.34; the maximum skewness is 0.65, as shown in Figure 2a. To examine the sensitivity of the grid size to the calculation results, different numbers of grids were used for independence verification. When the number of grids increased from 1,934,275 to 2,529,429, the change in Nu was about 0.59%, and the change in f was about 0.63%. Further increase to 3,554,744, both changed less than 0.5%. Therefore, the grid of 2,529,429 was chosen, as shown in Figure 2b. Considering the saving of computational resources, the grid count of 2,529,429 was selected.

2.3. Boundary Conditions

Numerical simulation was conducted on a single tube, with water as the working fluid. The physical property changes in water were ignored, and the direction of gravity was vertically downward. The length of the tube was 250 mm. Specific parameters were shown in Table 1.

2.4. Data Reduction

The formulas used for the processing results were shown in Equations (6)–(12):
Δ p   =   p in   p out
Δ T = ( T in T w ) ( T out T w ) In ( T in T w T out T w )
H   = Q / ( A · Δ T )
Nu   = H · D / λ
Re   = D · u in · ρ / μ
f   = 2 Δ P · D ρ u in 2 L
PEC   = Nu / N u 0 ( f / f 0 ) 1 / 3
where ΔT was logarithmic mean temperature difference; Tin, Tout, and Twall were inlet temperature, outlet temperature, and wall temperature; Q was heat exchange capacity; A was heat transfer area; H was heat transfer coefficient; λ was thermal conductivity; Re was Reynolds number; d was tube diameter; L was tube length; uin was inlet velocity; ρ was density; μ was viscosity.

2.5. Model Validation

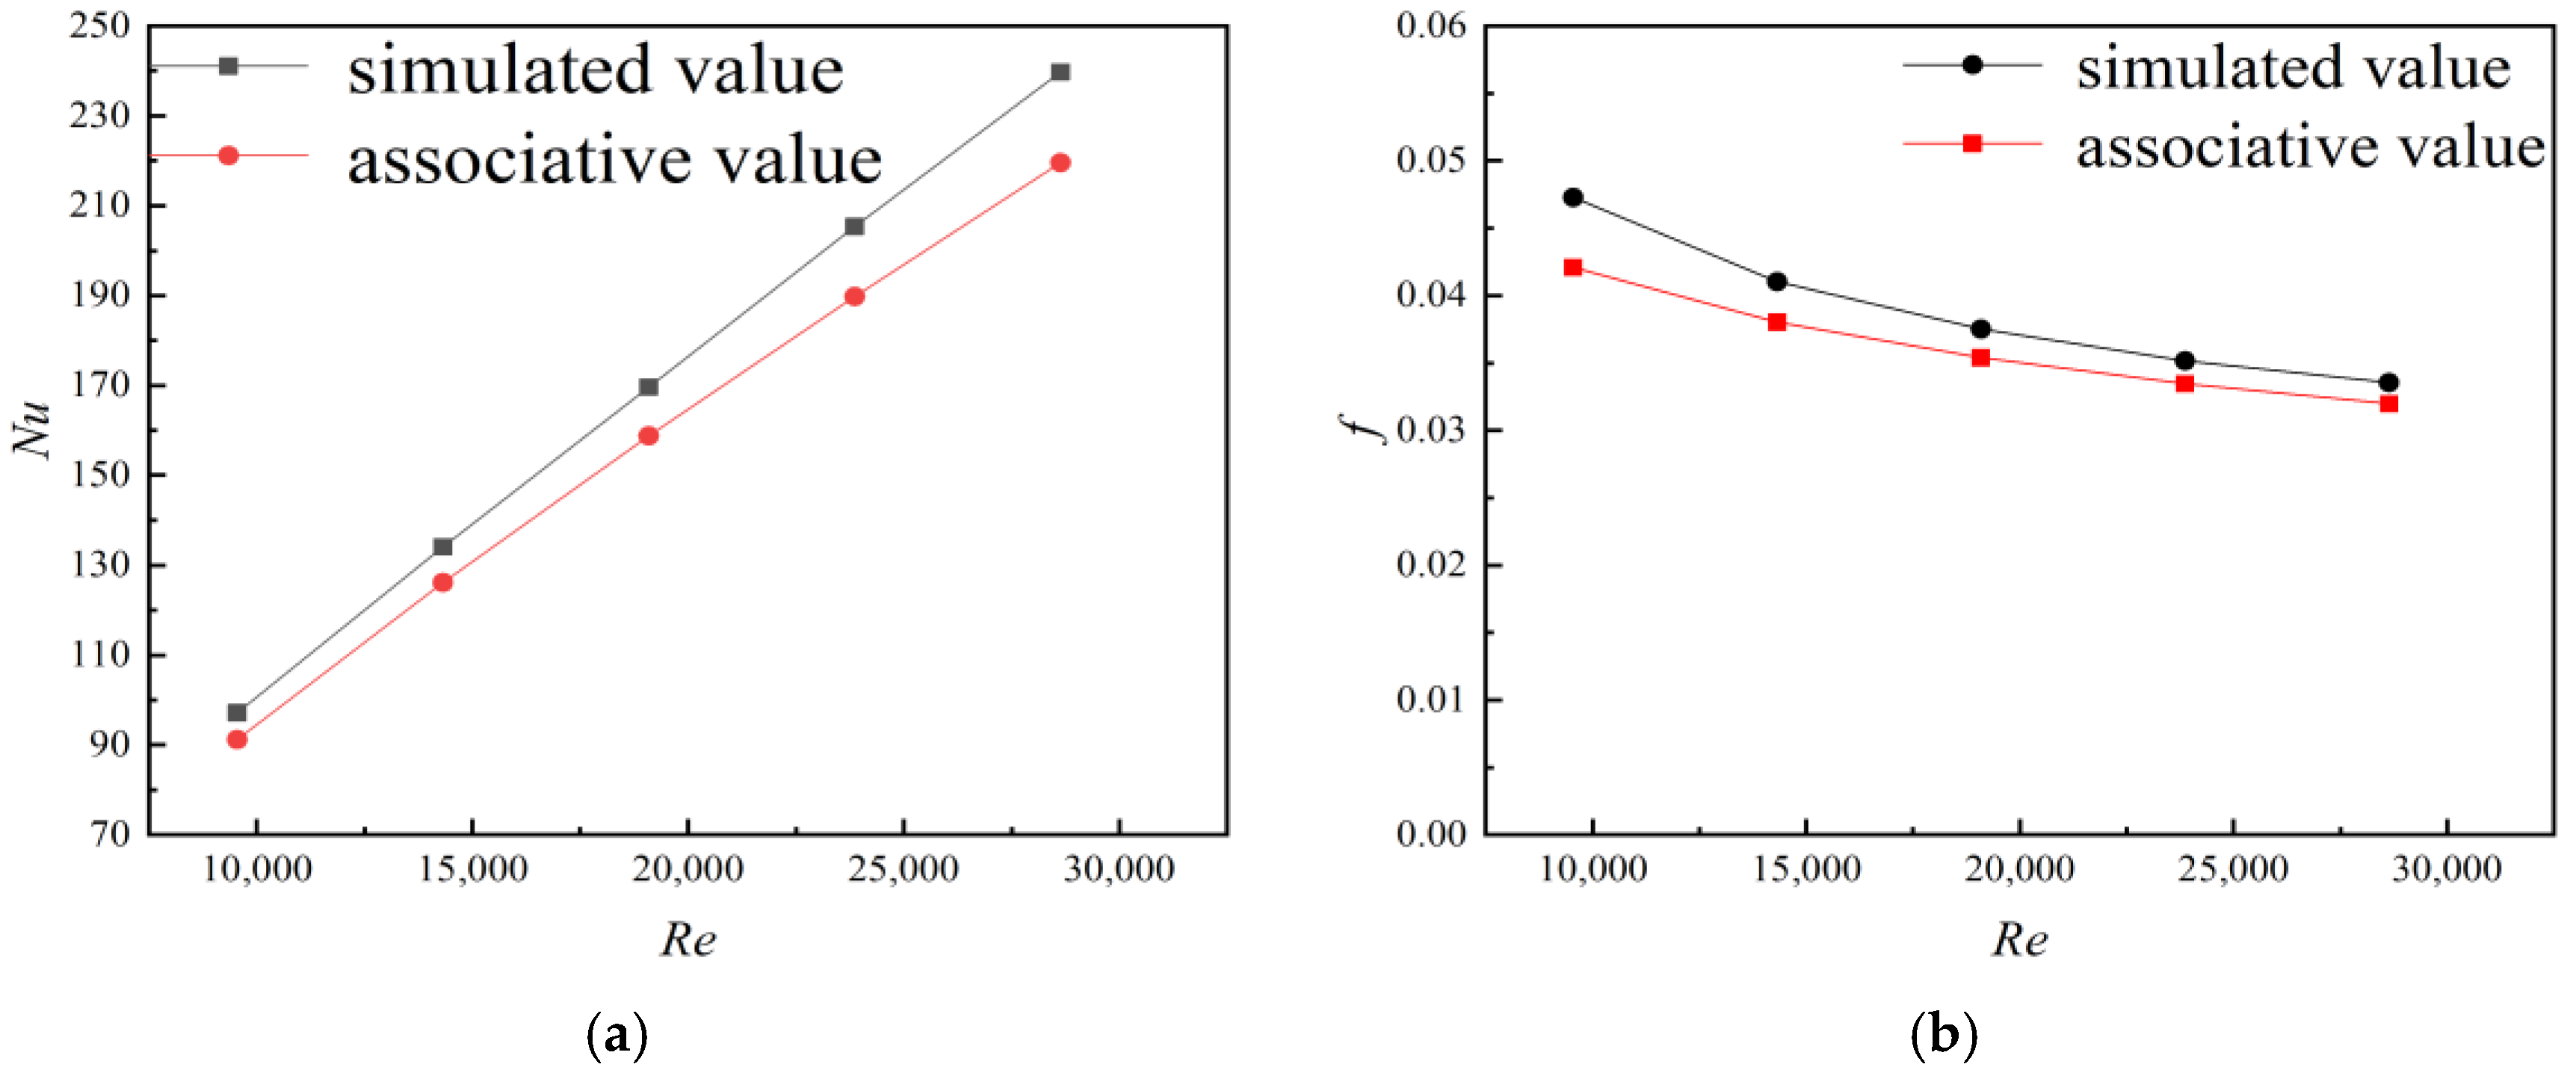
Using the same numerical method, the variation trends of Nu and f for smooth tubes under different Re were calculated and compared with the associated values, as shown in Figure 3. The calculation formula of associative value was shown in Equations (S1) and (S2). The error between the simulated value and the associative value was less than 10%, and the trend was consistent, indicating that the numerical method had good reliability.

3. Results and Discussion

3.1. The Impact of Fin Structure on the Flow and Heat Transfer Performance

As shown in Figure S1, with increasing Re, the inertial force gradually dominated the flow behavior over viscous effects. The intensified inertial effect strengthened vortex generation and secondary-flow interaction, thereby continuously disturbing the thermal boundary layer and enhancing convective heat transfer. Consequently, the Nu increased with Re. The increase in f indicated that viscous dissipation and vortex-induced energy loss became more significant due to stronger flow separation and repeated contraction-expansion processes inside the tube.
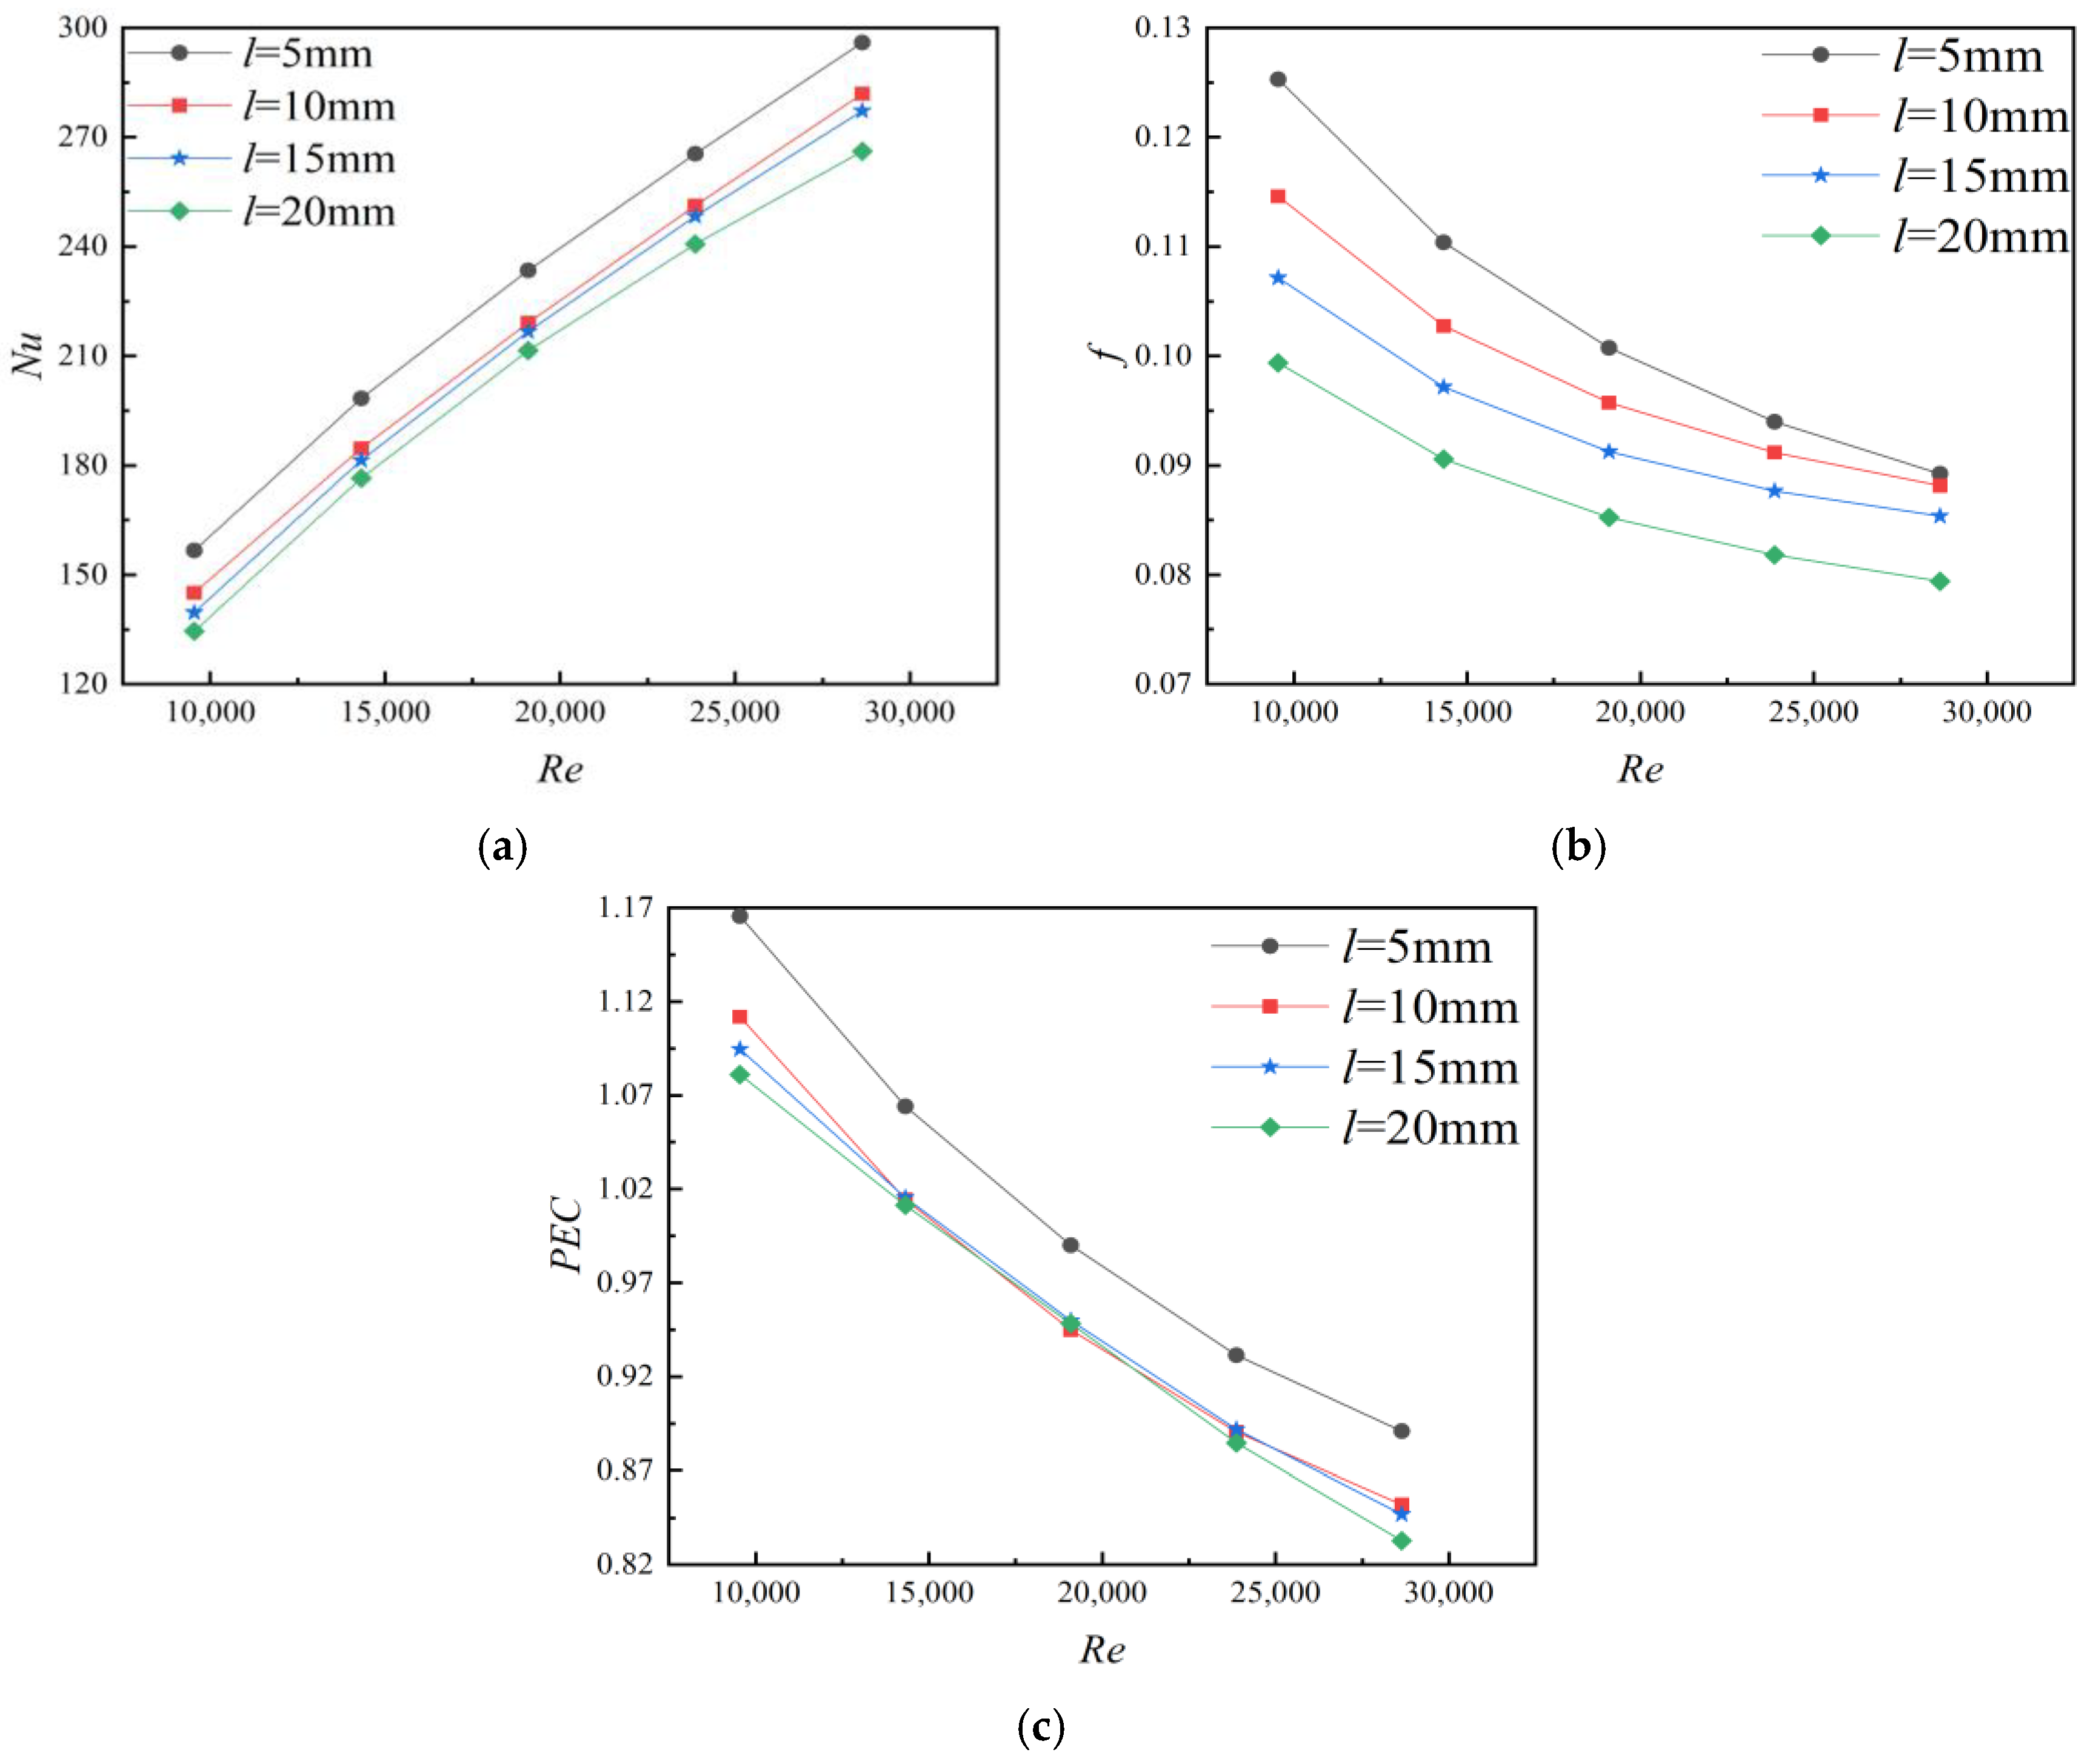
Figure 4a illustrates the impact of triangular finned tubes with varying l on Nu. Compared with smooth tubes, the heat transfer performance of triangular finned tubes was significantly improved, with Nu increasing by 14.22–60.54%. This improvement was attributed to the vortex behind the fins, which disrupted the flow boundary layer, allowing fluid adjacent to the wall to mix with the main flow and undergo heat exchange, thereby enhancing heat transfer performance [30]. As l decreased, Nu increased. This was because the generated vortex from adjacent fins began to overlap before complete dissipation, which intensified fluid mixing and suppressed redevelopment of the thermal boundary layer. The characteristic vortex interaction length became comparable to the fin space, resulting in continuous disturbance of the near-wall region. Consequently, convective transport was strengthened, and Nu increased significantly. Figure 4b illustrates the impact of triangular finned tubes with varying l on f. It could be observed from the figure that the f of the finned tubes gradually decreased with an increase in Re. The f of finned tubes was 3.11 to 3.58 times that of smooth tubes. This indicated that the presence of fins significantly increased pressure loss in the tube. This was because when the fluid passed upstream of the fins, the tube suddenly narrowed, causing the fluid velocity to increase and the pressure to rise. When the fluid passed downstream of the fins, the tube suddenly expanded, and the fluid in the mainstream region mixed with the fluid in the vortex region, forming turbulence. This reduced the fluid flow velocity and pressure [31]. Furthermore, the faster the fluid flow velocity within the tube, the more likely it is to generate a vortex with higher turbulence intensity. Figure 4c illustrates the impact of triangular finned tubes with varying l on PEC. The figure revealed that the PEC of the finned tubes decreased as Re increased. The finned tubes with l of 5 mm exhibited significantly better performance than those with other spaces. However, the reduced flow passage simultaneously increased local flow acceleration and vortex energy dissipation, leading to a substantial rise in friction factor. When Re exceeded 19,090, the pressure-loss penalty increased faster than the heat transfer enhancement, causing PEC to gradually decrease below 1 [32]. When l was larger (such as 10 mm), the vortex completely attenuated and the mixing weakened before reaching the next fin. Therefore, l = 5 mm was the equilibrium point.
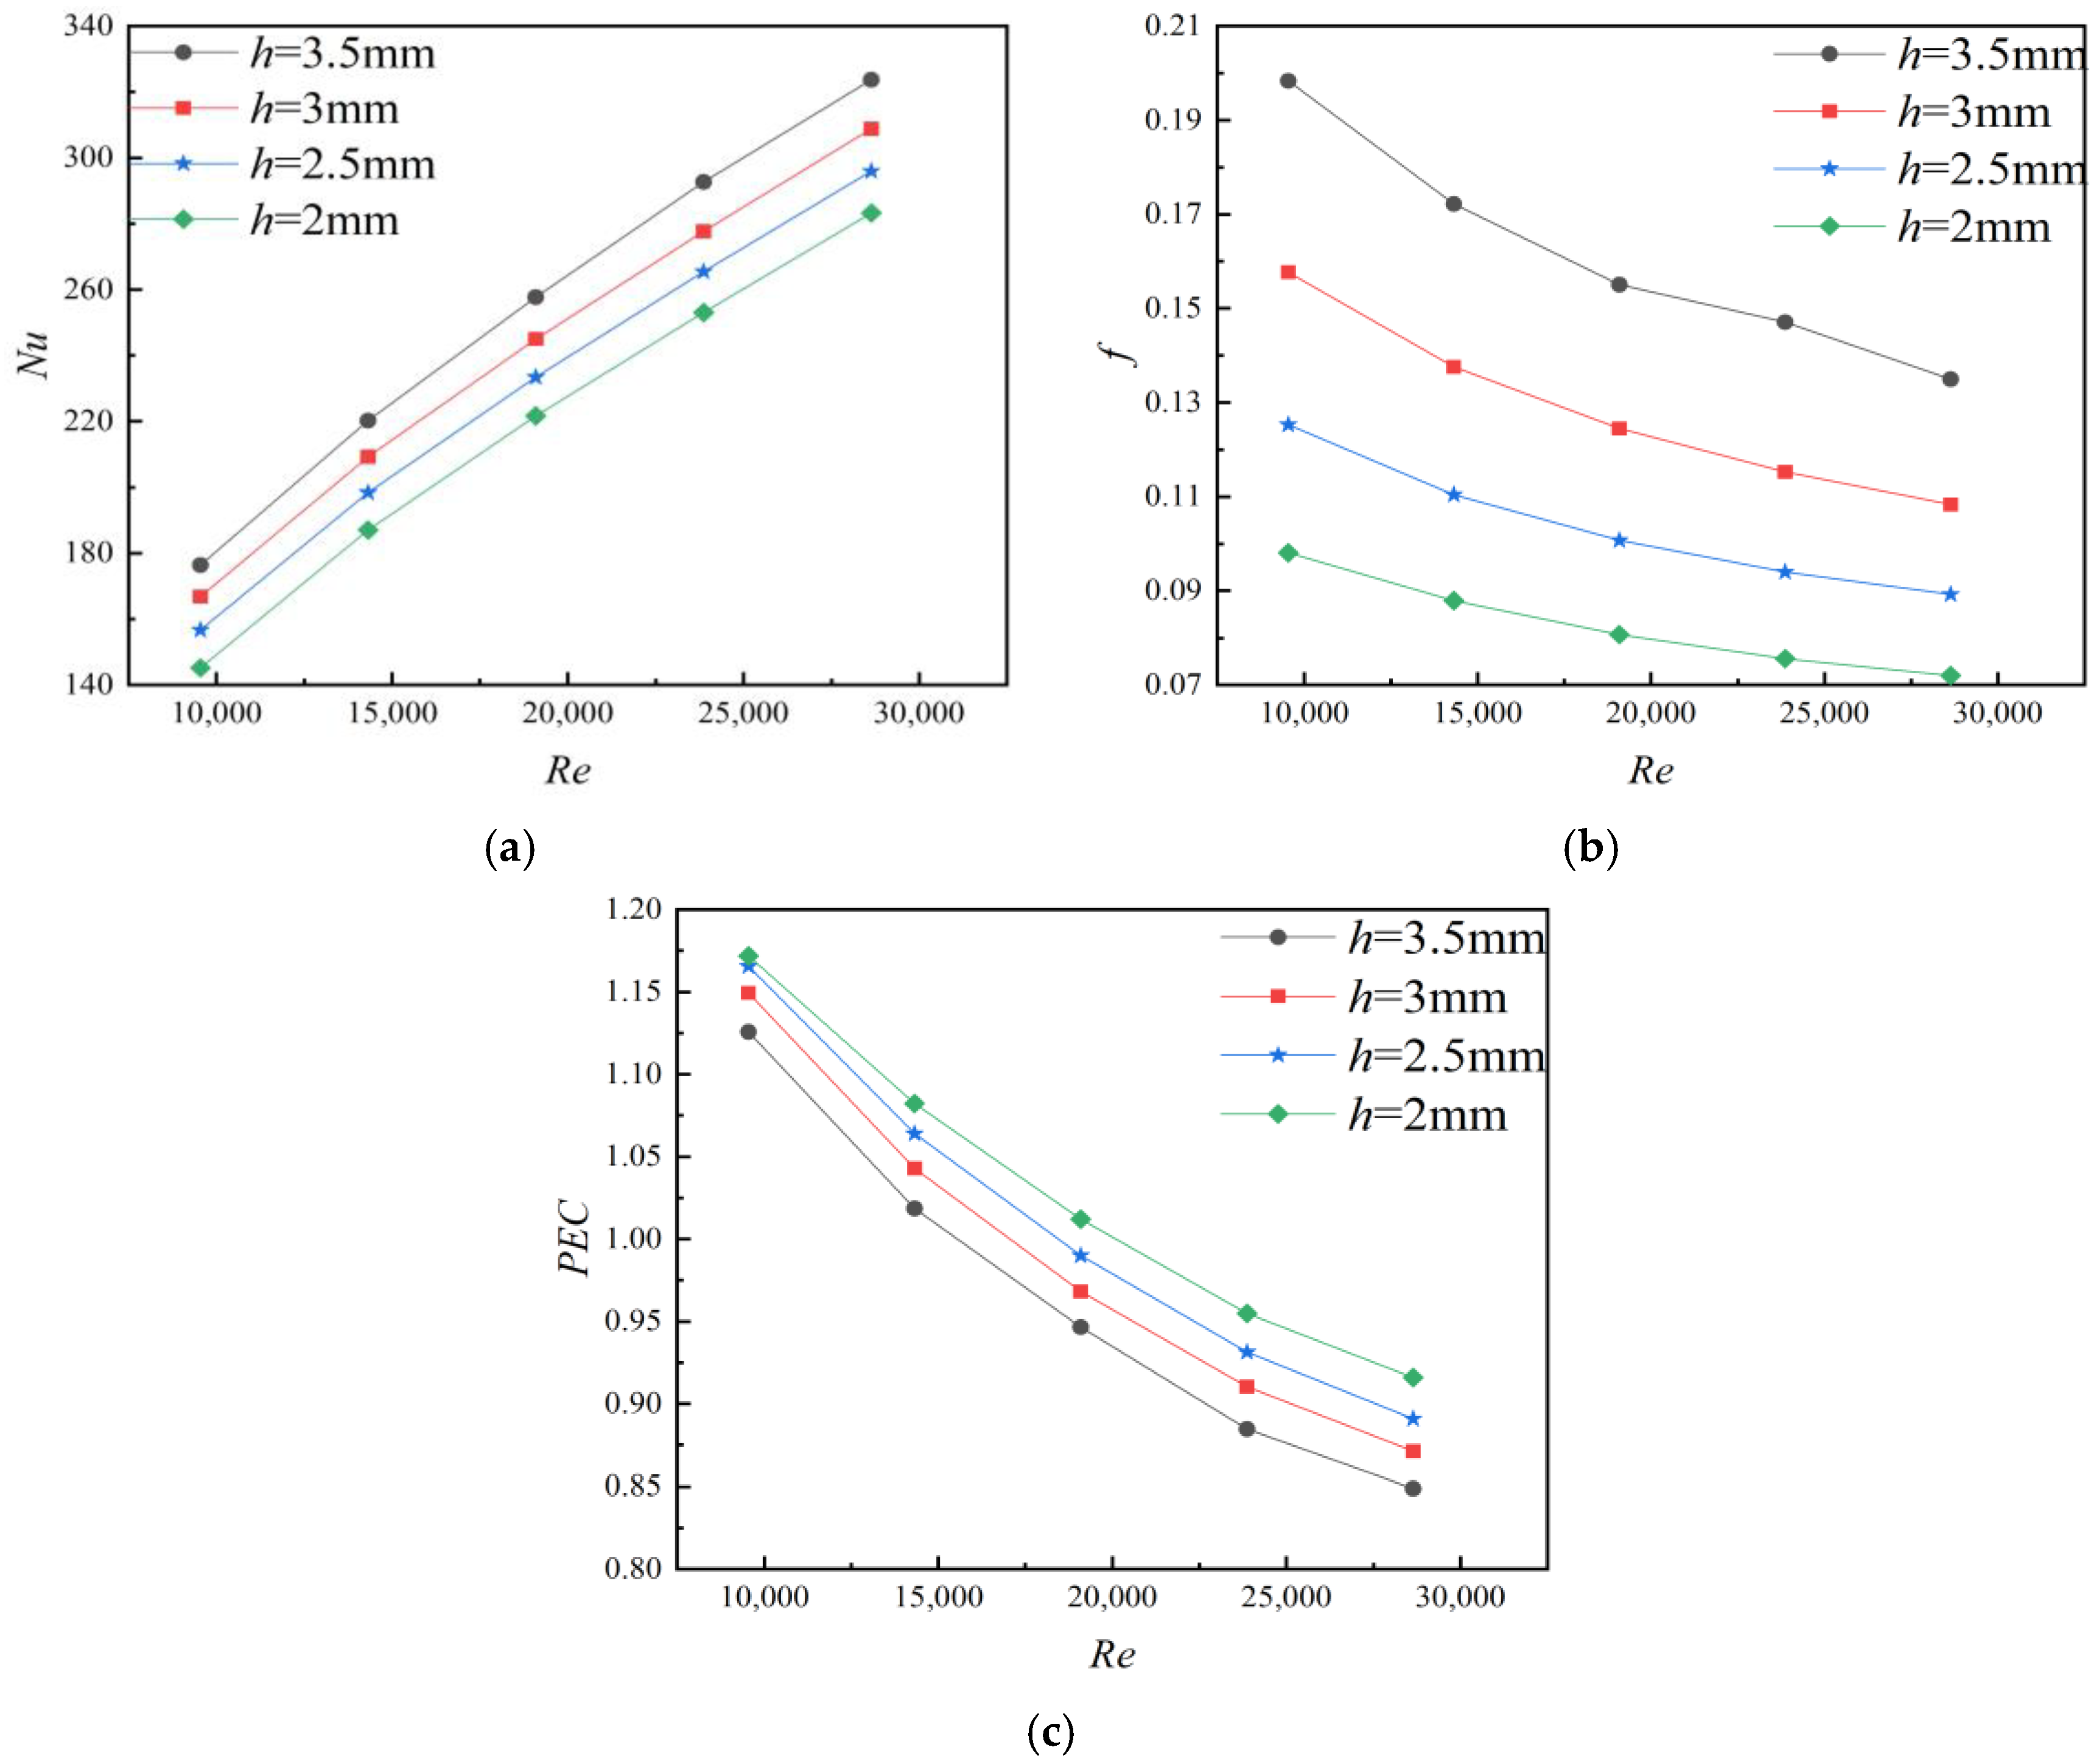
Figure 5a illustrates the impact of fins of varying h on Nu. As h increased, Nu also increased. When h increased from 2 mm to 3.5 mm, Nu increased by 14.3–21.5%. The increase in h forced most of the mainstream fluid to flow towards the core area and enhanced the secondary flow intensity near the wall. The enhanced velocity gradient promoted momentum exchange between the core flow and the boundary-layer fluid, thereby reducing the thickness of the thermal boundary layer and improving convective heat transfer. Figure 5b illustrates the impact of fins of h on f. The taller the fin, the greater f became. Compared to fins with h of 2 mm, when h was 3.5 mm, f increased by 87.54–200.02%. This indicated that h significantly increased the pressure loss of fluid within the tube. Figure 5c illustrates the impact of triangular finned tubes of varying h on PEC. It could be observed from the figure that the PEC of the finned tubes increased with an increase in Re. Nevertheless, excessive h significantly reduced the effective flow area, resulting in stronger flow separation and larger irreversible dissipation. Therefore, although Nu continued to increase, with h, f increasing more rapidly, which deteriorated the comprehensive thermal-hydraulic performance at high Re. When Re = 19,090, the PEC of the finned tubes with h of 2.5, 3, and 3.5 mm were all less than 1. When h was greater than 2.5 mm, the flow channel was prone to blockage, and pressure loss increased. When h was less than 2.5 mm, the heat transfer performance was low. So h = 2.5 mm was chosen.
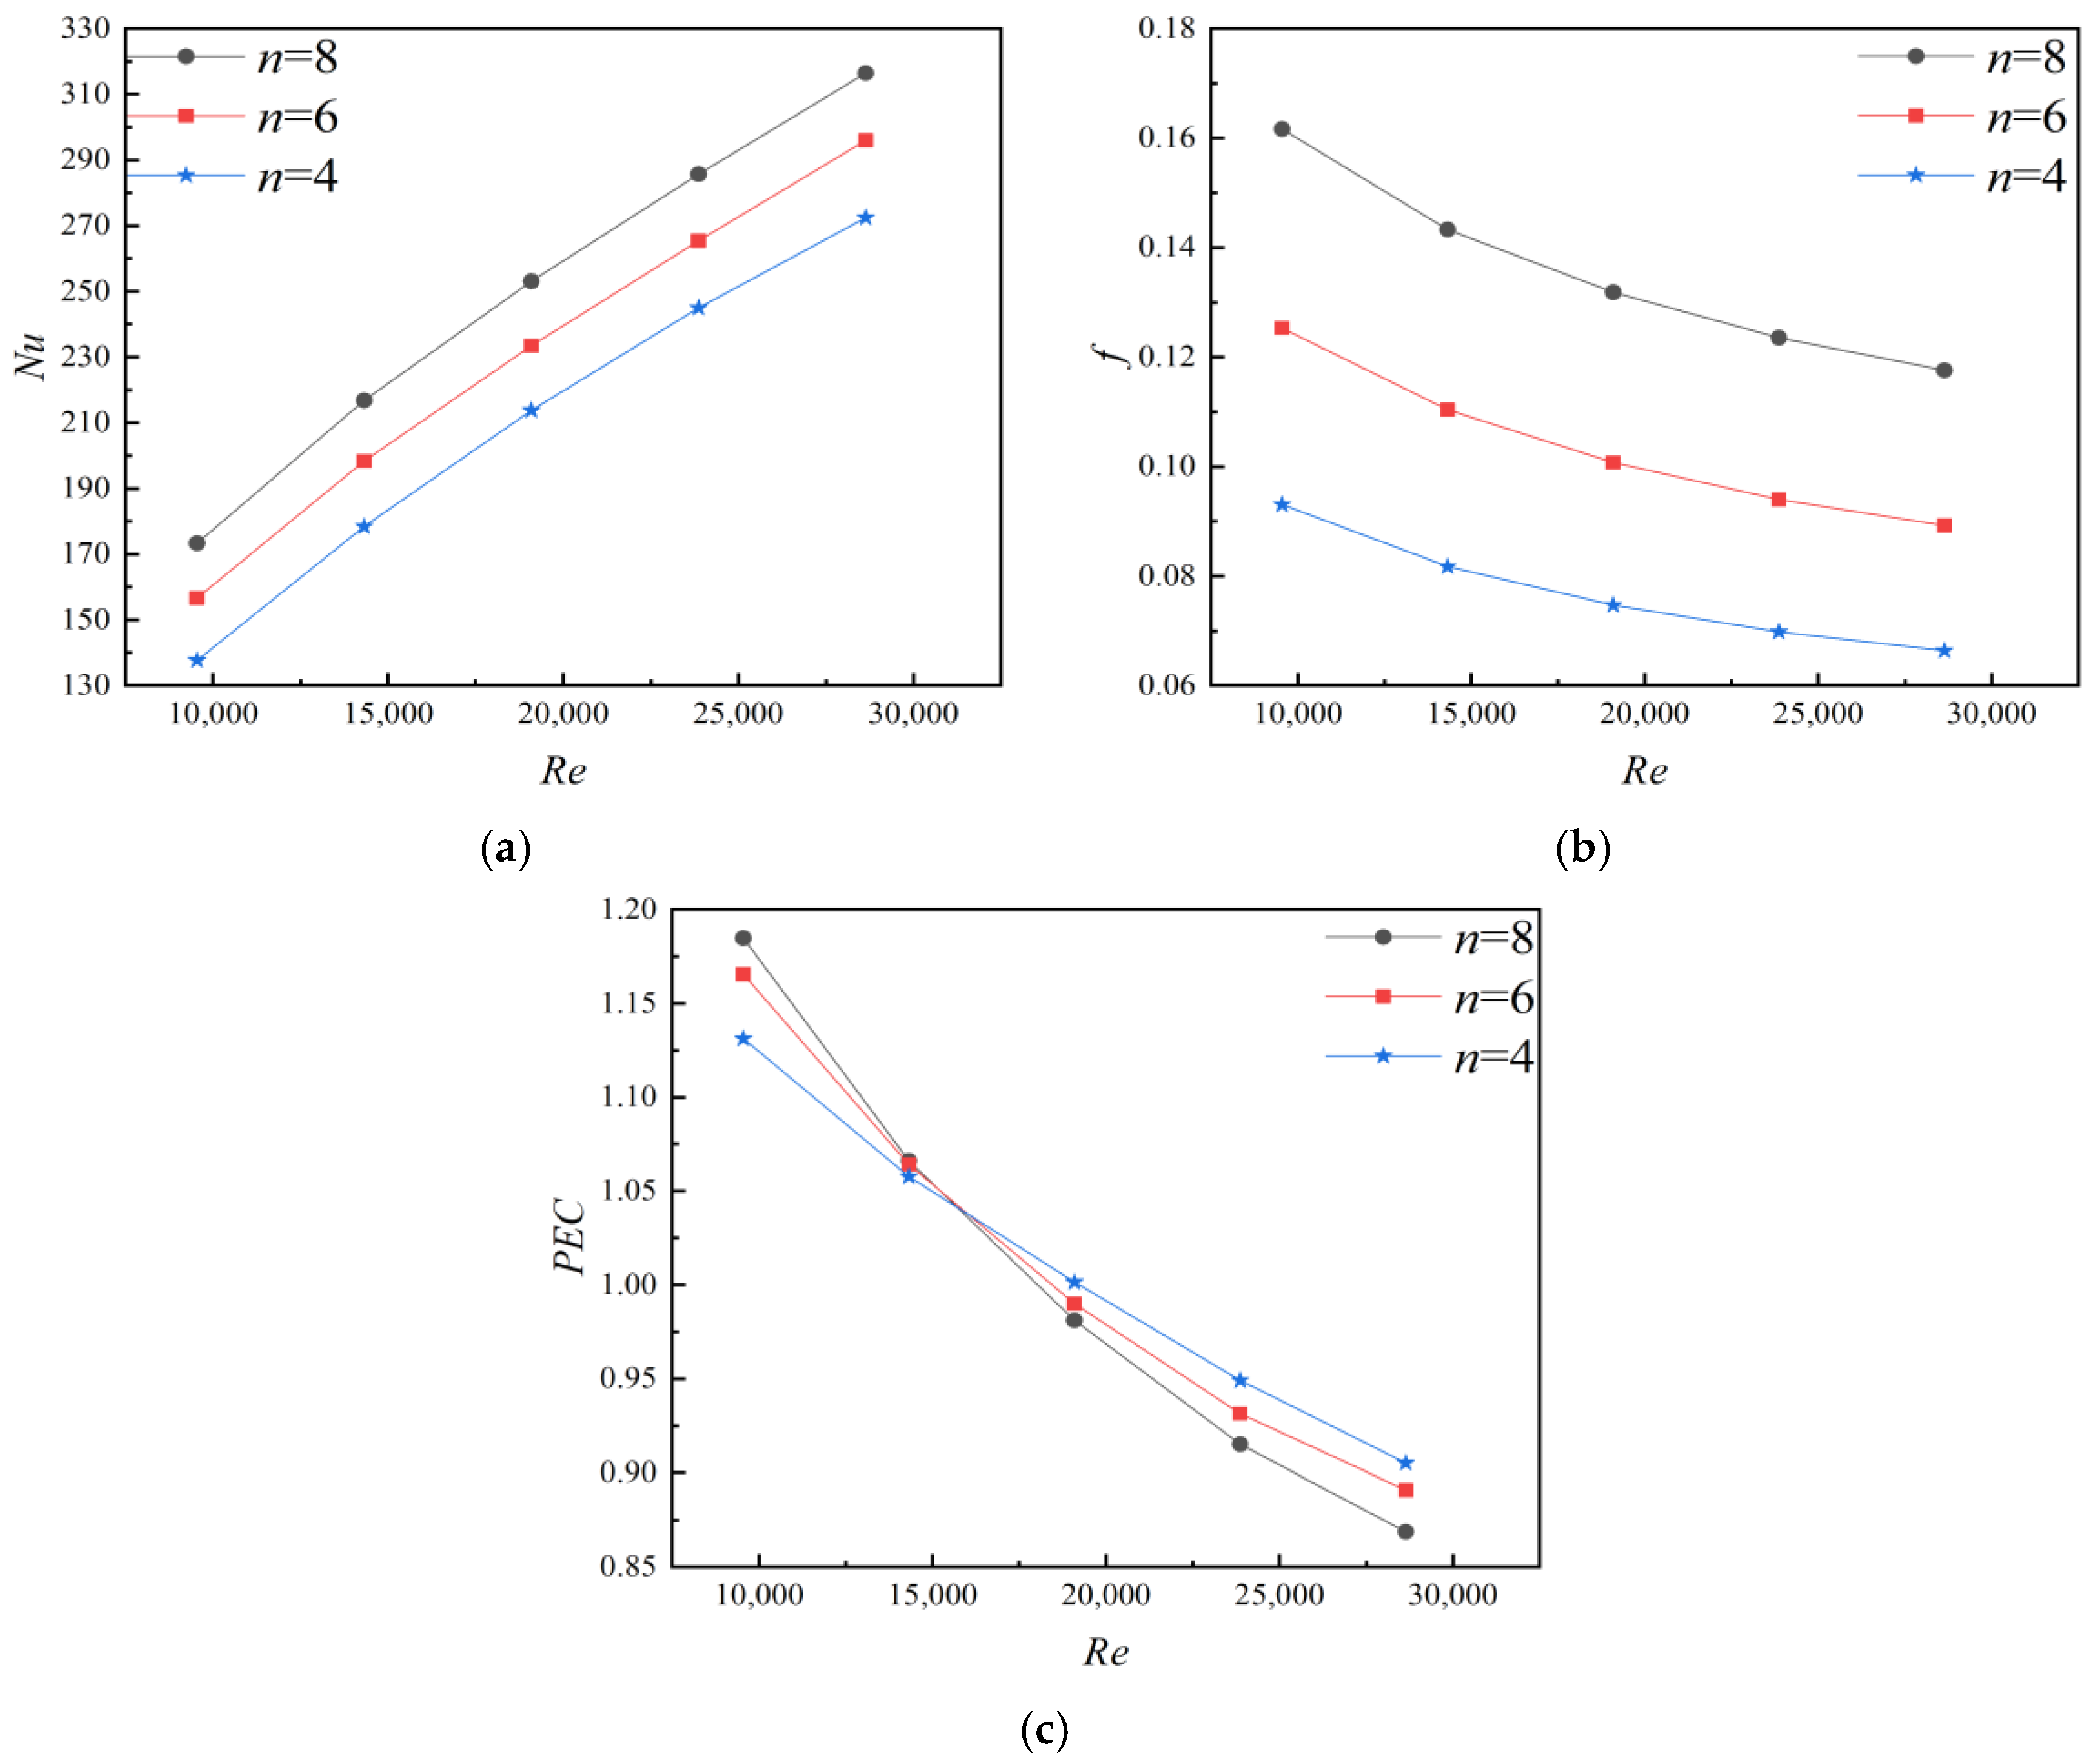
Figure 6a illustrates the impact of different n on Nu. The more n, the greater Nu became. When n increased from 4 to 8, Nu increased by 16.1–25.9%. As n increased, more vortices were generated within the tube, enhancing the interaction between the core flow and near-wall fluid. The strengthened secondary flow continuously disturbed the thermal boundary layer, promoting momentum and energy exchange and resulting in higher Nu. Figure 6b illustrates the impact of different n on f. The more n, the greater f became. When n increased from 4 to 8, f increased by 73.7–77.1%. Increasing n intensified the blockage effect and flow separation around the fins, leading to stronger vortex dissipation and larger pressure loss. Figure 6c illustrates the impact of different n on PEC. As Re increased, the overall trend of PEC decreased. When Re ranged from 19,090 to 28,635, although the performance of finned tubes with n of 4 was superior to that of finned tubes with n of 6 and 8, their PEC gradually approached 1. When n was greater than 6, the flow cross-section of the channel was reduced, the channel was prone to blockage, and the pressure loss was greater. When n was less than 6, the heat transfer performance was low. So n = 6 was chosen.
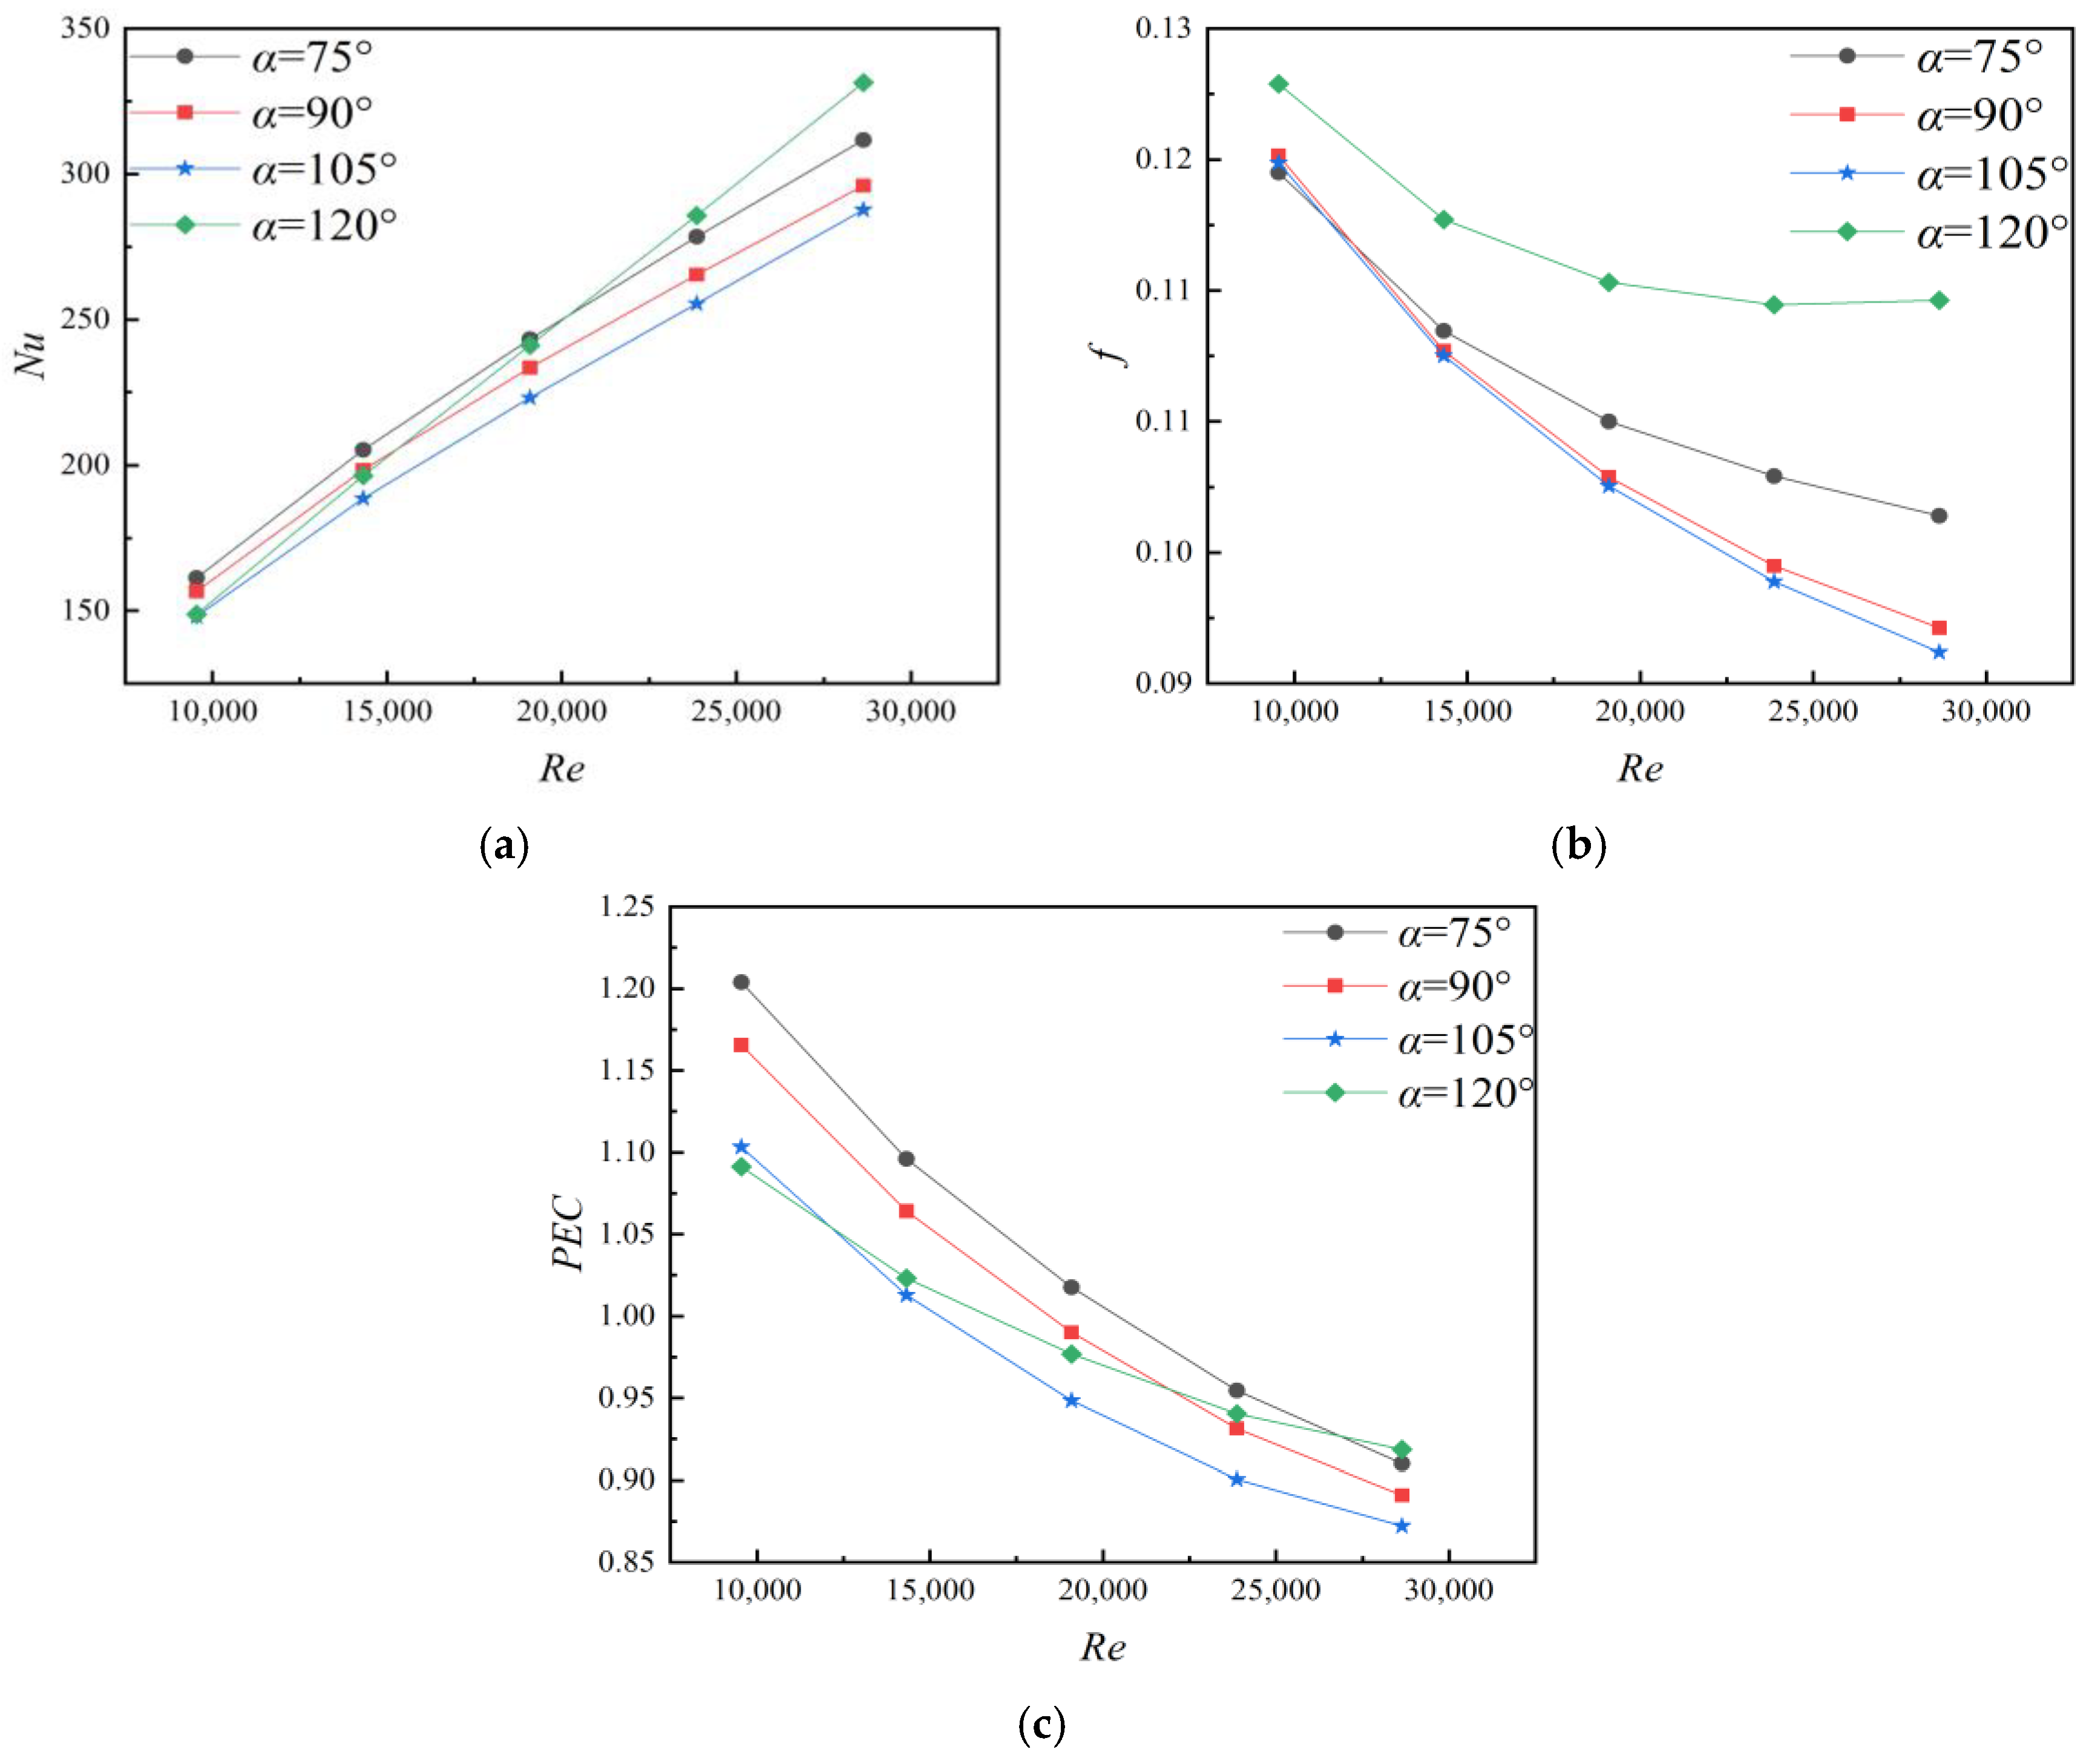
Figure 7a illustrates the impact of different α on Nu. When α increased from 75° to 105°, Nu gradually decreased. When α was 120°, Nu increased at the fastest rate, gradually surpassing the fins with the other three α values. The α significantly affected the vortex structure and secondary flow intensity inside the tube. At smaller α, stronger transverse flow and vortex mixing enhanced the interaction between the mainstream and near-wall fluid, thereby continuously disrupting the thermal boundary layer and improving heat transfer. As α increased, the vortex region gradually moved closer to the wall, and the secondary flow intensity weakened, resulting in reduced momentum and energy exchange and a decrease in Nu. However, when α was 120°, the enlarged flow separation region generated additional recirculation structures, causing Nu to rise again at high Re. Figure 7b illustrates the impact of different α on f. With the increase in α, f first decreased and then increased. When α was 90° and 105°, the values of f were very close. When α was 120°, the decreasing trend of f gradually became less pronounced as Re increased. Figure 7c illustrates the impact of different α on PEC. When Re = 9545, PEC was 1.203, and when Re > 19,090, the PEC gradually became lower than 1, indicating a gradual weakening of the enhancement effect. When α = 75°, the f was relatively low, Nu was high, and the value of PEC was the highest. So α = 75° was selected as the optimal structural parameter.
The heat-transfer enhancement mechanism could be interpreted as a competition between inertial forces, viscous effects, and thermal diffusion. With increasing Re, inertial force dominated the flow behavior, leading to stronger vortex generation and thinner thermal boundary layers, thereby increasing Nu. However, the intensified flow separation and recirculation simultaneously amplified viscous dissipation and pressure loss. Therefore, the thermal-hydraulic performance of the finned tube was governed by the balance between heat transfer enhancement and hydraulic resistance.

3.2. The Impact of Fin Structure on Flow Characteristics

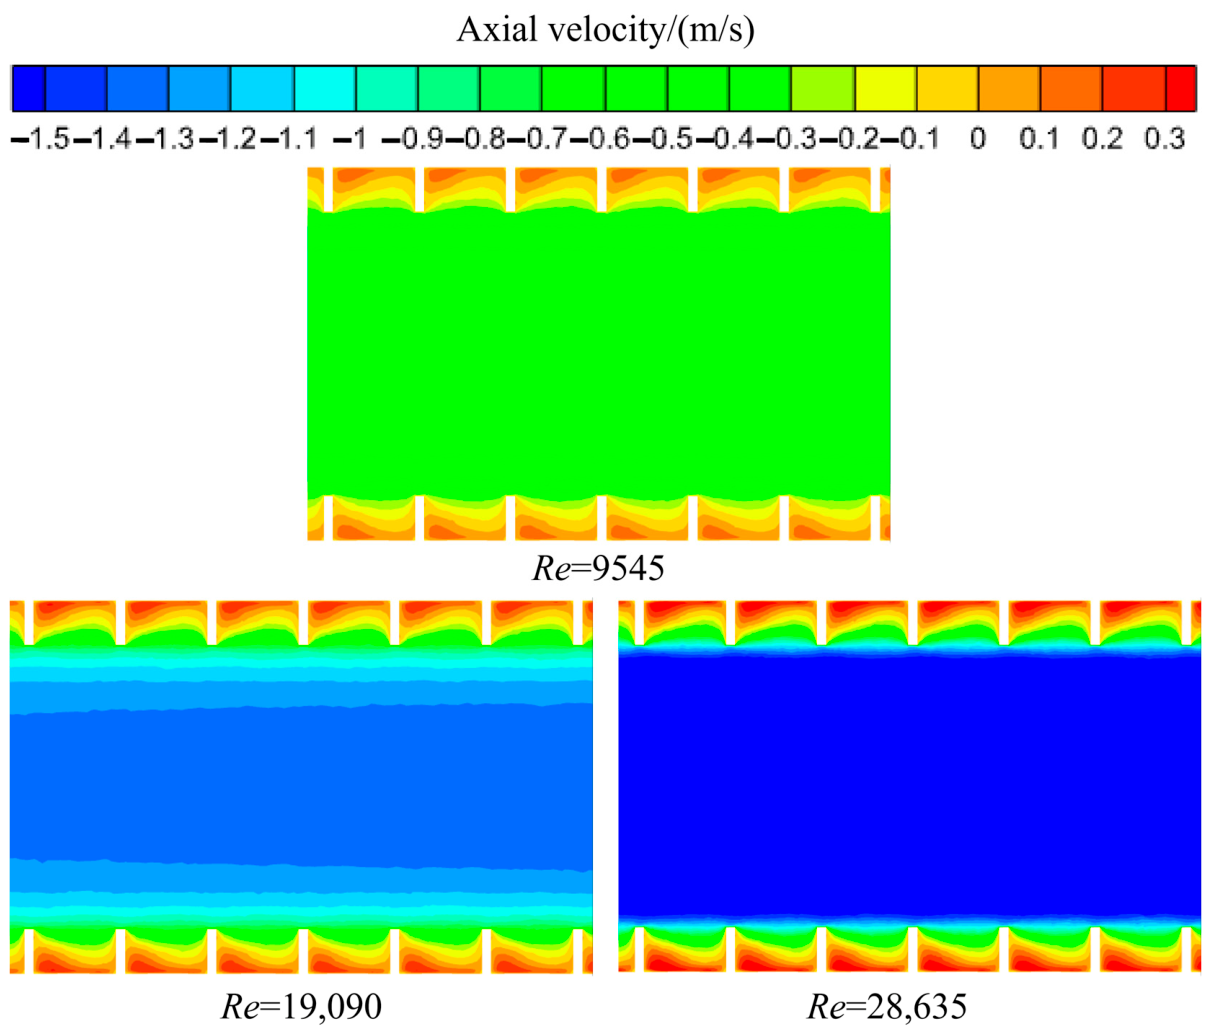
Figure 8 illustrates the velocity distribution within a triangular inner finned tube with l of 5 mm under various flow velocity conditions. The fluid velocity was the highest in the central region. Due to the viscosity of the fluid, the velocity decreased as it approached the wall and, near the wall, it gradually approached zero. When the fluid passed through the fins, pressure differences caused by the sudden contraction and expansion of the flow channel cross-section could form a low-velocity vortex region. With increasing Re, vortex intensity and secondary flow interaction became stronger, continuously disturbing the velocity boundary layer and enhancing momentum exchange between the mainstream and near-wall regions. The intensified vortex mixing corresponded well with the increase in Nu shown in Figure S1, indicating that enhanced convective transport originated from stronger near-wall fluid disturbance.
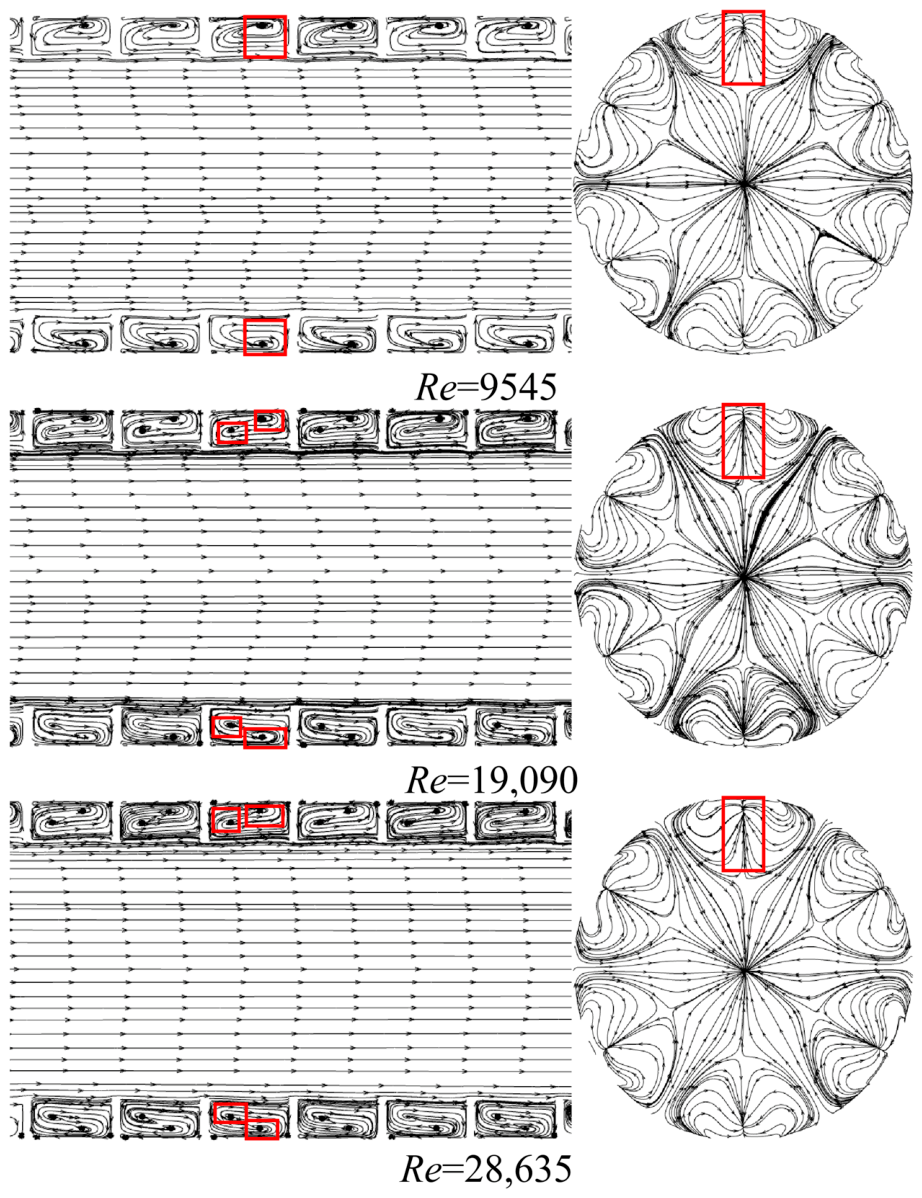
Figure 9 illustrates the streamline distribution within a triangular inner finned tube with l of 5 mm under various flow velocity conditions. The figure revealed that the flow velocity in the main flow region at the center of the tube remained relatively stable. As Re increased, the wake vortex region behind the fins expanded gradually, and the interaction between adjacent vortices became stronger, indicating enhanced secondary flow intensity. The intensified vortex interaction continuously disturbed the thermal boundary layer and promoted fluid exchange between the core flow and the near-wall region. On the transverse section, a heart-shaped wake structure formed downstream of the fins. The vortex structure became increasingly complex at high Reynolds numbers, demonstrating that inertial effects dominated the flow behavior and enhanced convective transport.
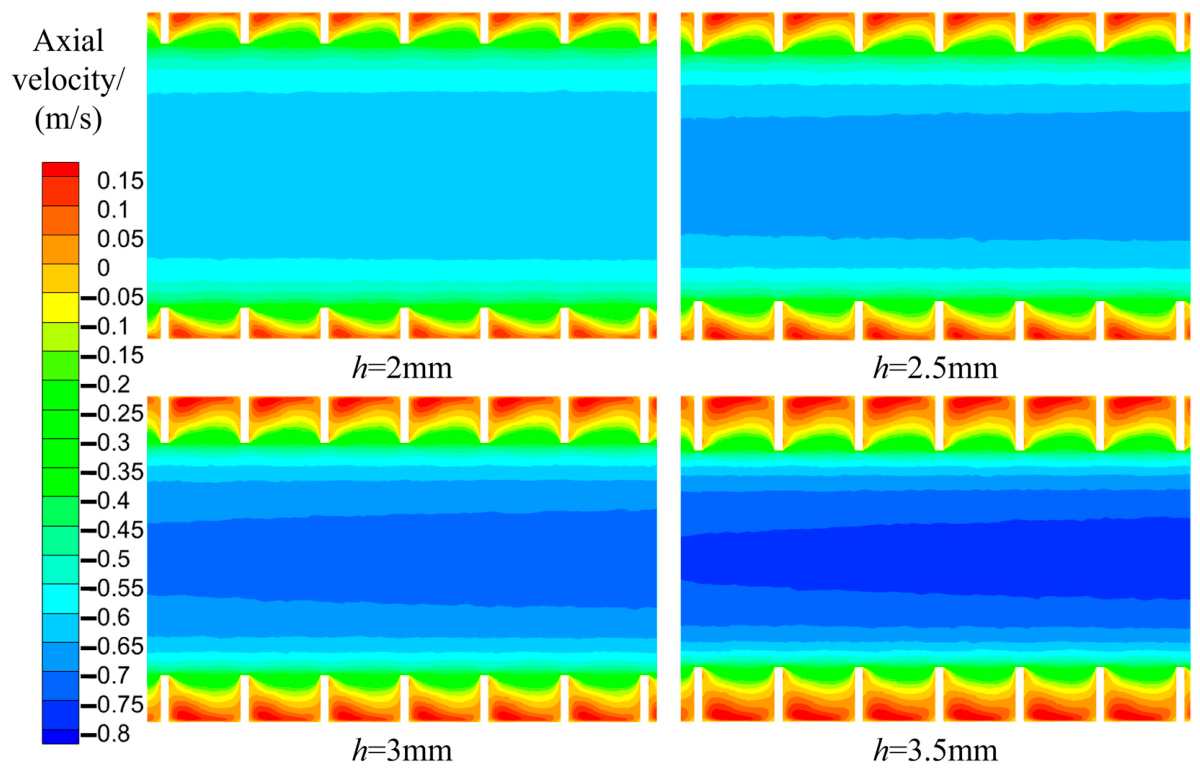
Figure 10 illustrates the velocity distribution at different h when Re = 9545. Increasing h effectively increased the blockage ratio inside the tube, forcing a larger portion of the fluid toward the tube center and strengthening flow acceleration in the mainstream region. Compared with h = 2 mm, the enlarged high velocity region at h = 3.5 mm indicated stronger vortex mixing and secondary flow intensity, which corresponded to the 14.3–21.5% increase in Nu shown in Figure 5a.
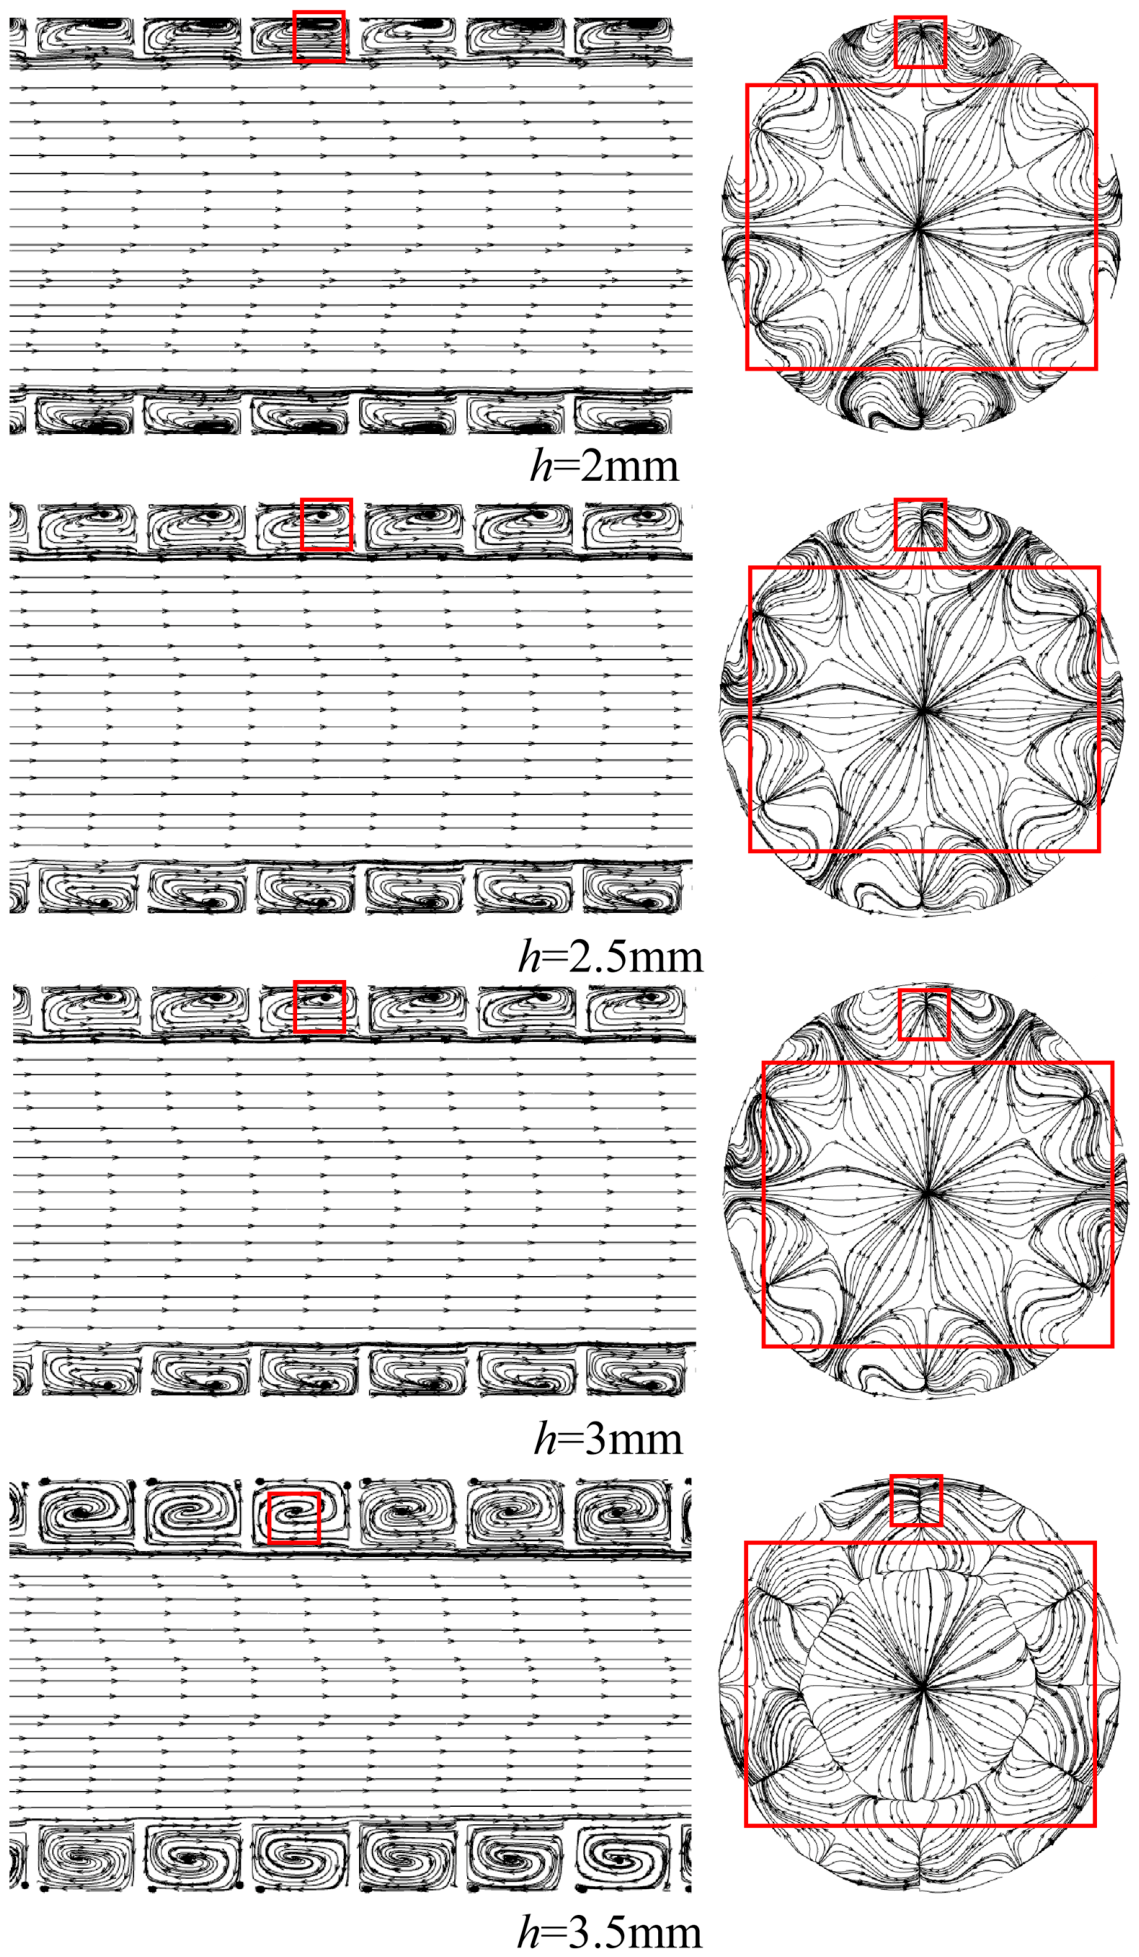
Figure 11 illustrates the streamline distribution within the finned tube at different h when Re = 9545. As h increased, the wake vortex region expanded significantly, and the interaction between adjacent vortices became stronger, indicating enhanced secondary flow intensity and thermal mixing capability. However, excessive h also intensified flow separation and vortex dissipation, which contributed to the rapid increase in the friction factor observed in Figure 5b.
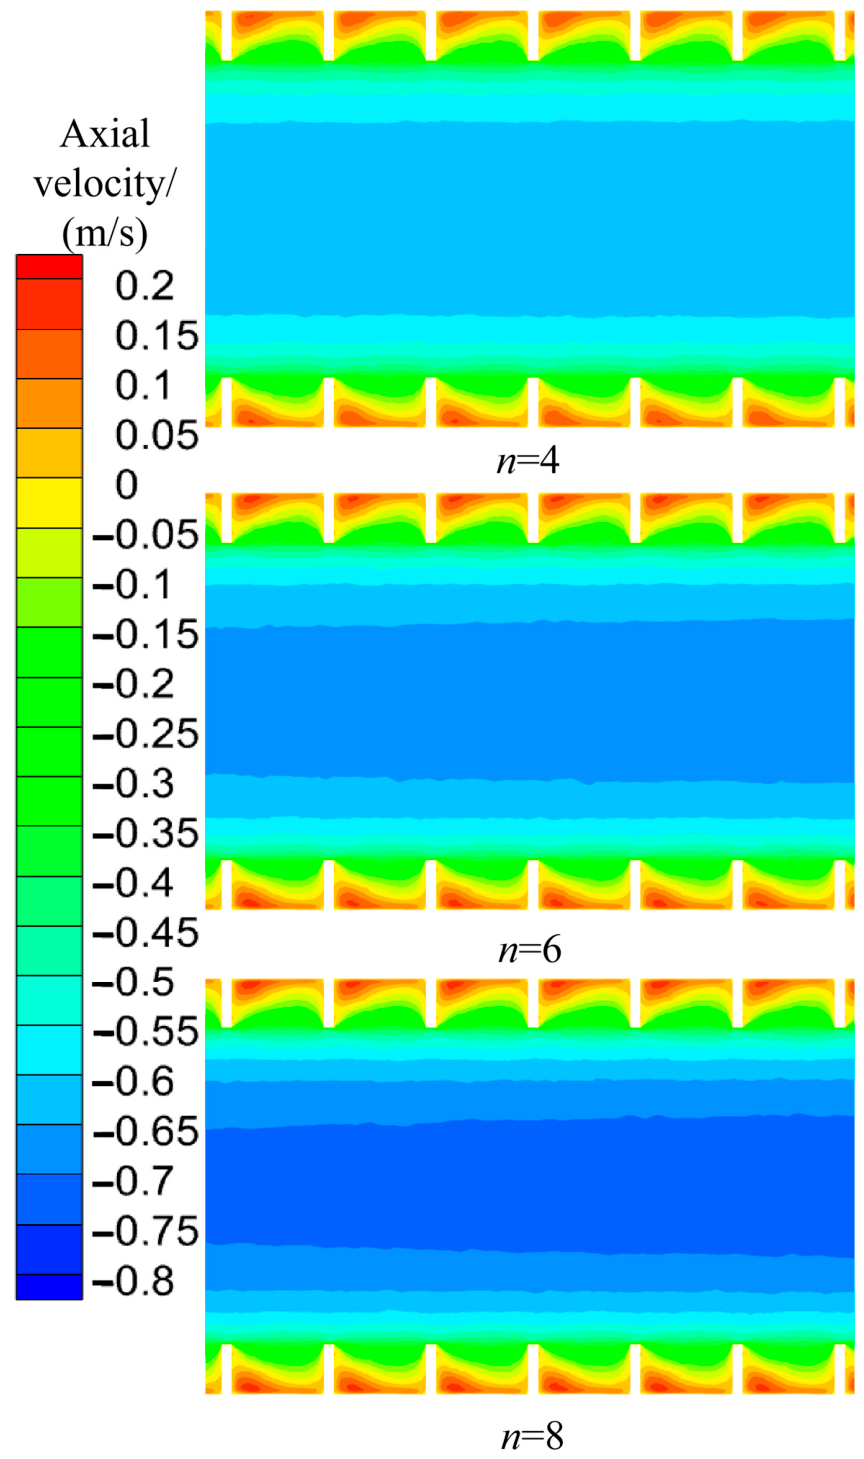
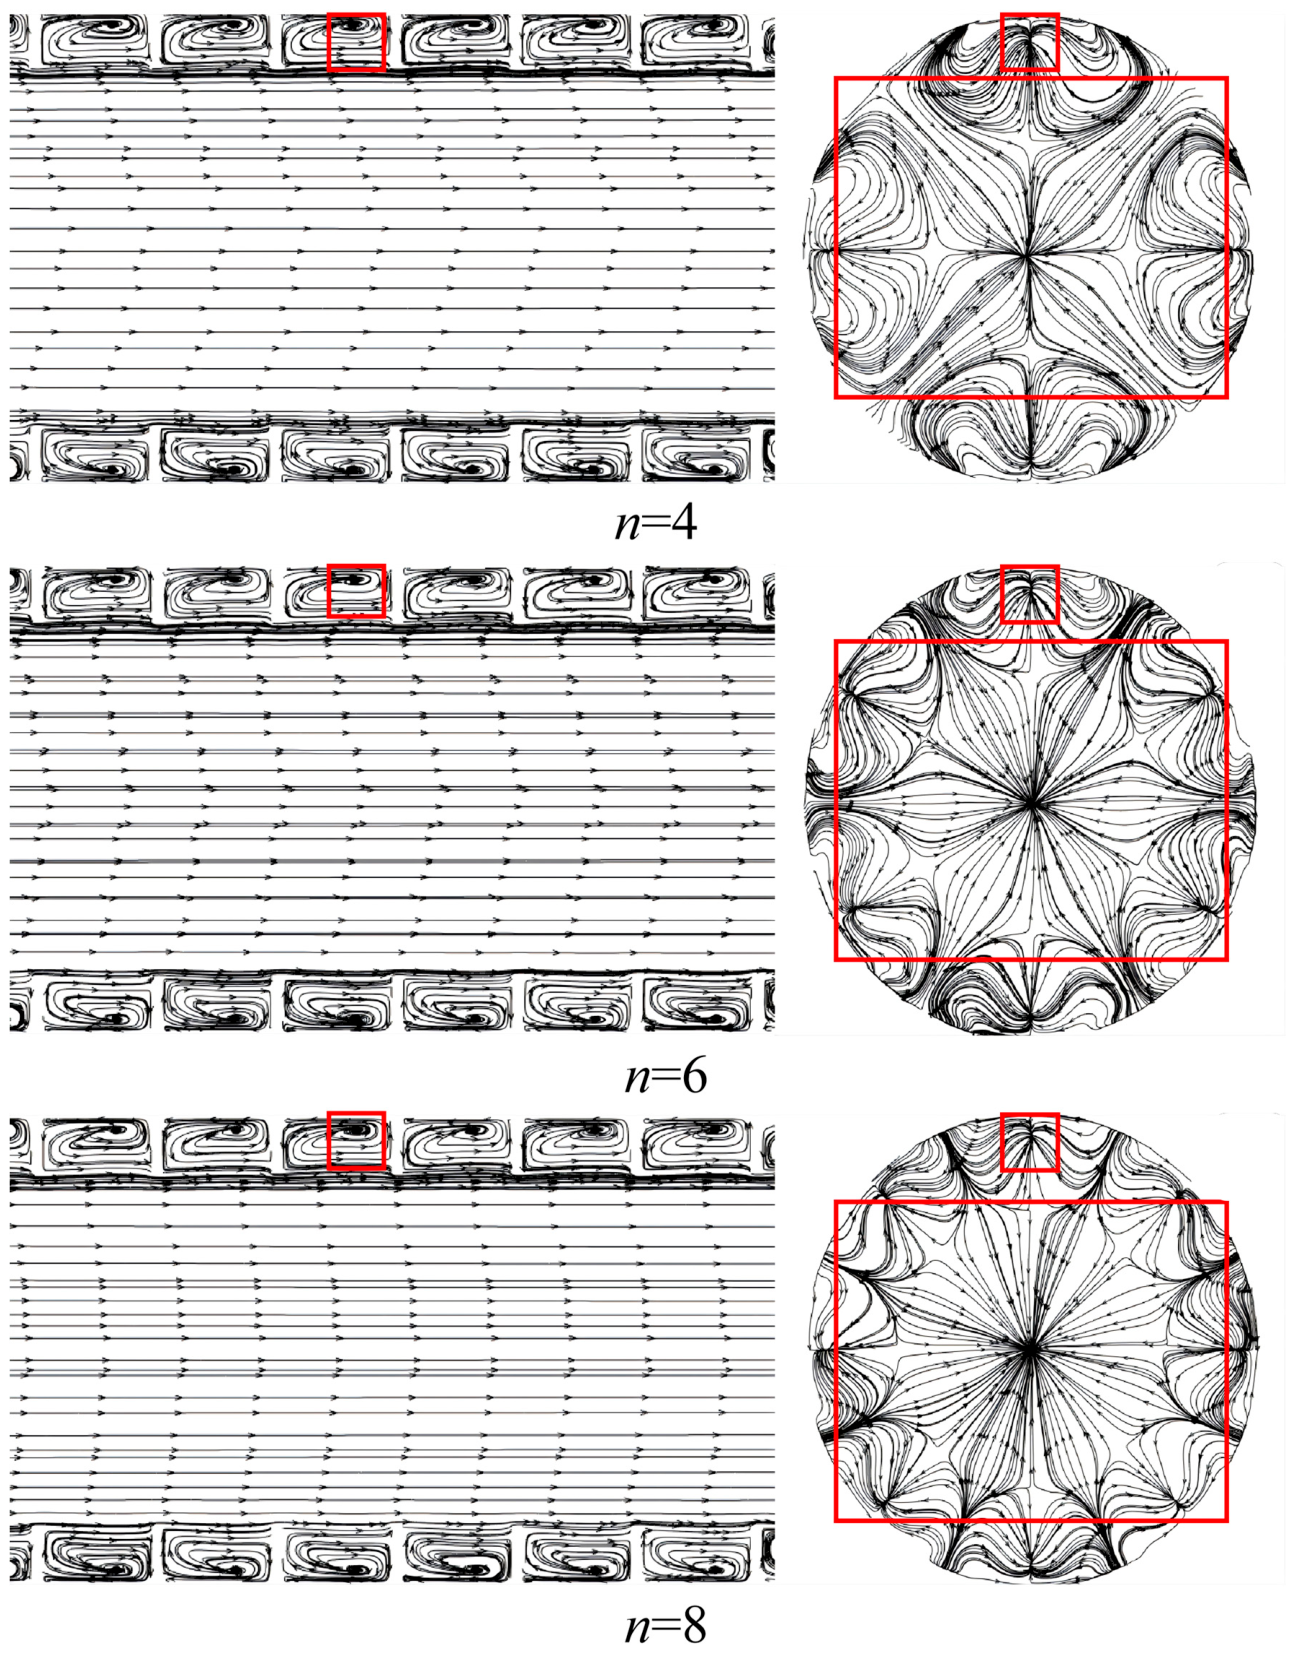
Figure 12 illustrates the contour plots of velocity distribution at different n when Re = 9545. Increasing n slightly enlarged the high velocity core region and strengthened the near-wall disturbance due to the increased circumferential blockage effect. Although the overall velocity distribution remained similar, the enhanced vortex interaction corresponded to the 16.1–25.9% increase in Nu, demonstrating the important role of circumferential secondary flow in heat transfer enhancement.
Figure 13 illustrates the streamline distribution within the finned tube at different n when Re = 9545. Increasing n increased the circumferential vortex density and strengthened near-wall flow disturbance, thereby enhancing fluid mixing and convective transport. When n increased from 4 to 8, the stronger vortex interaction enhanced momentum exchange between the mainstream and near-wall regions, resulting in improved heat transfer performance. However, excessive vortex interaction also increased flow resistance significantly.
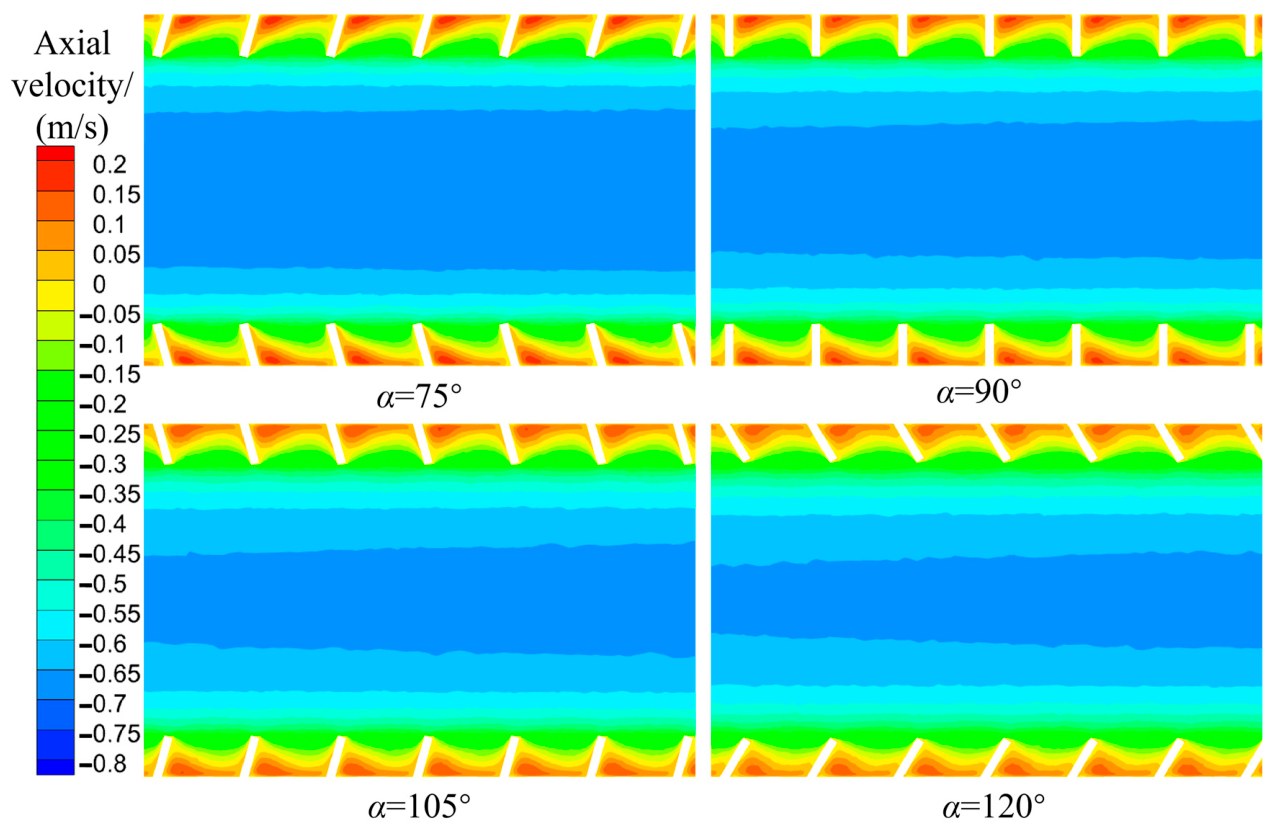
Figure 14 illustrates the contour plots of the velocity distribution within the tube at different α when Re = 9545. As α increased, the velocity in the near-wall vortex region gradually decreased, and the mainstream flow became more stable. The results indicated that larger inclination angles weakened transverse flow intensity and reduced vortex momentum transport, thereby decreasing the disturbance effect on the boundary layer.
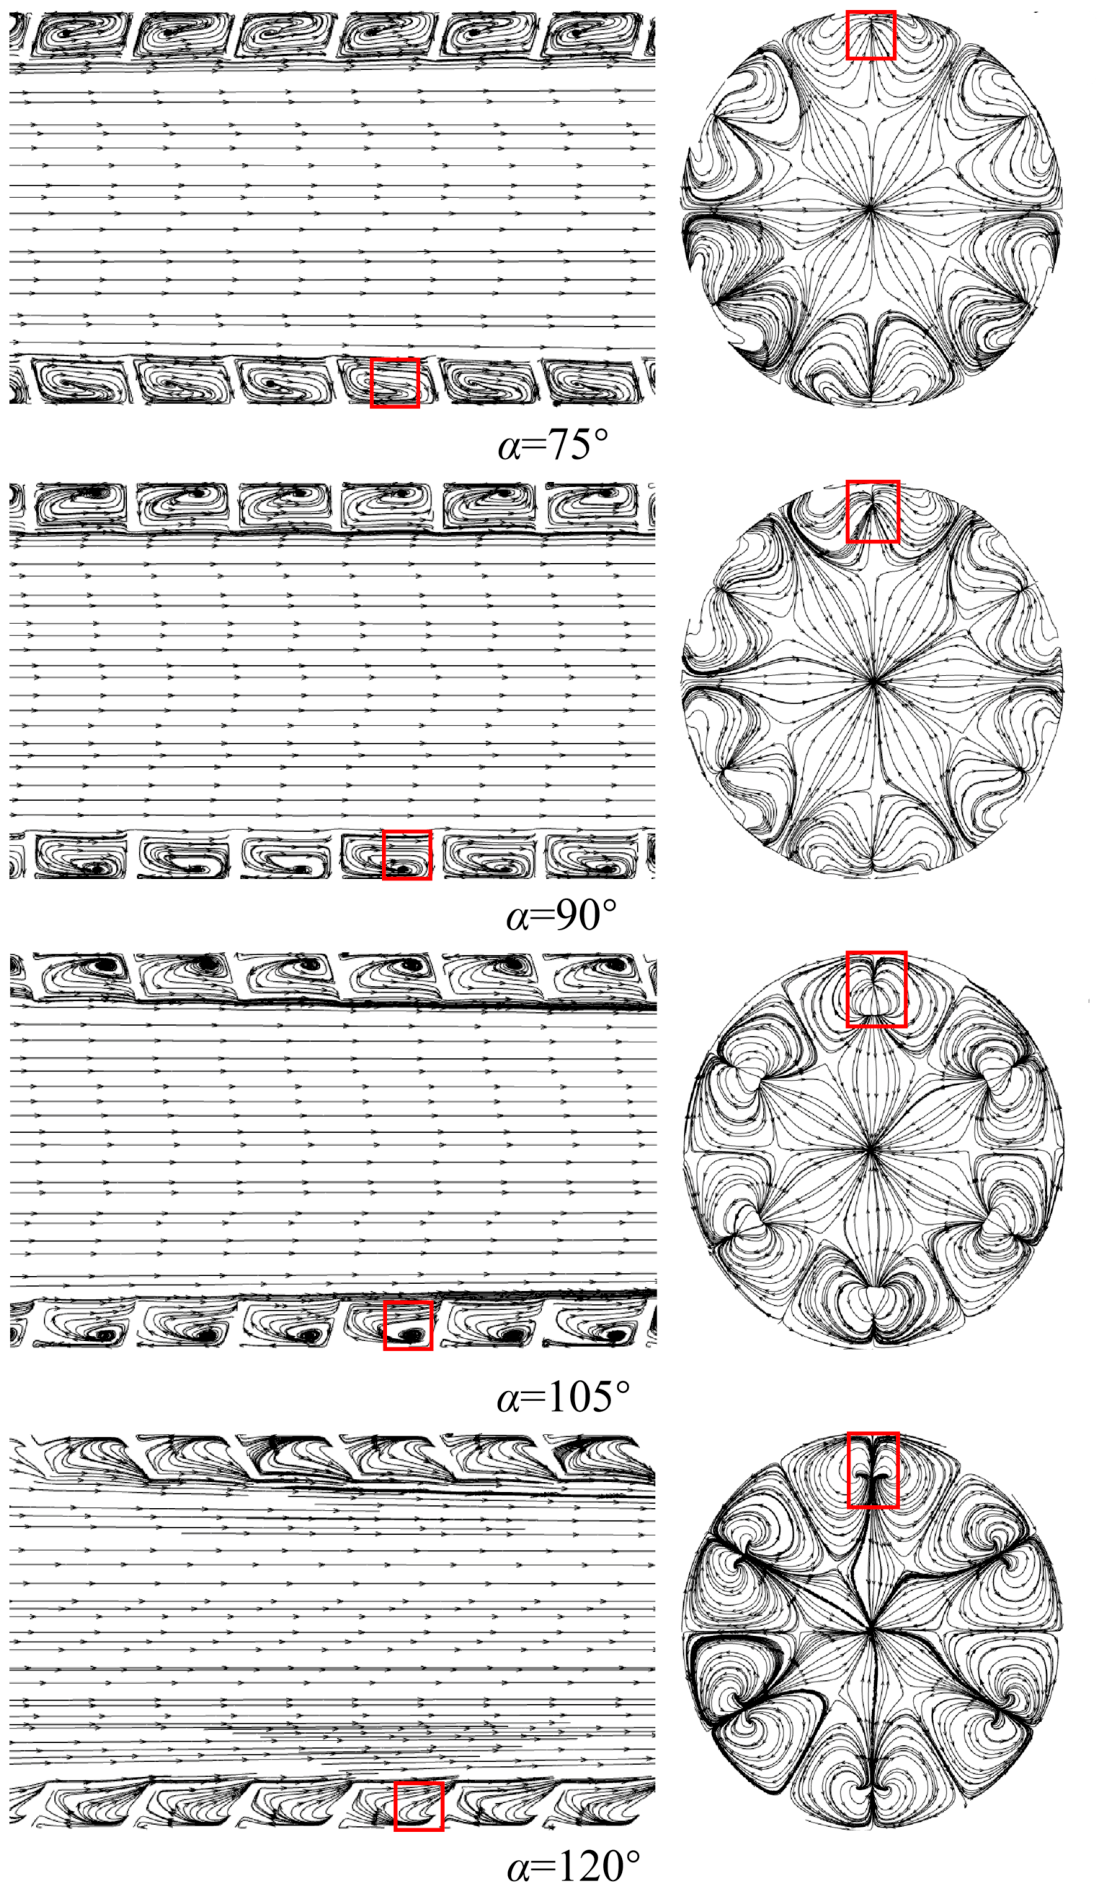
Figure 15 illustrates the streamline distribution within the tube at different α when Re = 9545. As α increased, the vortex center gradually shifted toward the wall, and the transverse mixing intensity weakened, resulting in reduced momentum and energy exchange between the mainstream and near-wall regions. At α = 120°, the enlarged flow separation region generated additional recirculation structures, which explained the renewed increase in Nu under high Re conditions.

3.3. The Impact of Fin Structure on Heat Transfer Characteristics

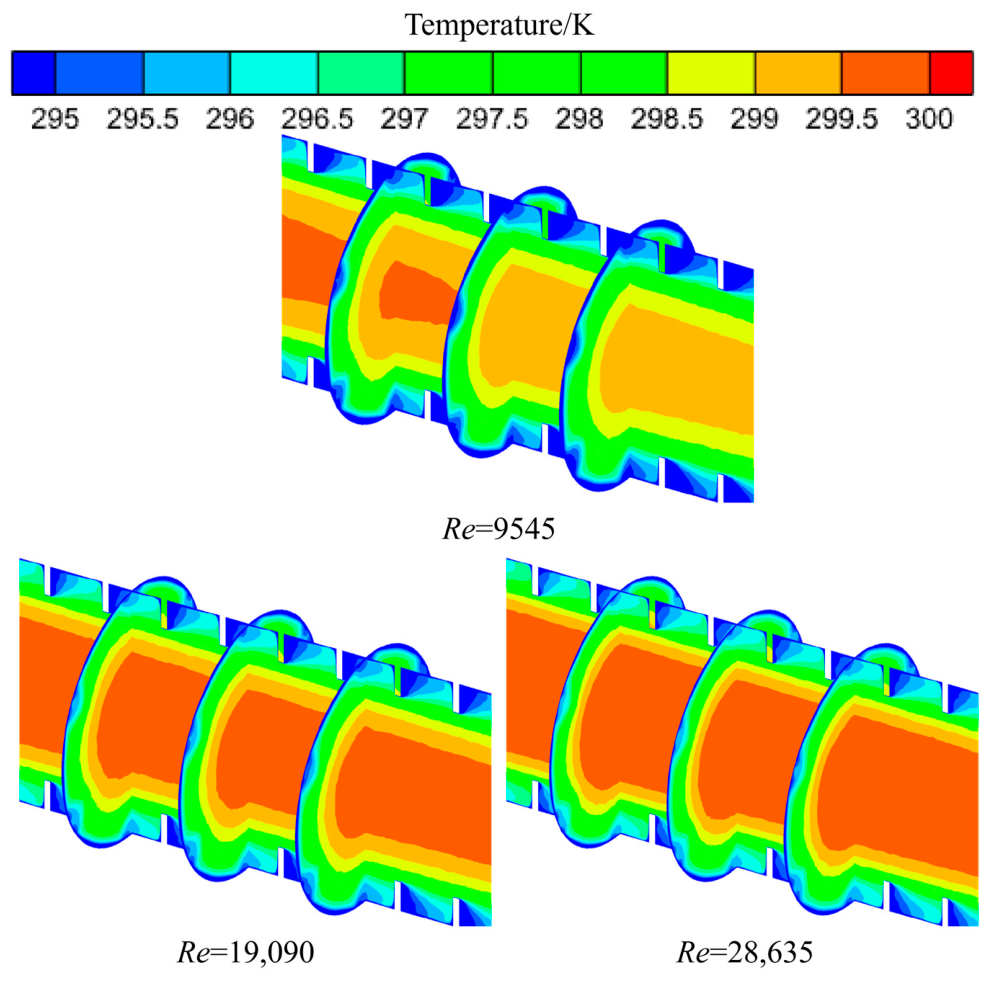
Figure 16 illustrates the temperature distribution within a triangular finned tube with l of 5 mm at different flow velocities. It could be observed that the temperature gradient was lower in the central region of the tube, indicating poorer heat transfer. This was because the fluid in the main flow area was unaffected by the fins, and the fluid morphology remained unchanged. When the fluid flowed over the fins, the generation of vortices enhanced energy exchange between the wall and the fluid, allowing fluid with lower heat to enter the central fluid region from the near-wall area, while hot fluid in the central fluid region was squeezed into the near-wall area. As the flow velocity increased, a large amount of high-temperature fluid occupied the main flow area. Under the influence of vortexes, cold fluid continuously mixed with hot fluid, exchanging heat. As the flow velocity gradually increased, it approached the limit of heat transfer enhancement by the fins, and the temperature of the hot fluid in the middle flow increased accordingly.
Figure 17 illustrates the temperature distribution within the tube with different h at Re = 9545. As h increased, the mainstream temperature decreased, while the temperature near the wall downstream of the fin increased. This was because, as h increased, the vortex-influence area generated by the fluid flowing over the fin became larger, thereby significantly enhancing the momentum and energy exchange between the mainstream and vortex regions. Compared with h = 2 mm, the stronger vortex interaction at h = 3.5 mm promoted more effective energy transport between the mainstream and near-wall region, corresponding to the increase in Nu of up to 21.5%.
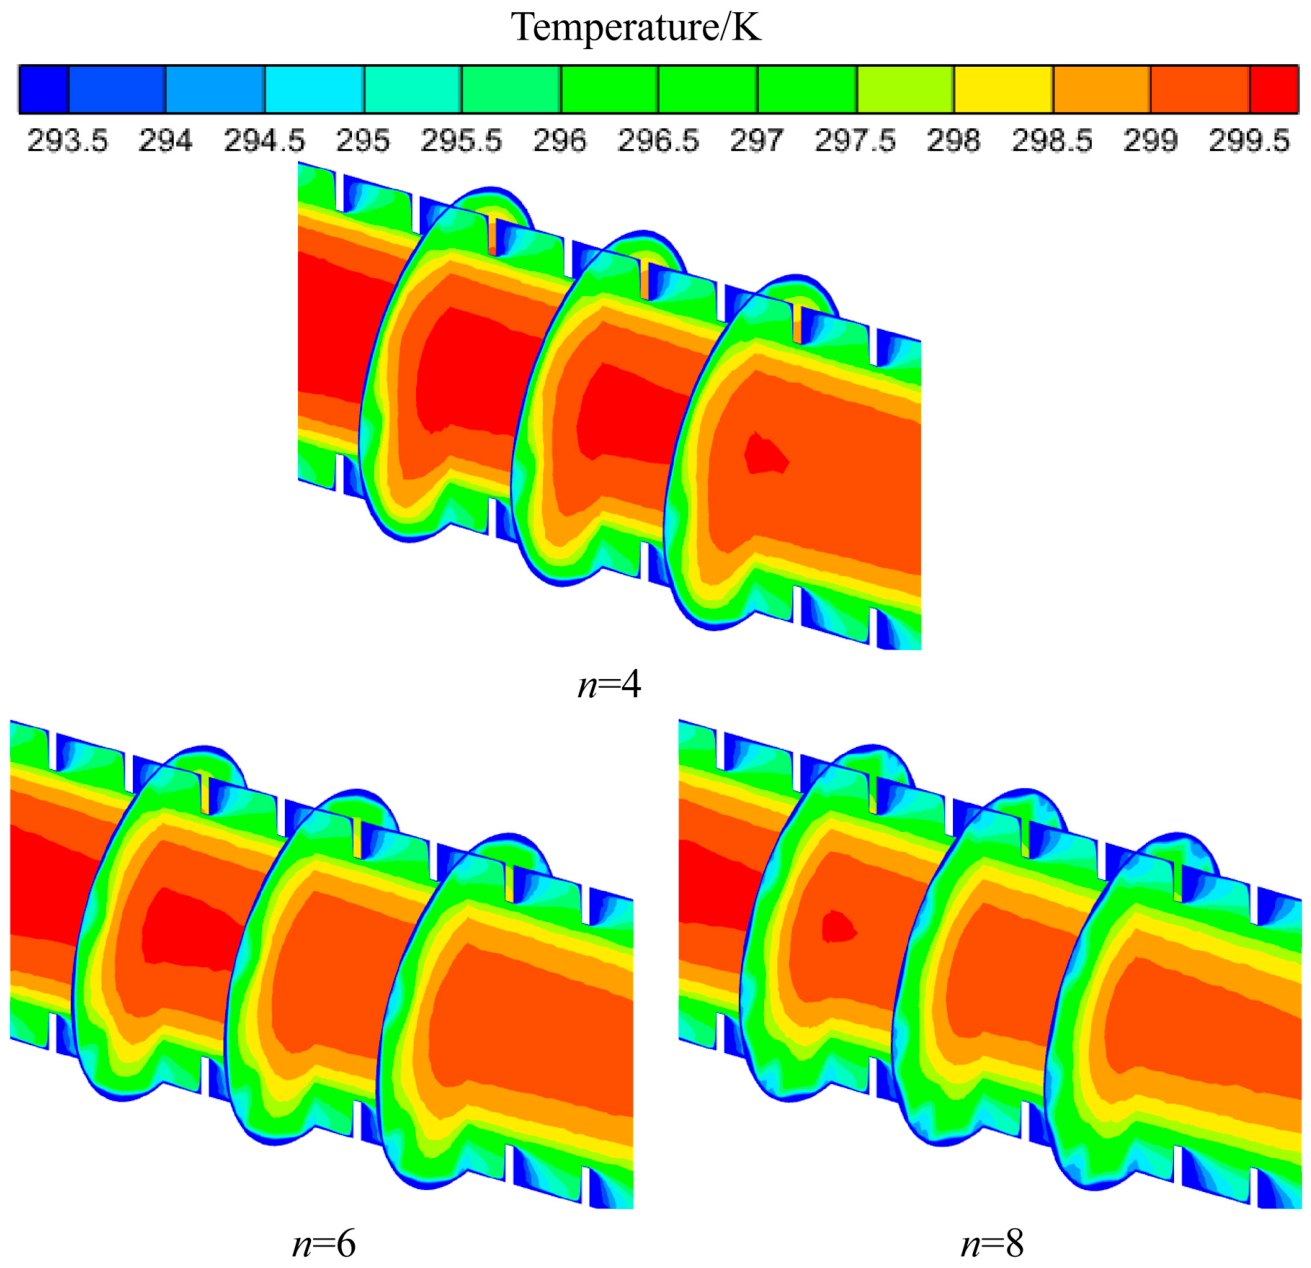
Figure 18 illustrates the temperature distribution within a tube with different n at Re = 9545. As n increased, the low-temperature region near the wall expanded gradually, indicating enhanced heat transfer between the wall and fluid. The increased circumferential vortex density continuously disturbed the thermal boundary layer and improved thermal diffusion, which corresponded to a 16.1–25.9% increase in Nu.
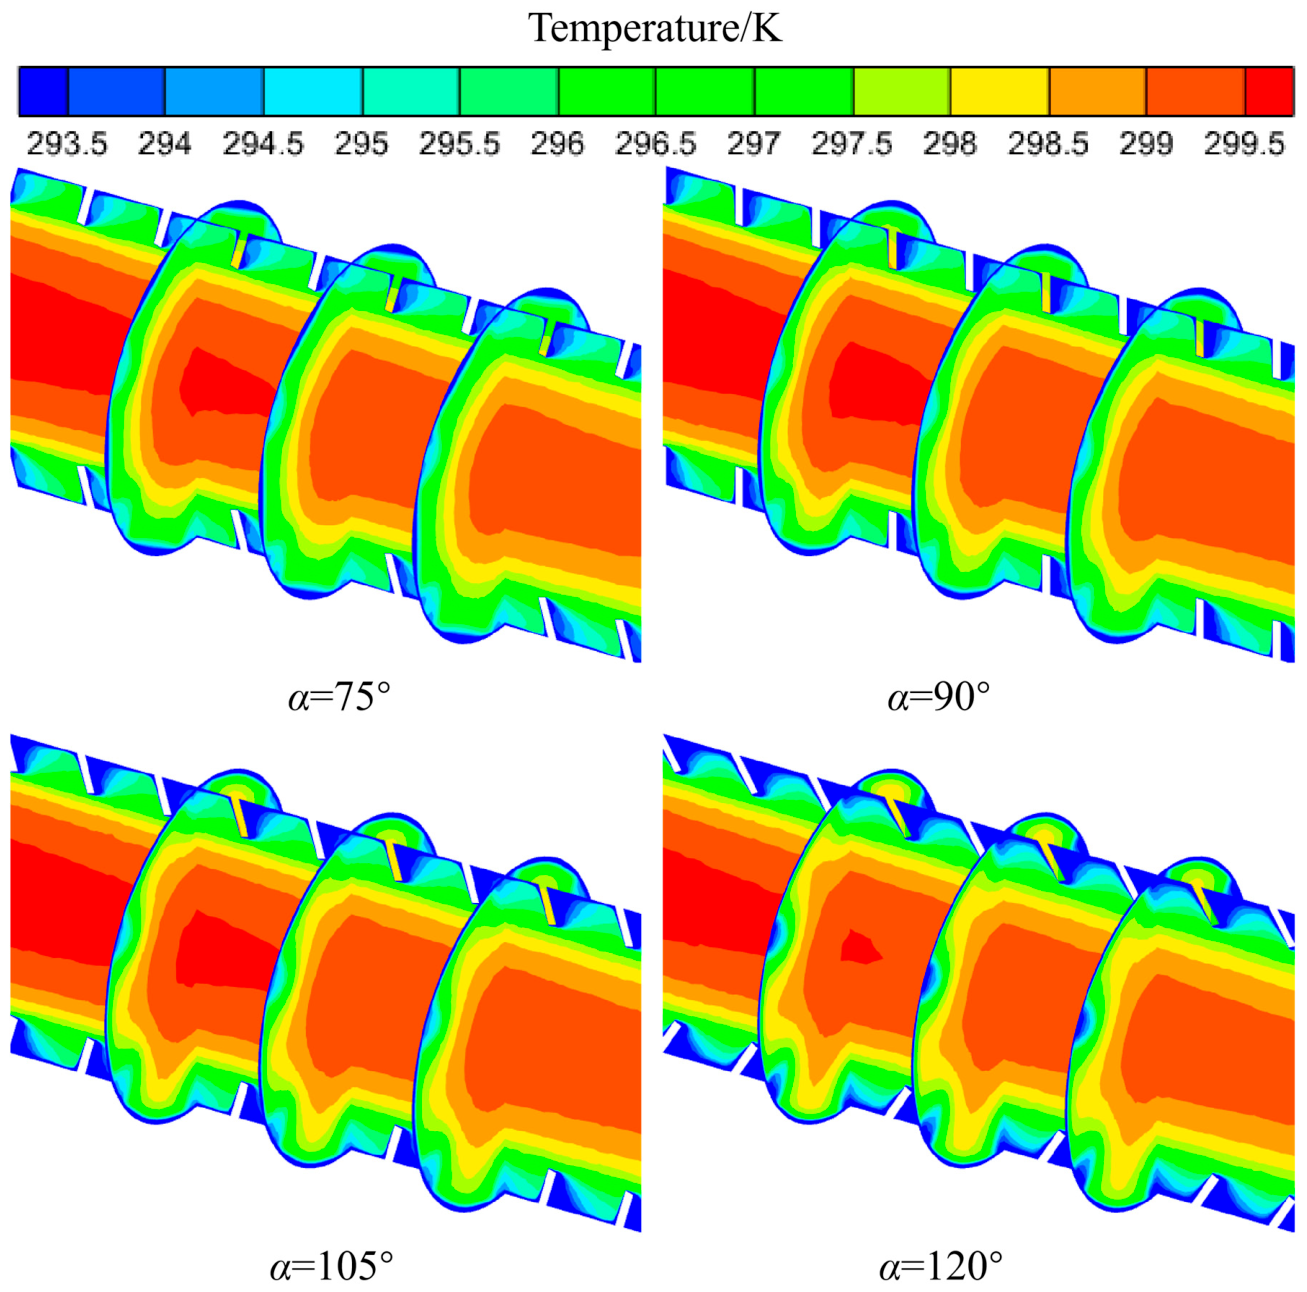
Figure 19 shows the contour plots of temperature distribution inside the tube with different α at Re = 9545. The mainstream velocity remained basically the same across various α values. As α increased, the temperature in the downstream near-wall region of the fins gradually decreased. This was because, as α increased, the vortex region gradually moved closer to the wall, and the energy-exchange ability decreased, indicating that convective heat transfer performance began to gradually decline.

3.4. The Impact of Fin Structure on Field Synergy Angle

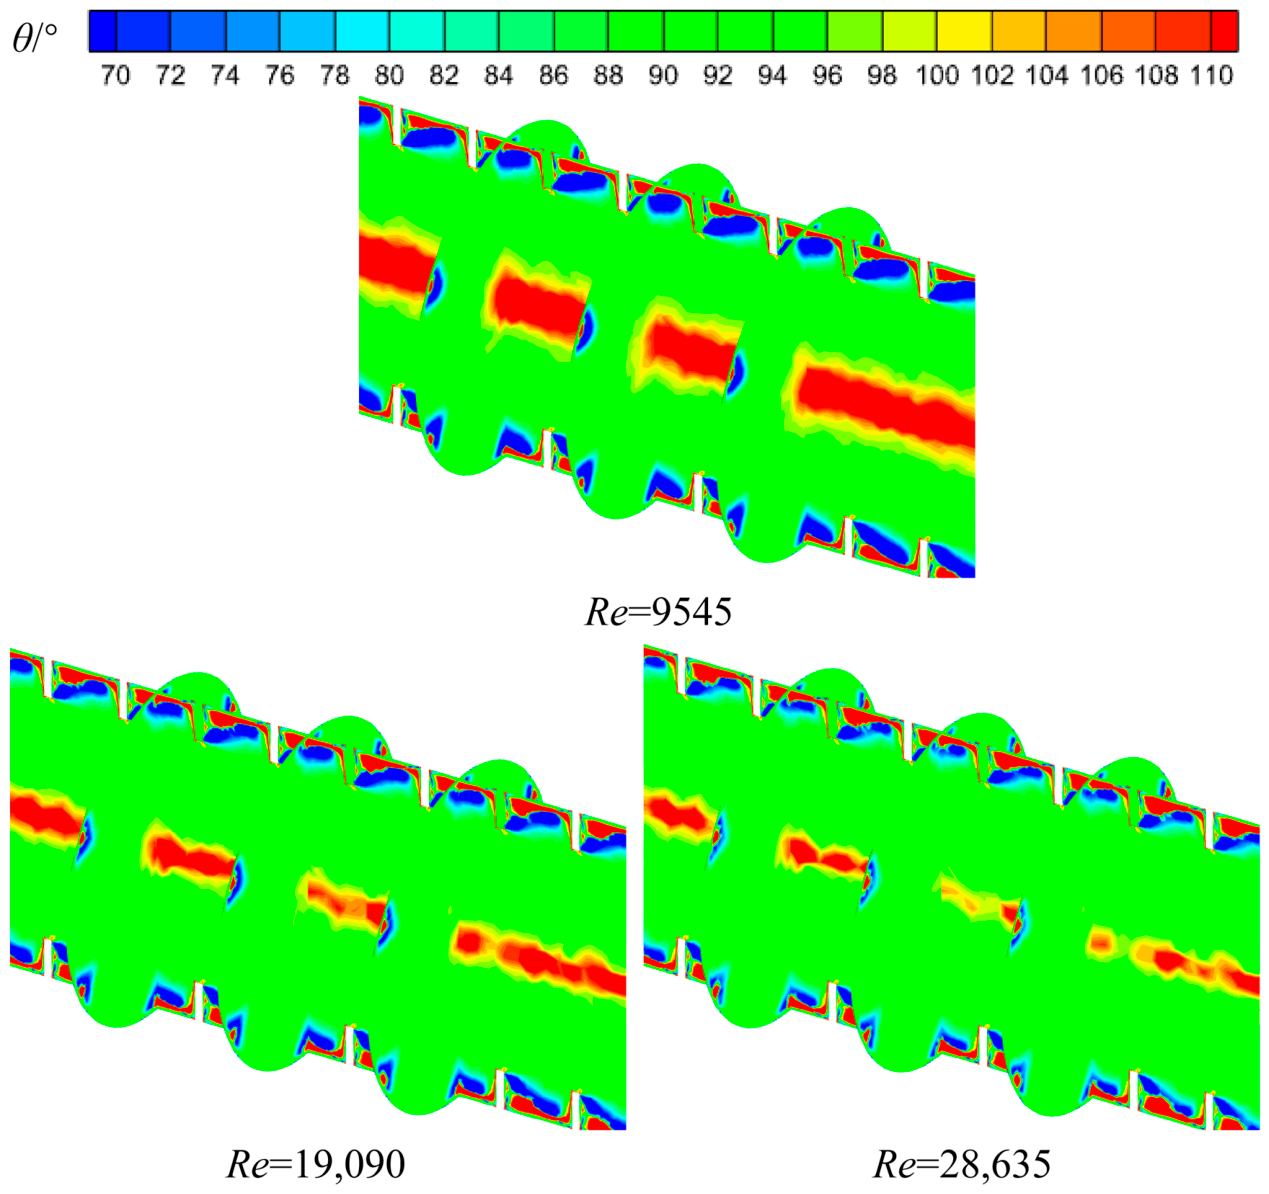
Figure 20 illustrates the distribution of synergy angles inside the triangular finned tube at different flow velocities. It could be observed that the trend of the synergy angle (θ) distribution inside the tube was generally similar. There were numerous red areas at the center of the tube, and their size decreased with increasing Re, indicating that heat transfer performance in the central mainstream region began to decline. The alternating red and blue areas around the fins suggested that the fins could alter the original flow direction of the fluid. The change in the direction of the velocity vector generated a velocity component parallel to the temperature gradient vector, enhancing the synergy between the two. This change also led to the formation of vortex regions. At higher flow velocities, the fluid near the wall of the triangular finned tube gradually replaced the fluid in the central mainstream region in terms of heat transfer enhancement.
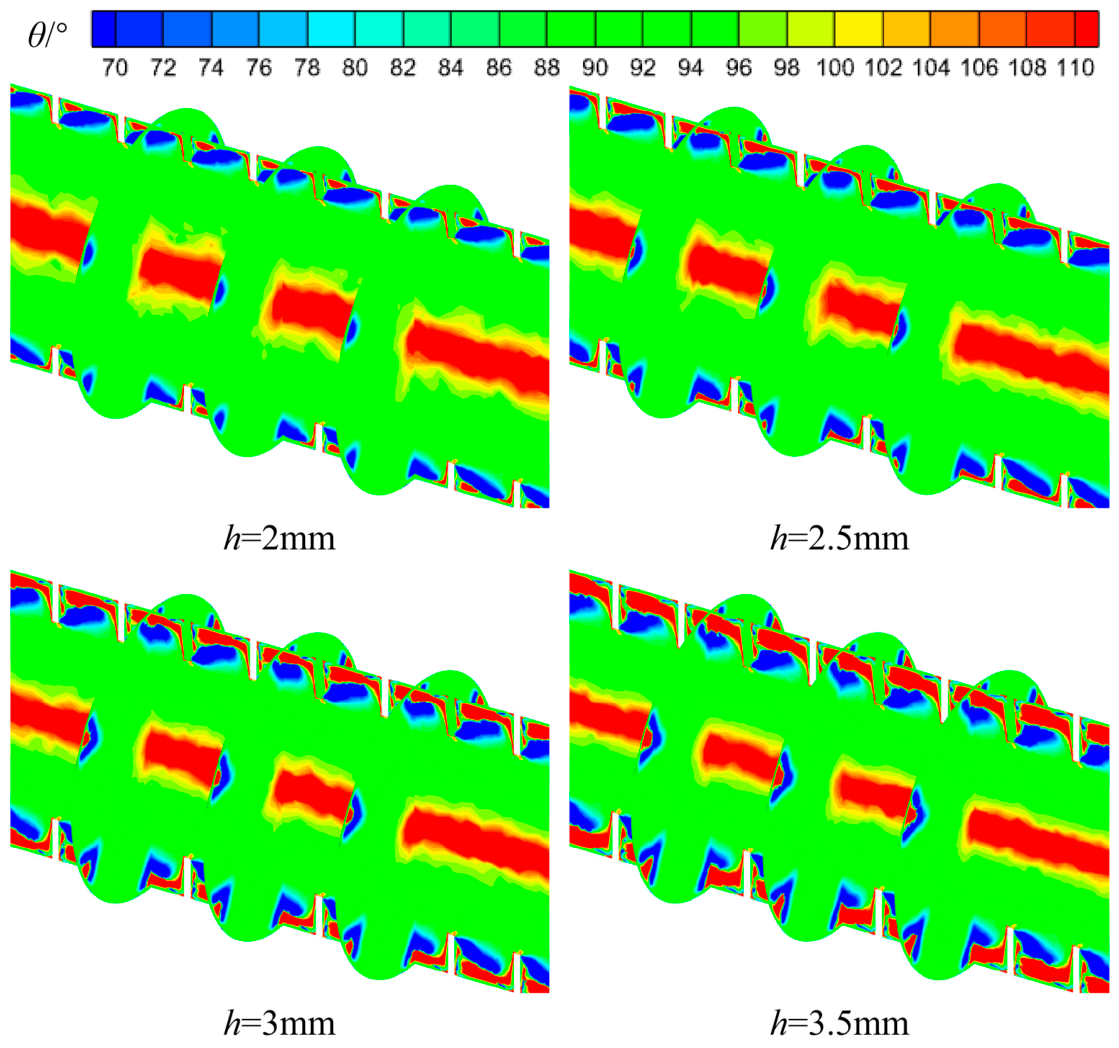
Figure 21 illustrates the distribution of synergy angles within the tube with different h at Re = 9545. Increasing h enlarged the low synergy angle region around the fins, especially near the wake vortex area, indicating enhanced secondary flow intensity and stronger thermal mixing. Compared with h = 2 mm, the larger vortex influence region at h = 3.5 mm promoted more effective coordination between fluid flow and heat diffusion, which corresponded well with the increase in Nu.
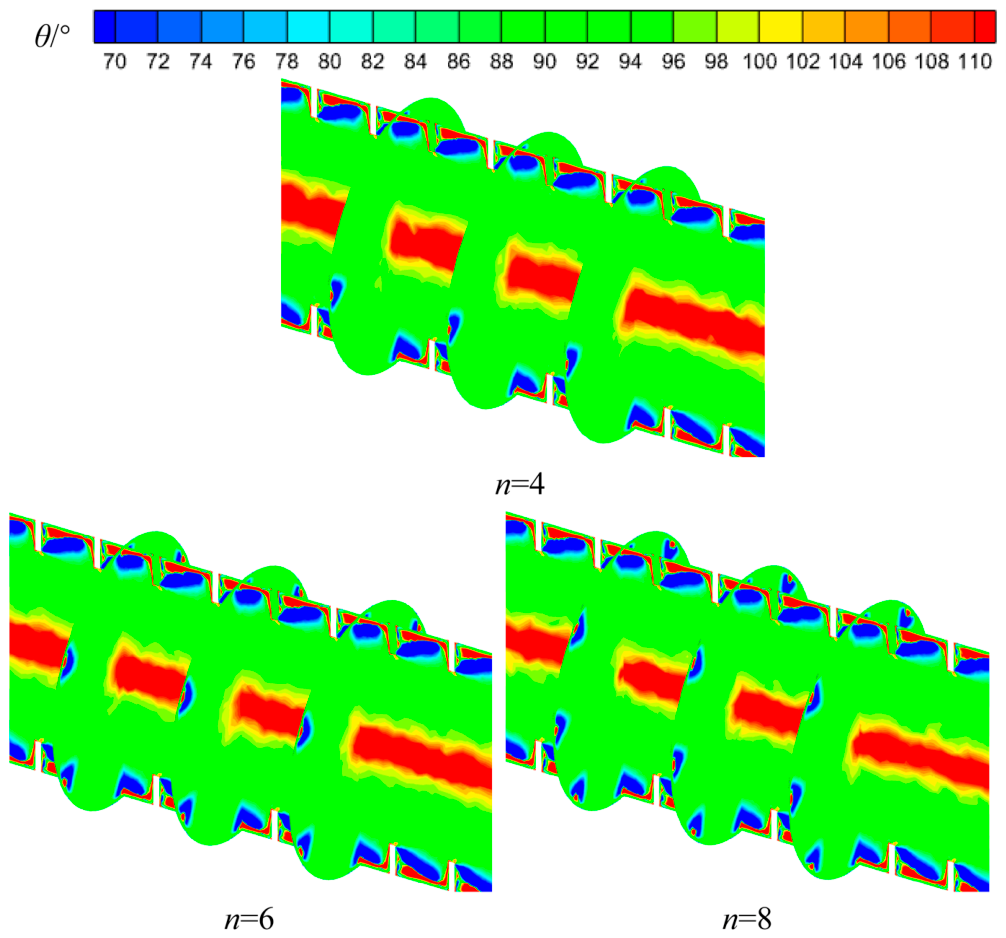
Figure 22 illustrates the distribution of synergy angles within the tubes with different n at Re = 9545. Increasing n strengthened the circumferential flow disturbance and increased the number of low-synergy-angle regions near the wall. The enhanced vortex interaction improved the alignment between the velocity vector and temperature gradient vector, thereby promoting momentum and energy exchange between the mainstream and near-wall fluid.
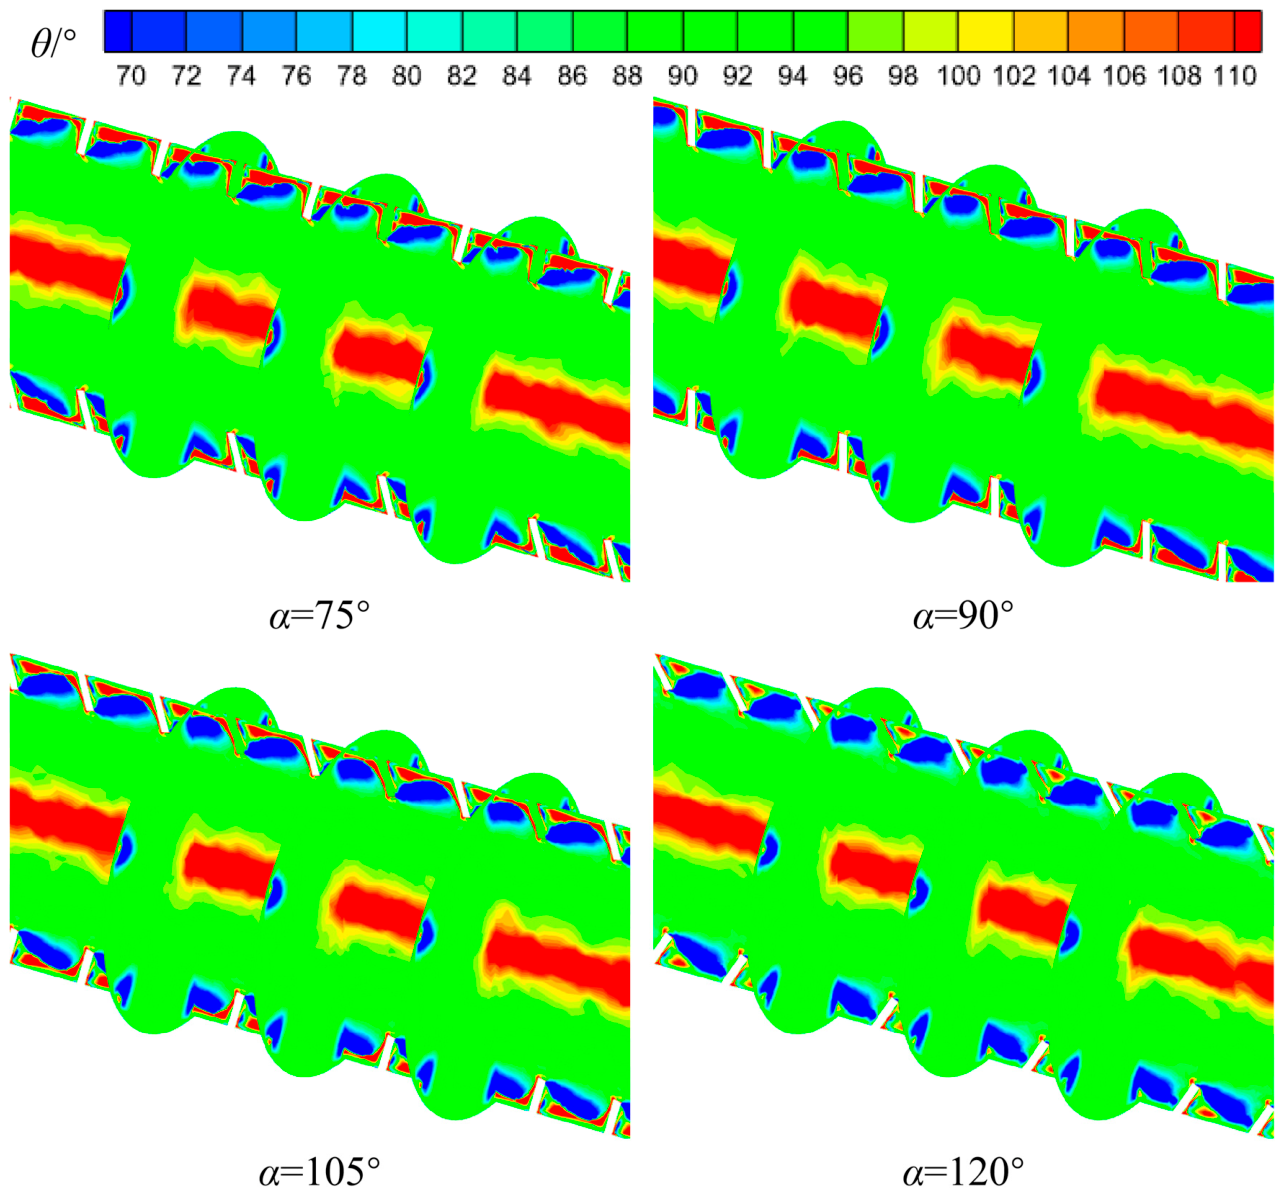
Figure 23 illustrates the distribution of synergy angles within the tube with different α at Re = 9545. As α increased, the low-synergy angle region near the fins gradually weakened, indicating reduced transverse momentum transport and weaker secondary flow intensity. The vortex center gradually shifted toward the wall, decreasing the interaction between the mainstream and near-wall regions. Consequently, the coordination between fluid motion and thermal diffusion weakened, resulting in reduced convective heat transfer performance.

4. Conclusions

A finned tube with triangular internal fins was proposed. The impact of its structural parameters on heat transfer performance was numerically investigated.
Compared to smooth tubes, Nu increased by 14.22–60.54%. The f of the finned tubes was 3.11 to 3.58 times that of the smooth tube. PEC was significantly improved under low Re conditions. When the Re exceeded the critical value, PEC gradually decreased to less than 1, and the heat-transfer effect gradually weakened to a level lower than that of a smooth tube. Parametric analysis revealed that reducing l, increasing h, and adding more radial fins all improved Nu at the cost of increased f. The optimal α was 75°, at Re = 9545, Nu increased by 66.02%, f increased by 162.23%, and PEC reached 1.203.
When the fluid passed through the triangular internal fins, the pressure difference generated by the sudden contraction and expansion of the flow channel cross-section induced the formation of a vortex region. Under the influence of the vortex, the cold fluid continuously mixed with the hot fluid, exchanging momentum and energy, thereby enhancing the convective heat transfer performance. Field synergy analysis indicated that as Re increased, the dominant heat-transfer region shifted from the tube center to the near-wall area, driven by intensified vortex activity.

Supplementary Materials

The following supporting information can be downloaded at: https://www.mdpi.com/article/10.3390/pr14111748/s1, Figure S1: Variation of Nu and f with Re in the smooth tube; Table S1: Physical structure parameters of triangular internal fins. Equation (S1): Correlation equation of Nu. Equation (S2): Correlation equation of f.

Author Contributions

Conceptualization, C.W. and H.W.; methodology, C.W.; software, C.W. and J.M.; validation, C.W. and H.W.; formal analysis, J.M.; investigation, H.W.; resources, G.G.; data curation, H.W.; writing—original draft preparation, C.W.; writing—review and editing, H.W.; supervision, G.G.; project administration, H.W.; funding acquisition, H.W. All authors have read and agreed to the published version of the manuscript.

Funding

This research was funded by the Scientific and Technological Innovation Project of Carbon Emission Peak and Carbon Neutrality of Jiangsu Province, grant number BE2023090-2.

Data Availability Statement

Data is contained within the article.

Conflicts of Interest

The authors declare no conflicts of interest.

Nomenclature

AHeat transfer area [m2]
CpSpecific heat [J/(kg·K)]
dTube diameter [m]
fDrag coefficient
HHeat transfer coefficient [W/(m2·K)]
hHeight of fins [m]
lAxial space of fins [m]
LTube length [m]
nRadial arrangement number of fins
ΔpPressure drop [Pa]
pinInlet pressure [Pa]
poutOutlet pressure [Pa]
QHeat exchange capacity [W]
ΔTLogarithmic mean temperature difference [K]
TinInlet temperature [K]
ToutOutlet temperature [K]
TwallWall temperature [K]
uinInlet velocity [m·s−1]
αInclination angle of fins [°]
ρDensity [kg/m3]
θField synergy angle [°]
μViscosity [kg/(m·s)]
λThermal conductivity [W/(m·K)]
IFVIntermediate Fluid Vaporizer
LNGLiquefied Natural Gas
NuNusselt number
PrPrandtl number
PECPerformance Evaluation Criteria
ReReynolds number
Corner:
inInlet
outOutlet
wWall
0Baseline model

References

  1. Yang, L.; Gao, X.; Li, Z. An overview of the policies and models of integrated development for solar and wind power generation in China. Res. Cold Arid Reg. 2023, 15, 122–131. [Google Scholar] [CrossRef]
  2. Shen, K.; Wang, J.; Chen, L. Comprehensive evaluation of energy consumption in LNG liquefaction plants and investigation of energy saving optimization. Fuel 2025, 397, 135301. [Google Scholar] [CrossRef]
  3. Khaloie, H.; Vallée, F. Day-ahead dispatch of liquid air energy storage coupled with LNG regasification in electricity and LNG markets. IEEE Trans. Power Syst. 2023, 39, 5177–5190. [Google Scholar] [CrossRef]
  4. Kim, D.; Park, S.; Lee, I.; Park, J. Carbon sequestration with enhanced gas recovery (CSEGR) for a novel natural gas value chain: Synergy with cold energy utilization. Energy 2024, 313, 133994. [Google Scholar] [CrossRef]
  5. Oh, J.; Kim, D.; Roussanaly, S.; Lim, Y. Greenhouse gas emissions of shipping with onboard carbon capture under the FuelEU Maritime regulation: A well-to-wake evaluation of different propulsion scenarios. Chem. Eng. J. 2024, 498, 155407. [Google Scholar] [CrossRef]
  6. Sun, D.; Wang, C.; Shen, Q. A compression-free re-liquefication process of LNG boil-off gas using LNG cold energy. Energy 2024, 294, 130894. [Google Scholar] [CrossRef]
  7. Aryanfar, Y.; Mohtaram, S.; Alcaraz, J.L.G.; Sun, H. Energy and exergy assessment and a competitive study of a two-stage ORC for recovering SFGC waste heat and LNG cold energy. Energy 2023, 264, 126191. [Google Scholar] [CrossRef]
  8. Ning, J.; Wang, N.; Ma, Z.; Zhang, Q.; Yang, X. Performance analysis on combined refrigeration system utilizing LNG cold energy and solar energy. Renew. Energy 2026, 256, 123927. [Google Scholar] [CrossRef]
  9. Yao, S.; Shen, X.; Yang, Z.; Feng, G.; Xiao, M. Design and optimization of LNG vaporization cold energy comprehensive utilization system based on a novel intermediate fluid vaporizer. Appl. Therm. Eng. 2021, 190, 116785. [Google Scholar] [CrossRef]
  10. Shangguan, Z.; Rui, Z.; Zhang, S.; He, J.; Chen, L.; Wang, Z.; Peng, H. Energy efficiency and economic analysis of a novel polygeneration system based on LNG cold energy utilization and wet flue gas waste heat recovery. Appl. Therm. Eng. 2025, 260, 125055. [Google Scholar] [CrossRef]
  11. Yao, S.; Yang, Y.; Zhang, Z.; Wei, Y.; Sun, J. Design and optimization of LNG-powered ship cold energy and waste heat integrated utilization system based on novel intermediate fluid vaporizer. Case Stud. Therm. Eng. 2022, 40, 102528. [Google Scholar] [CrossRef]
  12. Shank, K.; Tiari, S. A review on active heat transfer enhancement techniques within latent heat thermal energy storage systems. Energies 2023, 16, 4165. [Google Scholar] [CrossRef]
  13. Fazel, S.A.; Lorzadeh, E. Pool boiling heat transfer intensification by electro-stimulation. Chem. Eng. Process.-Process Intensif. 2020, 149, 107818. [Google Scholar] [CrossRef]
  14. Liu, J.; Sun, J.; Yin, C.; Wang, C.; Sun, J. Revealing the heat transfer enhancement mechanism of dimpled tube hybridized with twisted tape via dimple utility indicator. Case Stud. Therm. Eng. 2025, 68, 105867. [Google Scholar] [CrossRef]
  15. Nitturi, L.K.; Kapu, V.K.S.; Gugulothu, R.; Kaleru, A.; Vuyyuri, V.; Farid, A. Augmentation of heat transfer through passive techniques. Heat Transf. 2023, 52, 4422–4449. [Google Scholar] [CrossRef]
  16. Yu, Y.; Li, D.; Meng, H.; Zhang, J.; Xiang, K.; Li, W. Enhancement study of turbulent heat transfer performance of nanofluids in the clover static mixer. Int. J. Therm. Sci. 2024, 198, 108900. [Google Scholar] [CrossRef]
  17. Al-Chlaihawi, K.K.I.; Hasan, M.R.; Ekaid, A.L. Compound passive heat transfer augmentation techniques: A comprehensive review. Heat Transf. 2024, 53, 363–421. [Google Scholar] [CrossRef]
  18. Liu, X.; Zhao, X.; Ran, L.; Xiao, H.; Zhang, Y.; Zhang, Y.; Liu, Y.; Zhang, N.; Ding, M. Analysis of enhanced heat transfer characteristics in a bionic fish scale tube for turbulent flow. Nucl. Eng. Technol. 2025, 57, 103715. [Google Scholar] [CrossRef]
  19. Shen, J.; Liu, Z.; Huang, D.; Huang, G.; Li, W.; Shan, L. Enhanced single-phase and two-phase flow heat transfer in vertical tube. Appl. Therm. Eng. 2025, 280, 128329. [Google Scholar] [CrossRef]
  20. Muneeshwaran, M.; Srinivasan, G.; Muthukumar, P.; Wang, C.C. Role of hybrid-nanofluid in heat transfer enhancement–A review. Int. Commun. Heat Mass Transf. 2021, 125, 105341. [Google Scholar] [CrossRef]
  21. Lee, M.S.; Gwon, J.G.; Seo, Y.M.; Choi, H.K.; Park, Y.G. Ellipsoidal protrusions for enhanced thermal performance in fin-tube heat exchangers. Case Stud. Therm. Eng. 2025, 74, 106770. [Google Scholar] [CrossRef]
  22. Sharma, R.; Mishra, D.P.; Wasilewski, M.; Brar, L.S. Application of response surface methodology and artificial neural network to optimize the curved trapezoidal winglet geometry for enhancing the performance of a fin-and-tube heat exchanger. Energies 2023, 16, 4209. [Google Scholar] [CrossRef]
  23. Wang, F.; Li, Y.; Liu, M.; Pang, D.; Du, W.; Zhang, Y.; Cheng, X.; Gu, T.; Guo, W. Comprehensive evaluation of the performances of heat exchangers with aluminum and copper finned tubes. Int. J. Chem. Eng. 2023, 2023, 6666947. [Google Scholar] [CrossRef]
  24. Zheng, Z.; Lu, Y.; Qu, S.; Wang, X. A study of the correlation between FSI flow behaviors and losses for the supersonic turbine cascade with millimeter-level ultra-thin blades and a high inlet flow angle. Aerosp. Sci. Technol. 2026, 172, 111700. [Google Scholar] [CrossRef]
  25. Ouyang, X.; Hu, H. Simulation study on optimal structure of circular corrugated finned tube. Int. J. Therm. Sci. 2022, 179, 107622. [Google Scholar] [CrossRef]
  26. Torbarina, F.; Trp, A.; Lenić, K. Numerical analysis of geometry influence on heat transfer in a slotted fin and tube heat exchanger. Heat Transf. Eng. 2023, 44, 411–425. [Google Scholar] [CrossRef]
  27. Deeb, R. The impact of drop-shaped pin-fins on the thermal and hydraulic characteristics of a finned tube. Phys. Fluids 2024, 36, 075148. [Google Scholar] [CrossRef]
  28. Mustafa, A.W.; Salih, S.R. Evolutionary design of triangular multiscale fins in cross-flow. Int. J. Therm. Sci. 2024, 199, 108924. [Google Scholar] [CrossRef]
  29. Ajeel, R.K.; Sopian, K.; Zulkifli, R.; Fayyadh, S.N.; Hilo, A.K. Assessment and analysis of binary hybrid nanofluid impact on new configurations for curved-corrugated channel. Adv. Powder Technol. 2021, 32, 3869–3884. [Google Scholar] [CrossRef]
  30. Liu, L.; Jiang, X.; Tang, H.; Xu, H.; Zhang, X. Experimental and numerical investigation on the flow and heat transfer characteristics of the variable cross-section internally finned tube. Int. J. Heat Mass Transf. 2025, 239, 126589. [Google Scholar] [CrossRef]
  31. Liang, X.; Min, M.; Bian, K.; Cheng, J. Study on the enhanced heat transfer and exergy performance of the finned tube heat exchanger with vortex generator. Int. J. Therm. Sci. 2025, 210, 109639. [Google Scholar] [CrossRef]
  32. Tu, Y.P.; Lin, H.T.; Yeh, R.H. Experimental study of fully developed turbulent flow in internally finned tubes. J. Enhanc. Heat Transf. 2025, 32, 1–26. [Google Scholar] [CrossRef]
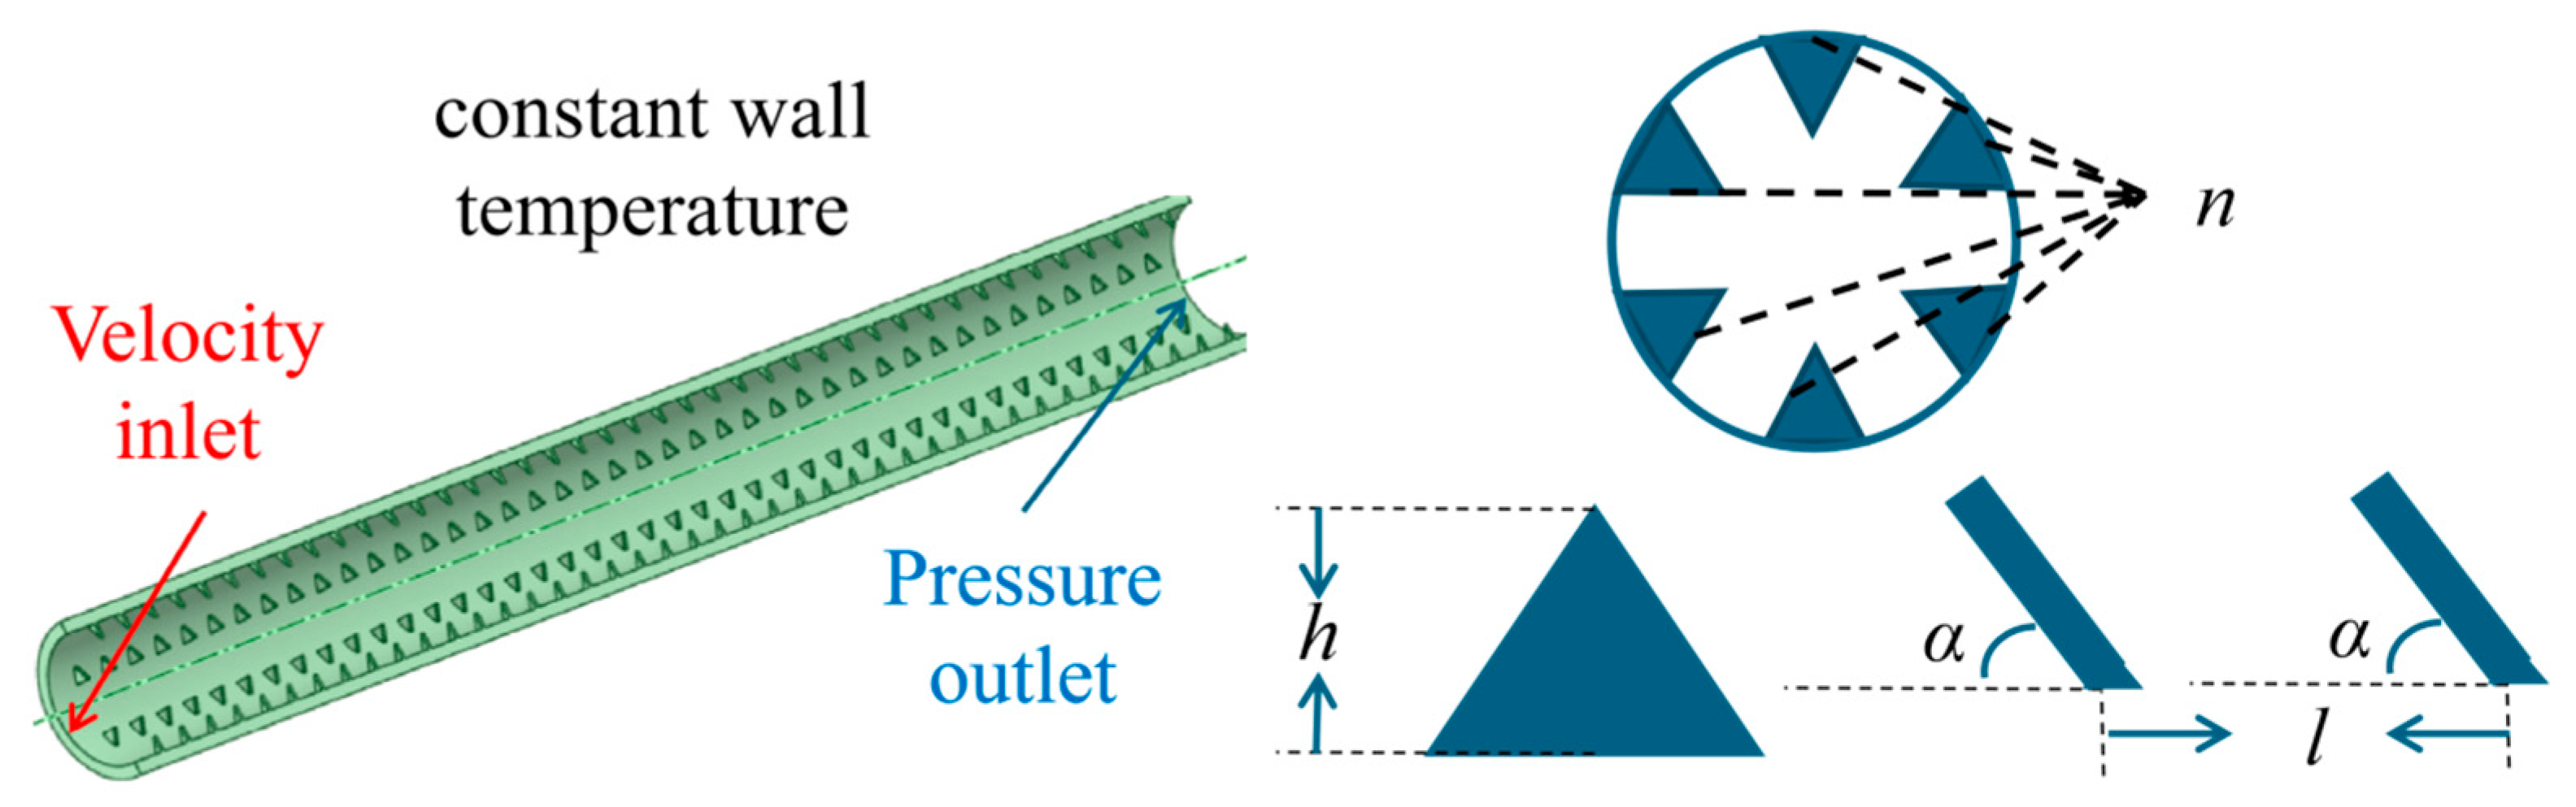
Figure 1. Triangular internal fins and tube model.
Processes 14 01748 g001
Figure 2. (a) Grid division diagram, (b) Grid independence verification.
Processes 14 01748 g002
Figure 3. Model validity verification: (a) Verification of Nu (b) Verification of f.
Processes 14 01748 g003
Figure 4. Fins with different l: (a) Variation in Nu with Re, (b) Variation in f with Re, (c) Variation in PEC with Re.
Processes 14 01748 g004
Figure 5. Fins with different h: (a) Variation in Nu with Re, (b) Variation in f with Re, (c) Variation in PEC with Re.
Processes 14 01748 g005
Figure 6. Fins with different n (a) Variation in Nu with Re, (b) Variation in f with Re, (c) Variation in PEC with Re.
Processes 14 01748 g006
Figure 7. Fins with different α (a) Variation in Nu with Re, (b) Variation in f with Re, (c) Variation in PEC with Re.
Processes 14 01748 g007
Figure 8. Axial velocity distribution of fins with different Re.
Processes 14 01748 g008
Figure 9. Streamline the distribution of fins with different Re.
Processes 14 01748 g009
Figure 10. Axial velocity distribution of fins with different h (Re = 9545).
Processes 14 01748 g010
Figure 11. Streamline distribution of fins with different h (Re = 9545).
Processes 14 01748 g011
Figure 12. Axial velocity distribution of fins with different n (Re = 9545).
Processes 14 01748 g012
Figure 13. Streamline distribution of fins with different n (Re = 9545).
Processes 14 01748 g013
Figure 14. Axial velocity distribution of fins with different α (Re = 9545).
Processes 14 01748 g014
Figure 15. Streamline distribution of fins with different α (Re = 9545).
Processes 14 01748 g015
Figure 16. Temperature distribution of fins with different Re.
Processes 14 01748 g016
Figure 17. Temperature distribution of fins with different h (Re = 9545).
Processes 14 01748 g017
Figure 18. Temperature distribution of fins with different n (Re = 9545).
Processes 14 01748 g018
Figure 19. Temperature distribution of fins with different α (Re = 9545).
Processes 14 01748 g019
Figure 20. Distribution diagram of θ inside triangular finned tubes with different Re.
Processes 14 01748 g020
Figure 21. Distribution diagram of θ inside triangular finned tubes with different h (Re = 9545).
Processes 14 01748 g021
Figure 22. Distribution diagram of θ inside triangular finned tubes with different n (Re = 9545).
Processes 14 01748 g022
Figure 23. Distribution diagram of θ inside triangular finned tubes with different α (Re = 9545).
Processes 14 01748 g023
Table 1. Parameter Settings.
Boundary NameTypeValue
InletTemperature/K300
Velocity/(m·s−1)0.5/0.75/1/1.25/1.5
OutletPressure/PaG0
WallTemperature/K268.36
Disclaimer/Publisher’s Note: The statements, opinions and data contained in all publications are solely those of the individual author(s) and contributor(s) and not of MDPI and/or the editor(s). MDPI and/or the editor(s) disclaim responsibility for any injury to people or property resulting from any ideas, methods, instructions or products referred to in the content.