Article

Effect of Monomaterial and Multimaterial Packaging on the Stability of Bioactive Compounds and Lipid Oxidation in Roasted Arabica Coffee


by
Daniel Velloso Cabral
1,*,
Roberto Braz da Silva Filho
1,
Tatianne Ferreira de Oliveira
1,
Claudio Fernandes Cardoso
1,
Alessandra Lopes de Oliveira
2,
Julio Cesar Colivet Briceno
3,* and
Flávio Alves da Silva
1
1
Engenharia de Alimentos, Escola de Agronomia, Campus Samambaia, Universidade Federal de Goiás, Goiânia 74690-900, Brazil
2
Departamento de Engenharia de Alimentos, Faculdade de Zootecnia e Engenharia de Alimentos, Universidade de São Paulo, São Paulo 13635-900, Brazil
3
Departamento de Alimentos e Nutrição, Faculdade de Nutrição, Universidade Federal do Mato Grosso, Cuiabá 78060-900, Brazil
*
Authors to whom correspondence should be addressed.
Processes 2026, 14(11), 1740; https://doi.org/10.3390/pr14111740
Submission received: 28 March 2026 / Revised: 16 April 2026 / Accepted: 24 April 2026 / Published: 27 May 2026

Abstract

Coffee has a complex aroma, over 1000 volatile compounds, and high lipid content. However, it is prone to volatile loss and lipid oxidation during storage. This makes packaging critical for quality preservation. This study evaluated monomaterial and multimaterial packaging for roasted Coffea arabica. Moisture, pH, and color were monitored. Volatile compounds were analyzed (GC–MS). Phenolics were determined (Folin–Ciocalteu). Antioxidant activity (ABTS, DPPH, and FRAP) was integrated into a relative antioxidant capacity index. Oxidative stability was assessed via acid value, peroxide, p-anisidine, total oxidation, and fatty acid profile (GC–MS) in oil extracted by supercritical fluid. Shelf-life was estimated from peroxide and p-anisidine values using kinetic models with the Arrhenius equation and nonlinear regression (Levenberg–Marquardt). Multimaterial packaging showed greater stability at 50 °C. pH remained slightly variable. Color changes were more pronounced in monomaterial packaging. Notably, freshness-related volatiles, such as 2,3-butanedione and 3-methylbutanal, decreased, while deterioration markers increased, like 1-methylpyrrole-2-carboxaldehyde and ethylpyrazine. Phenolics and antioxidant activity also declined, especially in monomaterial packaging. Monomaterial packaging showed lower oxidative stability and shorter shelf-life (179 and 63 days) than multimaterial packaging (466 and 79 days). However, monomaterial packaging remains promising due to its lower material requirements, recyclability, and lower environmental impact.

1. Introduction

The coffee plant, native to Africa, belongs to the genus Coffee in the Rubiaceae family. Its fruits produce seeds known as coffee beans. In the 2023/2024 crop, Coffea arabica comprised 57.4% of global coffee production, and Coffea canephora comprised 42.6%, referring specifically to the proportions of these two main cultivated species. Furthermore, global consumption was estimated at 177 million 60 kg bags [1]. During coffee roasting, various aromatic compounds form due to Maillard reaction, Strecker degradation, caramelization, and pyrolysis [2]. More than 1000 volatile organic compounds (VOCs) have already been identified in roasted coffee [3]. These include furans, pyrazines, aldehydes, ketones, phenolic compounds, thiols, volatile acids, esters, pyrroles, and pyridines [4]. These compounds are directly related to sensory characteristics. For example, 2,3-butanedione gives buttery notes, 2,3-pentanedione provides caramel notes, 2,5-dimethylpyrazine contributes nutty notes, and 2,6-dimethylpyrazine adds chocolate notes [5].
Storage makes coffee susceptible to the loss of sensory quality, mainly due to the reduction of VOCs responsible for its freshness [6,7,8], as well as to the degradation and formation of new compounds resulting from lipid oxidation [9,10], a process known as staling. Monitoring compounds such as 2-butanone, 2-methylfuran, dimethyl disulfide, and methanethiol proved to be effective, as demonstrated by another study [7] that evaluated the loss of coffee freshness after opening the original packaging and its reconditioning in new packages. Additionally, the reduction in aromatic quality was attributed to the formation of methional, 5-methylfurfural, and 2-isopropyl-3-methoxypyrazine in coffees stored for twelve months under two different packaging types [8]. The monitoring of volatile organic compounds characteristic of product aging was also reported by another study [11], which observed increases in the concentrations of acetic acid, propanoic acid, 1-H-pyrrole-2-carboxaldehyde, and 5-(hydroxymethyl)-dihydro-2(3H)-furanone in stored coffees, regardless of the type of packaging used.
Storage conditions also promote lipid oxidation, resulting in the formation of peroxides and hydroperoxides (primary oxidation), as well as ketones, aldehydes, and hydroxyl compounds (secondary oxidation) [9,12]. Cong et al. [9], when storing green coffee under accelerated deterioration conditions (40, 50, and 60 °C), observed the impact of temperature on oxidation indices, such as acid value, peroxide value, p-anisidine value, thiobarbituric acid reactive substances (TBARS), and saturated fatty acid content, which increased over time (more markedly at 60 °C). The type of packaging was also directly related to protection against lipid oxidation in green coffee beans packed in GrainPro® packaging, with low oxygen permeability, which showed greater stability compared with those stored in low-density polyethylene (LDPE) or in bags with plastic liners [10].
It is noteworthy that both storage conditions (temperature and humidity) and the type of packaging used for coffee directly influence the maintenance of its quality during storage. However, the use of plastic packaging generates a major environmental impact. Between 1950 and 2015, only 9% of plastics were recycled, 30% remained in use, and 60% were improperly discarded [13]. The low recycling rate is related to the presence of multiple materials in packaging, generally composed of polyethylene terephthalate (PET)/aluminum (Al)/polyethylene (PE), which prevents the separation of their constituents in recycling centers due to the lack of adequate equipment and infrastructure, resulting in improper disposal [14].
An alternative to mitigate this problem is the use of monomaterial packaging, composed of a single polymer, such as PE or polypropylene (PP) [15]. For example, studies indicate that PE-based monomaterial packaging coated with plant fibers showed a greater barrier to oxygen and water vapor permeation than multimaterial packaging, suggesting possible effectiveness in food packaging [16]. In a similar vein, the use of high-density polyethylene (HDPE) monomaterial packaging proved more efficient at preserving fresh chicken fillet than amorphous PET/PE multimaterial packaging [17].
However, no studies have compared the storage of roasted coffee beans in PE-based monomaterial packaging with conventional multimaterial packaging. Therefore, we expected similar preservation of roasted coffee bean quality in both types. This study compares the effectiveness of PE-based monomaterial and multimaterial packaging by analyzing VOCs, lipid oxidation, and the stability and antioxidant activity of bioactive compounds. These findings may advance scientific understanding of coffee packaging performance and support sustainable packaging strategies in the coffee industry.

2. Materials and Methods

2.1. Coffee, Roasting, and Packaging

The coffee (Coffea arabica) used in this study was cultivated in the Cerrado Mineiro region, in the municipality of Rio Paranaíba, state of Minas Gerais, Brazil, at a latitude of −19.1942°, longitude of −46.2437°, and an altitude of 1100 m. There was no record of the harvest date or of the type of processing applied to the product.
The beans were roasted in a single batch in a Leogap Ipanema Ecológico roaster (Leogap Probat Group, Curitiba, Brazil) for 12 min at 160 °C. After the first crack (an audible popping sound resulting from the expansion of the beans), samples were taken for visual color evaluation. Subsequently, the roasted coffee was stored for 96 h in a stainless-steel drum to allow the beans to degas.
After this period, 3 kg of coffee was separated as time zero samples (T0). The remaining coffee was packed in two types of non-transparent, flexible, stand-up packaging, under normal atmosphere conditions. The packaging was donated by Finepack (Itupeva, Brazil). The first packaging, called multimaterial (MT), had layers of PET/Al/PE. The second, monomaterial (MN), consisted exclusively of PE. Structural specifications, basis weight, and thickness on each package are detailed in Table S1 (Supplementary Material). Each package contained 120 g of roasted coffee beans, totaling 120 units: 60 MT and 60 MN. Packages were sealed with a Barbi Linha 400 CP pedal sealer (Barbi, Brazil).
The packages used for storage were placed in two BOD SP-500 incubators (SPLabor, Presidente Prudente, Brazil) and one Ethik 411—3D incubator (Ethik Technology, Vargem Grande Paulista, Brazil) at 25 °C, 40 °C, and 50 °C for 28 days. This constituted an accelerated shelf-life test (ASLT) using adapted methods [9,10,18]. The coffee not used in the analyses (remaining samples) was packed in sealed plastic bags, then wrapped in hermetic plastic packaging and stored in an Esmaltec EFH500 freezer (Esmaltec, Maracanaú, Brazil) at −20 °C until future analyses.
For all analyses, approximately 20 g of coffee beans was weighed using a Gehaka AG200 semi-analytical balance (Gehaka, São Paulo, Brazil). Subsequently, the beans were ground using an Oster electric grinder (OMDR 100-220, Newell Brands, Brazil).

2.2. Moisture, pH, and Color

For the determination of moisture content, the AOAC 925.45b methodology was followed [19]. The hydrogen potential (pH) was determined according to the AOAC 973.41 [20]. All determinations were carried out in triplicate.
The roasted and ground coffee samples were analyzed using a ColorQuest XE colorimeter (Hunter Associates Laboratory, Reston, VA, USA). The results were expressed according to the International Commission on Illumination (CIE) on the LAB scale, where L* represents lightness, a* shows the position between red and green, and b* shows the variation between yellow and blue. Based on these values and using Equations (1) and (2), saturation (C*), also called chroma, and the hue angle (H°), or hue, were calculated. Equation (3) was used to determine color variation (ΔEab*). Measurements were performed in decuplicate:
C   =   a 2   +   b 2 ,
H ° = tan 1 b a ,
E a b = L 0 L 2 + a 0 a 2 + b 0 b 2   ,
where L0, a0, and b0 refer to the L*, a*, and b* parameters of the coffee at time zero, respectively.

2.3. Volatile Organic Compounds

For the analysis of volatile organic compounds (VOCs), the methodology described in [21] was followed. Three grams of each ground coffee sample were incubated in vials suitable for headspace gas chromatography (HS-GC-MS), using a Nexis GC 2030 chromatograph (Shimadzu, Kyoto, Japan), coupled to a QP2020 Nexis mass spectrometer (Shimadzu, Kyoto, Japan), operating in scan mode, with an SH-Stabilwax-MS column (30 m × 0.25 mm × 0.25 μm). The vials were incubated at 60 °C with agitation at 300 rpm, and the syringe was maintained at 70 °C. A pre-purge of 5 s, an injection flow of 10 mL/min, and a total analysis time of 60 min were used. The chromatograph conditions included an injector temperature of 250 °C in split mode. The oven temperature was initially set to 40 °C for 5 min, then increased at 5 °C/min until reaching 160 °C (with no hold), followed by a ramp of 10 °C/min to 250 °C, which was held for 15 min. The total oven program lasted 53 min. Flow control was set in linear velocity mode, with a pressure of 45.1 kPa, a total flow of 13.4 mL/min, and a column flow of 0.94 mL/min. The linear velocity was 35 cm/s, and the purge flow was 3.0 mL/min.

2.4. Extraction of Bioactive Compounds

The extraction of bioactive compounds was performed using methanol as the extraction solvent. For this purpose, approximately 0.2 g of each coffee sample was added to 50 mL of 70% methanol (Êxodo Científica, Sumaré, Brazil) (v/v). The mixture was subjected to an ultrasonic bath D409X (Digital Ultrasonic Cleaner, CTA, Porto Alegre, Brazil) at 25 °C for 10 min. Subsequently, the samples were filtered using filter paper and stored in amber flasks, according to methodologies adapted from [22,23]. The extracts were stored in a U570 freezer (New Brunswick, Eppendorf, Germany) at −80 °C until analyses of phenolic compounds and antioxidant activity were performed.

2.5. Total Phenolic Content

The Folin–Ciocalteu method was used to determine total phenolic content (TPC) according to the methodology adapted from [24]. A standard curve was prepared using five previously prepared gallic acid (Perfyl Tech, São Bernardo do Campo, Brazil) solutions (20–100 mg/L). The tubes were kept protected from light for 60 min. After this period, absorbance was measured using a UV-1800 spectrophotometer (Shimadzu, Kyoto, Japan) at 765 nm. The TPC was expressed as mg of gallic acid equivalents (GAEs) per gram of sample, on a dry base (d.b.). All analyses were performed in triplicate.

2.6. ABTS•+

Antioxidant activity was determined using the 2,2-azino-bis-ethylbenzothiazoline-6-sulfonic acid radical (ABTS•+) method, adapted from [25]. To generate the radical, ABTS (Sigma Aldrich, Steinheim, Germany) (7 mM) was first mixed with potassium persulfate (140 mM), and the mixture was allowed to react. A Trolox (Sigma Aldrich, Steinheim, Germany) standard curve (6-hydroxy-2,5,7,8-tetramethylchromane-2-carboxylic acid) ranging from 100 to 2000 µM was prepared for quantification. All solutions were homogenized and kept protected from light, and the absorbance was measured at 734 nm using a UV-1800 spectrophotometer. Results were expressed as mg of Trolox equivalent (TE) per gram of sample (d.b.).

2.7. DPPH

Antioxidant activity was determined by the 2,2-diphenyl-1-picrylhydrazyl (DPPH) method, as described by [26]. A DPPH (Sigma Aldrich, Steinheim, Germany) solution (60 µM) and a Trolox standard curve (0–1000 µM) were used. Mixtures were homogenized, kept protected from light for two hours, and absorbance was measured at 517 nm using a UV-1800 spectrophotometer. Results were expressed as mg of TE per gram of sample (dry base).

2.8. FRAP

Antioxidant activity was determined using the Ferric reducing antioxidant power (FRAP) method, as described by [27]. The FRAP reagent (Sigma Aldrich, Steinheim, Germany) was prepared by mixing solutions of HCl (Neon, Suzano, Brazil) (40 mM), TPTZ (Sigma Aldrich, Steinheim, Germany) (2,4,6-tris(2-pyridyl)-s-triazine) (10 mM), FeCl3 (Êxodo Científica, Sumaré, Brazil) (20 mM), and acetate buffer (0.3 M). The standard curve was constructed using Trolox (0–800 µM). After homogenization, the samples were incubated in a water bath at 37 °C for 30 min, and the absorbance was measured at 595 nm using a UV-1800 spectrophotometer. The results were expressed as mg of TE per gram of sample (d.b.).

2.9. Relative Antioxidant Capacity Index

The relative antioxidant capacity index (RACI) was determined as proposed by [28], based on the standardization of results from the different antioxidant assays (ABTS, DPPH, and FRAP) and calculated using Equations (4) and (5):
Z i j   =   x i j   μ j σ j ,
R A C I I = Z F E N + Z A B T S + Z D P P H + Z F R A P 4 ,
where Zij is the standardized score of the value xij of variable j for sample i, xij is the observed value of sample i for variable j, µj is the mean of variable j, σj is the standard deviation of variable j, and RACIi is the relative antioxidant capacity index of sample i.

2.10. Supercritical Fluid Extraction

Oil was extracted from the coffee samples following a methodology adapted from [29]. First, approximately 95 g of coffee samples was compacted into a cylindrical extractor along with inert glass beads. Next, extraction was performed in an SFE-500 extractor (Thar SCF Water, Milford, MA, USA), using CO2 (Messer, São Paulo, Brazil; 99.9% purity) as supercritical fluid. The process lasted 210 min at 300 bar and 50 °C. Finally, the extract obtained via supercritical fluid extraction (SFE) was collected in penicillin vials.

2.11. Acid Value

The acid value (AV) of the SFE extracts was determined using method Cd 3d-63 of the American Oil Chemists’ Society (AOCS). About 2 g of each sample was diluted in petroleum ether (Neon, Suzano, Brazil) and ethyl alcohol (Êxodo Científica, Sumaré, Brazil) solution (2:1, v/v). This solution was titrated with 0.01 M sodium hydroxide (Êxodo Científica, Sumaré, Brazil), and the consumed volume was recorded. Results, expressed as mg KOH per gram of oil, were calculated using Equation (6). All analyses were performed in triplicate [30]:
A V   =   V · M · f · 56.1 P ,
where V is the volume (mL) of NaOH used in the titration, M is the molarity of the NaOH solution, f is the correction factor of the NaOH solution, and P is the mass of the sample.

2.12. Peroxide Value

The peroxide value (PV) was determined according to the methodology of the AOCS Cd 8b-90. Approximately 1 g of SFE extract was diluted in an Erlenmeyer flask with 50 mL of an acetic acid:isooctane solution (3:2, v/v). Next, 0.5 mL of saturated potassium iodide (KI) (Êxodo Científica, Sumaré, Brazil) solution was added. The resulting mixture was then titrated with 0.1 M sodium thiosulfate (Êxodo Científica, Sumaré, Brazil). Following titration, 0.5 mL of 10% (w/v) sodium lauryl sulfate (Êxodo Científica, Sumaré, Brazil) was added to the Erlenmeyer flask, followed by 0.5 mL of starch indicator solution (Hach Company, Loveland, CO, USA). The PV was expressed as milliequivalents of peroxide (meq) per kg of oil, according to Equation (7). All analyses were performed in triplicate [31]:
P V   =   ( S     B ) · M · 1000 m ,
where S is the volume used in the titration of the sample, in mL, B is the volume used in the titration of the blank, in mL, M is the molarity of the sodium thiosulfate solution, and m is the mass of the sample used, in g.

2.13. p-Anisidine

The p-anisidine value (p-AV) was determined according to the AOCS Cd 18-90 method. Briefly, 0.5 g of SFE extract was added to a 25 mL volumetric flask and brought to volume with isooctane (Vetec, Rio de Janeiro, Brazil). Absorbance was measured at 350 nm using a UV-1800 spectrophotometer, with isooctane as the blank. This reading was designated as Ab. From this flask, 5 mL was pipetted into a test tube. Another 5 mL of isooctane was added to a second tube. Both tubes received 1 mL of 0.25% (w/v) p-anisidine solution (Êxodo Científica, Sumaré, Brazil). The tubes were mixed. After 10 min, absorbance of the first tube (As) was determined at 350 nm, using the second tube as the blank. The p-AV was calculated according to Equation (8). All analyses were performed in triplicate [32]:
p A V   =   25 · 1.2   A s     A b m ,
where As is the absorbance of the tube after reaction with p-anisidine, Ab is the absorbance of the solution in the volumetric flask, and m is the mass of the sample used.

2.14. Total Oxidation

To determine the total oxidation value (TOTOX) of the oil obtained by SFE, Equation (9) was used, as described by [9], which represents oxidation by the peroxide value and secondary oxidation by the p-anisidine value:
T O T O X   =   p A V   +   2 P V ,
where p-AV is the p-anisidine value, and PV is the peroxide value.

2.15. Fatty Acids Profile

2.15.1. Transesterification of Fatty Acids

The transesterification of fatty acids was performed using the AOAC 969.33-2005 method, with adaptations. About 0.1 g of the SFE extracts was mixed with 3 mL of 0.5 M NaOH. The mixture was heated in a CE 160/10 instrument (Cienlab, Campinas, Brazil) at 90 °C for 10 min. Next, 5 mL of a 14% (v/v) boron trifluoride (Neon, Suzano, Brazil) (BF3) solution in methanol was added, and the mixture was heated for an additional 1 min. Then, 5 mL of analytical grade hexane (Êxodo Científica, Sumaré, Brazil) was added and heated for another minute. Afterwards, 15 mL of saturated NaCl (ACS Científica, Sumaré, Brazil) solution was added. After phase separation, the supernatant was collected in penicillin vials. A small amount of anhydrous Na2SO4 (Neon, Suzano, Brazil) was added. Finally, the supernatant was transferred to 1.5 mL vials for chromatographic analysis [33].

2.15.2. Identification of Fatty Acid Methyl Esters by Gas Chromatography

The chromatographic analysis was performed according to an adaptation of the AOAC 996.06 method by [29]. The analysis was carried out using a gas chromatograph coupled to a mass spectrometer (GC/MS) QP 2010 Plus (Shimadzu, Japan) with an automatic injector (AOC-5000, SWI). A non-bonded poly(biscyanopropylsiloxane) capillary column (df 0.2 µm, 100 m × 0.25 mm i.d; Supelco SP-2560, Bellefonte, PA, USA) was used. Helium was used as the carrier gas at a flow rate of 2.0 mL/min. The injection temperature was 250 °C, and the column temperature ranged from 100 °C to 195 °C at 278.15 °C/min and from 195 °C to 250 °C at 275.15 °C/min, with a final hold time of 40 min. The temperature of the ion source interface was 250 °C. The injected volume was 1 µL, with a split ratio of 1:12.5. Mass spectra were obtained by electron impact at 70 eV, with the quadrupole analyzer scanning from 40 to 350 m/z. Fatty acid methyl esters were identified by comparison with mass spectra using GC/MS Solutions v.2.5 software, which uses the NIST08 and NIST08s libraries.

2.16. Shelf-Life Prediction

Shelf-life for both packaging types was assessed using the oxidative indices peroxide value and p-anisidine value, with acceptance limits set per adaptations from [9,34]. Sampling occurred at all previously established storage periods. Data analysis tested zero- and first-order kinetic models (Equations (10) and (11)) and integrated them into the Arrhenius equation (Equation (12)). Kinetic parameters were fitted by nonlinear regression (Levenberg–Marquardt algorithm), and fit quality was evaluated using the coefficient of determination (R2) and root mean square deviation (RMSD):
O I   =   k t   +   O I 0 ,
l n   ( O I ) = k t + l n ( O I 0 ) ,
l n   ( k ) = E a R T + l n ( k 0 ) ,
where OI is the oxidative index, OI0 is the oxidative index at time zero, k is the reaction rate constant, k0 is the pre-exponential factor, R is the universal gas constant (8.31 J K−1 mol−1), T is the absolute temperature (K), and Ea is the activation energy (J mol−1).

2.17. Statistical Analysis

The trend in volatile organic compound behavior over the storage period was analyzed using linear regression models in RStudio (Posit PBC, Boston, MA, USA) (2024.09.0+375). The analysis was based on the slope of the fitted equations. This approach followed methods described by [35,36,37]. Values of β > 0 were attributed to compound formation, whereas β < 0 indicated compound degradation over time. The remaining data were expressed as mean ± standard deviation. Analysis of variance (ANOVA) followed by Tukey’s test at the 95% confidence level (p ≤ 0.05) was performed using TIBCO Statistica (TIBCO, San Ramon, CA, USA) (14.0). Principal component analyses (PCA) and loading interpretations were performed in RStudio using volatile compound data to identify patterns related to changes over time and the effects of storage temperature. Graphs were generated in OriginPro 2018 (OriginLab Corporation, Northampton, MA, USA).

3. Results and Discussion

3.1. Moisture Content

Statistical analyses showed that the packaging effect did not significantly influence moisture values (p > 0.05), unlike the effects of temperature and time (p < 0.001), as well as the interactions packaging x temperature and packaging x time (p < 0.05). It is noteworthy that the temperature x time interaction was significant (p < 0.001), indicating that moisture variation during storage was directly influenced by storage temperature. No significant variation in moisture content was observed in coffee stored in MT packaging as the temperature increased. In contrast, coffee packed in MN packaging showed a significant increase in moisture at 50 °C (Figure 1A).
The MN-type packaging showed low water vapor transmission rate (WVTR) and oxygen transmission rate (OTR) values, as reported in Tables S2 and S3 (Supplementary Materials), compared with those values reported for MN based on oriented polyethylene and LDPE [16]. However, the presence of aluminum in the MT-type packaging structure prevents mass transfer through the metallic foil [16], which explains the WVTR and OTR values of zero (Tables S2 and S3). With increasing temperature, the WVTR and OTR increase, as polymer molecules become more mobile, forming microspaces and, consequently, increasing permeability [38,39]. This phenomenon was also reported by Romani et al. [40], who observed an increase in moisture content in biscuits stored in different packaging types as temperature increased. This behavior was attributed to physicochemical changes in polymeric materials, which increased the WVTR, indicating greater effectiveness of MT packaging compared with MN packaging under high-temperature conditions.
No significant difference in moisture content was observed between T0 and T28, indicating product stability during storage. For MN packaging, values ranged from 1.57 ± 0.17% at T0 to 1.65 ± 0.11% at T28. For MT packaging, the moisture content was 1.47 ± 0.16% at the end of the storage period (Figure 1B). In both MT and MN packaging, moisture content decreased from T0 to T7, attributed to equilibrium adjustment between the coffee beans and the environment through desorption [41].
After this period, the beans showed an increase in moisture content (from T7 to T14), explained by the hygroscopic characteristic of the product [41,42], followed by stability T14 and T28, attributed to the structural integrity of the bean, which limits further water adsorption [42]. A similar result was reported by Tripetch and Borompichaichartkul [43], who observed that the moisture content of green coffee beans remained below the maximum quality limit (12.5%) when stored in high-density polyethylene packaging for 15 months. In contrast, Moon et al. [10] found that green coffee lost moisture during storage as a function of storage temperature, with the greatest losses at high temperatures and in beans packed in packaging with a higher WVTR. Both packaging configurations maintained stable moisture content, with no significant variations observed throughout the storage period.

3.2. pH

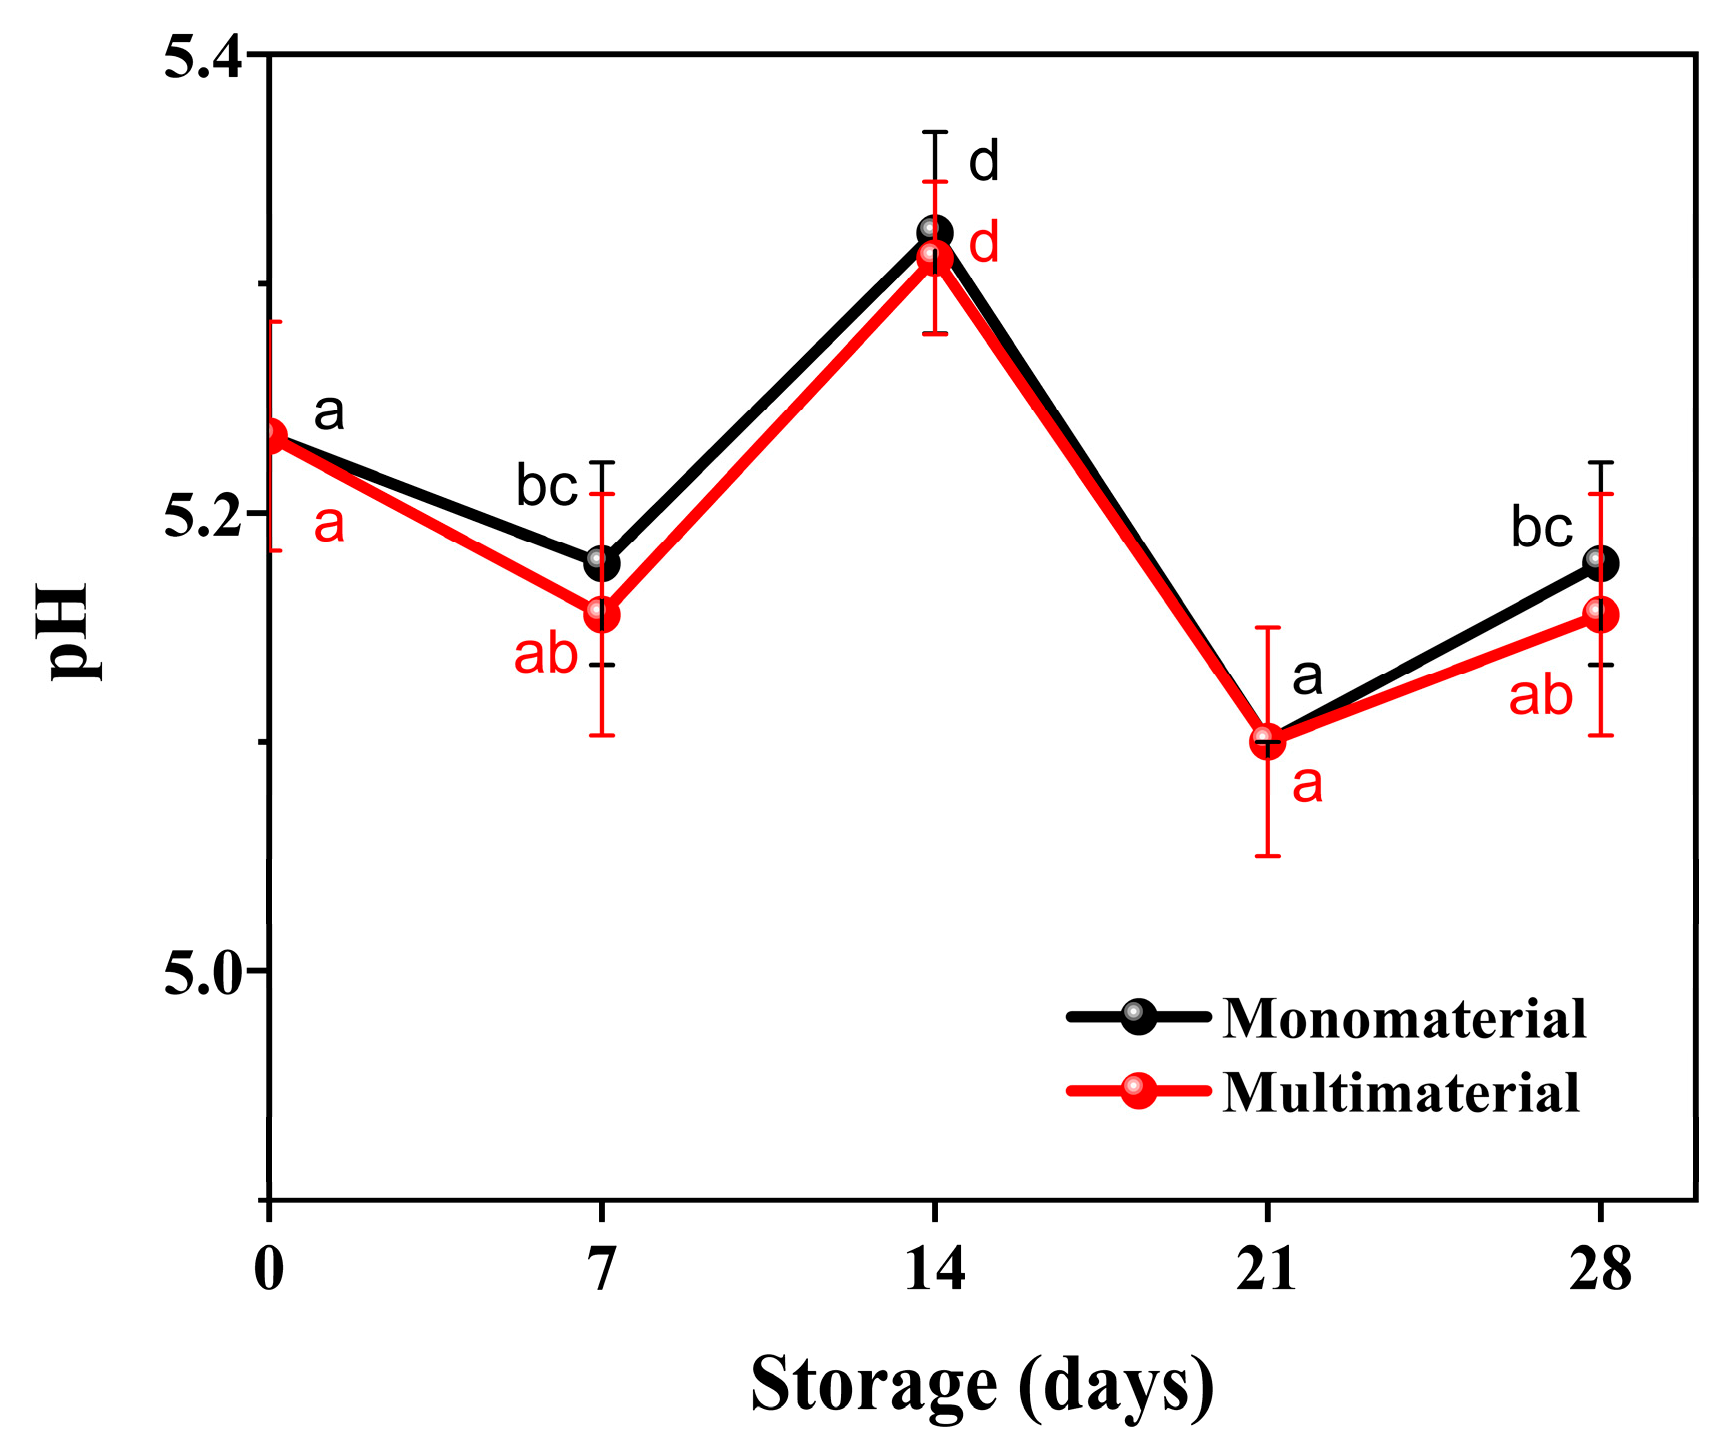
The pH in this study ranged from 5.0 to 5.4, aligning with previous findings [44,45,46]. Only the time effect significantly influenced pH (p < 0.001), while other main effects and interactions were not significant. Storage time mainly drove the slight decrease in pH from 5.23 ± 0.05 to 5.18 ± 0.04 for MN and from 5.23 ± 0.05 to 5.15 ± 0.05 for MT (Figure 2).
As shown by Wang and Lim [45], different roasting profiles can change coffee pH. The formation of acids, such as acetic, formic, and lactic acids. lowers pH. In contrast, degrading chlorogenic, malic, and citric acids raises pH. The acidity of coffee depends on its acid content, reflected in pH and titratable acidity, which are inversely related [47].
Clarke and Macrae [48] suggest that pH variation during storage is caused by changes in volatile acids’ profiles, which are influenced by packaging permeability. Strocchi et al. [11] evaluated this hypothesis by studying volatile compounds in oxidized coffee, indicating that triacylglycerol cleavage leads to the formation of free fatty acids, which, in turn, increase the concentrations of volatile acids, such as acetic and propanoic acids. The accumulation of these acids could explain the decrease in pH at the end of the storage period. Giulia et al. [49] also observed a decline in pH over time, attributing it to the formation of oxidation products (evidenced by an increased peroxide value) and increased packaging permeability.
Despite this evidence, studies systematically investigating pH variation in roasted coffee during storage remain scarce. In the present study, the loss of volatile organic compounds associated with freshness, such as 2,3-butanedione and 2-methylbutanal, was observed in both packaging configurations, while an increase in the intensity of compounds related to coffee aging, such as 1-methylpyrrole-2-carboxaldehyde and ethylpyrazine, was also detected. These results indicate that modifications in the volatile profile during storage may be associated with small changes in pH.

3.3. Color

It was observed that all effects (packaging, temperature, and time), as well as the interactions among them, resulted in highly significant changes (p < 0.001) for all color parameters analyzed (L*, a*, b*, C*, H°, and ΔE). It is noteworthy that, despite these significant differences, the variations in color parameters were not perceptible to the naked eye. The color of coffee is directly related to its roasting level [44] and to the final quality of the product [50]. At T0, the coffee presented L* = 23.48 ± 0.01, a value characteristic of samples subjected to medium roasting [51,52]. After storage in the two types of packaging, at T7, all samples showed darkening, evidenced by the decrease in the L* value, as presented in Table 1. Similar behavior had already been observed in this study for the moisture variation between T0 and T7 (Figure 1B), which also showed a reduction during this period. In addition, some studies report a relationship between the variation in moisture content and changes in the L* parameter in certain foods.
When studying the relationship between moisture content and color parameters in three varieties of walnuts, Khir et al. [53] verified a direct relationship between the increase in product moisture and the increase in the L* parameter in in-shell walnuts for all varieties analyzed. This behavior was attributed to water molecules adhering to the shell’s pores, altering the properties of the reflected light and increasing brightness with increasing moisture. In their review, Ma et al. [54] indicated that breads and confectionery products may lose brightness (decrease in L* value) as a result of moisture loss. Similarly, Alagöz et al. [55] described the correlation between moisture content and the L* parameter in sun-dried apricots, reporting that an increase in moisture led to an increase in L*.
In the present study, Table 2 shows that the Pearson correlation revels a moderate correlation between the moisture content of coffee and the L* parameter (r = 0.56, p = 0.02). This correlation suggests that variations in moisture slightly change L*, which may account for the observed oscillation of this parameter during storage, as shown in Figure 1B. Additionally, MT packaging yielded a lower variation in L* (ΔL) compared with MN packaging, with values of −1.56 and −1.71, respectively. This finding supports the causal link between moisture and L* changes, since MT packaging presented null WVTR values and thus minimized moisture transfer.
In the case of the a* parameter, which evaluates the variation from red (a* > 0) to green (a* < 0), and the b* parameter, which represents the variation from yellow (b* > 0) to blue (b* < 0), it was observed, based on the data presented in Table 1, that MT packaging showed better preservation of these color attributes throughout storage. This behavior is evidenced by smaller variations in Δa and Δb observed for MT packaging (0.46 and 1.32, respectively) compared with those recorded for MN packaging (0.82 and 1.75, respectively). Tripetch and Borompichaichartkul [43] attributed the stability of the color coordinates of green coffee (L*, a*, and b*) to beans stored in high-density polyethylene (HDPE) packaging, due to its lower vapor permeability compared with beans packed in jute bags. Benković and Tušek [56] verified that bean moisture, as well as storage temperature and relative humidity, significantly influenced the color of coffee stored in cans and plastic bags (PE/Al/PET), proposing that the latter were more effective in preserving the color of roasted coffee, since the air contained in the cans was absorbed by the beans, promoting greater changes in color.
Moisture content had a weak, negative correlation with the a* parameter (r = −0.20), and a moderate, negative correlation with the b* parameter (r = −0.46), as shown in Table 2. These results indicate that moisture helps stabilize coffee color during storage. Changes in the L*, a*, and b* parameters affect the C*, H°, and ΔE* (Table 1), which reflect saturation, hue, and total color variation, because C*, H°, and ΔE are mathematically calculated from L*, a*, and b* values.

3.4. Volatile Organic Compounds

A total of 68 VOCs were identified in the coffee samples, 35 of which were detected in all analyses. These VOCs fall into the following classes: organic acids (5), alcohols (4), aldehydes (3), ketones (7), esters (4), furans (3), nitrogen-containing heterocyclic compounds (4), and pyrazines (5). Specific compounds within these classes are linked to distinct aromas, as outlined in Table 3, including buttery notes (2,3-butanedione), nutty aroma (methylpyrazine), malty nuances (3-methylbutanal), and sweet/fruit notes (2-furanmethanol) [57,58].
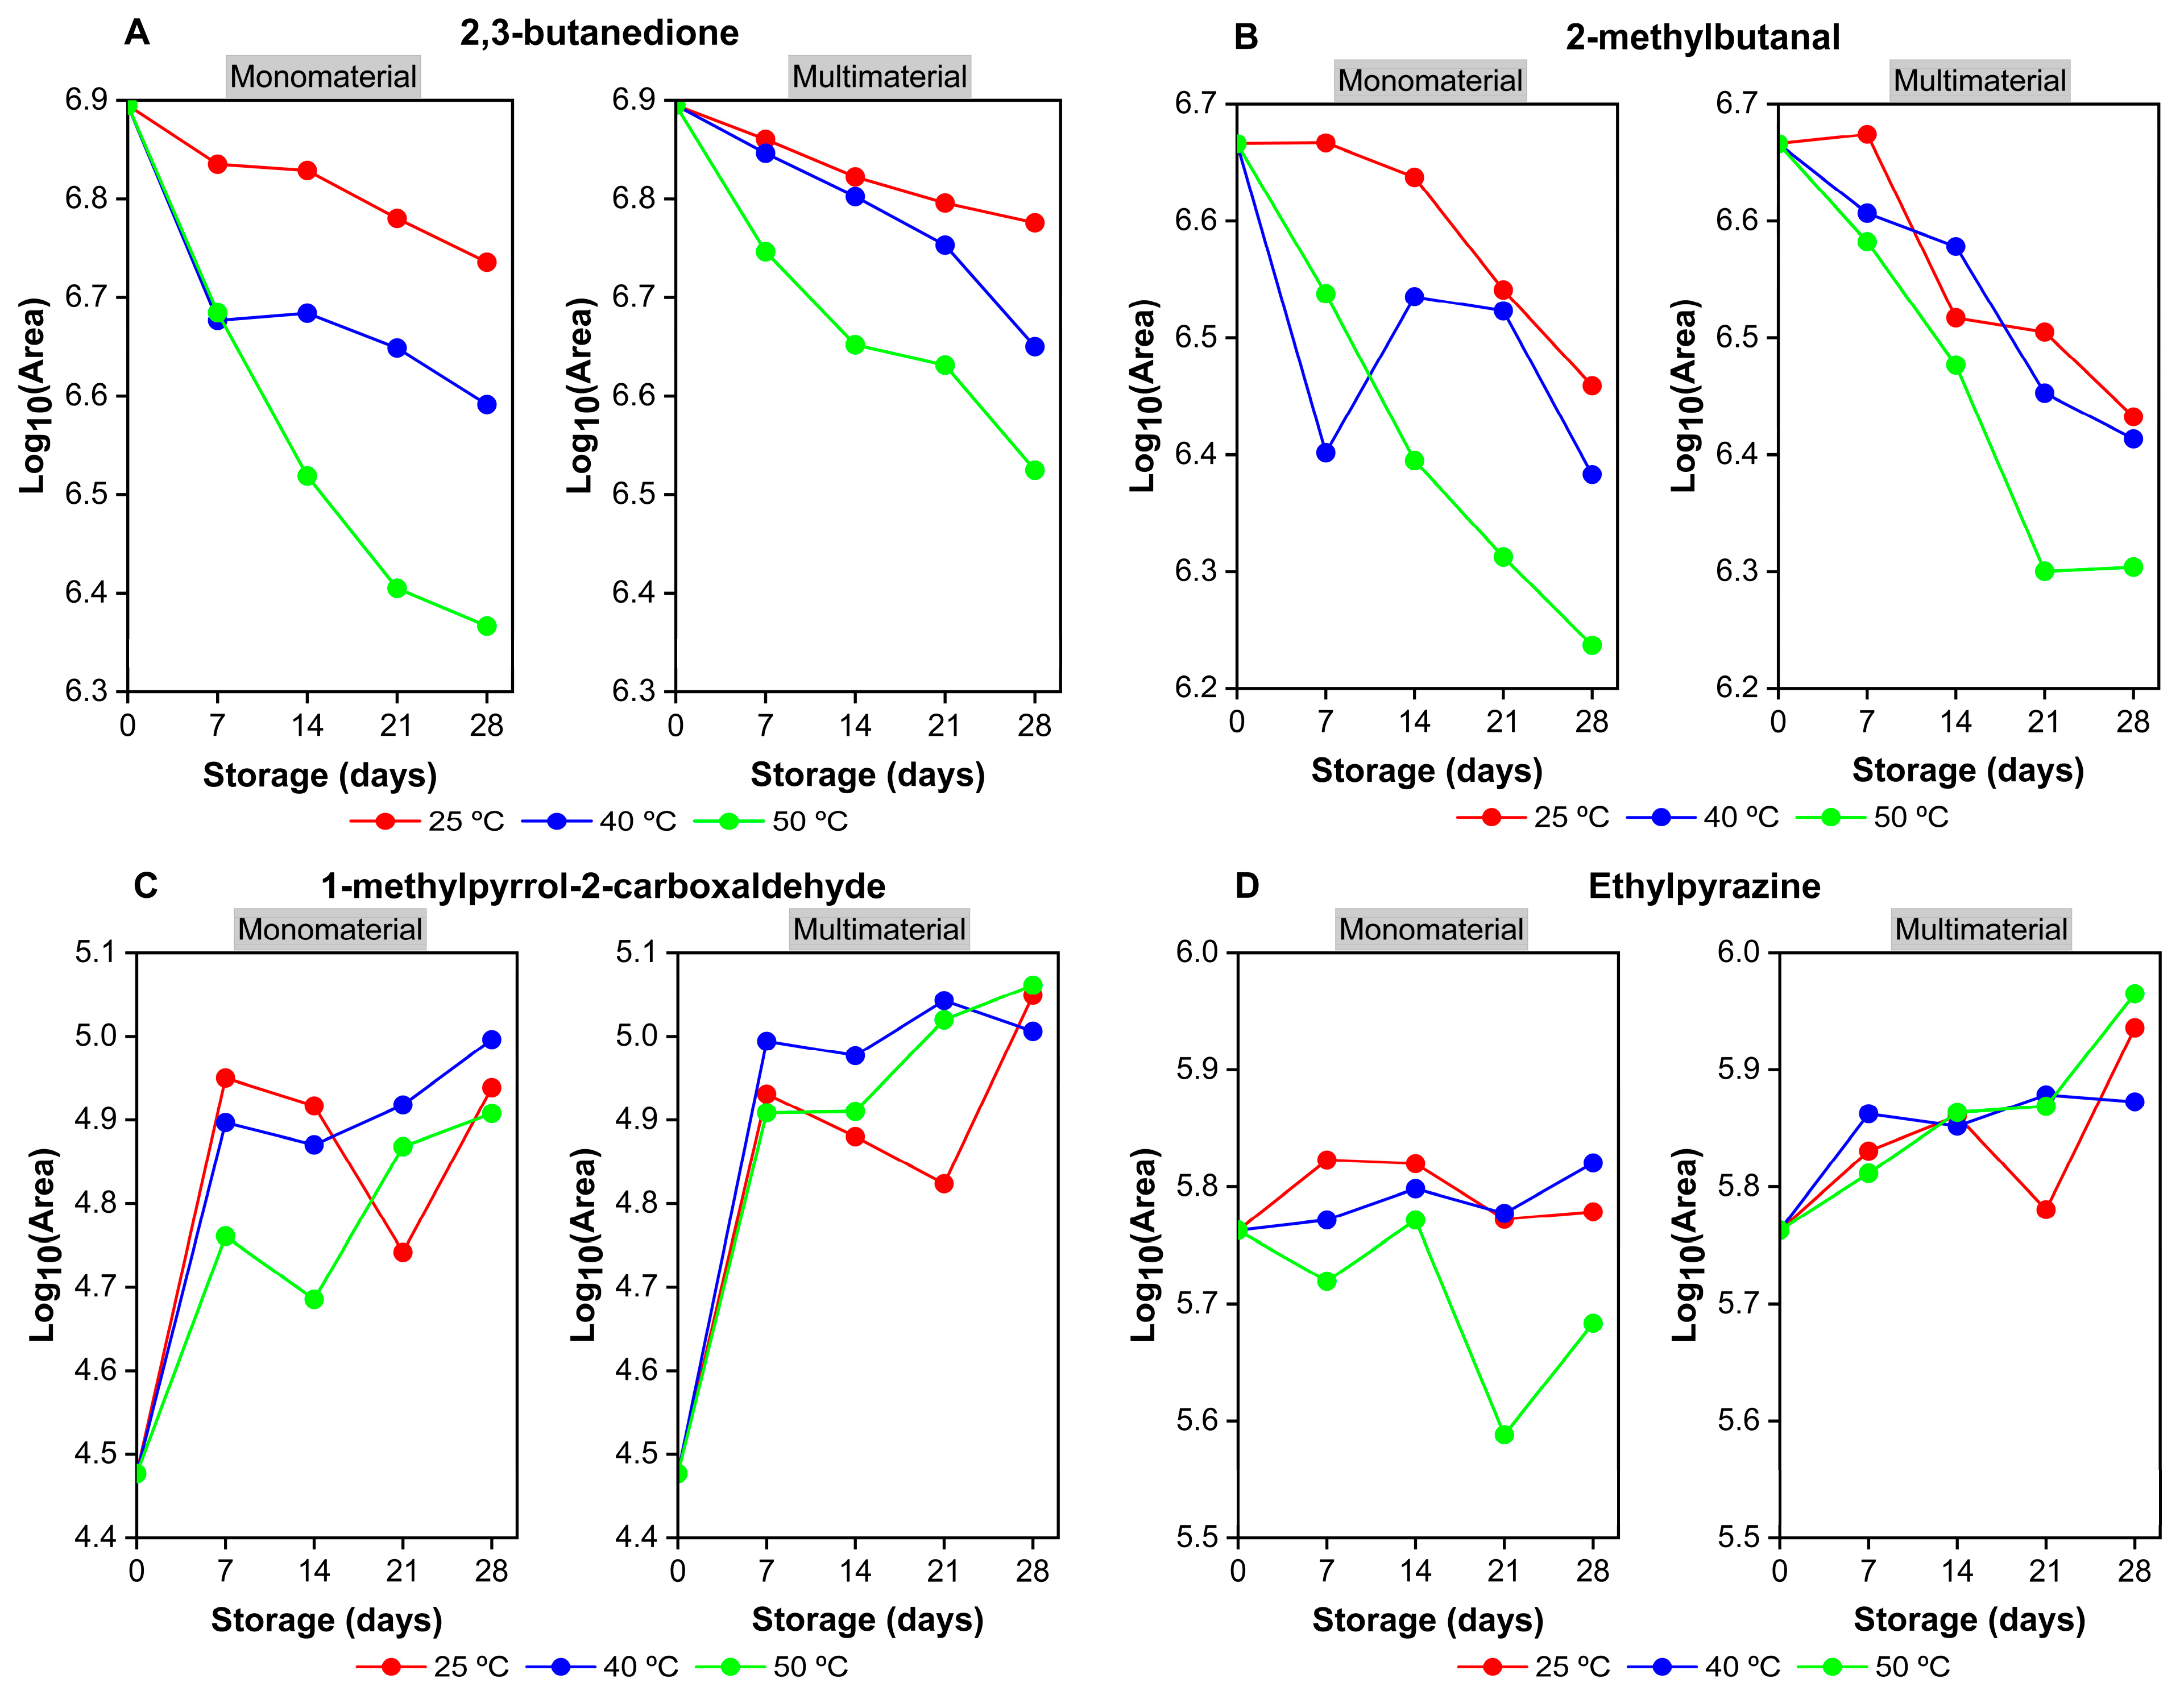
The trend of compound peak areas in chromatograms during storage was evaluated. This analysis identified 17 compounds as markers of formation or degradation. Markers were defined by the statistical significance (p < 0.05) of the slope (β) in linear regressions over time, for each packaging and temperature. Values of β < 0 indicated decreasing trends (degradation markers), while β > 0 indicated increasing trends (formation markers). Figure 3 shows examples of both.
The decrease in compound area is more pronounced at higher temperatures (40 and 50 °C), as shown in Figure 3A,B, due to greater volatilization from heat [7]. Furthermore, compounds such as 2,3-butanedione, 2-methylbutanal, furfural, and 5-methylfurfural are directly associated with the loss of coffee quality during storage [57]. Similarly, Strocchi et al. [11] observed that several compounds, including 2,3-butanedione, 2,3-pentanedione, 2-methylbutanal, 2,6-dimethylpyrazine, 2-acetylfuran, and furfural, tend to decline over storage time, indicating loss of coffee freshness.
The effect of packaging was demonstrated by Marin et al. [59], who observed a greater reduction in 2,3-butanedione in perforated packaging and in those containing atmospheric air, indicating that oxygen permeability is a major factor in the loss of volatile compounds. This behavior was also evident in the present study. When comparing the reduction of marker compounds between the two packaging configurations (Figure 3A,B), it was verified that MN packaging showed a greater loss of volatiles than MT packaging. This result is consistent with the barrier properties of the packaging, since MT, which contains an aluminum layer, has lower oxygen permeability than MN, thereby contributing to superior preservation of volatile compounds during storage.
Regarding formation markers, an increase in the compound 1-methylpyrrole-2-carboxaldehyde (Figure 3C) was observed, an indicator of aging processes in coffee, as its formation is strongly influenced by the thermal degradation of Amadori intermediates, trigonelline degradation, and caramelization [4]. This behavior is consistent with that reported by Strocchi et al. [11], who identified an increase in four volatile compounds associated with aging, including 1-methylpyrrole-2-carboxaldehyde itself, responsible for undesirable aromatic notes, such as musty odors, as well as acetic acid, 5-methyldihydro-3-(2H)-furanone, and propanoic acid. These compounds are directly related to coffee aging. Because it presents a greater barrier to gas permeation, it is believed that MT packaging favors greater accumulation of 1-methylpyrrole-2-carboxaldehyde compared with MN packaging, which promotes the loss of this volatile compound to the external environment. The same behavior was observed for ethylpyrazine (Figure 3D), a compound that may increase in concentration during storage [60], which showed a greater increase in peak area in samples stored in MT packaging than in those packed in MN packaging.
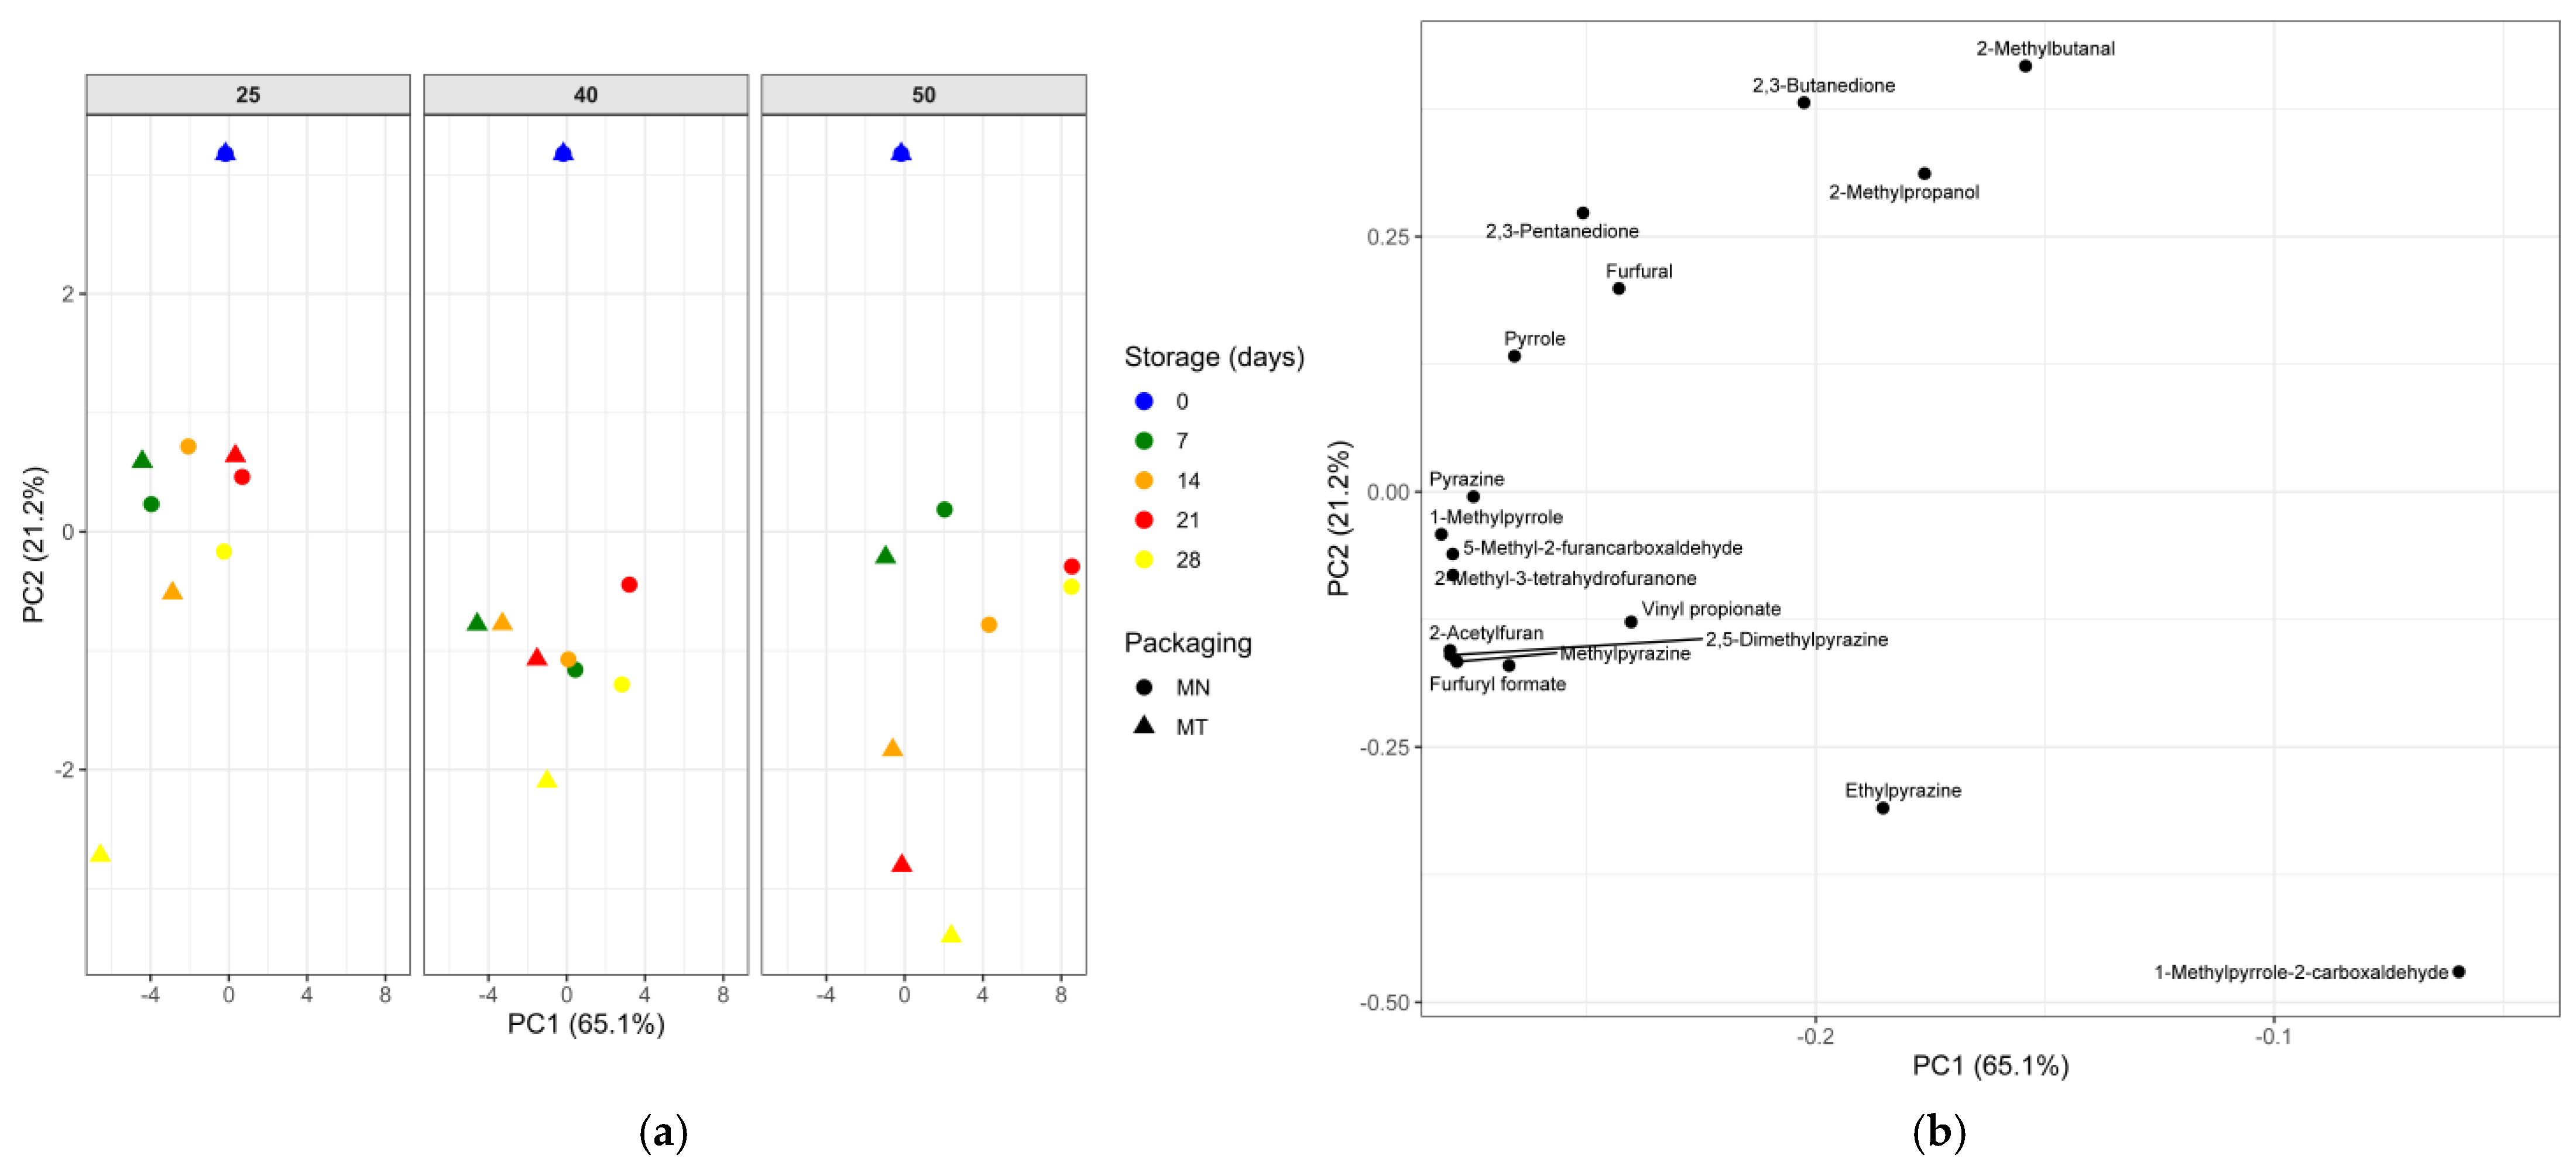
The evolution of the VOC profile during storage, as a function of temperature and packaging, was evaluated by principal component analysis (Figure 4a). The components PC1 and PC2 explain 86.3% of the total variance, indicating that most of the differences among the samples are summarized on these two axes. In the graph, each point represents a combination of packaging, temperature, and time. It is observed that, with increasing temperature, the samples become more dispersed along PC1, especially at 50 °C, indicating that this component summarizes the global change in the volatile profile associated with aging. At 25 °C, the samples remain relatively close together, reflecting more subtle changes during storage.
The loadings of the 17 markers (Figure 4b) indicate that PC1 is strongly influenced by compounds such as 2,3-pentanedione, 2,3-butanedione, and 2-methylbutanal, among others, which are associated with the fresh coffee profile. PC2 (21.2% of variance) discriminates these freshness markers (2,3-butanedione, 2-methylbutanal, and 2,3-pentanedione, with positive loadings) from compounds related to aging (ethylpyrazine and 1-methylpyrrole-2-carboxaldehyde, with negative loadings). As storage time increases, especially at higher temperatures, the samples shift toward more negative PC2 values, indicating a reduction in freshness markers and a greater contribution from compounds associated with aging.

3.5. Total Phenolic Content and Antioxidant Activity

The antioxidant activity of coffee is mainly due to phenolic compounds. These include phenolic acids, such as caffeic and ferulic acid, and chlorogenic acids, like caffeoylquinic acid (CQA), feruloylquinic acid (FQA), and coumaric acid (p-CoQA). Coffee also contains flavonoids, especially apigenin and luteolin. These compounds contribute to antioxidant activity by donating hydrogen atoms from hydroxyl groups on the aromatic ring (HAT—hydrogen atom transfer) or via electron transfer (SET—single-electron transfer) [49,61,62,63]. In this study, we observed that during coffee storage, packaging, time, temperature, and their interactions had a highly significant effect (p < 0.001) on the TPC and on antioxidant activity determined by ABTS, DPPH, and FRAP methods, shown in Table 4.
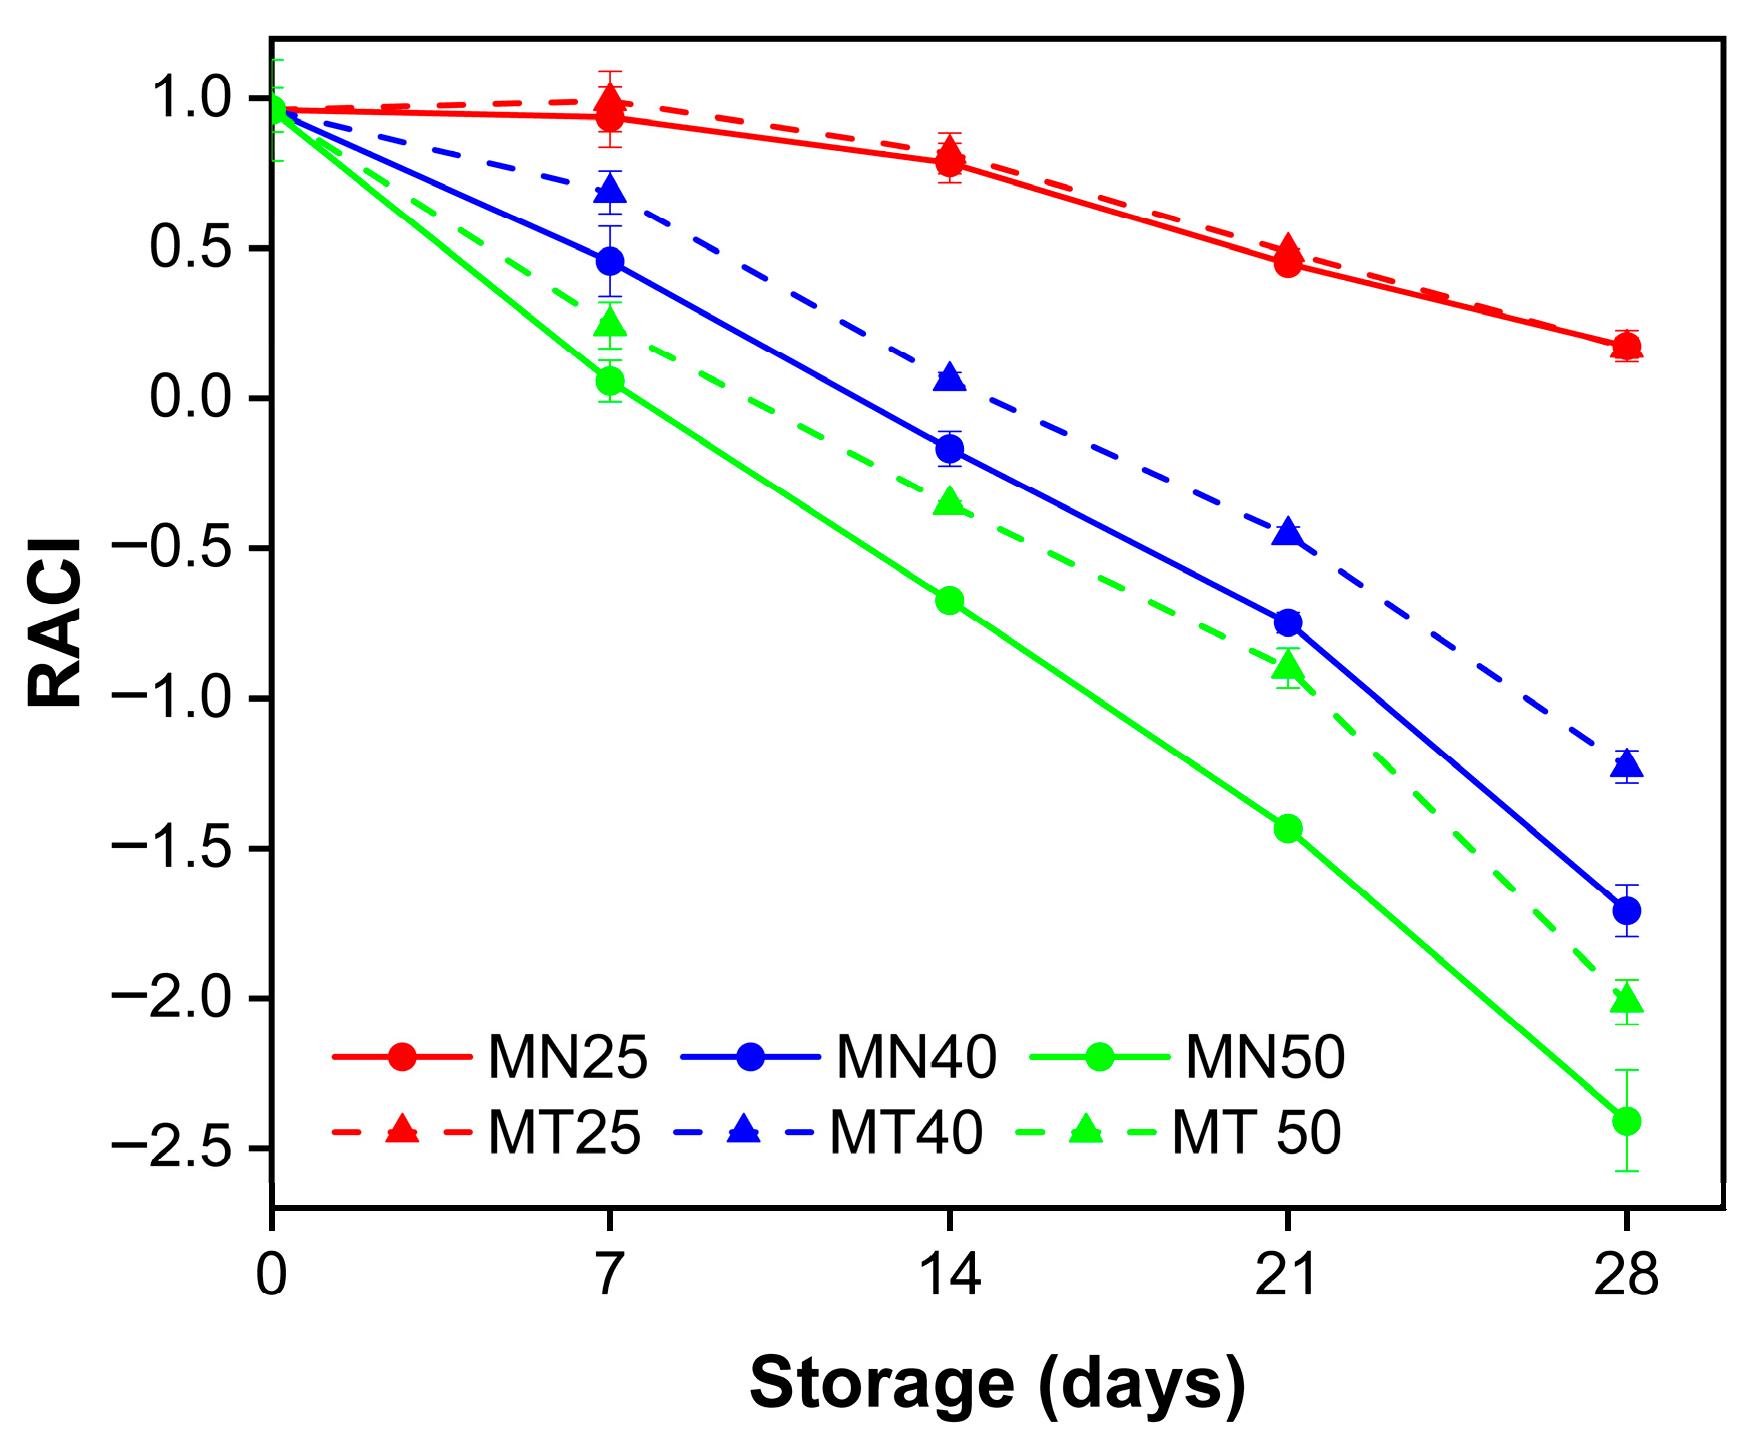
TPC and antioxidant activity showed similar behavior during storage and at higher temperatures. As shown in Table 4, increasing temperature and storage time progressively reduced these variables, indicating that phenolic compounds and antioxidant activity are sensitive to storage conditions. This is evident in the present study, as the packaging exhibited distinct WVTR and, especially, OTR values. Since these compounds are oxidized in the presence of oxygen, forming unquantified oxidized radicals, this reduces antioxidant activity over the storage period [64]. Therefore, we consolidated the evaluation of the RACI, for TPC, ABTS, DPPH, and FRAP, as proposed by [28], to provide a single comparative measure of antioxidant capacity across methods. The results are presented in Figure 5.
At 25 °C, the RACI remained stable during storage, with only minor changes from time 0. At 40 and 50 °C, the index dropped much more, showing greater loss of antioxidant capacity. This happens because storage temperature directly affects phenolic compounds, triggering enzymatic and non-enzymatic reactions that lower their levels and reduce the beans’ antioxidant activity [65,66].
Belviso et al. [67] evaluated the stability of polyphenolic compounds and antioxidant activity in coffee grounds stored in capsules for 28 days. They observed a 26% reduction in TPC, due to partial degradation, and reported a 30% decrease in antioxidant activity by the DPPH method and a 14% decrease by the ABTS method. Similarly, Vicente et al. [64] studied the effect of storage conditions on TPC and DPPH-determined antioxidant activity in coffee beverages. They found that TPC dropped by about 20% at 4 °C. DPPH antioxidant activity fell by 2.1% at 4 °C and 2.8% at 20 °C. The authors linked this behavior to the oxidation of phenolic compounds, whose storage temperature strongly influenced, affecting TPC and DPPH antioxidant activity measurements.
The effect of packaging was analyzed by Ahad et al. [68], who found that walnut kernels vacuum-packed in laminated packaging showed a smaller reduction in TPC and antioxidant activity (DPPH) compared with kernels packed without vacuum in HDPE packaging. The authors attributed this result not only to the effect of temperature but also to the higher oxygen content present in HDPE packaging, resulting from its greater permeability, which intensified the decrease in these parameters. However, Tripetch and Borompichaichartkul [42] did not observe significant differences in TPC over time in green coffee beans stored in HDPE packaging or in jute bags for four months. Only after six months were changes observed, attributed to the greater permeability of jute bags compared with HDPE packaging.
In our study, packaging showed distinct permeabilities, which directly affected TPC and antioxidant activity (Table 4, Figure 5). Additionally, significant variations in TPC and antioxidant activity were observed over time and at different temperatures for both packaging types. Together, these findings demonstrate that, under the tested conditions, TPC and antioxidant activity in roasted coffee are highly responsive to thermal stress, storage duration, and packaging material. Notably, MT packaging more effectively preserved the compounds of interest during storage than MN packaging, due to is lower oxygen permeability.

3.6. Lipid Oxidation and Shelf-Life

Coffea arabica contains approximately 17% lipids, mainly composed of triacylglycerols, esterified diterpenes, waxes, and free fatty acids, among other lipid components [69]. The fatty acid profile of the oils extracted via supercritical fluid was evaluated by GC-MS, and eleven fatty acids were identified, including lauric, myristic, palmitic, margaric, stearic, oleic, linolenic, nonadecanoic, gondoic, and behenic acids. Among these, the predominant fatty acids (those with the highest percentage of peak area in the chromatograms) were palmitic acid (C16:0), stearic acid (C18:0), oleic acid (C18:1), and linoleic acid (C18:2). This profile is consistent with data reported in the literature for roasted coffee [70,71].
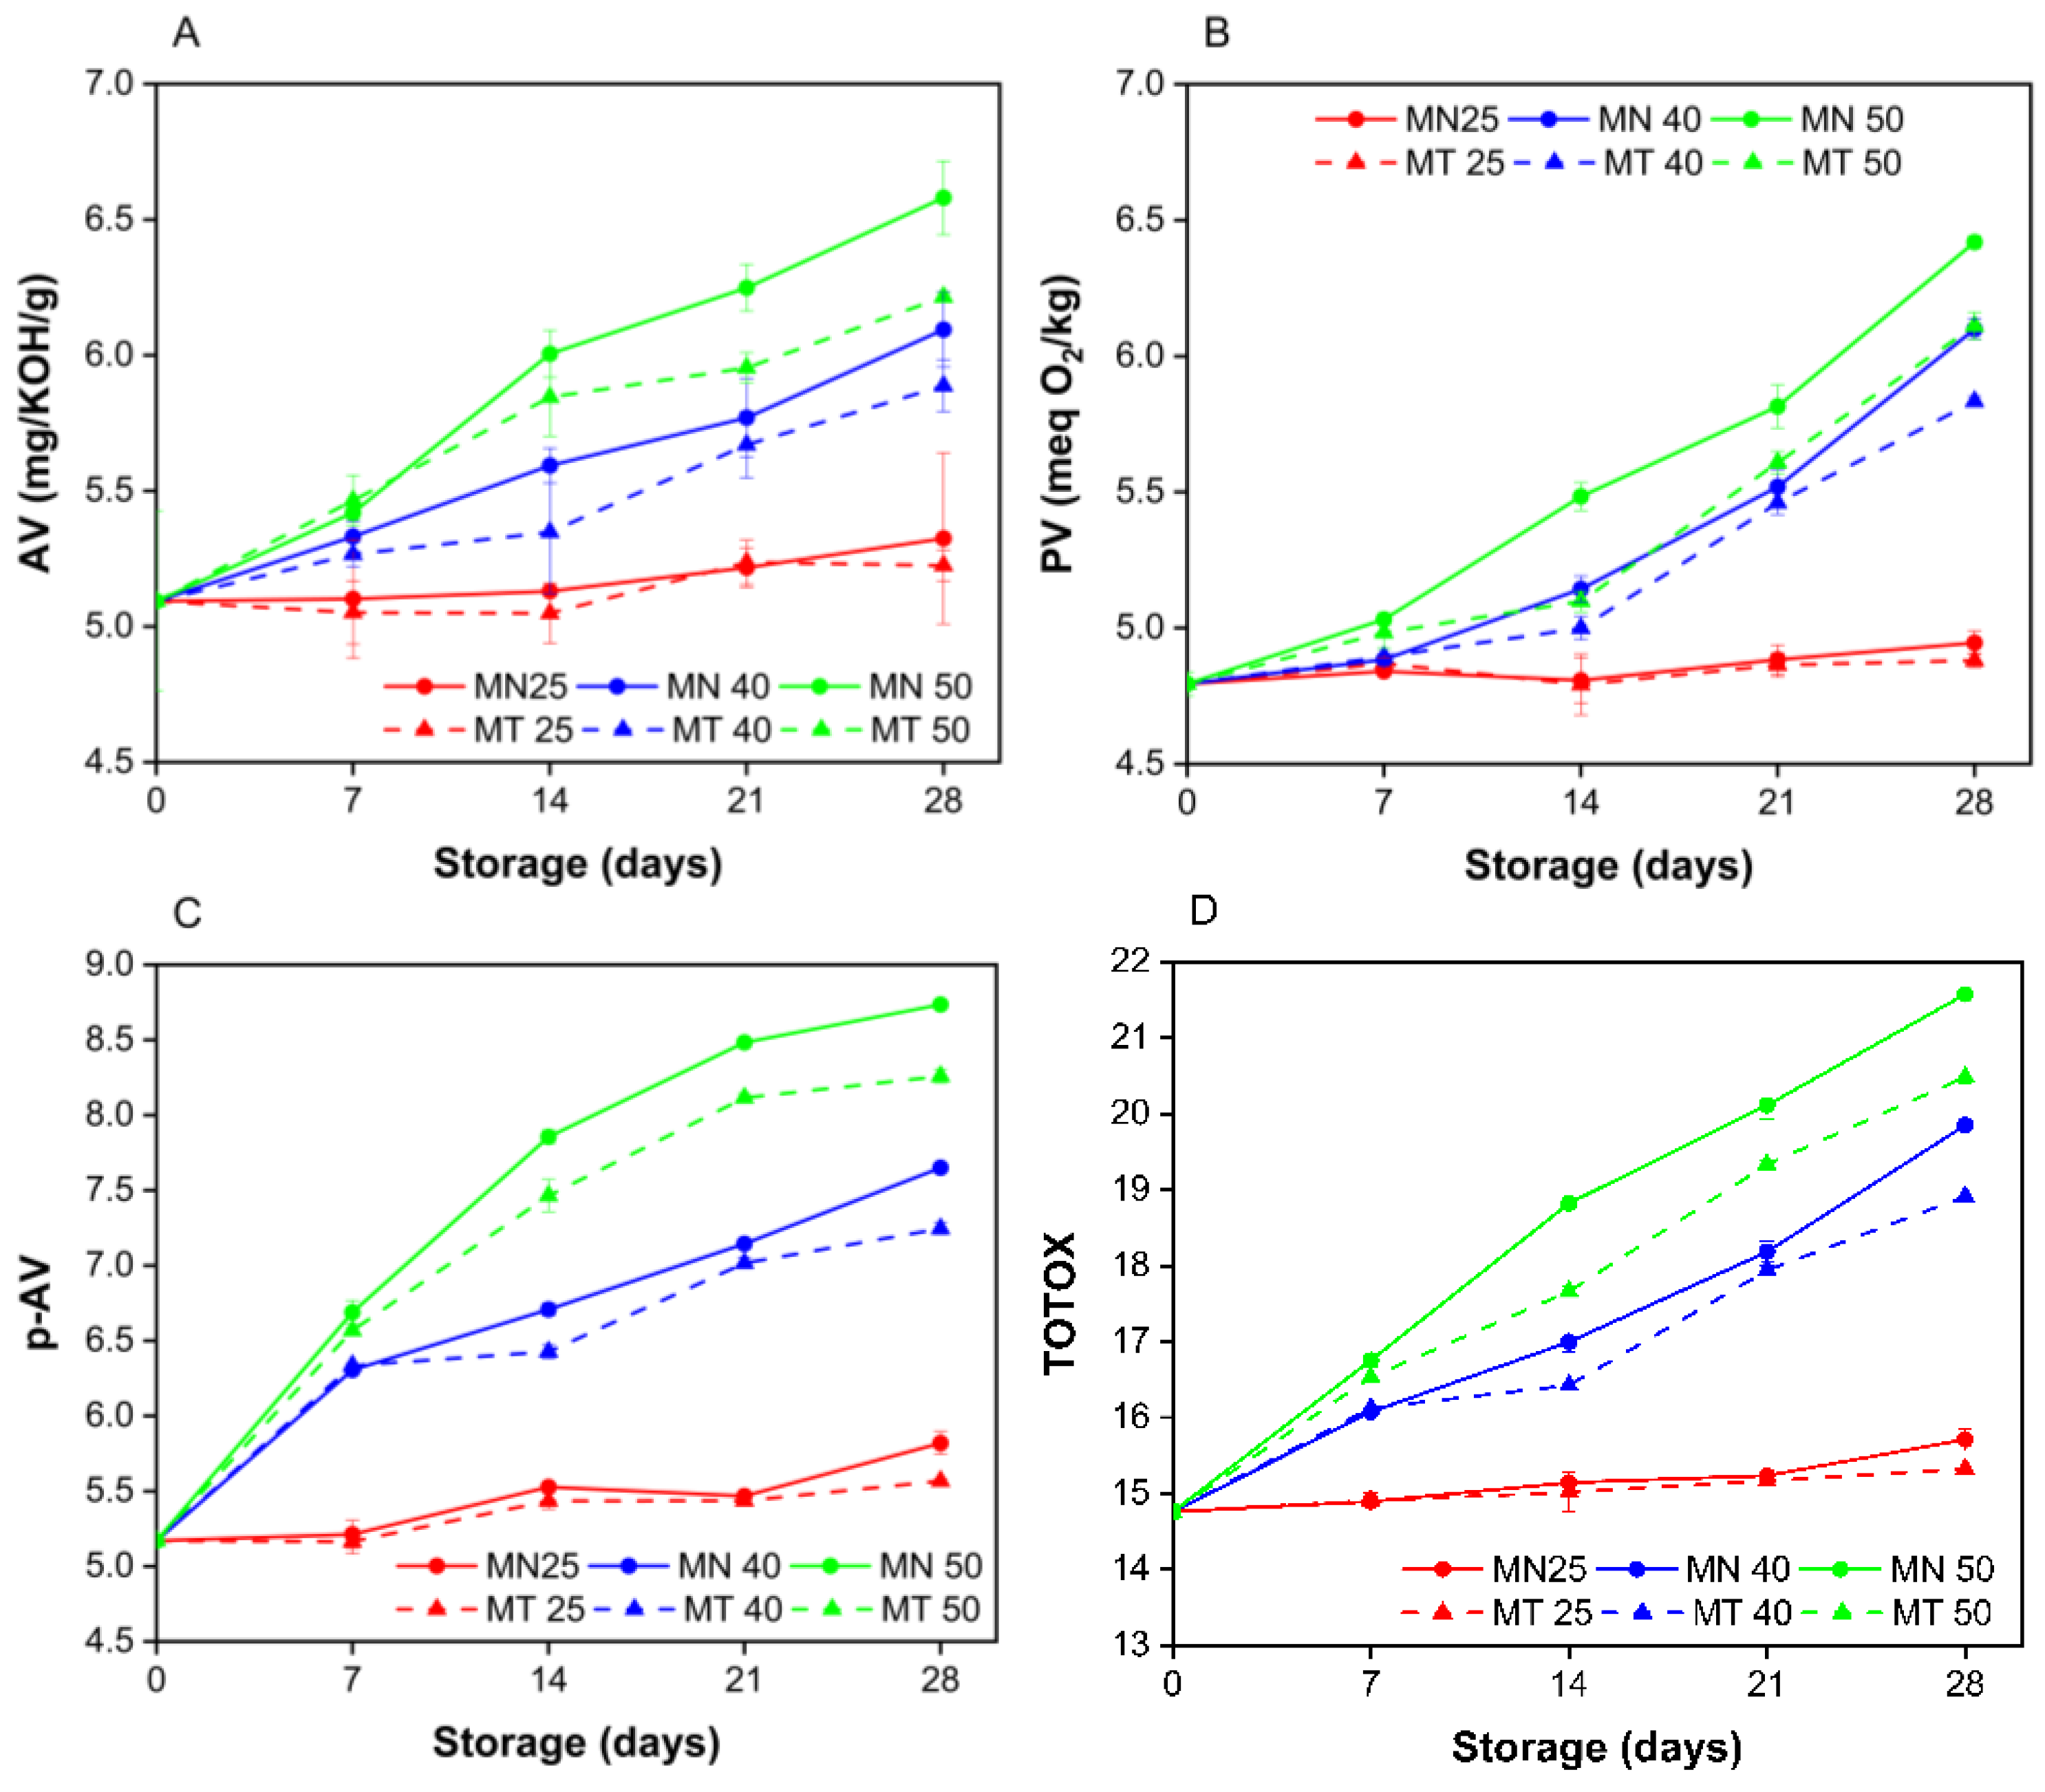
To assess the oxidation, the following parameters were determined from oil extracted via supercritical fluid: AV, indicating free fatty acids, PV, for peroxides/hydroperoxides, p-AV, for aldehydes/ketones from secondary oxidation, and TOTOX, reflecting overall oxidation [72,73]. These were monitored during coffee storage. The results are presented in Figure 6.
The AVs (Figure 6A) increased from 5.09 ± 0.33 mg KOH/g at the initial condition (T0) to 6.58 ± 0.14 mg KOH/g in MN at 50 °C and 6.21 ± 0.01 mg KOH/g in MT at 50 °C after 28 days of storage. Likewise, the PVs (Figure 6B) rose from 4.79 ± 0.04 meq O2/kg oil at T0 to 6.42 ± 0.02 meq O2/kg under the MN 50 °C condition and 6.11 ± 0.05 meq O2/kg under the MT 50 °C condition by the end of the storage. Similar initial PVs were reported by [74,75], indicating a low initial level of oxidation.
Regarding the p-AV (Figure 6C), a significant increase was observed from 5.17 ± 0.02 at T0 to 8.74 ± 0.03 in MN at 50 °C and 8.26 ± 0.04 in MT at 50 °C. Consequently, the TOTOX (Figure 6D) increased from 14.76 ± 0.10 under the initial condition to 21.57 ± 0.07 in MN at 50 °C and 20.48 ± 0.08 in MT at 50 °C at the end of storage.
Values for the four parameters increased progressively over the 28-day storage period, indicating intensified oxidation. Packaging, time, temperature, and their interactions significantly affected oxidative indices (p < 0.001). The different oxygen permeabilities of the packaging directly affected oxidation during storage, as higher permeability (MN) allowed more oxygen into the package, accelerating oxidation. Higher temperatures amplified this process by increasing free radical production, leading to more pronounced oxidative degradation [76]. These patterns align with Cong et al. [9], who found increased oxidative indices (AV, PV, p-AV, and TOTOX) in green coffee stored at 40, 50, and 60 °C for twenty days, with higher temperatures resulting in greater increases.
In the present study, it was observed that oxidative indices increased more in beans stored in MN packaging. This behavior may be attributed to the higher oxygen permeability of this packaging configuration, which favors the progression of lipid oxidation [77]. Consistent with these findings, Moon et al. [10] reported similar results when evaluating the oxidative stability of green coffee using an ASLT across three packaging types. Specifically, the authors observed that packaging with stronger gas-barrier properties was more effective at preserving oxidative parameters (AV, PV, p-AV, and TOTOX) than packaging with weaker gas-barrier properties.
These oxidative parameters are widely used to evaluate food quality, such as PV [9,34] and p-AV [78,79]. They are used to set acceptance limits and determine shelf-life. Fitting zero- and first-order kinetic models (Equations (7) and (8)) allowed determination of the reaction order of coffee oxidation in the two packaging configurations, using peroxide and p-anisidine values, as shown in Table 5.
Although under the MT conditions at 25 °C the PV showed a low coefficient of determination (R2 = 0.3656), due to reduced variation, in both the zero- and first-order models, the choice of reaction order was based on the model’s overall fit across all experimental conditions, rather than just under MT at 25 °C. The selected kinetic order corresponds to the model with the highest R2 when evaluated across the complete dataset. This same criterion was used by [9,34,75], who modeled PV evolution in coffee using first-order kinetics. For the p-anisidine data, since the literature did not provide consolidated kinetic parameters, the model with the best fit was also selected based on this comprehensive assessment. The obtained kinetic parameters were then linked to the Arrhenius equation (Equation (9)), enabling calculation of the activation energy (Ea), from the temperature dependence of the rate constants (k). This process allowed shelf-life estimation of roasted coffee using both peroxide and p-anisidine values across both packaging configurations, as summarized in Table 6.
The determination of the oxidative limit index (OIlim) was based on reference values reported in the literature for different lipid matrices. In their review, Gharby et al. [80] reported PV limit values of 10–20 meq O2/kg specifically for vegetable oils, such as olive oil. Likewise, the Codex Alimentarius standard establishes a maximum acceptable value of 10 meq O2/kg of oil for various edible oils [81]. Furthermore, Gharby et al. [80] indicate that p-AV values lower than 10 are considered acceptable for oil consumption. In contrast Boert et al. [82] report broader limits for marine oils, with p-AV between 15 and 30 and PV between 5 and 20 meq O2/kg.
Due to a lack of specific reference values for oxidative indices in roasted coffee, this study adopted conservative limits based on the literature for other vegetable oils, setting 7 meq O2/kg of oil for the PV and 7 for the p-AV. These are lower than recommendations reported in [80,81], making the criteria more restrictive and conservative. These limits defined the OIlim and, accordingly, estimated the product’s comparative shelf-life, as shown in Table 6.
It is observed that, when estimating the shelf-life of the product based on the PV, the shelf-life of coffee packed in monomaterial packaging at 25 °C was estimated at 179 days, whereas for the product stored in multimaterial packaging, the shelf-life was 447 days, corresponding to an increase of 64.35%. These values are consistent with the shelf-life range commonly reported for roasted coffee, which varies between 3 and 18 months [83]. Similar to PV, the shelf-life based on the p-AV limit ranged from 63 days for MN packaging at 25 °C to 79 days for MT packaging at 25 °C, a difference of 25.6%.
When evaluating the green coffee shelf-life under accelerated conditions (40, 50, and 60 °C), Cong et al. [9] obtained values of 57, 44, and 23 days, using PV as the parameter. Notably, these results are closer to those observed in this study for coffee packed in MN at 40 and 50 °C. Similarly, Moon et al. [34] determined the shelf-life of green coffee beans with different processing types, observing 35, 25, and 21 days for dry-processed coffee at 30, 40, and 50 °C, and 51, 33, and 15 days for semidry-processed coffee at those temperatures, also using PV. By, contrast, the shelf-lives estimated in this study were higher, possibly due to roasted coffee’s oxidative stability, from its lower moisture content [7].
It is further observed that the shelf-life values estimated using the p-AV parameter were lower than those obtained using PV, as shown in Table 6. This behavior is expected, since p-AV quantifies ketones and aldehydes formed from the decomposition of peroxides, characterizing products of secondary oxidation. Thus, in the initial stages of the oxidative process, primary oxidation indicators, such as PV, tend to show higher values, while secondary oxidation products accumulate progressively over time, leading to later increases in p-AV [77]. A similar behavior was reported by Moon et al. [34], who observed lower shelf-life values using TBARS, a secondary oxidation indicator, than with PV. The authors found shelf-lives of 10, 8, and 3 days for dry-processed green coffee stored at 30, 40, and 50 °C, respectively, and 8, 4, and 3 days for semidry-processed coffee at the same temperatures.
Although monomaterial packaging has a shorter shelf-life than multimaterial packaging, it remains a compelling alternative due to its superior recyclability. Multimaterial packaging is difficult to recycle because efficient separation of layers remains limited in both mechanical and chemical recycling. This results in recycled materials with diminished properties [84]. This problem contributes to plastic accumulation. Between 1950 and 2015, only a minority was recycled effectively, some remained in use, but most was improperly discarded [13]. Moreover, low recycling rates result from material complexity, infrastructure deficiencies, and improper disposal, creating significant barriers to a circular economy [14].
In this context, using monomaterial structures tends to reduce environmental impacts and lower emissions and cost compared to multimaterial configurations [85]. However, for applications that require high oxygen barrier properties, inherent limitations of polyolefins must be addressed, for example, by applying functional coatings that enhance barrier performance [16]. Thus, in this study, adding coatings to monomaterial packaging appears to be a viable way to match the stability performance seen in multimaterial packaging.

4. Conclusions

In general, the packaging configuration did not significantly affect moisture content. However, MT packaging showed greater stability at 50 °C, whereas MN packaging exhibited a slight increase, likely due to polyethylene’s higher permeability. Regarding pH, there were only minor variations, with time emerging as the main influencing factor. When considering color, changes were more pronounced in MN packaging, possibly due to moisture effects. Furthermore, a loss of volatile compounds associated with freshness, such as 2,3-butanedione and 2-methylbutanal, was observed, while aging markers, such as 1-methylpyrrole-2-carboxaldehyde and ethylpyrazine, increased. In addition, phenolic compounds and antioxidant activity (ABTS, DPPH, and FRAP) decreased during storage, especially in MN packaging, indicating greater susceptibility to oxidation. This trend was confirmed by oxidative indices, which indicated lower stability in monomaterial packaging. As a result, shelf-life was much shorter, estimated at 179 and 63 days (peroxide value and p-anisidine value, respectively), compared with 466 and 79 days for multimaterial packaging. Nevertheless, sensory evaluation is required to determine consumer acceptance and establish a more robust shelf-life for roasted coffee. Overall, MT packaging better preserved coffee quality, likely due to its superior barrier properties (WVTR and OTR). For MN packaging, incorporating functional coatings is a viable strategy to improve barrier performance and reduce the WVTR and OTR. Despite current limitations, MN packaging remains a promising alternative due to its potential environmental advantages and lower production costs, warranting further studies focused on barrier-enhancing coatings.

Supplementary Materials

The following supporting information can be downloaded at: https://www.mdpi.com/article/10.3390/pr14111740/s1. Table S1. Structural specifications of the packaging used in the coffee storage experiment. Table S2. WVTR of the packaging used. Table S3. OTR of the packaging used.

Author Contributions

Conceptualization, D.V.C., J.C.C.B., C.F.C., T.F.d.O., A.L.d.O. and F.A.d.S.; methodology, D.V.C., J.C.C.B., A.L.d.O., R.B.d.S.F. and F.A.d.S.; software, D.V.C. and J.C.C.B.; validation, D.V.C., J.C.C.B., A.L.d.O. and F.A.d.S.; formal analysis, D.V.C., R.B.d.S.F. and J.C.C.B.; investigation, D.V.C., J.C.C.B., C.F.C., T.F.d.O. and F.A.d.S.; resources, C.F.C., T.F.d.O., A.L.d.O., J.C.C.B. and F.A.d.S.; data curation, D.V.C., J.C.C.B. and F.A.d.S.; writing—original draft preparation, D.V.C., R.B.d.S.F., J.C.C.B., C.F.C. and F.A.d.S.; writing—review and editing, D.V.C., J.C.C.B., T.F.d.O., A.L.d.O. and F.A.d.S.; visualization, D.V.C., J.C.C.B. and F.A.d.S.; supervision, J.C.C.B., C.F.C., T.F.d.O., A.L.d.O. and F.A.d.S.; project administration, J.C.C.B., C.F.C. and F.A.d.S.; funding acquisition, J.C.C.B., C.F.C., T.F.d.O., A.L.d.O. and F.A.d.S. All authors have read and agreed to the published version of the manuscript.

Funding

This research was funded by the Conselho Nacional de Desenvolvimento Científico e Tecnológico (CNPq), grant number 308012-2023-2, and by the Fundação de Amparo à Pesquisa do Estado de Goiás (FAPEG), under Grant Agreement No. 1354, linked to Public Call No. 09/2022—Program for Supporting the Fixation of Young Doctors in Brazil (Administrative Process No. 202310267000544).

Data Availability Statement

The original contributions presented in this study are included in the article/Supplementary Material. Further inquiries can be directed to the corresponding author.

Acknowledgments

The authors would like to express their heartfelt gratitude to Muy Café for their generous donation of coffee for this study and to Finepack for kindly providing the packaging materials used in the experiments. We sincerely thank Laboratório de Tecnologia de Alta Pressão e Produtos Naturais (LTAPPN), FZEA-USP, for the invaluable collaboration and for enabling part of the analyses conducted in this work.

Conflicts of Interest

The authors declare no conflicts of interest.

Abbreviations

The following abbreviations are used in this manuscript:
ANOVAAnalysis of variance
AOACAssociation of Official Analytical Chemists
AOCSAmerican Oil Chemists’ Society
ASLTAccelerated shelf-life test
AVAcid value
CQACaffeoylquinic acid
d.b.Dry basis
EaActivation energy
FQAFeruloylquinic acid
GAEGallic acid equivalent
GCGas chromatograph
HATHydrogen atom transfer
HDPEHigh-density polyethylene
kRate constants
LDPELow-density polyethylene
MNMonomaterial
MTMultimaterial
OIOxidative index
OI0Oxidative index at time zero
OIlimOxidative limit index
p-AVp-Anisidine
PCAPrincipal component analysis
p-CoQAp-Coumaric acid
PEPolyethylene
PETPolyethylene terephthalate
PPPolypropylene
PVPeroxide value
R2Coefficient of determination
RACIRelative antioxidant capacity index
RMSDRoot mean square deviation
SATSingle-electron transfer
SFESupercritical fluid extraction
TBARSThiobarbituric acid reactive substances
TETrolox equivalent
TOTOXTotal oxidation value
TPCTotal phenolic content
VOCVolatile organic compound
WVTRWater vapor transmission rate

References

  1. ICO Coffee Year 2023/24. Paving the Way for a Sustainable Future Through Coffee Diplomacy. London. 2024. Available online: https://www.ico.org/documents/cy2024-25/annual-review-2023-2024-e.pdf?mc_cid=563247616c&mc_eid=6e2780cca4 (accessed on 9 April 2026).
  2. Hu, G.; Peng, X.; Gao, Y.; Huang, Y.; Li, X.; Su, H.; Qiu, M. Effect of roasting degree of coffee beans on sensory evaluation: Research from the perspective of major chemical ingredients. Food Chem. 2020, 331, 127329. [Google Scholar] [CrossRef] [PubMed]
  3. Vezzulli, F.; Lambri, M.; Bertuzzi, T. Volatile Compounds in Green and Roasted Arabica Specialty Coffee: Discrimination of Origins, Post-Harvesting Processes, and Roasting Level. Foods 2023, 12, 489. [Google Scholar] [CrossRef] [PubMed]
  4. Cao, X.; Wu, H.; Viejo, C.G.; Dunshea, F.R.; Suleria, H.A.R. Effects of postharvest processing on aroma formation in roasted coffee—A review. Int. J. Food Sci. Technol. 2023, 58, 1007–1027. [Google Scholar] [CrossRef]
  5. Caporaso, N.; Whitworth, M.B.; Cui, C.; Fisk, I.D. Variability of single bean coffee volatile compounds of Arabica and robusta roasted coffees analysed by SPME-GC-MS. Food Res. Int. 2018, 108, 628–640. [Google Scholar] [CrossRef] [PubMed]
  6. Borém, F.M.; Matias, G.C.; Alves, A.P.C.; Haeberlin, L.; dos Santos, C.M.; da Rosa, S.D.V.F. Effect of storage conditions on the chemical and sensory quality of pulped natural coffee. J. Stored Prod. Res. 2023, 104, 102183. [Google Scholar] [CrossRef]
  7. Smrke, S.; Adam, J.; Mühlemann, S.; Lantz, I.; Yeretzian, C. Effects of different coffee storage methods on coffee freshness after opening of packages. Food Packag. Shelf Life 2022, 33, 100893. [Google Scholar] [CrossRef]
  8. Błaszkiewicz, J.; Nowakowska-Bogdan, E.; Barabosz, K.; Kulesza, R.; Dresler, E.; Woszczyński, P.; Biłos, Ł.; Matuszek, D.B.; Szkutnik, K. Effect of green and roasted coffee storage conditions on selected characteristic quality parameters. Sci. Rep. 2023, 13, 6447. [Google Scholar] [CrossRef] [PubMed]
  9. Cong, S.; Dong, W.; Zhao, J.; Hu, R.; Long, Y.; Chi, X. Characterization of the lipid oxidation process of robusta green coffee beans and shelf life prediction during accelerated storage. Molecules 2020, 25, 1157. [Google Scholar] [CrossRef] [PubMed]
  10. Moon, S.A.; Wongsakul, S.; Kitazawa, H.; Saengrayap, R. Lipid Oxidation Changes of Arabica Green Coffee Beans during Accelerated Storage with Different Packaging Types. Foods 2022, 11, 3040. [Google Scholar] [CrossRef]
  11. Strocchi, G.; Bagnulo, E.; Ruosi, M.R.; Ravaioli, G.; Trapani, F.; Bicchi, C.; Pellegrino, G.; Liberto, E. Potential Aroma Chemical Fingerprint of Oxidised Coffee Note by HS-SPME-GC-MS and Machine Learning. Foods 2022, 11, 4083. [Google Scholar] [CrossRef] [PubMed]
  12. Wang, D.; Xiao, H.; Lyu, X.; Chen, H.; Wei, F. Lipid oxidation in food science and nutritional health: A comprehensive review. Oil Crop Sci. 2023, 8, 35–44. [Google Scholar] [CrossRef]
  13. Geyer, R.; Jambeck, J.R.; Law, K.L. Production, use, and fate of all plastics ever made. Sci. Adv. 2017, 3, e1700782. [Google Scholar] [CrossRef] [PubMed]
  14. Novakovic, K.; Thumbarathy, D.; Peeters, M.; Geoghegan, M.; Go Jefferies, J.; Hicks, C.; Manika, D.; Dai, S. Zero-waste circular economy of plastic packaging: The bottlenecks and a way forward. Sustain. Mater. Technol. 2023, 38, e00735. [Google Scholar] [CrossRef]
  15. Guerritore, M.; Olivieri, F.; Castaldo, R.; Avolio, R.; Cocca, M.; Errico, M.E.; Galdi, M.R.; Carfagna, C.; Gentile, G. Recyclable-by-design mono-material flexible packaging with high barrier properties realized through graphene hybrid coatings. Resour. Conserv. Recycl. 2022, 179, 106126. [Google Scholar] [CrossRef]
  16. Carullo, D.; Casson, A.; Rovera, C.; Ghaani, M.; Bellesia, T.; Guidetti, R.; Farris, S. Testing a coated PE-based mono-material for food packaging applications: An in-depth performance comparison with conventional multi-layer configurations. Food Packag. Shelf Life 2023, 39, 101143. [Google Scholar] [CrossRef]
  17. Pettersen, M.K.; Grøvlen, M.S.; Evje, N.; Radusin, T. Recyclable mono materials for packaging of fresh chicken fillets: New design for recycling in circular economy. Packag. Technol. Sci. 2020, 33, 485–498. [Google Scholar] [CrossRef]
  18. Rosillo, F.F.; Ríos, M.A.C.; Huatangari, L.Q.; Lalangui, C.G.S. Shelf-Life Prediction of Specialty Coffees using the Arrhenius Model. Online J. Biol. Sci. 2023, 23, 17–24. [Google Scholar] [CrossRef]
  19. AOAC Official Method 925.45b; Moisture in Sugars. AOAC International: Gaithersburg, MD, USA, 1990.
  20. AOAC Official Method 973.4; pH of Water. AOAC International: Gaithersburg, MD, USA, 1990.
  21. Cabral, D.V.; Briceno, J.C.C.; Cardoso, C.F.; Filho Braz, R.; Sousa, L.A.d.; Oliveira, T.F.d.; Silva, F. Influence of cultivation region on color, volatile compounds, phenolics, and antioxidant activity of Arabica coffee (Coffea arabica) Catuaí cultivar in Brazil. Food Sci. Technol. 2025, 45, e00464. [Google Scholar] [CrossRef]
  22. Vieira, F.G.K.; Borges, G.D.S.C.; Copetti, C.; Di Pietro, P.F.; Nunes Eda, C.; Fett, R. Phenolic compounds and antioxidant activity of the apple flesh and peel of eleven cultivars grown in Brazil. Sci. Hortic. 2011, 128, 261–266. [Google Scholar] [CrossRef]
  23. Siacor, F.D.C.; Lim, K.J.A.; Cabajar, A.A.; Lobarbio, C.F.Y.; Lacks, D.J.; Taboada, E.B. Physicochemical properties of spray-dried mango phenolic compounds extracts. J. Agric. Food Res. 2020, 2, 100048. [Google Scholar] [CrossRef]
  24. Singleton, V.L.; Orthofer, R.; Lamuela-Raventós, R.M. Analysis of Total Phenols and Other Oxidation Substrates and Antioxidants by Means of Folin-Ciocalteu Reagent. Methods Enzymol. 1999, 299, 152–178. [Google Scholar]
  25. Re, R.; Pellegrini, N.; Proteggente, A.; Pannala, A.; Yang, M.; Rice-Evans, C. Antioxidant activity applying an improved ABTS radical cation decolorization assay. Free Radic. Biol. Med. 1999, 26, 1231–1237. [Google Scholar] [CrossRef]
  26. Plank, D.W.; Szpylka, J.; Sapirstein, H.; Woollard, D.; Zapf, C.M.; Lee, V.; Chen, C.Y.O.; Liu, R.H.; Tsao, R.; Düsterloh, A.; et al. Determination of antioxidant activity in foods and beverages by reaction with 2,2’-Diphenyl-1-Picrylhydrazyl (DPPH): Collaborative study first action 2012.04. J. AOAC Int. 2012, 95, 1562–1569. [Google Scholar] [CrossRef] [PubMed]
  27. Benzie, I.F.F.; Strain, J.J. Ferric Reducing/Antioxidant Power Assay: Direct Measure of Total Antioxidant Activity of Biological Fluids and Modified Version for Simultaneous Measurement of Total Antioxidant Power and Ascorbic Acid Concentration. Methods Enzymol. 1999, 299, 15–27. [Google Scholar] [CrossRef]
  28. Sun, T.; Tanumihardjo, S.A. An integrated approach to evaluate food antioxidant capacity. J. Food Sci. 2007, 72, R159–R165. [Google Scholar] [CrossRef] [PubMed]
  29. Cornelio-Santiago, H.P.; Gonçalves, C.B.; de Oliveira, N.A.; de Oliveira, A.L. Supercritical CO2 extraction of oil from green coffee beans: Solubility, triacylglycerol composition, thermophysical properties and thermodynamic modelling. J. Supercrit. Fluids 2017, 128, 386–394. [Google Scholar] [CrossRef]
  30. AOCS Official Method Cd 3d-63; Acid Value. American Oil Chemists’ Society: Champaign, IL, USA, 2009.
  31. AOCS Official Method Cd 8b-90; Peroxid Value Acetic Acid-Isooctane Method. American Oil Chemists’ Society: Champaign, IL, USA, 2009.
  32. AOCS Official Method Cd 18-90; p-Anisidine Value. 1997. American Oil Chemists’ Society: Champaign, IL, USA, 2009.
  33. AOAC Official Method 969.33; Fatty Acids in Oils and Fats. Preparation of Methyl Esters (Boron Trifluoride Method). AOAC International: Gaithersburg, MD, USA, 2000.
  34. Moon, S.A.; Wongsakul, S.; Kitazawa, H.; Kittiwachana, S.; Saengrayap, R. Application of ATR-FTIR for Green Arabica Bean Shelf-Life Determination in Accelerated Storage. Foods 2024, 13, 2331. [Google Scholar] [CrossRef]
  35. Grünwald, J.; Hanzelka, J.; Voříšek, P.; Reif, J. Long-term population trends of 48 urban bird species correspond between urban and rural areas. iScience 2024, 27, 109717. [Google Scholar] [CrossRef] [PubMed]
  36. Liu, H.; Zhuang, S.; Gu, Y.; Shen, Y.; Zhang, W.; Ma, L.; Xiao, G.; Wang, Q.; Zhong, Y. Effect of storage time on the volatile compounds and taste quality of Meixian green tea. LWT 2023, 173, 114320. [Google Scholar] [CrossRef]
  37. Belluau, M.; Paquette, A.; Gravel, D.; Reich, P.B.; Stefanski, A.; Messier, C. Exotics are more complementary over time in tree biodiversity–ecosystem functioning experiments. Funct. Ecol. 2021, 35, 2550–2561. [Google Scholar] [CrossRef]
  38. Gichau, A.W.; Okoth, J.K.; Makokha, A. Moisture sorption isotherm and shelf life prediction of complementary food based on amaranth–sorghum grains. J. Food Sci. Technol. 2020, 57, 962–970. [Google Scholar] [CrossRef] [PubMed]
  39. Kiese, S.; Kücükpinar, E.; Miesbauer, O.; Langowski, H.C. The influence of temperature on the intrinsic transport properties of water in inorganic and polymeric coatings. Thin Solid Film. 2021, 717, 138476. [Google Scholar] [CrossRef]
  40. Romani, S.; Tappi, S.; Balestra, F.; Rodriguez Estrada, M.T.; Siracusa, V.; Rocculi, P.; Rosa, M.D. Effect of different new packaging materials on biscuit quality during accelerated storage. J. Sci. Food Agric. 2015, 95, 1736–1746. [Google Scholar] [CrossRef] [PubMed]
  41. de Oliveira, G.H.H.; Corrêa, P.C.; Oliveira, A.P.L.R.d.; Baptestini, F.M.; Vargas-Elías, G.A. Roasting, Grinding, and Storage Impact on Thermodynamic Properties and Adsorption Isotherms of Arabica Coffee. J. Food Process Preserv. 2017, 41, e12779. [Google Scholar] [CrossRef]
  42. Collazos-Escobar, G.A.; Gutiérrez-Guzmán, N.; Váquiro-Herrera, H.A.; Bon, J.; Garcia-Perez, J.V. Thermodynamic analysis and modeling of water vapor adsorption isotherms of roasted specialty coffee (Coffee arabica L. cv. Colombia). LWT 2022, 160, 113335. [Google Scholar] [CrossRef]
  43. Tripetch, P.; Borompichaichartkul, C. Effect of packaging materials and storage time on changes of colour, phenolic content, chlorogenic acid and antioxidant activity in arabica green coffee beans (Coffea arabica L. cv. Catimor). J. Stored Prod. Res. 2019, 84, 101510. [Google Scholar] [CrossRef]
  44. Somporn, C.; Kamtuo, A.; Theerakulpisut, P.; Siriamornpun, S. Effects of roasting degree on radical scavenging activity, phenolics and volatile compounds of Arabica coffee beans (Coffea arabica L. cv. Catimor). Int. J. Food Sci. Technol. 2011, 46, 2287–2296. [Google Scholar] [CrossRef]
  45. Wang, N.; Lim, L.T. Fourier transform infrared and physicochemical analyses of roasted coffee. J. Agric. Food Chem. 2012, 60, 5446–5453. [Google Scholar] [CrossRef] [PubMed]
  46. Mendonça, L.M.V.L.; Pereira, R.G.F.A.; Mendes, A.N.G. Parâmetros bromatológicos de grãos crus e torrados de cultivares de café (Coffea arabica L.). Food Sci. Technol. 2005, 25, 239–243. [Google Scholar] [CrossRef]
  47. Yeager, S.E.; Batali, M.E.; Guinard, J.X.; Ristenpart, W.D. Acids in coffee: A review of sensory measurements and meta-analysis of chemical composition. Crit. Rev. Food Sci. Nutr. 2023, 63, 1010–1036. [Google Scholar] [CrossRef] [PubMed]
  48. Clarke, R.J.; Macrae, R. COFFEE, 1st ed.; Clarke, R.J., Macrae, R., Eds.; Elsevier Science Publishers Ltd.: New York, NY, USA, 1985; Volume 1. [Google Scholar] [CrossRef]
  49. Giulia, S.; Eloisa, B.; Giulia, R.; Gloria, P.; Carlo, B.; Erica, L. Evaluation of the behaviour of phenols and alkaloids in samples of roasted and ground coffee stored in different types of packaging: Implications for quality and shelf life. Food Res. Int. 2023, 174, 113548. [Google Scholar] [CrossRef] [PubMed]
  50. Freitas, V.V.; Rodrigues Borges, L.L.; Dias Castro, G.A.; Henrique dos Santos, M.; Teixeira Ribeiro Vidigal, M.C.; Fernandes, S.A.; Stringheta, P.C. Impact of different roasting conditions on the chemical composition, antioxidant activities, and color of Coffea canephora and Coffea arabica L. samples. Heliyon 2023, 9, e19580. [Google Scholar] [CrossRef]
  51. Wei, F.; Furihata, K.; Koda, M.; Hu, F.; Miyakawa, T.; Tanokura, M. Roasting process of coffee beans as studied by nuclear magnetic resonance: Time course of changes in composition. J. Agric. Food Chem. 2012, 60, 1005–1012. [Google Scholar] [CrossRef] [PubMed]
  52. Wang, X.; Lim, L.T. Physicochemical Characteristics of Roasted Coffee. In Coffee in Health and Disease Prevention; Academic Press: New York, NY, USA, 2015; pp. 247–254. [Google Scholar] [CrossRef]
  53. Khir, R.; Atungulu, G.G.; Pan, Z.; Thompson, J.F.; Zheng, X. Moisture-dependent color characteristics of walnuts. Int. J. Food Prop. 2014, 17, 877–890. [Google Scholar] [CrossRef]
  54. Ma, M.; Sun, Q.J.; Li, M.; Zhu, K.X. Deterioration mechanisms of high-moisture wheat-based food—A review from physicochemical, structural, and molecular perspectives. Food Chem. 2020, 318, 126495. [Google Scholar] [CrossRef] [PubMed]
  55. Alagöz, S.; Türkyilmaz, M.; Tağı, Ş.; Özkan, M. Effects of different sorbic acid and moisture levels on chemical and microbial qualities of sun-dried apricots during storage. Food Chem. 2015, 174, 356–364. [Google Scholar] [CrossRef] [PubMed]
  56. Benković, M.; Tušek, A.J. Regression models for description of roasted ground coffee powder color change during secondary shelf-life as related to storage conditions and packaging material. Beverages 2018, 4, 16. [Google Scholar] [CrossRef]
  57. Wang, X.; Wang, Y.; Hu, G.; Hong, D.; Guo, T.; Li, J.; Li, Z.; Qiu, M. Review on factors affecting coffee volatiles: From seed to cup. J. Sci. Food Agric. 2022, 102, 1341–1352. [Google Scholar] [CrossRef] [PubMed]
  58. Galarza, G.; Figueroa, J.G. Volatile Compound Characterization of Coffee (Coffea arabica) Processed at Different Fermentation Times Using SPME–GC–MS. Molecules 2022, 27, 2004. [Google Scholar] [CrossRef] [PubMed]
  59. Marin, K.; Požrl, T.; Zlatić, E.; Plestenjak, A. A New Aroma Index to Determine the Aroma Quality of Roasted and Ground Coffee During Storage. Food Technol. Biotechnol. 2008, 46, 442–447. [Google Scholar]
  60. Gantner, M.; Kostyra, E.; Górska-Horczyczak, E.; Piotrowska, A. Effect of Temperature and Storage on Coffee’s Volatile Compound Profile and Sensory Characteristics. Foods 2024, 13, 3995. [Google Scholar] [CrossRef] [PubMed]
  61. Gulcin, İ. Antioxidants and antioxidant methods: An updated overview. Arch. Toxicol. 2020, 94, 651–715. [Google Scholar] [CrossRef] [PubMed]
  62. Zhang, J.; Zhai, X.; Yu, X.; Qiu, M.; Hu, R.; Dong, W. Exploration of interaction mechanisms and functional properties of coffee flavonoids and β-casein via multispectroscopy and molecular dynamics simulation. Food Hydrocoll. 2025, 166, 111359. [Google Scholar] [CrossRef]
  63. Lu, H.; Tian, Z.; Cui, Y.; Liu, Z.; Ma, X. Chlorogenic acid: A comprehensive review of the dietary sources, processing effects, bioavailability, beneficial properties, mechanisms of action, and future directions. Compr. Rev. Food Sci. Food Saf. 2020, 19, 3130–3158. [Google Scholar] [CrossRef] [PubMed]
  64. Vicente, S.J.V.; Queiroz, Y.S.; Gotlieb, S.L.D.; Torres, E.A.F.d.S. Stability of Phenolic Compounds and Antioxidant Capacity of Regular and Decaffeinated Coffees. Arch. Biol. Technol. V 2014, 57, 110–118. [Google Scholar] [CrossRef]
  65. Mehaya, F.M.; Mohammad, A.A. Thermostability of bioactive compounds during roasting process of coffee beans. Heliyon 2020, 6, e05508. [Google Scholar] [CrossRef]
  66. Pazmiño-Arteaga, J.; Gallardo, C.; González-Rodríguez, T.; Winkler, R. Loss of Sensory Cup Quality: Physiological and Chemical Changes during Green Coffee Storage. Plant Foods Human. Nutr. 2022, 77, 1–11. [Google Scholar] [CrossRef] [PubMed]
  67. Belviso, S.; Ghirardello, D.; Rantsiou, K.; Giordano, M.; Bertolino, M.; Borgogna, D.; Cavallero, M.C.; Bello, B.D.; Cena, C.; Rolle, L.; et al. Phytochemical and microbiological stability of spent espresso coffee grounds in capsules. Food Res. Int. 2014, 61, 93–99. [Google Scholar] [CrossRef]
  68. Ahad, T.; Gull, A.; Nissar, J.; Masoodi, L.; Rather, A.H. Effect of storage temperatures, packaging materials and storage periods on antioxidant activity and non-enzymatic browning of antioxidant treated walnut kernels. J. Food Sci. Technol. 2020, 57, 3556–3563. [Google Scholar] [CrossRef] [PubMed]
  69. Zhang, J.; Fu, X.; Dong, C.; Yu, X.; Hu, R.; Long, Y.; Dong, W. Lipidomics reveals the effects of various processing parameters on the lipid composition and activity of roasted coffee oil. LWT 2024, 211, 116938. [Google Scholar] [CrossRef]
  70. Williamson, K.; Hatzakis, E. NMR analysis of roasted coffee lipids and development of a spent ground coffee application for the production of bioplastic precursors. Food Res. Int. 2019, 119, 683–692. [Google Scholar] [CrossRef] [PubMed]
  71. Martín, M.J.; Pablos, F.; Gustavo González, A.; Valdenebro, M.S.; León-Camacho, M. Fatty acid profiles as discriminant parameters for coffee varieties differentiation. Talanta 2001, 54, 291–297. [Google Scholar] [CrossRef] [PubMed]
  72. Irwin, J.W.; Hedges, N. Measuring lipid oxidation. In Understanding and Measuring the Shelf-Life of Food; Woodhead Publishing: Sawston, UK, 2004; pp. 289–316. [Google Scholar] [CrossRef]
  73. Jacobsen, C. Oxidative Rancidity. In Encyclopedia of Food Chemistry; Elsevier: Amsterdam, The Netherlands, 2018; pp. 261–269. [Google Scholar] [CrossRef]
  74. Anesei, M.; De Pillp, T.; Massinf, R.; Lericp, C.R. Oxidative stability of the lipd fraction in roasted coffee. Ital. J. Food Sci. 2000, 4, 457–462. [Google Scholar]
  75. Ortolá, M.D.; Gutiérrez, C.L.; Chiralt, A.; Fito, P. Kinetic study of lipid oxidation in roasted coffee. Food Sci. Technol. Int. 1998, 4, 67–73. [Google Scholar] [CrossRef]
  76. Zamora, R.; Hidalgo, F.J. The triple defensive barrier of phenolic compounds against the lipid oxidation-induced damage in food products. In Trends in Food Science and Technology; Elsevier Ltd.: Amsterdam, The Netherlands, 2016; pp. 165–174. [Google Scholar] [CrossRef]
  77. Talbot, G. The stability and shelf life of fats and oils. In The Stability and Shelf Life of Food; Elsevier: Amsterdam, The Netherlands, 2016; pp. 461–503. [Google Scholar] [CrossRef]
  78. Multari, S.; Marsol-Vall, A.; Heponiemi, P.; Suomela, J.P.; Yang, B. Changes in the volatile profile, fatty acid composition and other markers of lipid oxidation of six different vegetable oils during short-term deep-frying. Food Res. Int. 2019, 122, 318–329. [Google Scholar] [CrossRef] [PubMed]
  79. Secer, O.M.; Guneser, B.A.; Guneser, O. Prediction of shelf-life and kinetics of quality changes in canned stuffed grape leaves. LWT 2020, 132, 109850. [Google Scholar] [CrossRef]
  80. Gharby, S.; Asbbane, A.; Nid Ahmed, M.; Gagour, J.; Hallouch, O.; Oubannin, S.; Bijla, L.; Goh, K.W.; Bouyahya, A.; Ibourki, M. Vegetable oil oxidation: Mechanisms, impacts on quality, and approaches to enhance shelf life. Food Chem. X 2025, 28, 102541. [Google Scholar] [CrossRef]
  81. Codex Alimentarius Commission. Standard for Edible Fats and Oils Not Covered by Individual Standards. Rome. 2024. Available online: https://www.fao.org/fao-who-codexalimentarius/sh-proxy/en/?lnk=1&url=https%253A%252F%252Fworkspace.fao.org%252Fsites%252Fcodex%252FStandards%252FCXS%2B19-1981%252FCXS_019e.pdf&utm_source=chatgpt.com (accessed on 12 December 2025).
  82. De Boer, A.A.; Ismail, A.; Marshall, K.; Bannenberg, G.; Yan, K.L.; Rowe, W.J. Examination of marine and vegetable oil oxidation data from a multi-year, third-party database. Food Chem. 2018, 254, 249–255. [Google Scholar] [CrossRef]
  83. Manzocco, L.; Calligaris, S.; Anese, M.; Nicoli, M.C. The stability and shelf life of coffee products. In The Stability and Shelf Life of Food; Elsevier: Amsterdam, The Netherlands, 2016; pp. 375–398. [Google Scholar] [CrossRef]
  84. Titone, V.; Gulino, E.F.; La Mantia, F.P. Recycling of Heterogeneous Mixed Waste Polymers through Reactive Mixing. Polymers 2023, 15, 1367. [Google Scholar] [CrossRef]
  85. Gonçalves, A.; Henriques, E.; Ribeiro, I. Towards plastics circular economy: Sustainability assessment of mono-material design for recycling. In Procedia CIRP; Elsevier B.V.: Amsterdam, The Netherlands, 2024; pp. 401–406. [Google Scholar] [CrossRef]
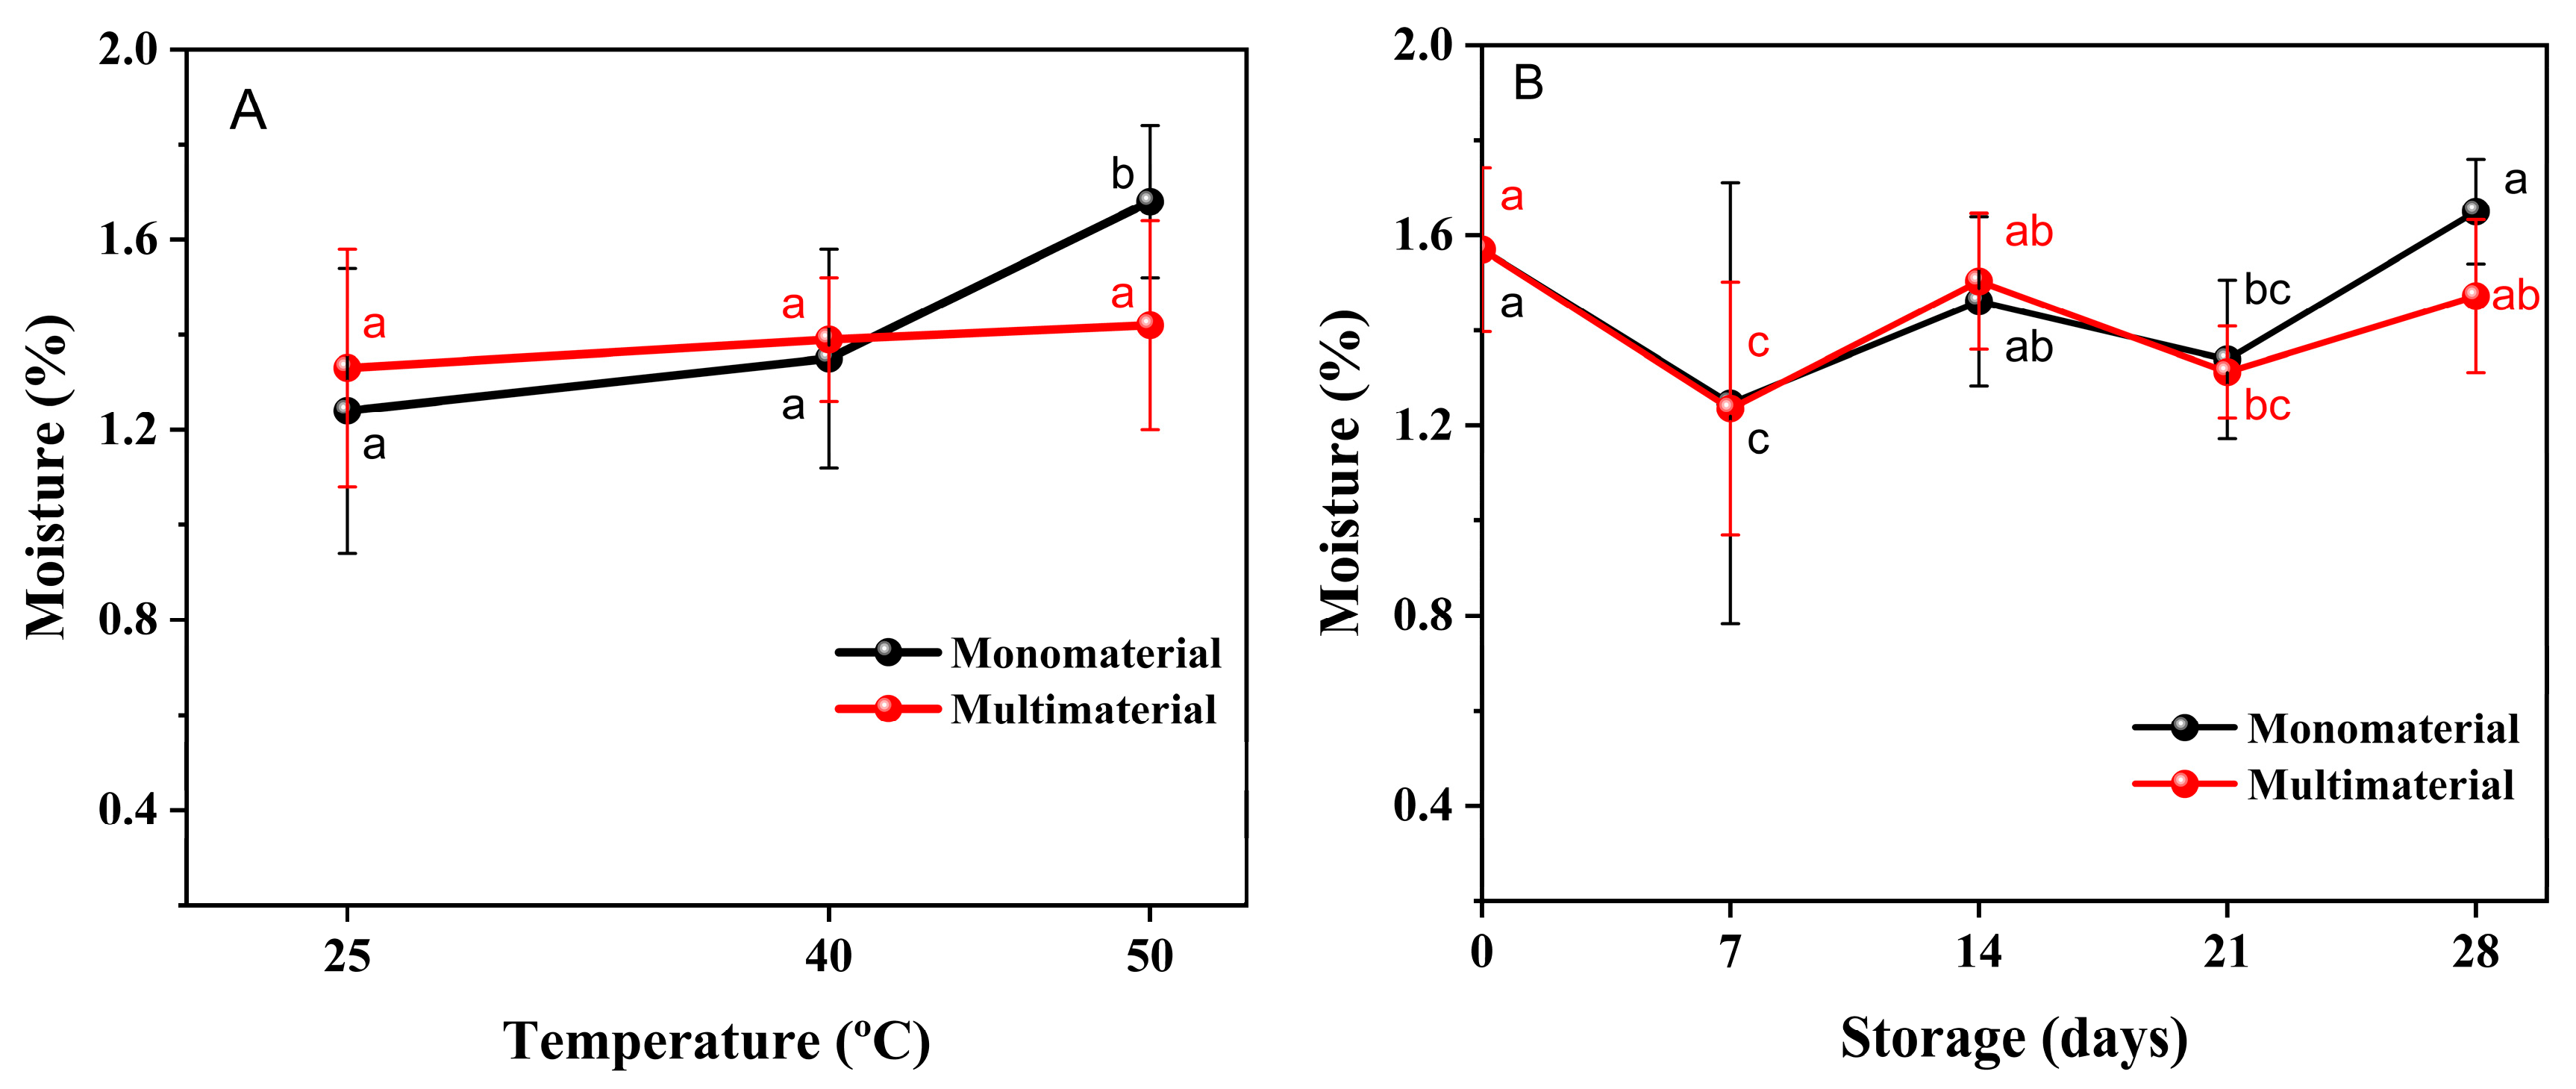
Figure 1. Effect of temperature and time on the moisture of coffee stored in the two packaging configurations. (A) Effect of temperature (in degrees Celsius) on moisture. (B) Effect of storage time (in days) on moisture. Results are expressed as mean and standard deviation. In black: moisture of coffee stored in monomaterial packaging. In red: moisture of coffee stored in multimaterial packaging. Means with the same letter are not significantly different (p > 0.05).
Processes 14 01740 g001
Figure 2. Effect of storage period on pH variation. Values are reported as the mean and standard deviation by storage period and temperature. In black: moisture of coffee stored in monomaterial packaging. In red: moisture of coffee stored in multimaterial packaging. Means with the same letter are not significantly different (p > 0.05).
Processes 14 01740 g002
Figure 3. Effect of temperature and packaging on volatile organic compounds during the storage period. Representation of the compounds 2,3-butanedione (A), 2-methylnbutanal (B), 1-methylpyrrole-2-carboxaldehyde (C), and ethylpyrazine (D). Chromatogram peak areas transformed into log10(Area) on the y-axis.
Processes 14 01740 g003
Figure 4. Principal component analysis and loadings of the 17 markers. (a) Principal component analysis. MT packaging is represented by triangles. MN packaging is represented by circles. Time 0, in blue. Time 7, in green. Time 14, in orange. Time 21, in red. Time 28, in yellow. (b) Loadings of the 17 PCA markers.
Processes 14 01740 g004
Figure 5. Relative antioxidant capacity index of roasted coffee during the storage period. MN 25 = MN packaging at 25 °C (solid red line). MT 25 = MT packaging at 25 °C (dashed red line). MN 40 = MN packaging at 40 °C (solid blue line). MT 40 = MT packaging at 40 °C (dashed blue line). MN 50 = MN packaging at 50 °C (solid green line). MT 50 = MT packaging at 50 °C (dashed green line).
Processes 14 01740 g005
Figure 6. Oxidative parameters evaluated during the coffee storage period. (A) Acid values, expressed as mg KOH/g of sample. (B) Peroxide value, expressed as meq O2/kg of oil. (C) p-Anisidine value, dimensionless. (D) Total oxidation value (TOTOX). Temperatures of 25 °C (red), 40 °C (blue), and 50 °C (green). Monomaterial packaging is represented by solid lines. Multimaterial packaging is represented by dashed lines.
Processes 14 01740 g006
Table 1. Variation of color parameters during the storage period.
PackagingTemperature (°C) Time (Days)L*a*b*C*ΔE
023.48 ± 0.01 n9.98 ± 0.03 b11.72 ± 0.08 bc15.39 ± 0.06 b49.57 ± 0.25 abc-
MN25719.92 ± 0.04 a11.14 ± 0.03 ijkl14.68 ± 0.07 kl18.43 ± 0.06 kl52.79 ± 0.15 i4.78 ± 0.07 m
1421.97 ± 0.12 ghi10.50 ± 0.11 de12.81 ± 0.20 efg16.56 ± 0.21 def50.65 ± 0.29 def1.94 ± 0.24 ef
2120.47 ± 0.01 b11.34 ± 0.04 kl15.05 ± 0.07 l18.83 ± 0.05 l53.01 ± 0.21 i4.69 ± 0.06 lm
2822.09 ± 0.13 efg11.12 ± 0.10 jkl13.77 ± 0.24 j17.70 ± 0.24 k51.08 ± 0.33 gh2.74 ± 0.26 i
40721.23 ± 0.08 c10.45 ± 0.08 ef12.66 ± 0.12 fghi16.42 ± 0.13 efghi50.45 ± 0.24 ef2.49 ± 0.11 h
1421.47 ± 0.02 cd11.43 ± 0.03 l14.34 ± 0.08 jk18.33 ± 0.07 k51.44 ± 0.18 h3.61 ± 0.07 j
2122.91 ± 0.02 lm10.38 ± 0.02 de12.70 ± 0.05 fgh16.40 ± 0.04 efg50.76 ± 0.13 ef1.21 ± 0.09 bc
2821.48 ± 0.02 d11.17 ± 0.05 hijk14.58 ± 0.08 jk18.37 ± 0.07 k52.54 ± 0.18 i3.69 ± 0.09 j
50721.64 ± 0.02 de10.65 ± 0.04 fg13.18 ± 0.05 i16.95 ± 0.03 ij51.08 ± 0.20 fgh2.45 ± 0.07 h
1423.25 ± 0.19 m10.49 ± 0.12 ef12.60 ± 0.20 fgh16.40 ± 0.22 efgi50.21 ± 0.24 cdef1.05 ± 0.22 b
2122.53 ± 0.03 jk10.68 ± 0.03 fg13.00 ± 0.04 ghi16.83 ± 0.04 hij50.60 ± 0.10 ef1.75 ± 0.07 de
2822.33 ± 0.10 ijk10.28 ± 0.08 bcd12.18 ± 0.12 bcd15.94 ± 0.12 bcd49.83 ± 0.27 abcd1.28 ± 0.14 bc
MT25720.41 ± 0.02 b10.98 ± 0.04 hi14.63 ± 0.07 k18.29 ± 0.05 k53.11 ± 0.19 efg4.35 ± 0.06 k
1421.72 ± 0.03 def10.69 ± 0.04 fg13.03 ± 0.06 hi16.86 ± 0.04 hij50.63 ± 0.18 bcde2.31 ± 0.07 gh
2121.91 ± 0.08 fgh10.35 ± 0.04 cde12.40 ± 0.09 def16.15 ± 0.08 cde50.15 ± 0.18 bcde1.75 ± 0.12 de
2822.63 ± 0.03 kl10.55 ± 0.04 ef12.62 ± 0.06 efgh16.44 ± 0.05 efgh50.11 ± 0.16 abc1.37 ± 0.07 c
40721.42 ± 0.01 cd11.69 ± 0.06 m16.10 ± 0.09 m19.89 ± 0.05 m54.02 ± 0.28 j5.14 ± 0.10 n
1422.49 ± 0.32 ijk10.00 ± 0.20 bc11.65 ± 0.32 bc15.35 ± 0.37 b49.34 ± 0.30 abc1.00 ± 0.28 b
2122.57 ± 0.03 jk10.62 ± 0.05 f12.92 ± 0.10 ghi16.72 ± 0.09 ghij50.56 ± 0.23 efg1.64 ± 0.13 d
2822.34 ± 0.15 hij10.51 ± 0.10 ef12.73 ± 0.21 ghi16.51 ± 0.22 fghi50.45 ± 0.27 def1.62 ± 0.28 d
50720.35 ± 0.03 b10.96 ± 0.05 hij14.76 ± 0.09 kl18.39 ± 0.08 k53.41 ± 0.21 ij4.48 ± 0.10 kl
1422.33 ± 0.09 ijk10.95 ± 0.09 gh13.18 ± 0.18 hi17.13 ± 0.18 j50.28 ± 0.31 bcde2.10 ± 0.19 fg
2123.22 ± 0.01 mn10.12 ± 0.12 b12.35 ± 0.21 cde15.97 ± 0.23 cd50.67 ± 0.25 ef0.71 ± 0.20 a
2821.64 ± 0.34 fgh8.62 ± 0.21 a10.01 ± 0.33 a12.89 ± 0.39 a52.94 ± 0.31 a3.31 ± 0.08 i
Temperature is reported in degrees Celsius and time in days. Color parameter values are reported as mean and standard deviation. Means in a column with the same letter are not significantly different (p > 0.05).
Table 2. Pearson correlation matrix for moisture and color components.
VariablesMoistureL*a*b*C*ΔE
Moisture1.000.56−0.20−0.41−0.36−0.57−0.56
L* 1.00−0.46−0.71−0.66−0.82−0.94
a* 1.000.910.950.370.53
b* 1.000.990.700.80
C* 1.000.640.75
1.000.93
ΔE 1.00
Color components are represented by the parameters L*, a*, b*, C*, H°, and ΔE.
Table 3. Characterization of the 35 volatile organic compounds identified in all analyses.
Compound
Name
m/zMolecular
Formula
ClassSensory Contribution
2-Methylbutanal86C5H10OAldehydeMalty, buttery, green.
Ethanol47C2H6OAlcoholFloral, sweet.
2,3-Butanedione86C4H6O2KetoneButtery, exotic.
2,3-Pentanedione100C5H8O2KetoneOily, buttery.
2-Methylpropanol74C4H10OAlcoholNot identified.
2,3-Hexanedione114C6H10O2KetoneCreamy, Sweet, buttery, cheesy.
1-Methylpyrrole81C5H7NHeterocyclic NSmoky, woody, herbal.
Pyridine79C5H5NHeterocyclic NSour, bitter, roasted, putrid.
3-Methylbutanol70C5H12OAlcoholNot identified.
Pyrazine80C4H4N2PyrazineCooked spinach, peanut, rancid, strong.
2-Methyl-3-tetrahydrofuranone100C5H8O2FuranSweet, baked, bread-like.
Methylpyrazine94C5H6N2Heterocyclic NNutty.
Acetoin88C4H8O2KetoneSweet, buttery, creamy.
Hydroxypropanone74C3H6O2KetoneCreamy, buttery, caramel-like.
2,5-Dimethyllpyrazine108C6H8N2PyrazineNutty, roasted, grassy, peanut, moldy.
2,6-Dimethylpyrazine108C6H8N2PyrazineChocolate, cocoa, roasted nuts.
Ethylpirazine107C6H8N2PyrazineNutty, peanut, buttery.
2-hydroxy-2-methylpropanoic acid101C4H8O3Organic AcidNutty, peanut, buttery.
2-Hydroxy-3-pentanone102C5H10O2KetoneTruffle-like.
1-Hydroxy-2-butanone88C4H8O2KetoneSweet, coffee-like.
2-Ethyl-6-methylpyrazine121C7H10N2PyrazineFloral, fruity, hazelnut-like.
Acetic acid60C2H4O2Carboxylic AcidSour, pungente, vinegar-like.
Furfural97C5H4O2FuranBread-like, almond, sweet.
1-Acetoxy-2-propanone116C5H8O3EsterOdorless.
Furfuryl formate126C6H6O3EsterEtheral, volatile.
2-Acetylfuran112C6H6O2FuranSweet, balsamic, almond, cocoa.
Pyrrole67C4H5NHeterocyclic NNutty, hay-like, herbaceous.
Vinyl propionate100C5H8O2EsterNot identified.
2-Acetoxymethylfuran140C7H8O3EsterEtheral, floral.
Propanoic acid74C3H6O2Organic AcidPungent, sour, rancid.
5-Methyl-2-furancarboxaldehyde110C6H6O2AldehydeSpicy, caramel, wine-like.
1-Methylpyrrole-2-carboxaldehyde109C6H7NOAldehydeMoldy.
4-hydroxybutanoic acid86C4H8O3Organic AcidNot identified.
2-Furanomethanol98C5H6O2AlcoholSweet, banana-like, fruity, etheral, caramel, burnt, smoky.
3-methylbutanoic acid101C5H10O2Organic AcidCheesy, dairy-like, creamy, fermented, acidic.
Compounds are ordered by retention time.
Table 4. Variation of phenolic compound content and antioxidant activity over 28 days of storage.
PackagingTemperature (°C)Time (°C)TPCABTSDPPHFRAP
020.746 ± 0.216 m40.115 ± 2.097 n52.860 ± 0.483 i40.865 ± 1.009 o
MN25720.747 ± 0.052 m39.923 ± 0.221 mn52.823 ± 0.831 i40.675 ± 1.866 o
1420.274 ± 0.040 jklm39.286 ± 0.552 klmn52.823 ± 0.448 i39.554 ± 0.278 mno
2119.732 ± 0.066 ij37.311 ± 0.506 ijklmn52.122 ± 0.320 i37.600 ± 0.090 jklm
2819.078 ± 0.040 h36.037 ± 0.796 hijkl51.716 ± 0.064 hi35.883 ± 0.485 ghijk
40719.796 ± 0.244 ijk37.566 ± 0.441 jklmn52.565 ± 0.356 i36.801 ± 0.933 ijkl
1418.120 ± 0.031 f35.081 ± 0.584 ghij50.091 ± 0.192 fg35.120 ± 0.878 efghi
2116.213 ± 0.294 d31.768 ± 0.191 efg48.836 ± 0.128 def33.404 ± 0.289 def
2814.265 ± 0.195 b26.480 ± 1.485 bcd45.846 ± 0.320 b29.626 ± 0.630 ab
50719.319 ± 0.046 hi35.463 ± 0.552 ghij50.719 ± 0.557 hi35.442 ± 0.109 fghij
1416.892 ± 0.466 e31.768 ± 0.833 efg48.652 ± 0.111 cde33.678 ± 0.215 defg
2115.729 ± 0.081 cd25.483 ± 0.331 bc45.772 ± 0.111 b31.986 ± 0.149 cd
2813.315 ± 0.107 a20.554 ± 1.168 a43.409 ± 0.064 a27.910 ± 0.376 a
MT25720.642 ± 0.250 lm40.688 ± 1.724 m52.897 ± 0.356 i41.044 ± 0.652 o
1420.344 ± 0.198 klm38.840 ± 0.833 jklmn53.081 ± 0.575 i39.888 ± 0.517 no
2119.747 ± 0.000 ij37.375 ± 0.292 ijklmn51.937 ± 0.064 hi38.410 ± 0.161 lmn
2818.903 ± 0.053 gh36.164 ± 1.338 hijklm51.826 ± 0.338 hi35.847 ± 0.074 ghijk
40720.159 ± 0.201 jkl39.477 ± 0.481 lmn52.897 ± 0.279 i37.969 ± 1.117 klmn
1418.379 ± 0.109 fg36.929 ± 1.011 ijklmn50.645 ± 0.586 gh36.134 ± 0.055 hijk
2117.085 ± 0.040 e32.915 ± 0.689 efgh49.796 ± 0.128 efg34.322 ± 0.373 efgh
2815.267 ± 0.031 c29.538 ± 0.772 cde47.433 ± 0.767 c31.032 ± 0.341 bc
50719.437 ± 0.070 hi35.527 ± 1.152 ghijk52.159 ± 0.448 i36.086 ± 0.230 hijk
1417.456 ± 0.100 e33.743 ± 0.481 fghi49.865 ± 0.064 efg34.846 ± 0.126 efghi
2116.250 ± 0.220 d29.984 ± 0.221 def48.172 ± 0.610 cd33.154 ± 0.055 cde
2813.999 ± 0.145 b23.549 ± 0.191 ab44.701 ± 0.639 ab29.006 ± 0.021 ab
Means in the same column followed by the same letter are not significantly different from each other (p > 0.05), as determined by statistical analysis.
Table 5. Fitting parameters and reaction order of kinetic models for the peroxide value and p-anisidine value under different storage conditions.
PackagingTemperature (°C)PVp-AV
R2RMSDReaction
Order
R2RMSDReaction
Order
MN250.78650.00522810.87100.084530
400.93890.0217710.94940.18930
500.98800.0113310.92190.36740
MT250.36560.00635110.88330.054760
400.92010.0208910.89620.23260
500.93770.0219910.91620.33030
Coefficient of determination (R2) and root mean square deviation (RMSD).
Table 6. Shelf-life determination at three temperatures for the PV and p-AV parameters in both packaging configurations.
PackagingTemperature (°C)OIlimPVp-AV
Shelf-Life (Days)Shelf-Life (Days)
MN257179.2563.10
40766.0122.11
50735.7111.60
MT257466.8279.28
407111.0226.29
50745.8913.33
Oxidative limit index (OIlim). Shelf-life reported in days.
Disclaimer/Publisher’s Note: The statements, opinions and data contained in all publications are solely those of the individual author(s) and contributor(s) and not of MDPI and/or the editor(s). MDPI and/or the editor(s) disclaim responsibility for any injury to people or property resulting from any ideas, methods, instructions or products referred to in the content.