Article

Algae Utilization for Sustainable Treatment of Potato Chip Processing Wastewater and Production of Protein-Rich Biomass

by
Omar Ashraf Abdulazim
1,2,
Eman Y. Tohamy
2,
Dong-Fang Deng
3 and
Saber A. El-Shafai
1,*
1
Water Pollution Research Department, National Research Centre, 33-El-Bohouth Street, Dokki, Giza 12622, Egypt
2
Department of Botany and Microbiology, Faculty of Science, Zagazig University, Zagazig 44519, Egypt
3
School of Freshwater Sciences, University of Wisconsin, Milwaukee, WI 53204, USA
*
Author to whom correspondence should be addressed.
Processes 2026, 14(11), 1723; https://doi.org/10.3390/pr14111723
Submission received: 25 February 2026 / Revised: 12 May 2026 / Accepted: 20 May 2026 / Published: 26 May 2026

Abstract

The potato chip processing (PCP) industry generates huge amounts of wastewater heavily polluted with organic matter and nutrients. The current treatment technology of PCP wastewater uses dissolved air flotation (DAF) and an activated sludge sequential batch reactor (SBR); both consume large amounts of chemicals and represent energy-intensive systems. This study explores the utilization of algae for the sustainable treatment of PCP wastewater, nutrient recovery, and algal biomass production. Conical flasks (1-L) and 6-L transparent plastic bottles were used as lab-scale algae photobioreactors (APBRs). Raw wastewater, an anaerobically pre-treated effluent and a DAF–SBR or shortly SBR effluent were used in the first, second, and third APBR. Three feed volumes from each source (150 mL, 300 mL, and 500 mL for first and second APBR and 400 mL, 600 mL, and 800 mL for third APBR) to a fixed volume of algal seed (200 mL) were tested to select the optimal feed volume and harvest time using a 1-L APBR. System performance and impact of water characteristics on quantity and quality of algal biomass were explored at pre-selected feed volume and harvest time in 6-L APBRs. All experiments were carried out in a growth chamber with continuous light (148.75 μmol.m−2.S−1). The results showed that 150 mL is the optimal feed volume for the first and second APBR at 10 days and 9 days growth cycles. An amount of 500 mL and 6 days were selected as the optimal feed volume and growth cycle for the third APBR. The average dry biomass yields at the pre-selected optimal conditions were 65.3 ± 11.4, 69.9 ± 12.0, and 100.6 ± 11.7 mg/L.d in the first, second, and third APBR, respectively. The first APBR achieved removals of 99.2 ± 0.4%, 98.7 ± 0.8%, 89.1 ± 4.3%, and 97.5 ± 1.4% for turbidity, COD, TKN, and TP, respectively, on average. Corresponding removal in the second APBR is 97.6 ± 2.6%, 91.6 ± 7.5%, 93.6 ± 4.5%, and 96.1 ± 1.4%, respectively, while the third APBR achieved 98.5%, 76.2%, and 97.0%, respectively. Additionally, the results of protein content and amino acids profiles indicate significant impacts of feed water quality on both parameters. The protein content was 30.64%, 32.53%, and 35.65% in the first, second, and third APBR, respectively. Similarly, the amino acids profile indicated a significant higher percentage of the amino acids in the third reactor compared with the first and second reactor.

1. Introduction

Agro-food processing industries generate huge amounts of highly polluted wastewater with negative adverse effects on ecological systems. Agro-industrial wastewaters are defined as high-strength with substantial amounts of organic matter and nutrients. Thus, agro-industrial wastewaters have the potential for eutrophication and negative environmental impacts [1]. Recently, the valorization of agro-industrial waste and wastewater has been considered to generate substantial amounts of products and byproducts with great value [2,3]. Agro-industrial wastewaters have been defined as growth media for cultivating algae species [4,5,6,7]. Currently, algae growth using high-strength industrial wastewater adheres to the issue of the waste-to-bioenergy economy that is different from conventional treatment with the purpose of nutrient removal. The cultivation of algae in wastewater is complex and more difficult than the growth of algae in fresh water [8].
Research articles have considered algal biomass as a potential substrate for many applications. Recognition of algae as feedstuff for bio-fuel production, as a sustainable and feasible option over fossil fuels [9,10,11,12] has been widely reported. Algae represent a sustainable feedstock option for biodiesel production [13]. Algae can be used to produce high value-added products and protein-rich biomass [14,15,16]. Algae have been reported as alternatives to produce high-value added metabolites [17]. Algal biomass is considered a potential feedstock for the production of carotenoids [16]. However, the requirements of huge amounts of fresh water and nutrients for the commercial cultivation of algae make it an inefficient economic process [16]. The estimated production cost of micro-algae has ranged between 20 to 200 USD/kg biomass [18]. On the other hand, many authors have reported production costs of dewatered algae between 4.15 and 5.96 EUR/kg in the different algae production systems [14,19]. These production costs make it difficult to produce competitive algae biomass using fresh water and chemical fertilizers [16]. Integration between wastewater treatment and algal production is a sustainable way to remediate wastewater and to reduce algal production costs [11]. Algae have the capacity to treat wastewater along with the production of carotenoids [16], since algae have been considered a potential source of carotenoids [16]. Algal-based technology has been recognized as a green sustainable technology alternative to energy-intensive conventional aerobic biological treatment systems [20,21,22,23]. Algae-based wastewater treatment technology is a promising cost-effective treatment, carbon fixation process, and renewable source of biomass [23,24]. In addition to wastewater treatment, algae have been reported to effectively capture and remove CO2 [25]. Recently, the cultivation of algae using industrial wastewater has been considered in pollution control and energy-producing strategies. Industrial wastewater rich in nutrients could be used directly or after pre-treatment or dilution for growing algae for bio-fuel production [26]. Algal-based wastewater treatment systems depend on the growth and proliferation of mixotrophic algae which have the ability to utilize organic and inorganic carbon in addition to nutrients (nitrogen and phosphorous) to produce more algal biomass and reduce the concentration of various contaminants [17,23,27,28,29]. Incorporating micro-algae into wastewater treatment generates oxygen through the photosynthesis process, and this oxygen is subsequently utilized by heterotrophic bacteria to biodegrade organic matter [30]. Thus, co-culturing algae and bacteria has gained great attention and defined as potential to capture carbon and nutrients from agro-industrial wastewaters and to produce a valuable biomass [31,32]. This co-culturing enhances biomass production and lipid yield [33,34,35,36,37].
Algal culture systems could be open or closed [38,39,40]. The open culture systems of algae, like raceway ponds and high-rate algal ponds, have been widely used for the commercial production of algae using wastewater. These systems are considered simple and low-cost in construction and operation [8,41]. However, the open culture systems have several disadvantages, like vulnerability of the system to contamination, low production rate, huge area requirements, and water losses via evaporation. On the other hand, closed algae photobioreactors (APBRs) are costly in construction and operation but easy to control and can be used for the growth and production of pure culture that could be used for the production of value-added products for pharmaceutical application [1]. Also, closed APBRs have higher growth and biomass yield and provide better treatment performance [11,42]. Integrated wastewater treatment and algae production represent a sustainable and cost-effective way for both wastewater treatment and algae production [11]; however, algae harvesting represents a bottleneck for algal wastewater treatment systems and contributes to 20% of the total production costs [11]. Immobilization technology has been used to decline the costs of algae harvesting, which represents 20% of the production cost [43,44]. A comparison between immobilized algae cells and free suspension cells has indicated promising separation in the case of immobilized cells, but there are not any advantages of immobilized cell over free suspension in terms of nutritional value and protein content; even the biomass of immobilized cells is fairly poor [45]; moreover, the utilization of immobilized algae cells for animal and fish feed production and human food is not easy due to the presence of immobilizing agents with the algae cells.
Cultivation of algae on wastewater faces big challenges for organic surplus, higher nutrients concentration, initial pH, coloration, and turbidity of wastewater that hinder light penetration, total dissolved solids, and the salinity of wastewater, microbial contamination, scale up of the bioreactors, and algae harvesting, among other factors. Solutions for the previous bottlenecks of wastewater-based algae production may include pre-treatment or dilution for wastewater conditioning to have maximal growth and biomass production [30,31]. In one study, confectionary wastewater was post-treated using three different cyanobacteria after pre-treatment in an attached aerobic biofilm filter inoculated with indigenous microorganisms [46].
The potato chip processing industry (PCPI), as one of the largest agro-food processing industries, generates huge amounts of heavily polluted wastewater contaminated with organic matter and nutrients. In Egypt, the current treatment technology of potato chip processing (PCP) wastewater utilizes dissolved air flotation (DAF) followed by conventional activated sludge using a sequential batch reactor (SBR). DAF is considered a chemicals-added treatment method that represents, like other chemical-based treatment processes, a non-sustainable method. Both DAF and aerobic SBRs consume large amounts of chemicals and represent energy-expensive processes. Alternative technology based on an algae photobioreactor (APBR) is proposed for the bioremediation of PCP wastewater and to produce protein-rich biomass for possible application in the fish and animal feed industries. Anaerobic digestion is a mineralization process and provides effluents rich in ammonia and phosphorus; both are available forms for the uptake by algae and aquatic macrophyte plants [47,48]. In this study, three sources of PCP wastewaters with different qualities were explored for algae growth in an algae photobioreactor (APBR). These sources include PCP wastewater after screening (S effluent), effluent of a two-stage up-flow anaerobic sludge blanket (UASB) feed with PCP wastewater after screening (UASB effluent), and effluent of SBR feed with PCP wastewater after complex treatment processes start with screening, lamella settler, and then DAF (SBR effluent).

2. Materials and Methods

2.1. Experimental Setups

Two experiments were designed and carried out. The first experiment explores the optimal feed ratio and growth period (growth cycle) for the three different wastewater sources. Data from the first experiment were used to design and run the second experiment during which evaluation of the treatment performance, algal biomass yield, and quality of the biomass were assessed.

2.2. Sources and Sampling of Wastewaters

Three different sources of PCP wastewaters with different qualities were collected from one of the largest PCP factories in Egypt. The factory is located at 6th of October City. The S effluent was collected after an arc screen, while the SBR effluent was collected from the final effluent of a comprehensive wastewater treatment plant, which includes an arc screen, lamella settler, DAF unit, and finally an aerobic SBR. The S effluent was collected in huge amounts to feed a two-stage pilot-scale UASB reactor working at a 72 h total hydraulic retention time. The UASB effluent was collected from the previously mentioned two-stage UASB reactor.

2.3. Growth Conditions

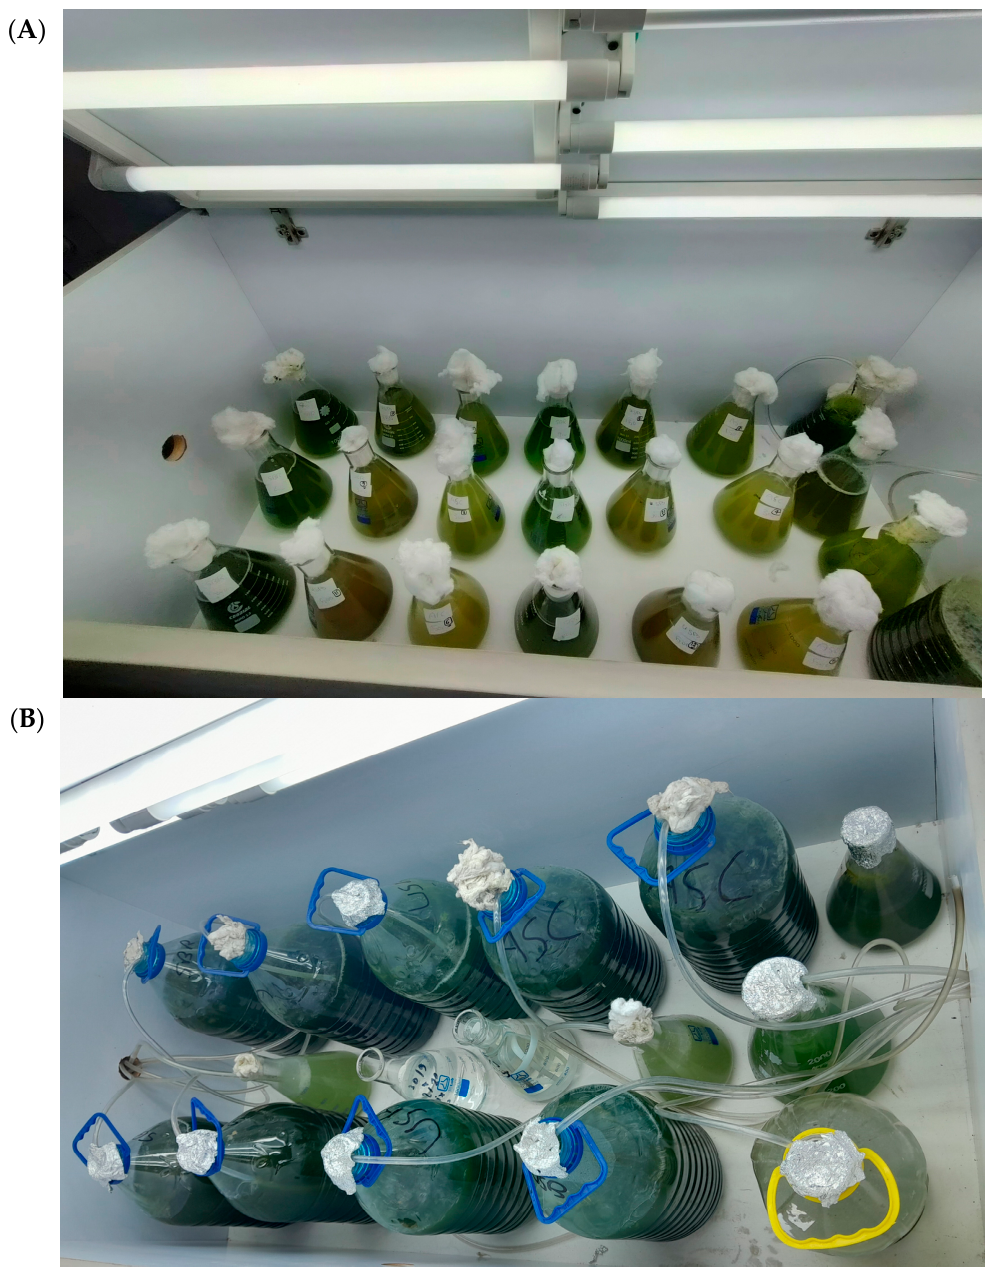
All experimental works of algae growth were carried out in a lab-scale algae growth chamber provided with artificial light using white LED lamps (Figure 1). The algae growth chamber has a 0.72 m2 surface area, and its cover is provided with seven 9-watt LED lamps which provide light intensity of 148.75 µmol.m−2.S−1 that is comparable to the selected values in the literature review [45,49,50,51,52].

2.4. Source of Algal Culture and Pre-Enrichment

Varieties of growth media have been used for the isolation, growth, and commercial production of algae; however blue-green 11 (BG-11) medium is widely used as a growth medium for freshwater micro-algae [13]. A total of 200 mL of mixed culture from an HRAP receiving anaerobic effluent from the two-stage UASB reactor treating PCP wastewater (S effluent) was taken, mixed with 1000 mL of BG-11, and inoculated in a 2-L APBR. The source of the algal inoculum mostly contains the Chlorella and Scenedesmus species. The APBR was continuously supplied with air (1.75 mL/m) to keep the algae in suspension. After the 12-day growth period in the algae growth chamber, the total volume (1200 m) was equally divided into three APBRs (400 mL each). A total of 800 mL of BG-11 media was added to each APBR, continuously supplied with air (1.75 mL/m), and propagated for an additional 6 days. At the end of 18 days of the total enrichment or propagation period, the total volume of the pre-enriched algae (3600 mL) was ready to be used for the treatment of wastewaters.

2.5. Experiment 1

The first experiment was carried out in duplicate to select the optimal feed volume and growth cycle using the wastewater sources. There are 18 APBRs with 1-L effective volume (Figure 1A) for each. An amount of 200 mL from the pre-enriched algal culture was added to each reactor. Three different feed volumes for each source were added to the reactors, as indicated in Table 1.
To prevent settlement of the algal biomass and to ensure a complete mix of the reactor content, the APBRs were continuously supplied with air bubbles at 1.17 L/m (3.5/3) using six 5-watt air pumps with a 3.5 L/m average flow rate for each reactor. During the course of the experiment, 25 mL of the reactor content was collected and subjected to laboratory analysis for TSS, chlorophyll content, optical density measurement, and algae count. The experiment was extended until the decline in chlorophyll content, optical density, and TSS concentration started, which indicates the maximum growth point of algae in the bioreactor.

2.6. Experiment 2

The data from the first experiment were used to establish the second experiment, during which the optimal feed volume of each source of wastewater was used to propagate algae in larger APBRs and to evaluate the systems’ performance and daily yield of algal biomass. During this experiment, three 6-L reactors were used for each source of wastewater (Figure 1B). The APBRs were operated in batch mode with continuous mixing using air bubbles at a flow rate of 1.75 L/m for each reactor. At the end of the growth cycle (harvest time), 4.8 L were collected from the APBR and 1.2 L were left in the reactor as new algal seed. The 1.2 L algal seed in the large reactor (6 L) were matched with 200 mL used in the small reactor (1 L) of the first experiment. The effluent of each PBR was subjected to 24-h gravity sedimentation, followed by decanting the treated supernatant and collecting the settled algal biomass. The clear supernatant was laboratory analyzed to estimate the removal efficiency of the water quality parameters. A representative sample from the settled algae was used for each trail to estimate the yield and dry matter content. The clear supernatants were analyzed for turbidity, TSS, COD, ammonia, nitrite, nitrate, TKN, and phosphorus. Pre-selected wastewater volume was added to each APBR (containing 1.2 L algal seed) and completed to the mark (6 L) with distilled water.

2.7. Analytical Methods

All physicochemical analyses of wastewater samples and effluent from the APBRs were carried out according to the standard methods for the examination of water and wastewater [53]. Optical density was measured using a NANOCOLOR Advance spectrophotometer (MACHEREY-NAGEL, Valencienner Str. 11, 52355 Düren, Germany). COD was measured according to the dichromate method using two ranges, one for the influent (0–1500 mg/L), and one for the treated effluents (0–40 mg/L), the 5220 D method [53]. Total ammonia nitrogen was measured using distillation, (4500-NH3 B) adsorption in boric acid solution followed by titration according to method 4500-NH3 E, in the standard method [53]. TKN was measured titrimetrically after acid digestion using the mercuric sulfate method (4500-Norg B), in the standard method. Nitrite was measured colorimetrically according to method 4500-NO2 B, in the standard method [53]. Total phosphorus was measured after potassium persulphate digestion using the vanadomolybdophosphoric acid colorimetric method, 4500-P C. Total alkalinity was measured using the titrimetric method, and the pH was measured by an HACH pH meter. Turbidity was measured using a HANA turbidity meter model H198703. Optical density of the algae suspension was measured at 660 nm using Nano-color spectrophotometer (MACHEREY-NAGEL, Valencienner Str. 11, 52355 Düren, Germany). Chlorophyll was measured using method 10,200 H, in the standard method [53].
Amino acid profiles were determined by HPLC after protein extraction. Total protein content was estimated as the sum of the amino acids as a percentage.

3. Results

3.1. Characteristics of Raw Wastewaters

For characterization of the raw wastewater after screening, the UASB and SBR effluent is presented in Table 2. The data show great variations between the three water sources, with high concentrations of organic matter represented by COD, BOD, and TSS in the raw wastewater after screening. The BOD/COD ratio of the raw wastewater after screening is 69.5%, which reflects the organic nature of the pollutants due to the presence of considerable amounts of starch with high biodegradation rate. The estimated soluble COD exceeds 50% of the total COD, as shown from the data for the TSS. There was a great variation in the COD of the three sources due to the performance of treatment processes in the UASB and SBR; both decline the average COD concentration in the effluents. Characteristics of the UASB effluent show significant reduction in the pollution load, with an average COD of 544 mg/L. The SBR significantly reduced the pollution loads and COD; however, sludge settling problems caused considerable amount of TSS in the final treated effluent, which significantly contributed to the COD concentration, with an average value of 292 mg/L. Similarly, TKN and TP are present in substantial amounts, especially in organic form, due to the presence of suspended solids. The average values of TKN and TP were 302 mg N/L and 36.2 mg P/L, 313 mg N/L and 27.1 mg P/L, and finally 72.5 mg N/L and 13.5 mg P/L for TKN and TP, respectively, in the wastewater feed of the first, second, and third APBR. Ammonia nitrogen represents a considerable amount of the TKN concentration in the feed of the second APBR (UASB effluent), due to the anaerobic digestion of the organic nitrogen. This ammonia is mostly preferred as a nitrogen source for algae and other photosynthetic organisms, like plants [54,55]. Generally, algae and other plants prefer ammonia nitrogen over nitrate due to the higher energy requirement for two-step nitrate reduction processes to release ammonia (nitrate and nitrite reductase enzyme), which were subsequently incorporated into the amino acids. The study of Yan et al. [56] reported a non-significant increase in the growth rate of algae species exposed to ammonia-enriched natural water when compared to nitrate-enriched natural water. However, ammonia has a toxic effect at high concentration. Uggetti et al. [57] reported the threshold level of ammonia toxicity to algae at 260 mg N/L. Other researchers have reported ammonia toxicity and the reduction of algae growth and nitrogen assimilation at concentrations between 120 and 200 mg N/L [58,59]. A total of 128.5 mg N/L were reported as the optimal ammonia concentration for Chlorella growth [55]. On the other hand, Li et al. [60] recorded the highest growth of algae at 300 mg NH4-N/L, while Wang et al. [61] reported the maximum growth rate of Chlorella at 400 mg N/L ammonia concentration. These great variations in the threshold levels of ammonia toxicity are mostly attributed to other controlling factors like pH and temperature [62].
The pH concentration of raw wastewater after screening indicates the acidic nature of the wastewater due to the process of hydrolysis and acidogenesis of readily biodegradable wastewater during storage and transportation in the sewer pipe lines from production lines to the inlet of the wastewater treatment plant. These two processes generate volatile fatty acids (VFA) which decline the pH to the acidic side. On the other hand, during the anaerobic digestion in the UASB reactor, these VFA, plus other newly produced acids, are converted into methane gas by methanogens, and so rise in the pH due to VFA depletion. Additionally, ammonification of the organic fraction of the TKN releases considerable amounts of ammonia which drag the pH to the alkaline side. Both the depletion of VFA and the production of ammonia in the UASB enhance the pH rise in the effluent. The percentage of ammonia was 33.8%, 73.8%, and 18.6% in the raw wastewater after screening, UASB effluent, and SBR effluent, respectively, and this is mostly due to the partial mineralization of organic nitrogen in the sewer pipelines and manholes and higher mineralization in the UASB reactor, while the lower percentage in the SBR is due to the presence of SS in the effluent, which recorded 180 mg/L on average, in addition to the effective removal of ammonia in the SBR effluent.
Comparing the TSS concentration and turbidity in the three sources of wastewater indicates a weak correlation between the TSS and turbidity, since the TSS of the raw wastewater after screening is around 10-fold and 13.5-fold the concentration in the UASB and SBR effluents, respectively, while turbidity after screening represents only 3.7-fold and 4.3-fold the turbidity after UASB and SBR, respectively. This could be attributed to the nature of the TSS, not only the concentration as reported by [63], which reported that cloudy and colloidal particles contribute more in the turbidity than the coarse suspended solids. This also indicates that the TSS in the raw wastewater after screening is more particulate and coarser in nature compared to the colloidal nature of the UASB and SBR effluents.
Similarly, the nitrogen and phosphorous content of the three sources are greatly variable. The COD/N/P ratios are 171:8.3:1.0, 20:11.5:1.0, and 21.6:5.4:1.0, in the effluents after screening, UASB, and SBR, respectively. The ratios between these three parameters are reported to significantly control the algae growth rate [64,65]. On the other hand, some researchers have reported the significant role of the N/P ratio without including COD or organic carbon [61,66].

3.2. First Experiments (Best Feed Volume and Harvesting Time)

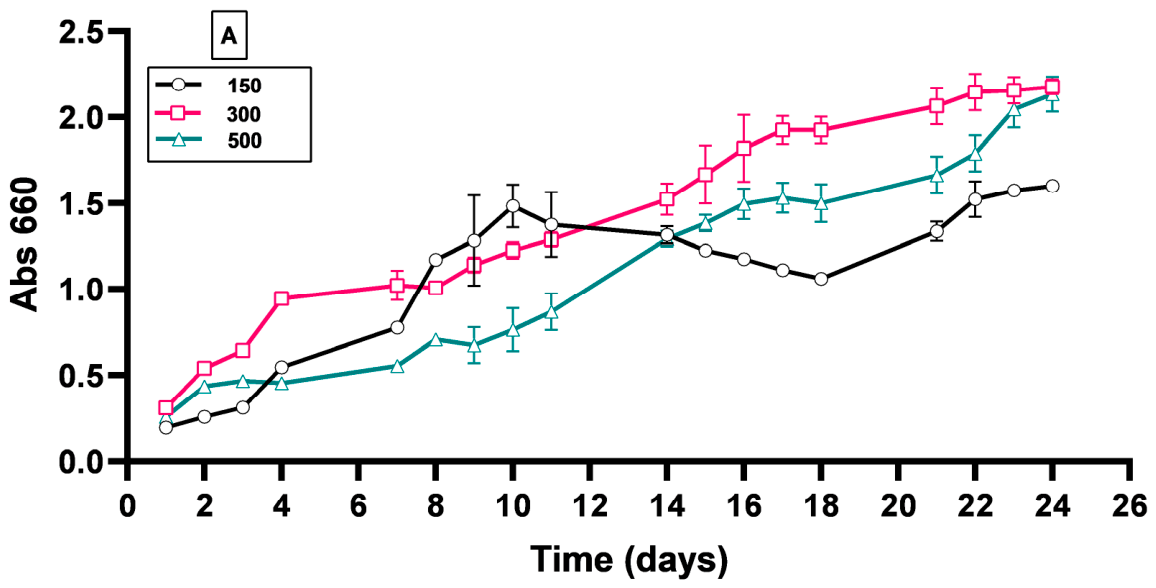
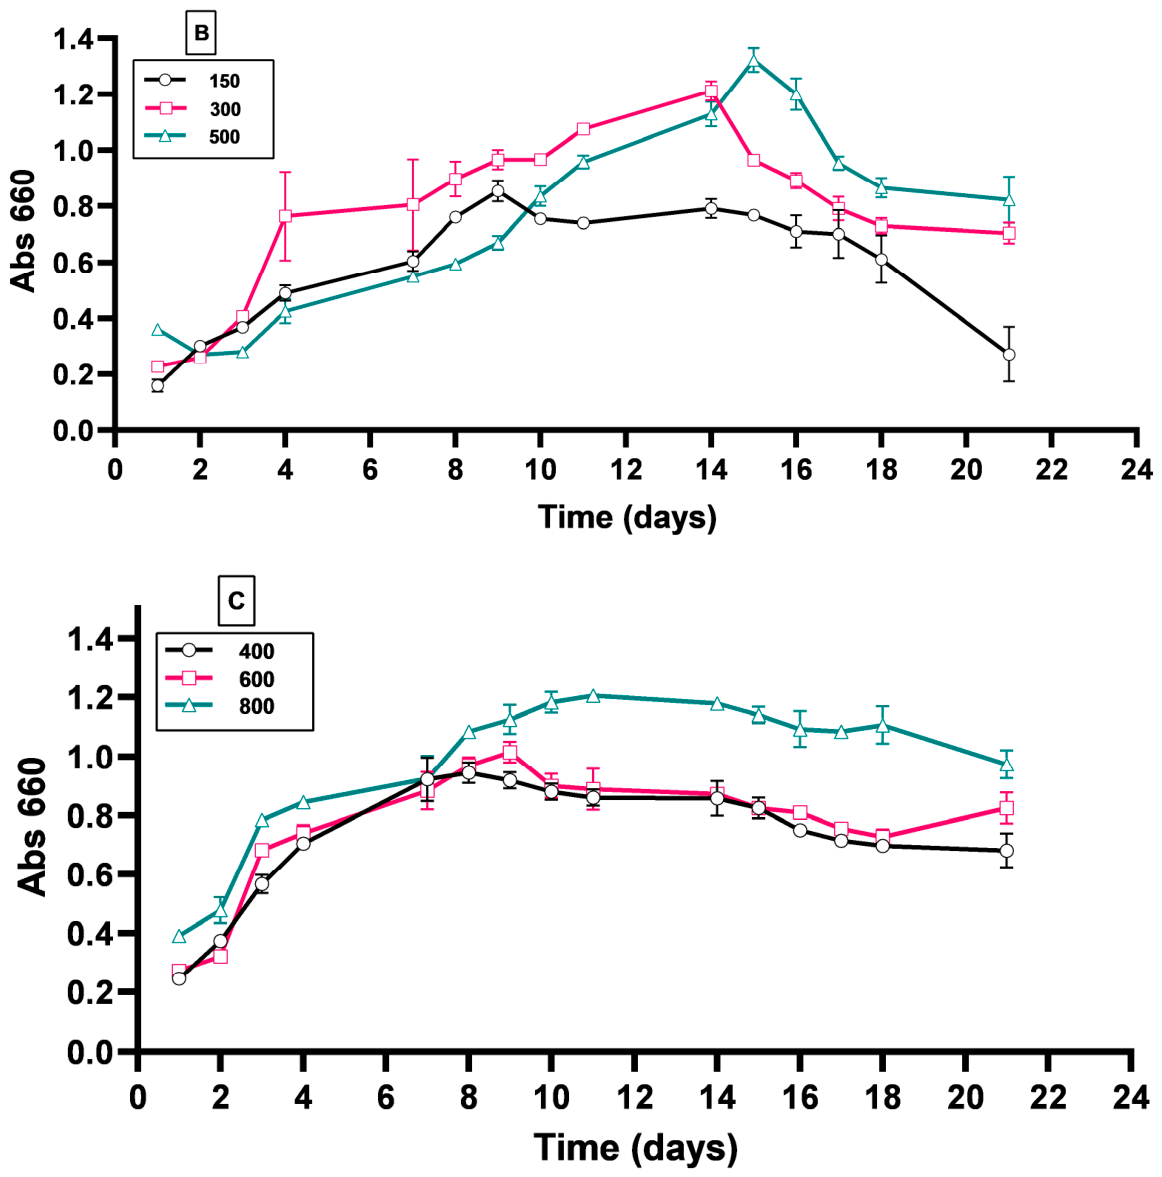
The results of the optical densities of the algae suspension in the different photo-bioreactors are shown in Figure 2A–C, which indicate the best feed volume of the wastewater and harvest time of the algae in the three APBRs. The data indicate that the optimum feed volume is 150 mL in the first and second APBR, with growth periods of 10–11 days in the first and 8–9 days in the second reactor. In the case of the third APBR, the optimum feed volume was between 400 mL and 600 mL, with 6–7 days growth period or harvest time. An amount of 500 mL was selected as the optimal feed volume in the third reactor. Based on the characteristics of the wastewater (Table 2), the estimated N and P daily loading rates are 4.53, 5.87, and 4.83 mg N/L.d and 0.54, 0.51, and 0.90 mg P/L.d in the first, second, and third reactor, respectively. The applied daily N loading rate is higher in the second reactor; however, most of N is present as ammonia, which could be exposed to volatilization in the reactor due to the alkaline pH. Similarly, the P loading rate was comparable in the first and second reactor but significantly higher in the third reactor.

3.3. Second Experiment

3.3.1. Treatment Performance of the APBRs in Removing Organic Matter

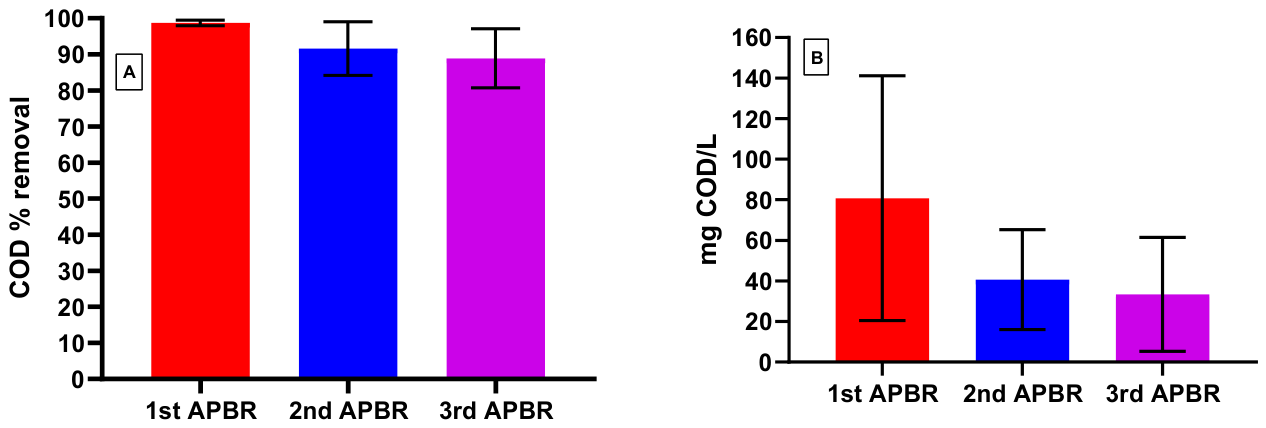
The data of the treatment performance of the first, second, and third APBR in removing COD are presented as residual concentrations and as percentage of removal (Figure 3). The percentage of removal of COD is influenced by the initial concentration of the influent wastewater, and the average values are 98.7 ± 0.8%, 91.6 ± 7.5%, and 88.9 ± 8.2% in the first, second, and third APBR, respectively, which indicate the highest percentage removal rate in the first APBR feed with the screened wastewater. However, the corresponding residual concentrations are 80.8 ± 60.4, 40.7 ± 24.6, and 33.4 ± 28.1 mg O2/L, which indicate the lowest concentration in the third APBR. The first APBR provides the maximum COD removal load (g COD/L.d). Indeed, the treatment performance of the APBR in COD removal not only depends on the characteristics of the influent wastewater, but it depends on the characteristics of the algal biomass and its tendency to settle in the sedimentation unit.
The great variation in the residual concentrations of the COD and its percentage of removal between the treatment reactors and within the same reactor is attributed to the variation in the initial COD of the influents and the utilization of mixed culture without sterilization, which give a chance for the bacteria and other microorganisms to grow with the algae. The presence of heterotrophic bacteria propagate in the reactors, and their contribution increased significantly by the time to reach maximum at the end of the trails; this is reflected by the low COD concentrations in the last cycle (end of the experiment). In the last cycle, the residual concentration of COD reached 28, 22, and 15 mg O2/L in the first, second, and third APBR, compared to 211, 98, and 98 mg O2/L in the first cycle. It is hard to utilize pure algae species to treat wastewater due to the presence of biological contamination, mostly heterotrophic bacteria in the wastewater.
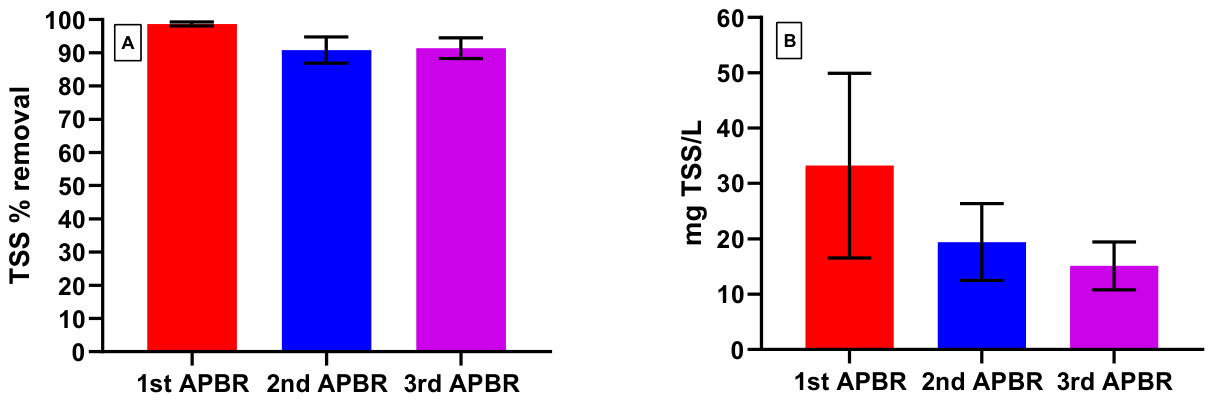
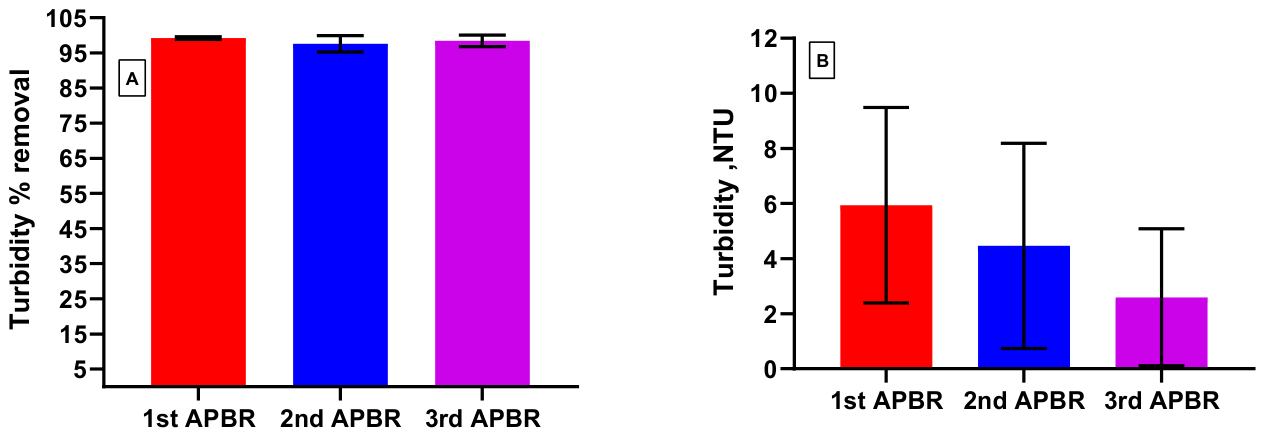
Similar to COD removal, the reactors showed potential in removing turbidity (Figure 4) and TSS (Figure 5) after overnight algae sedimentation. The average residual turbidity was 6.1 ± 3.8, 4.5 ± 3.7 and 2.6 ± 2.5 NTUs in the first, second, and third APBR, respectively. The corresponding percentage of removals were 99.2 ± 0.4%, 97.6 ± 2.6%, and 98.4 ± 1.6%, respectively. In the case of TSS, the average residual concentrations were 33.2 ± 16.7, 19.4 ± 7.0 and 15.1 ± 4.3 mg/L in the first, second, and third APBR. The corresponding percentage of removals are 98.7 ± 0.6%, 90.8 ± 4.0%, and 91.4 ± 3.1%.

3.3.2. Treatment Performance of the APBRs in Nutrients Removal

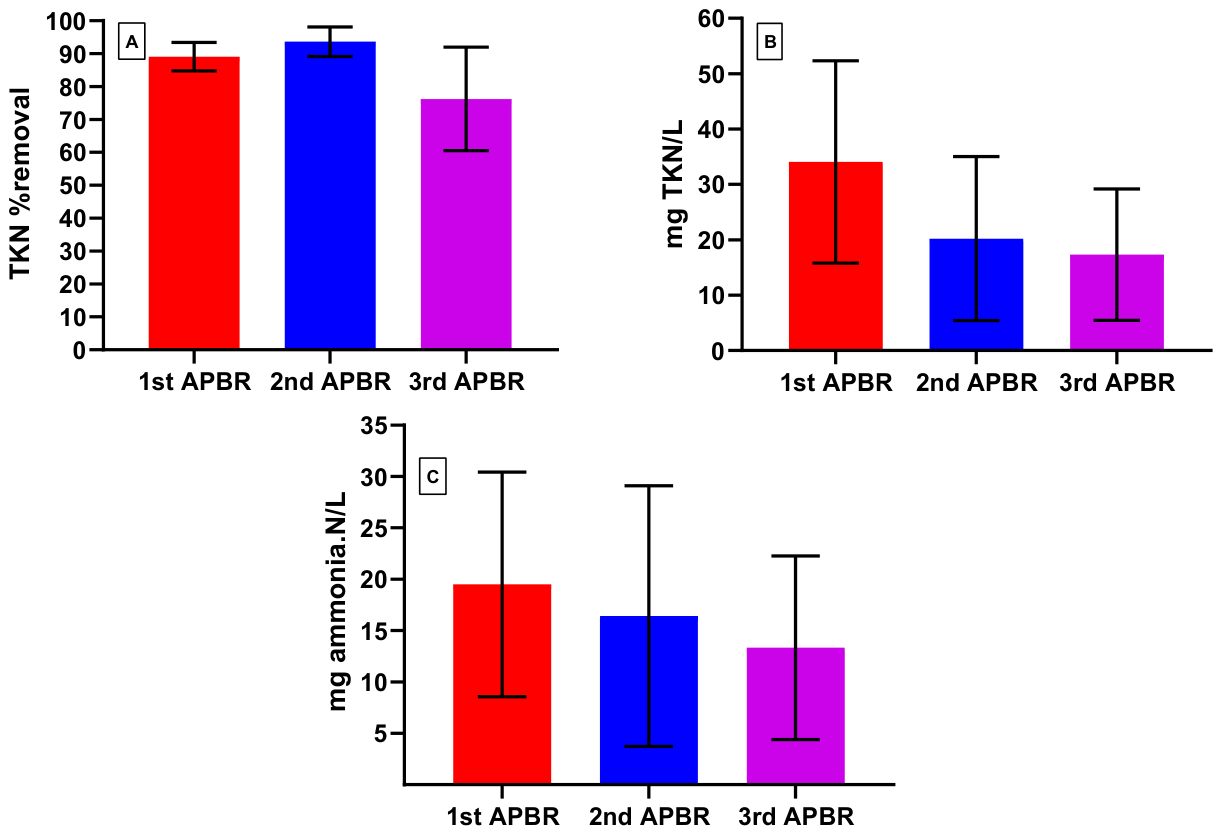
Nitrogen (represented by ammonia and TKN) and phosphorous are the main nutrients in wastewater. The N and P requirements for algae growth represent the bottleneck for the widespread application of algae culture, and significantly raise the production costs. PCP wastewater contains significant concentrations of N and P. As presented in Figure 6A, the residual concentrations of TKN are 34.1 ± 18.3, 20.2 ± 14.8, and 17.3 ± 11.9 mg N/L in the first, second, and third APBR, respectively, after algae separation. The corresponding percentage of removals are 89.1 ± 4.3%, 93.6 ± 1.4%, and 76.2 ± 15.8%, respectively (Figure 6B), based on the nitrogen concentration in the feed and the residual concentration after algae separation. However, the actual total nitrogen removal and mass balance is summarized in Table 3, which shows the average nitrogen removal of 93.6%, 96.7%, and 96.9% in the three respective reactors. The residual ammonia concentrations were 14.5 ± 10.9, 16.4 ± 12.7, and 13.4 ± 8.9 mg N/L, respectively (Figure 6C). As we can observe from the results of the residual ammonia concentration in the third APBR and the initial ammonia concentration of 13.5 ± 3.1 mg N/L (Table 2), we detect ammonia increase in the final treated effluent in some batches, which is mostly attributed to the presence of high organic nitrogen in the influent (sludge flocs from the SBR). The organic nitrogen undergoes ammonification due to the presence of heterotrophic bacteria in the reactor, and raises the residual ammonia concentration. This finding is matched by the reported ammonia increase in an APBR treating agro-industrial wastewater that is low in ammonia and high in organic nitrogen [31]. As indicated in Table 4, the non-algae mediated process for nitrogen removal was 16.9%, 35.6%, and 13.1% in the first, second, and third reactor, respectively, which is mostly influenced by the initial nitrogen, ammonia, and COD of the feed. The higher percentage of the non-algae mediated process of nitrogen removal could be attributed to ammonia volatilization, especially in the second and first reactor, where the feed wastewater contains significant amount of ammonia. During the treatment of swine wastewater with different dilutions, Cheng et al. [55] reported maximum ammonia nitrogen removal of 86.7%, 98.3%, and 99.5% from initial concentrations of 1678, 786, and 356 mg N/L, respectively, which means maximum ammonia removal loads of 137.0, 94.4, and 61.7 mg N/L. Comparing the previous values with the reported maximum growth yield of 1.29, 1.95, and 2.01 g/L at the three different initial ammonia concentrations, Cheng et al. [55] indicated a remarkable significant part of ammonia removal may not be attributed to the algal uptake. Similarly, a significant portion of ammonia removal (40%) was observed in control bioreactor without algae [45] during the treatment of urban wastewater using algae species (Chlorella and Scenedesmus), which means non-algae mediated processes could contribute to ammonia removal in the APBR. The estimated daily nitrogen removal loads from Table 3 indicate nitrogen removal at 3.9, 5.7, and 6.6 mg N/L.d, which is better than the reported values during the treatment of raw and diluted wastewater from the animal feed production industry in an algal–bacterial system. The reported data revealed a decline in the TN by 62% and 80% from initial concentrations of 98.5 and 49.25 mg N/L, respectively, after 374 h [31], with corresponding daily removal rates of 3.92 and 2.53 mg N/L.d with significant decline by decreasing the initial concentration, which match with the data of the current experiment, except the results of the current experiment are significantly better than the reported data. In a rectangular APBR inoculated with algal–bacterial culture and treating potato wastewater and a liquid fraction of pig manure at a daily ammonia loading rate of 1.2 mg N/L.d [30], the authors reported ammonia removal in the range between 82.7% and 95%, which correspond to daily removal load of 0.99–1.14 mg N/L.d [30]; they also reported estimated ammonia stripping and ammonia recovery of 0.034 and 1.11 mg N/L.d for potato wastewater and 0.248 and 0.744 mg N/L.d for the liquid fraction of pig manure. The results of nitrogen removal and the fraction of the algal uptake (recovery) of the current study are higher than the values reported by [30].
During the 14-day culture period using municipal sewage, Scenedesmus quadricauda was able to decline the nitrogen concentration from an initial concentration of 73.8 mg N/L to a residual concentration of 8 mg N/L, which is equivalent to 89% removal [67]. The equivalent daily N removal is 4.7 mg N/L.d, which is comparable to the daily nitrogen removal in the current study (3.9, 5.7, and 6.6 mg N/L.d).
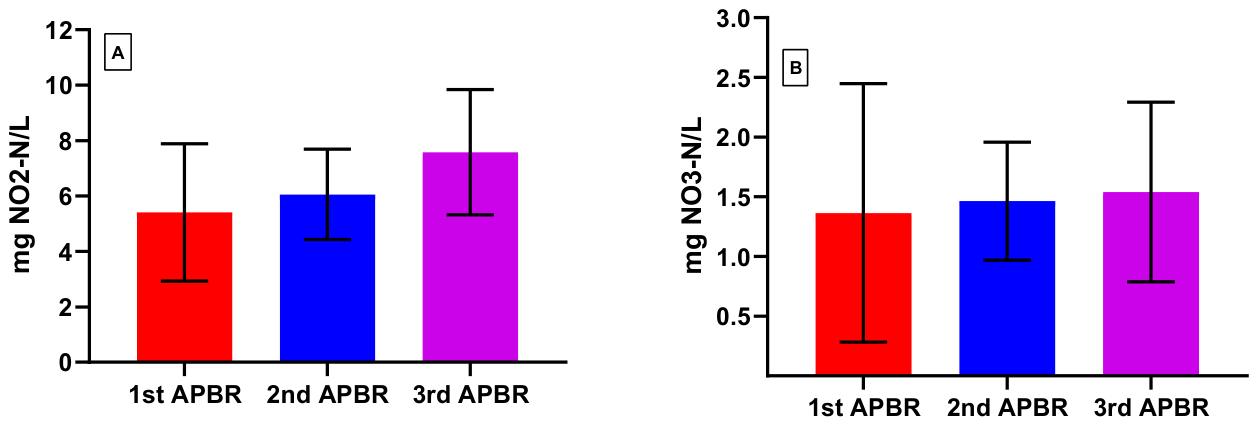
As shown in Figure 7, some part of the ammonia or TKN after ammonification has been partially oxidized into nitrite and another part has been completely oxidized into nitrate. The average nitrite concentrations in the first, second, and third APBR are 5.41 ± 2.48%, 6.06 ± 1.623%, and 7.58 ± 2.3%, respectively. The corresponding average concentrations of nitrate are 1.36 ± 1.08%, 1.46 ± 0.49%, and 1.54 ± 0.80%, respectively. The higher nitrite concentration could be attributed to the fast growing rate of ammonia oxidizers compared to nitrite oxidizers [68,69]. It also could be attributed to the competition between heterotrophic bacteria and autotrophic bacteria (nitrifiers), since we have a significant amount of COD load. Neither NO2 nor NO3 were detected in the treated effluent of batch APBR treating agro-industrial wastewaters [31], which is totally not matched with the current results.
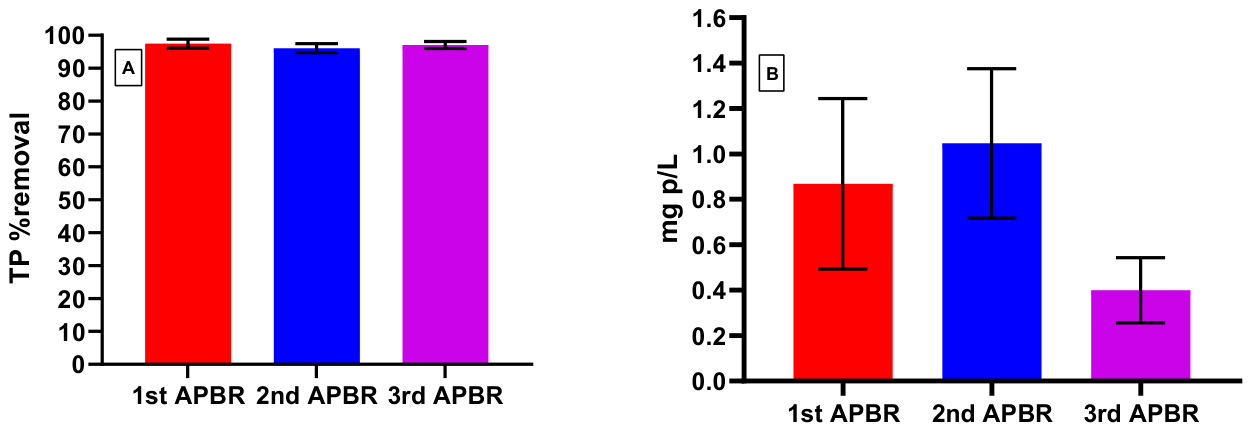
For TP (Figure 8), the residual concentrations are 1.36 ± 1.08, 1.46 ± 0.49, and 1.54 ± 0.8 mg P/L, while the corresponding percentage of removals are 97.5 ± 1.4%, 96.1 ± 1.4%, and 97.0 ± 1.1%, in the first, second, and third APBR, respectively. Since this is a sequential, batch operated system, the actual P load was 5.43 (36.2 mg P/L × 0.15 L), 4.07 (27.1 mg P/L × 0.15L), and 6.75 (13.5 mg P/L × 0.5 L) mg P/L in each batch, which means an actual P removal of 75%, 64.1%, and 77.2% from the initial loads. Cheng et al. [55] reported P removal efficiency of 71.1%, 84.7%, and 95.9% from initial concentrations of 158, 96, and 62 mg P/L, respectively, during the treatment of anaerobic digested swine wastewater in APBR; however, the authors did not mention the hydraulic retention time in their reactor. During the treatment of agro-food processing wastewater in APBRs, phosphorous removal achieved 83% and 57% from initial concentrations of 13.5 mg P/L and 6.75 mg P/L, with corresponding daily removal rates of 0.719 mg P/L and 0.247 mg P/L [31]. In the current experiment, the daily P removal loads were 0.37, 0.33, and 0.87 mg P/L.d in the first, second, and third APBR, respectively, which are comparable to the previous data reported by [31]. Using municipal sewage as the growth medium, Scenedesmus quadricauda declines the P concentration from a 28.18 mg/L initial concentration to a residual concentration of 5.37 mg/L, which means around 80% P removal [67] and equivalent daily P removal of 1.63 mg P/L.d, which is higher than the results of the current study. This could be attributed to the impact of light/dark period, since continuous light (this study) was reported as inferior to light/dark period with regard to algae growth and nutrient uptake [56].

3.3.3. Biomass Yield in the APBRs

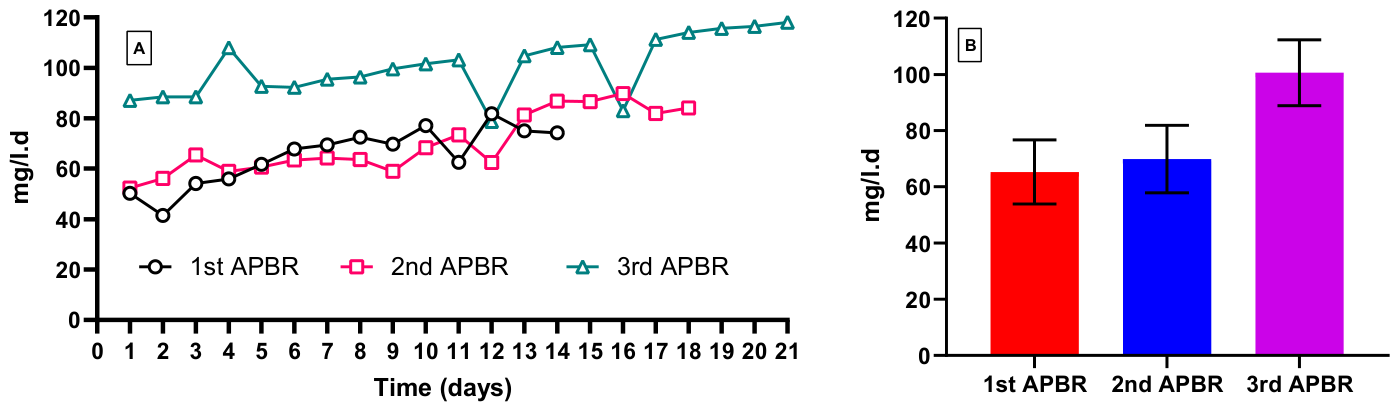
The data in Figure 9 show the daily algal biomass yield in dry form (A) and the average yield (B) during the second experiment. The data of the biomass yield show excellent growth rates of the algae, especially in the second and third APBR feed with the UASB and SBR effluent, respectively. The results show the minimum yield of 41.5, 52.4, and 78.7 mg/L.d in the first, second, and third APBR, respectively, while the maximum yield recorded was 81.8, 89.8, and 118.1 mg/L.d, respectively. The average dry biomass yields of the APBRs were 65.3, 69.9, and 100.6 mg/L.d in the first, second, and third APBR, respectively. It is not only the light intensity that is affecting the growth yield and biochemical composition of the algal biomass. Both light intensity and the quality of the light (white, red, and blue light) influence the growth yield and biomass composition of algae species [70]. Increases light intensity from 10 to 60 and then 300 μ photon m−2 s−1 promotes the biomass yield and protein content during the cultivation of Sargassum horneri at 18 °C and 12 h/12 h light/dark period [56]. Also, nitrogen enriched sea water produces more algal biomass yield, especially at higher light levels, such as 60 and 300 μ photos m−2 s−1 [56]. Generally, different algae species demonstrate different growth rates under culture in the same wastewater sources, and the same algae species demonstrate different growth rates using different wastewater sources [64]. The higher biomass yield in the second and third APBR is mostly attributed to the lower turbidity in the UASB and SBR effluent compared to the raw wastewater after screening, which has more particulate matter. The higher turbidity in the first APBR feed with the raw wastewater after screening limits the light penetration into the reactor and negatively influence the growth rate and biomass yield. These biomass yields are higher than the growth yield (26.3 mg/L.d) reported by [30] during the growth of freshwater algae using potato wastewater and a liquid fraction of pig manure. However, the yield in the current study is lower than the growth range of 188.6–278.6 mg/L.d reported by [55]. In the current study, the dry biomass yield is higher than the daily yield (28.6 g/L) of pure Chlorella vulgaris grown on pre-treated municipal wastewater [49].
Wong et al. [70] reported maximum biomass yields of 0.89, 1.49, 1.30, and 1.43 g/L for Dunaliella salina grown on sterilized modified Johnsons medium exposed to white LED light at 100, 200, 400, and 600 micro mol photos m−2 S−1 (wats), with equivalent daily biomass yields of 34.2, 57.3, 50.0, and 55.0 mg/L, respectively. The utilization of red and blue LED light positively enhances the growth yield of algae compared to white LED light. Red and blue LED light increase the biomass yield by a maximum of 1.95-fold (2.5 g/L) and 1.37-fold (2.03 g/L) for the two lights, respectively, which is equivalent to daily growth yield of 96.1 and 78.1 g/L.d. The best growth yields reported by [70] are comparable to the data of the current study.
The presence of more soluble nutrients in the UASB and SBR effluents enhance the algae growth and biomass yield compared to the screened wastewater with more complex particulate matter. The growth yield of the SBR effluent (third APBR) is better than the UASB effluent (second APBR); however, utilization of the UASB effluent could be environmentally more sustainable than the utilization of the SBR effluent, since application of the UASB is more sustainable and cost-effective for the treatment of PCP wastewater compared to the integrated DAF–SBR system.
The variation in the growth and biomass yield in the three APBRs could also be attributed to the variation in wastewater characteristics and the C/N/P ratio in the feed wastewater. There is great debate about the optimum C/N/P and N/P ratios to achieve the maximum growth rate of algae. AlMomani and Örmeci [64] reported the maximum growth rate of a mixed algal culture at a C/N/P ratio of 4.4:1:1.5, while Woertz et al. [65] reported that a C/N/P ratio of 50:8:1 is the optimum ratio. Other researchers have focused on the N/P ratio as the most important macronutrients. Li et al. [66] reported the N/P ratio of 16:1 as the optimum ratio for maximum algae growth, but Wang et al. (2010) [71] observed a significant growth rate for C. vulgaris in wastewater at the N/P ratio of 0.36:1 and a moderate growth rate at the N/P ratio of 53:1. In the current experiment, the COD/N/P ratio was 171:8.3:1.0, 20:11.5:1.0, and 21.6:5.4:1.0 in the three APBRs, respectively, with the maximum yield at the third APBR with a COD/N/P ratio of 21.6:5.4:1.0, followed by the second APBR with a COD/N/P ratio of 20:11.5:1.0. The previous data indicates that not only does the C/N/P ratio influence the biomass yield but turbidity and nutrients form, as well as the feed volume and growth period have their roles.

3.3.4. Protein Content and Amino Acids Profile

The quality of the algal biomass, with respect to the protein content as a percentage of dry biomass and amino acids, either as a percentage of dry biomass or as a percentage of total protein, is depicted in Table 4. The results indicated the highest protein content in the third APBR (35.65%) compared to the second (32.53%) and first APBR (30.64%). This could be attributed to the contribution of the TSS from the feed wastewater in the harvested biomass in the first and second APBR, where the feed wastewater contains a considerably higher concentration of TSS compared to the feed wastewater of the third APBR. The harvesting process, post-harvesting process, and protein extraction methods influence the protein content of the algal biomass [72,73]. Moreira et al. [73] reported a protein content of 27.1–32.3% in the dry matter of three different freshwater algae species. These values are comparable to the data of the current study. Algae growth in a growth cabin at 25 °C using 8:16 light/dark regime and different light intensities (5, 15, 25, 50, and 100 lux) indicated significant increment in the protein content by increasing the light intensity [74]. The recorded protein contents were 15.11%, 50.30%, 61.19%, 65.70%, and 72.17% at the light intensities of 5, 15, 25, 50, and 100 lux, respectively [74]. On the other hand, increasing the light intensity decreased the protein content from 47% to 35% for red light, while, for blue light, the protein content was stable at 50% at all color intensities [70]. Reviewing the chemical composition of 12 algal species indicated a wide range of protein content of the dry biomass of algae. Mostly, the range of the protein content was 34.2–63.9%; however, some species had content as low as 18.3% [75].
The protein content of the algal biomass in the current study is lower than the 55% reported by [76], which could be attributed to the continuous lightening, since a moderate or short light/dark cycle or photoperiod enhance higher protein content. Both nitrogen concentration, in relation to standing biomass density, and the N/P ratio influence the biochemical composition of algae biomass. Culture of Scenedesmus quadricauda on municipal sewage at 16:8 light/dark period and different light intensity, 18, 56, and 93 micromole m−2 S−1, provides algal biomass with variable protein content, recorded at 39.32% for the highest light intensity and at 15.52% for the lowest light intensity [67]. The upper limit of this range is comparable to the data of the current study.
Variation of the amino acids between the three APBRs was not constant, since the variation was more or less comparable to the variation in the protein content in all amino acids, except for tyrosine, alanine, and glutamate. The variation in glutamate, alanine, and tyrosine in the algal biomass of the 3 reactors is clearer and exceed the variation of the protein content. Protein was increased in the second and third reactor by 6.17% and 16.35%, respectively, compared to the first reactor, while alanine was increased by 28.94% and 45.53%, respectively, compared to the first APBR. Similarly, glutamate increased in the second and third reactor by 18.65% and 34.97%, respectively. As an exception, tyrosine declined in the second and third APBR compared to the result of the first reactor.
The dietary protein requirements of Nile Tilapia is 33.84%, with amino acid contents of 5.12%, 4.20%, 1.72%, 2.80%, 3.39%, 3.11%, 3.75%, 1.00%, 3.21%, and 5.54% for lysine, arginine, histidine, valine, leucine, isoleucine, threonine, tryptophan, methionine with cystine, and phenylalanine with tyrosine, respectively [77]. However, recently [77,78], the recommended requirements of arginine, histidine, isoleucine, leucine, lysine, methionine, methionine with cystine, phenylalanine, phenylalanine with tyrosine, threonine, tryptophan and valine are 1.48%, 0.67%, 1.05%, 1.18%, 1.6%, 0.79%, 0.97%, 1.05%, 1.82%, 1.22%, 0.31%, and 1.01%, respectively, of the diet of Nile Tilapia. The data in recent publications are comparable to the amino acid compositions of the algae biomass of the current experiment, especially for isoleucine, leucine, phenylalanine, threonine, and valine, which are higher in the algae biomass. However, the algae biomass is poor in tryptophan and cystine; both need to be supplemented from another source. The data indicated that the algal biomass is rich in glutamic and aspartic acids, which mimic their content in potato tubers that are also rich in both [79,80].

4. Conclusions

The APBR has the potential to treat PCP wastewater after screening and after the UASB reactor; however, pre-treatment in the UASB reactor has the potential to recover energy as methane instead of the uncontrolled release in the APBR. The quantity and quality of the algal biomass is better in the second APBR feed with anaerobically pre-treated PCP wastewater compared to the first APBR treated with raw PCP wastewater after screening, which is mostly attributed to the low concentration of TSS and turbidity in the UASB effluent. The APBR feed with secondary treated PCP wastewater after the DAF–SBR system provides the best final effluent quality and biomass yield quantitatively and qualitatively; however, treatment of PCP wastewater in an integrated UASB–APBR is more environmentally friendly and cost effective compared to the DAF–SBR system coupled with APBR. The final treated effluent from the APBR treating PCP wastewater with different quality is reusable.

Author Contributions

S.A.E.-S.: Funding Acquisition, Validation, Conceptualization, Writing—original draft preparation, Writing—review and editing, Data Curation and Submission. O.A.A.: Experimental Setup, Formal Analysis, Methodology and Writing—original draft preparation. D.-F.D.: Validation, Writing—review and editing. E.Y.T.: Conceptualization, Validation, Writing—review and editing. All authors have read and agreed to the published version of the manuscript.

Funding

This study was funded by the Science and Technology Development Fund (STDF) grant number 21000171 within the framework of the U.S.–Egypt Science and Technology Joint Fund Cycle 21. The project title is valorization of agro-industrial waste and wastewater for biofuel and fish production (project C21-171).

Data Availability Statement

Data will be made available upon request.

Acknowledgments

The authors would like to present their sincere thanks to the Science and Technology Development Fund (STDF) and National Academies, Sciences, Engineering and Medicine (NASEM). Also, the authors extend their sincere thanks to chemist Ahmed A. Nasr for supporting the sampling program during this study.

Conflicts of Interest

The authors declare that they have no known financial, personal, or professional conflicts that could have appeared to influence the work reported in this paper. All authors have approved the manuscript and agree with its submission. The research was conducted without any involvement of entities that could be perceived to have a vested interest in the outcomes of this study.

Abbreviations

APBRAlgae Photobioreactor
BG-11Blue-Green 11
BODBiological Oxygen Demand
CODChemical Oxygen Demand
dday
DAFDissolved Air Flotation
DMDry Matter
hHour
LLiter
NNitrogen
NTUNephelometric Turbidity Unit
nmNanometer
PPhosphorous
PCPPotato Chip Processing
PCPIPotato Chip Processing Industry
SBRSequential Batch Reactor
SScreening
TKNTotal Kjeldahl Nitrogen
TNTotal Nitrogen
TPTotal Phosphorous
TSSTotal Suspended Solids
UASBUp-Flow Anaerobic Sludge Blanket
VFAVolatile Fatty Acids

References

  1. Nagarajan, D.; Kusmayadi, A.; Yen, H.-W.; Dong, C.-D.; Lee, D.-J.; Chang, J.-S. Current advances in biological swine wastewater treatment using microalgae-based processes. Bioresour. Technol. 2019, 289, 121718. [Google Scholar] [CrossRef]
  2. Meneses-Jácome, A.; Diaz-Chavez, R.; Velásquez-Arredondo, H.I.; Cárdenas-Chávez, D.L.; Parra, R.; Ruiz-Colorado, A.A. Sustainable energy from agro-industrial wastewaters in Latin-America. Renew. Sustain. Energy Rev. 2016, 56, 1249–1262. [Google Scholar] [CrossRef]
  3. Yaashikaa, P.R.; Kumar, P.S.; Varjani, S. Valorization of agro-industrial wastes for biorefinery process and circular bioeconomy: A critical review. Bioresour. Technol. 2022, 343, 126126. [Google Scholar] [CrossRef]
  4. Qin, S.; Wang, K.; Gao, F.; Ge, B.; Cui, H.; Li, W. Biotechnologies for bulk production of microalgal biomass: From mass cultivation to dried biomass acquisition. Biotechnol. Biofuels Bioprod. 2023, 16, 131. [Google Scholar] [CrossRef]
  5. Gupta, S.; Pawar, S.B. An integrated approach for microalgae cultivation using raw and anaerobic digested wastewaters from food processing industry. Bioresour. Technol. 2018, 269, 571–576. [Google Scholar] [CrossRef]
  6. Qin, L.; Shu, Q.; Wang, Z.; Shang, C.; Zhu, S.; Xu, J.; Li, R.; Zhu, L.; Yuan, Z. Cultivation of Chlorella vulgaris in Dairy Wastewater Pretreated by UV Irradiation and Sodium Hypochlorite. Appl. Biochem. Biotechnol. 2014, 172, 1121–1130. [Google Scholar] [CrossRef]
  7. Lu, W.; Wang, Z.; Wang, X.; Yuan, Z. Cultivation of Chlorella sp. using raw dairy wastewater for nutrient removal and biodiesel production: Characteristics comparison of indoor bench-scale and outdoor pilot-scale cultures. Bioresour. Technol. 2015, 192, 382–388. [Google Scholar] [CrossRef]
  8. Gupta, S.; Pawar, S.B.; Pandey, R.A. Current practices and challenges in using microalgae for treatment of nutrient rich wastewater from agro-based industries. Sci. Total Environ. 2019, 687, 1107–1126. [Google Scholar] [CrossRef]
  9. Roostaei, J.; Zhang, Y.; Gopalakrishnan, K.; Ochocki, A.J. Mixotrophic Microalgae Biofilm: A Novel Algae Cultivation Strategy for Improved Productivity and Cost-efficiency of Biofuel Feedstock Production. Sci. Rep. 2018, 8, 12528. [Google Scholar] [CrossRef]
  10. Passos, F.; Uggetti, E.; Carrère, H.; Ferrer, I. Pretreatment of microalgae to improve biogas production: A review. Bioresour. Technol. 2014, 172, 403–412. [Google Scholar] [CrossRef]
  11. Xu, Z.; Wang, H.; Cheng, P.; Chang, T.; Chen, P.; Zhou, C.; Ruan, R. Development of integrated culture systems and harvesting methods for improved algal biomass productivity and wastewater resource recovery—A review. Sci. Total Environ. 2020, 746, 141039. [Google Scholar] [CrossRef]
  12. Ray, A.; Nayak, M.; Ghosh, A. A review on co-culturing of microalgae: A greener strategy towards sustainable biofuels production. Sci. Total Environ. 2022, 802, 149765. [Google Scholar] [CrossRef]
  13. Pandey, S.; Narayanan, I.; Vinayagam, R.; Selvaraj, R.; Varadavenkatesan, T.; Pugazhendhi, A. A review on the effect of blue green 11 medium and its constituents on microalgal growth and lipid production. J. Environ. Chem. Eng. 2023, 11, 109984. [Google Scholar] [CrossRef]
  14. Pleissner, D.; Smetana, S. Estimation of the economy of heterotrophic microalgae- and insect-based food waste utilization processes. Waste Manag. 2020, 102, 198–203. [Google Scholar] [CrossRef]
  15. Spiller, M.; Muys, M.; Papini, G.; Sakarika, M.; Buyle, M.; Vlaeminck, S.E. Environmental impact of microbial protein from potato wastewater as feed ingredient: Comparative consequential life cycle assessment of three production systems and soybean meal. Water Res. 2020, 171, 115406. [Google Scholar] [CrossRef]
  16. Kalra, R.; Gaur, S.; Goel, M. Microalgae bioremediation: A perspective towards wastewater treatment along with industrial carotenoids production. J. Water Process Eng. 2021, 40, 101794. [Google Scholar] [CrossRef]
  17. Castillo, T.; Ramos, D.; García-Beltrán, T.; Brito-Bazan, M.; Galindo, E. Mixotrophic cultivation of microalgae: An alternative to produce high-value metabolites. Biochem. Eng. J. 2021, 176, 108183. [Google Scholar] [CrossRef]
  18. Wang, Y.; Ho, S.H.; Cheng, C.L.; Guo, W.Q.; Nagarajan, D.; Ren, N.Q.; Lee, D.J.; Chang, J.S. Perspectives on the feasibility of using microalgae for industrial wastewater treatment. Bioresour. Technol. 2016, 222, 485–497. [Google Scholar] [CrossRef]
  19. Norsker, N.-H.; Barbosa, M.J.; Vermuë, M.H.; Wijffels, R.H. Microalgal production—A close look at the economics. Biotechnol. Adv. 2011, 29, 24–27. [Google Scholar] [CrossRef]
  20. Acién, F.G.; Gómez-Serrano, C.; Morales-Amaral, M.d.M.; Fernández-Sevilla, J.M.; Molina-Grima, E. Wastewater treatment using microalgae: How realistic a contribution might it be to significant urban wastewater treatment? Appl. Microbiol. Biotechnol. 2016, 100, 9013–9022. [Google Scholar] [CrossRef]
  21. Oswald, W.J. My sixty years in applied algology. J. Appl. Phycol. 2003, 15, 99–106. [Google Scholar] [CrossRef]
  22. Singh, S.P.; Singh, P. Effect of temperature and light on the growth of algae species: A review. Renew. Sustain. Energy Rev. 2015, 50, 431–444. [Google Scholar] [CrossRef]
  23. Mohsenpour, S.F.; Hennige, S.; Willoughby, N.; Adeloye, A.; Gutierrez, T. Integrating micro-algae into wastewater treatment: A review. Sci. Total Environ. 2021, 752, 142168. [Google Scholar] [CrossRef]
  24. Almomani, F.; Judd, S.; Bhosale, R.R.; Shurair, M.; Aljaml, K.; Khraisheh, M. Intergraded wastewater treatment and carbon bio-fixation from flue gases using Spirulina platensis and mixed algal culture. Process Saf. Environ. Prot. 2019, 124, 240–250. [Google Scholar] [CrossRef]
  25. Molazadeh, M.; Ahmadzadeh, H.; Pourianfar, H.R.; Lyon, S.; Rampelotto, P.H. The use of microalgae for coupling wastewater treatment with CO2 biofixation. Front. Bioeng. Biotechnol. 2019, 7, 42. [Google Scholar] [CrossRef]
  26. Maurya, R.; Zhu, X.; Valverde-Pérez, B.; Ravi Kiran, B.; General, T.; Sharma, S.; Kumar Sharma, A.; Thomsen, M.; Venkata Mohan, S.; Mohanty, K.; et al. Advances in microalgal research for valorization of industrial wastewater. Bioresour. Technol. 2022, 343, 126128. [Google Scholar] [CrossRef]
  27. Proietti Tocca, G.; Agostino, V.; Menin, B.; Tommasi, T.; Fino, D.; Di Caprio, F. Mixotrophic and heterotrophic growth of microalgae using acetate from different production processes. Rev. Environ. Sci. Bio/Technol. 2024, 23, 93–132. [Google Scholar] [CrossRef]
  28. Calderini, M.L.; Salmi, P.; Rigaud, C.; Peltomaa, E.; Taipale, S.J. Metabolic plasticity of mixotrophic algae is key for their persistence in browning environments. Mol. Ecol. 2022, 31, 4726–4738. [Google Scholar] [CrossRef]
  29. El Semary, N.; Abd El-Sattar, A.M.; Ahmed, E.Z.; Aldayel, M. Mixotrophy of algae: More algal biomass and more biofertilization for plants. Sustainability 2023, 15, 5815. [Google Scholar] [CrossRef]
  30. Hernández, D.; Riaño, B.; Coca, M.; García-González, M.C. Treatment of agro-industrial wastewater using microalgae–bacteria consortium combined with anaerobic digestion of the produced biomass. Bioresour. Technol. 2013, 135, 598–603. [Google Scholar] [CrossRef]
  31. Posadas, E.; Bochon, S.; Coca, M.; García-González, M.C.; García-Encina, P.A.; Muñoz, R. Microalgae-based agro-industrial wastewater treatment: A preliminary screening of biodegradability. J. Appl. Phycol. 2014, 26, 2335–2345. [Google Scholar] [CrossRef]
  32. Khoo, K.S.; Chia, W.Y.; Chew, K.W.; Show, P.L. Microalgal-bacterial consortia as future prospect in wastewater bioremediation, environmental management and bioenergy production. Indian J. Microbiol. 2021, 61, 262–269. [Google Scholar] [CrossRef]
  33. Wu, S.; Li, X.; Yu, J.; Wang, Q. Increased hydrogen production in co-culture of Chlamydomonas reinhardtii and Bradyrhizobium japonicum. Bioresour. Technol. 2012, 123, 184–188. [Google Scholar] [CrossRef]
  34. Do Nascimento, M.; Dublan, M.d.l.A.; Ortiz-Marquez, J.C.F.; Curatti, L. High lipid productivity of an Ankistrodesmus–Rhizobium artificial consortium. Bioresour. Technol. 2013, 146, 400–407. [Google Scholar] [CrossRef]
  35. Feng, S.; Liu, F.; Zhu, S.; Feng, P.; Wang, Z.; Yuan, Z.; Shang, C.; Chen, H. Performance of a microalgal-bacterial consortium system for the treatment of dairy-derived liquid digestate and biomass production. Bioresour. Technol. 2020, 306, 123101. [Google Scholar] [CrossRef]
  36. Zhou, X.; Jin, W.; Wang, Q.; Guo, S.; Tu, R.; Han, S.; Chen, C.; Xie, G.; Qu, F.; Wang, Q. Enhancement of productivity of Chlorella pyrenoidosa lipids for biodiesel using co-culture with ammonia-oxidizing bacteria in municipal wastewater. Renew. Energy 2020, 151, 598–603. [Google Scholar] [CrossRef]
  37. Wang, L.; Addy, M.; Cobb, K.; Ma, H.; Zhang, R.; Chen, D.; Chen, P.; Wang, H.; Liu, Y.; Ruan, R. Interaction of Chlorella vulgaris and bacteria when co-cultivated in anaerobically digested swine manure. Bioresour. Technol. 2021, 320, 124250. [Google Scholar] [CrossRef]
  38. Stephenson, A.L.; Kazamia, E.; Dennis, J.S.; Howe, C.J.; Scott, S.A.; Smith, A.G. Life-cycle assessment of potential algal biodiesel production in the United Kingdom: A comparison of raceways and air-lift tubular bioreactors. Energy Fuels 2010, 24, 4062–4077. [Google Scholar] [CrossRef]
  39. Jorquera, O.; Kiperstok, A.; Sales, E.A.; Embiruçu, M.; Ghirardi, M.L. Comparative energy life-cycle analyses of microalgal biomass production in open ponds and photobioreactors. Bioresour. Technol. 2010, 101, 1406–1413. [Google Scholar] [CrossRef]
  40. Kohlheb, N.; van Afferden, M.; Lara, E.; Arbib, Z.; Conthe, M.; Poitzsch, C.; Marquardt, T.; Becker, M.-Y. Assessing the life-cycle sustainability of algae and bacteria-based wastewater treatment systems: High-rate algae pond and sequencing batch reactor. J. Environ. Manag. 2020, 264, 110459. [Google Scholar] [CrossRef]
  41. Scott, S.A.; Davey, M.P.; Dennis, J.S.; Horst, I.; Howe, C.J.; Lea-Smith, D.J.; Smith, A.G. Biodiesel from algae: Challenges and prospects. Curr. Opin. Biotechnol. 2010, 21, 277–286. [Google Scholar] [CrossRef] [PubMed]
  42. Carvalho, A.P.; Meireles, L.A.; Malcata, F.X. Microalgal reactors: A review of enclosed system designs and performances. Biotechnol. Prog. 2006, 22, 1490–1506. [Google Scholar] [CrossRef]
  43. Kadir, W.N.A.; Lam, M.K.; Uemura, Y.; Lim, J.W.; Lee, K.T. Harvesting and pre-treatment of microalgae cultivated in wastewater for biodiesel production: A review. Energy Convers. Manag. 2018, 171, 1416–1429. [Google Scholar] [CrossRef]
  44. Barros, A.I.; Gonçalves, A.L.; Simões, M.; Pires, J.C.M. Harvesting techniques applied to microalgae: A review. Renew. Sustain. Energy Rev. 2015, 41, 1489–1500. [Google Scholar] [CrossRef]
  45. Ruiz-Marin, A.; Mendoza-Espinosa, L.G.; Stephenson, T. Growth and nutrient removal in free and immobilized green algae in batch and semi-continuous cultures treating real wastewater. Bioresour. Technol. 2010, 101, 58–64. [Google Scholar] [CrossRef]
  46. Patsialou, S.; Politou, E.; Nousis, S.; Liakopoulou, P.; Vayenas, D.V.; Tekerlekopoulou, A.G. Hybrid treatment of confectionery wastewater using a biofilter and a cyanobacteria-based system with simultaneous valuable metabolic compounds production. Algal Res. 2024, 79, 103483. [Google Scholar] [CrossRef]
  47. El-Shafai, S.A.; El-Gohary, F.A.; Naser, F.A.; Van der Steen, P.; Gijzen, H.J. Nitrogen recovery in an integrated system for wastewater treatment and tilapia production. Environmentalist 2007, 27, 287–302. [Google Scholar] [CrossRef]
  48. Al-Mallahi, J.; Ishii, K. Attempts to alleviate inhibitory factors of anaerobic digestate for enhanced microalgae cultivation and nutrients removal: A review. J. Environ. Manag. 2022, 304, 114266. [Google Scholar] [CrossRef]
  49. Mujtaba, G.; Lee, K. Treatment of real wastewater using co-culture of immobilized Chlorella vulgaris and suspended activated sludge. Water Res. 2017, 120, 174–184. [Google Scholar] [CrossRef] [PubMed]
  50. Michael, C.; del Ninno, M.; Gross, M.; Wen, Z. Use of wavelength-selective optical light filters for enhanced microalgal growth in different algal cultivation systems. Bioresour. Technol. 2015, 179, 473–482. [Google Scholar] [CrossRef]
  51. Jiang, L.-X.; Cui, Y.-W.; Mi, Y.-N.; Zhou, D.-X.; Li, M.-T.; Yang, R.-C. Recovery of volatile ethanol gas via microalgal-bacterial consortium: Ethanol-to-acetate conversion pathway boosts lipid production. J. Environ. Manag. 2025, 381, 125210. [Google Scholar] [CrossRef] [PubMed]
  52. Fischer, R.; Andersen, T.; Hillebrand, H.; Ptacnik, R. The exponentially fed batch culture as a reliable alternative to conventional chemostats. Limnol. Oceanogr. Methods 2014, 12, 432–440. [Google Scholar] [CrossRef]
  53. APHA. Standard Methods for the Examination of Water and Wastewater, 24th ed.; Lipps, W.C., Braun-Howland, E.B., Baxter, T.E., Eds.; American Public Health Association: Washington, DC, USA; American Water Works Association: Denver, CO, USA; Water Environment Federation: Alexandria, VA, USA, 2023. [Google Scholar]
  54. Xia, A.; Murphy, J.D. Microalgal Cultivation in Treating Liquid Digestate from Biogas Systems. Trends Biotechnol. 2016, 34, 264–275. [Google Scholar] [CrossRef]
  55. Cheng, P.; Cheng, J.J.; Cobb, K.; Zhou, C.; Zhou, N.; Addy, M.; Chen, P.; Yan, X.; Ruan, R. Tribonema sp. and Chlorella zofingiensis co-culture to treat swine wastewater diluted with fishery wastewater to facilitate harvest. Bioresour. Technol. 2020, 297, 122516. [Google Scholar] [CrossRef]
  56. Yan, F.; Jiang, H.; Ma, Y.; Cui, C.; Qin, H.; Liu, L.; Zang, S.; Xing, H.; Xu, Z.; Wu, H. Combined influences of light and nitrogen enrichment on the physiological performance of a golden tide alga (Sargassum horneri). J. Mar. Sci. Eng. 2022, 10, 1195. [Google Scholar] [CrossRef]
  57. Uggetti, E.; Sialve, B.; Latrille, E.; Steyer, J.-P. Anaerobic digestate as substrate for microalgae culture: The role of ammonium concentration on the microalgae productivity. Bioresour. Technol. 2014, 152, 437–443. [Google Scholar] [CrossRef]
  58. Park, J.; Jin, H.-F.; Lim, B.-R.; Park, K.-Y.; Lee, K. Ammonia removal from anaerobic digestion effluent of livestock waste using green alga Scenedesmus sp. Bioresour. Technol. 2010, 101, 8649–8657. [Google Scholar] [CrossRef]
  59. Praveen, P.; Guo, Y.; Kang, H.; Lefebvre, C.; Loh, K.-C. Enhancing microalgae cultivation in anaerobic digestate through nitrification. Chem. Eng. J. 2018, 354, 905–912. [Google Scholar] [CrossRef]
  60. Li, J.; Wang, L.; Lu, Q.; Zhou, W. Toxicity alleviation for microalgae cultivation by cationic starch addition and ammonia stripping and study on the cost assessment. RSC Adv. 2019, 9, 38235–38245. [Google Scholar] [CrossRef]
  61. Wang, Q.; Hyman, M.; Higgins, B.T. Factors impacting the effectiveness of biological pretreatment for the alleviation of algal growth inhibition on anaerobic digestate. Algal Res. 2021, 53, 102129. [Google Scholar] [CrossRef]
  62. Wang, Q.; Prasad, R.; Higgins, B.T. Aerobic bacterial pretreatment to overcome algal growth inhibition on high-strength anaerobic digestates. Water Res. 2019, 162, 420–426. [Google Scholar] [CrossRef]
  63. Zahid, W.M.; El-Shafai, S.A. Impacts of alum addition on the treatment efficiency of cloth-media MBR. Desalination 2012, 301, 53–58. [Google Scholar] [CrossRef]
  64. AlMomani, F.A.; Örmeci, B. Performance of Chlorella vulgaris, Neochloris oleoabundans, and mixed indigenous microalgae for treatment of primary effluent, secondary effluent and centrate. Ecol. Eng. 2016, 95, 280–289. [Google Scholar] [CrossRef]
  65. Woertz, I.; Feffer, A.; Lundquist, T.; Nelson, Y. Algae grown on dairy and municipal wastewater for simultaneous nutrient removal and lipid production for biofuel feedstock. J. Environ. Eng. 2009, 135, 1115–1122. [Google Scholar] [CrossRef]
  66. Li, Y.; Horsman, M.; Wang, B.; Wu, N.; Lan, C.Q. Effects of nitrogen sources on cell growth and lipid accumulation of green alga Neochloris oleoabundans. Appl. Microbiol. Biotechnol. 2008, 81, 629–636. [Google Scholar] [CrossRef]
  67. Venckus, P.; Lastauskienė, E. Influence of Light, Temperature, and Nutrient Availability on Growth and Biochemical Composition of Scenedesmus quadricauda Cultivated in Municipal Wastewater. Microorganisms 2026, 14, 183. [Google Scholar] [CrossRef]
  68. El-Shafai, S.A.; Zahid, W.M. Performance of aerated submerged biofilm reactor packed with local scoria for carbon and nitrogen removal from municipal wastewater. Bioresour. Technol. 2013, 143, 476–482. [Google Scholar] [CrossRef] [PubMed]
  69. Zahid, W.M.; El-Qelish, M.; El-Shafai, S.A. Effect of operating regime on the performance of biofilm reactor treating municipal wastewater. Int. J. Environ. Sci. Technol. 2023, 20, 8799–8812. [Google Scholar] [CrossRef]
  70. Sui, Y.; Harvey, P.J. Effect of light intensity and wavelength on biomass growth and protein and amino acid composition of Dunaliella salina. Foods 2021, 10, 1018. [Google Scholar] [CrossRef] [PubMed]
  71. Wang, L.; Min, M.; Li, Y.; Chen, P.; Chen, Y.; Liu, Y.; Wang, Y.; Ruan, R. Cultivation of green algae Chlorella sp. in different wastewaters from municipal wastewater treatment plant. Appl. Biochem. Biotechnol. 2010, 162, 1174–1186. [Google Scholar]
  72. Wong, N.M.Y.; Ting, M.; Kim, J.E. Exploring Microalgae Protein: Quantity, Quality and Sustainability Compared to Conventional Sources. Trends Food Sci. Technol. 2025, 163, 105188. [Google Scholar] [CrossRef]
  73. Moreira, C.; Ferreira-Santos, P.; Nunes, R.; Carvalho, B.; Pereira, H.; Teixeira, J.A.; Rocha, C.M.R. Influence of different processing techniques on microalgal protein extraction. Algal Res. 2025, 86, 103958. [Google Scholar] [CrossRef]
  74. Ali, S.; Ayal, A. The Effect of Different Levels of Lighting on the Content of Proteins and Amino Acids in the Lyngbya sp. Algae. Egypt. J. Aquat. Biol. Fish. 2024, 28, 113–121. [Google Scholar] [CrossRef]
  75. Ekpan, F.M.; Ori, M.O.; Samuel, H.S. Effects of environmental factors and nutrient availability on the biochemical composition of algae for biofuel production. Discov. Appl. Sci. 2025, 7, 1209. [Google Scholar] [CrossRef]
  76. Mayers, J.J.; Ekman Nilsson, A.; Svensson, E.; Albers, E. Integrating Microalgal Production with Industrial Outputs—Reducing Process Inputs and Quantifying the Benefits. Ind. Biotechnol. 2016, 12, 219–234. [Google Scholar] [CrossRef]
  77. Santiago, C.B.; Lovell, R.T. Amino Acid Requirements for Growth of Nile Tilapia. J. Nutr. 1988, 118, 1540–1546. [Google Scholar] [CrossRef]
  78. Furuya, W.M.; Cruz, T.P.d.; Gatlin, D.M., III. Amino acid requirements for nile tilapia: An update. Animals 2023, 13, 900. [Google Scholar] [CrossRef]
  79. Choi, S.-H.; Kozukue, N.; Kim, H.-J.; Friedman, M. Analysis of protein amino acids, non-protein amino acids and metabolites, dietary protein, glucose, fructose, sucrose, phenolic, and flavonoid content and antioxidative properties of potato tubers, peels, and cortexes (pulps). J. Food Compos. Anal. 2016, 50, 77–87. [Google Scholar] [CrossRef]
  80. Pęksa, A.; Miedzianka, J.; Nemś, A. Amino acid composition of flesh-coloured potatoes as affected by storage conditions. Food Chem. 2018, 266, 335–342. [Google Scholar] [CrossRef] [PubMed]
Figure 1. Photo of the APBR during the first (A) and second (B) experiment.
Processes 14 01723 g001
Figure 2. Optical density (660 nm) of the algae suspension in the APBRs feed potato processing wastewater during the first experiment ((A) after screening, (B) after UASB, and (C) after SBR).
Processes 14 01723 g002aProcesses 14 01723 g002b
Figure 3. Performance of the APBRs in COD removal; % removal (A) and residual values (B).
Processes 14 01723 g003
Figure 4. Residual turbidity and its percentage of removal in the APBRs.
Processes 14 01723 g004
Figure 5. Residual concentration of TSS and its percentage of removal in the APBRs.
Processes 14 01723 g005
Figure 6. Residual concentration of TKN (A), TKN percentage removal (B), and residual ammonia concentration (C).
Processes 14 01723 g006
Figure 7. Nitrite and nitrate concentration in the APBRs.
Processes 14 01723 g007
Figure 8. Residual P and its percentage of removal in the APBRs.
Processes 14 01723 g008
Figure 9. Daily dry biomass yield (A) and average dry biomass yield (B) during the second experiment.
Processes 14 01723 g009
Table 1. Feed volumes of different PCP wastewater in 1-L lab-scale APBRs.
Source of PCP WastewaterS EffluentUASB EffluentSBR Effluent
Feed volume, mL150300500150300500400600800
Pre-enriched algal culture, mL200200200200200200200200200
Demi-water, mL6505003006505003004002000
Effective reactor volume, mL100010001000100010001000100010001000
Table 2. Characteristics of raw wastewaters; S effluent, UASB effluent, and SBR effluent.
ParameterUnitS EffluentUASB EffluentSBR Effluent
pH-5.3–6.38.0–8.47.6–8.3
TurbidityNTU743 ± 96201 ± 23172 ± 18
TSSmg/L2424 ± 215225 ± 36180 ± 18
CODmg O2/L6189 ± 1113544 ± 178292 ± 31
BODmg O2/L4300 ± 841272 ± 77158 ± 16
Ammonia. Nmg N/L102 ± 21231 ± 1813.5 ± 3.1
TKNmg N/L302 ± 53313 ± 1272.5 ± 5.0
NO3mg N/LNot detectedNot detected2.5 ± 1.2
Total Pmg P/L36.2 ± 5.527.1 ± 4.413.5 ± 1.2
Table 3. Summary of the nitrogen mass balance at the end of the experiment.
Item1st APBR2nd APBR3rd APBR
Number of batches141821
Feed volume, ml/L150150500
Number of days154144126
TN loading rate, mg/L (1)634845852
Average yield, mg/L.d65.2569.91100.62
Total yield, mg/L10,04910,06712,678
Protein content, %30.6432.5335.65
N recovery, mg/L492.6524.0723.2
N recovery, %77.762.084.9
Residual nitrogen, mg/L (2)40.8727.7226.42
Residual nitrogen, %6.43.33.1
Actual % N removal (3) *93.696.796.9
None-algae % N removal15.934.712.0
* Actual percentage of N removal (3) = [1 − 2]/1 × 100.
Table 4. Percentages of total protein and amino acids in the algal biomass.
Amino Acid1st APBR2nd APBR3rd APBR
% of DM *% of Protein% of DM *% of Protein% of DM *% of Protein
Aspartate 3.2710.663.5010.763.6910.36
Glutamate3.8612.594.5814.085.2114.61
Serine1.494.871.665.101.744.88
Histidine0.591.910.551.690.611.72
Glycine2.086.792.226.842.346.56
Threonine1.856.031.735.301.865.21
Arginine1.645.352.337.152.677.50
Alanine2.357.673.039.313.429.60
Tyrosine2.177.101.263.861.534.28
Valine1.785.821.875.742.156.02
Methionine0.662.150.541.660.491.37
Phenylalanine1.775.781.675.141.795.02
Isoleucine1.535.011.584.861.704.77
Leucine2.738.902.928.993.148.82
Lysine1.575.141.574.831.835.12
Proline1.304.241.544.721.494.17
Total Protein30.64100.0032.53100.0035.65100.00
* DM: dry matter.
Disclaimer/Publisher’s Note: The statements, opinions and data contained in all publications are solely those of the individual author(s) and contributor(s) and not of MDPI and/or the editor(s). MDPI and/or the editor(s) disclaim responsibility for any injury to people or property resulting from any ideas, methods, instructions or products referred to in the content.