Article

Stability of Individual Phenolic Compounds and Antioxidant Activity During Storage of a Syrah Grape Seed Extract


1
Department Biotechnology, Burgas State University “Prof. Dr. A. Zlatarov”, 8010 Burgas, Bulgaria
2
College of Sliven, Technical University of Sofia, 8800 Sliven, Bulgaria
*
Author to whom correspondence should be addressed.
Processes 2026, 14(11), 1721; https://doi.org/10.3390/pr14111721
Submission received: 30 April 2026 / Revised: 20 May 2026 / Accepted: 22 May 2026 / Published: 26 May 2026

Abstract

The valorization of winery by-products is a sustainable strategy for receiving valuable bioactive compounds. The aim of this study was to obtain Syrah grape seed extract and investigate the stability of extract phenolic compounds and antioxidant capacity. Separated grape seeds from grape pomace were dried under two different conditions: 23 °C for 10 days and 40 °C for 24 h. Polyphenols were extracted from the dried seeds using 70% aqueous ethanol under magnetic stirring at 600 rpm for 3 h. The yield, color, nutrition value, and mineral contents of the extract were determined. The obtained extracts from the seeds dried at different temperatures were concentrated using a vacuum evaporator. The concentrate was subsequently divided into three forms: liquid, lyophilized, and dried at 40 °C. The individual phenolic components of the lyophilized grape seed extract were determined by HPLC. All extracts were stored at 4 °C and 23 °C for 10 months. The effect of the grape seed drying conditions, extract forms, storage temperature, and time on the total phenolic content, total flavonoids, procyanidins, and antioxidant capacity of the extracts was investigated. Changes in these parameters were evaluated at 0, 3, 6, and 10 months of storage. Degradation kinetics on the basis of antioxidant activity during extracts storage were calculated. Additionally, the individual phenolic composition of liquid and lyophilized Syrah grape seed extracts stored for 10 months was determined by HPLC. The degradation degree of the individual compounds in the extracts was calculated.

1. Introduction

The valorization of winemaking by-products is a very good prospect for obtaining valuable biologically active substances with high antioxidant activity. For this purpose, a very suitable source is grape pomace [1,2,3,4], which consists of skins, seeds, and the fragments of stalks [5,6]. These components have different polyphenol contents: grape seeds (70%), skins (20%), and stalks (10%) [7]. The polyphenolic composition of seeds in different grape varieties varies; however, mainly, phenolic acids (gallic, hydroxybenzoic, syringic, caffeic acids), flavonoids (+) catechin, (−) epicatechin, (−) epicatechin gallate, (−) epigallocatechin), procyanidins (B1, B2, B3, C1), etc., predominate [8,9]. These compounds have valuable antioxidant, anti-inflammatory, antiproliferative, antilipid, and antimicrobial properties [10,11,12]. In recent years, grape seeds have been established as a cost-effective key raw material for the production of extracts used as dietary supplements and food additives for functional foods [13,14]. These extracts have, in addition to a high content of polyphenols, good nutritional value, mainly due to carbohydrates, proteins, and lipids, as well as a high content of macro- and microminerals [15]. Polyphenols intended for food supplements are extracted from the seed meal with aqueous solutions of ethanol of varying concentrations [16], since these are safe for human health when using convective and non-convective methods [17,18,19,20].
A very important issue in obtaining and using the extracts is their stability and the preservation of their antioxidant potential for a longer period of time. Polyphenols are very sensitive to temperature, light, and moisture, and easily degrade [21]. The reason for this is that they contain unsaturated bonds and reactive groups, such as hydroxyl and carboxyl, and are easily oxidized [22]. In this regard, it is important to select the appropriate conditions for drying grape seeds and storing the extracts. Many authors have studied the influence of temperature and the drying time of seeds, as well as the influence of light and moisture on the degradation of polyphenols and their antioxidant activity [22,23,24]. The cited data are diverse and require additional research. These factors are important, since the collection of grape seeds is seasonal and a significant number of seeds accumulates and cannot be quickly processed. Sokac et al. [23] dried grape seeds at 70 °C for 7 h and at 31.99 °C (sun-dried) for 26 h. They indicated that, at a temperature of 70 °C, the content of tannins was reduced by 56.32% and the percentage of tartaric acid increased by 97.98%, while at 31.99 °C, probably due to the influence of light and the greater residual moisture, the reduction in tannins was greater than 95.50% and tartaric acid was increased by 95.94%. Guaita et al. [25] studied the effect of high-temperature treatments (160–200 °C) for a short duration on the polyphenolic composition of grape pomace. They studied this effect also separately for skins and seeds. The high-temperature treatments caused the enrichment of the polyphenolic content of the skins and the contemporary decrease in that of the seeds. The moisture, light, and matrix components also affect the degradation of polyphenols [26]. It is obvious that the drying of the seeds is a key moment in the preparation of extracts. This process should ensure a low degree of degradation of polyphenols and be economically viable.
Another critical factor influencing the quality and applicability of grape seed extracts is the storage condition of the final products. Although numerous studies have investigated the thermal stability of grape seed extracts [21,25], limited information is available regarding their long-term storage stability. Most published studies are focused primarily on the stability of grape pomace extracts [27,28] rather than grape seed extracts specifically. The available literature presents inconsistent findings, with a predominance of studies addressing grape pomace extract storage. For instance, Castillo et al. [29] evaluated the stability of wine marc extracts stored at −20, 4, and 20 °C for 2 months. The authors reported the lowest reduction in DPPH radical scavenging activity at 4 °C (13.7%), compared with losses observed at −20 °C (14.2%) and 20 °C (15.8%). Similarly, Ferreyra et al. [30] investigated the stability of phenolic compounds in grape cane extracts stored at 5, 25, and 40 °C for 3 months. The lowest degree of polyphenol degradation was observed at 5 °C, whereas the highest degradation occurred at 40 °C. Particular attention was also given to the stability of individual phenolic compounds during storage. According to the reported results, epicatechin, catechin, and procyanidins were identified as the most unstable constituents, whereas quercetin-3-galactoside exhibited relatively high stability [27]. In addition, an increase in gallic acid concentrations was observed, likely as a consequence of the degradation and transformation of other phenolic compounds.
Limited attention has been given in the scientific literature to the long-term stability of grape seed extracts. It is well established that the extent of phenolic degradation depends on the concentration and composition of individual compounds within the extract, which are typically present at higher levels in grape seeds compared to other winemaking by-products. Furthermore, most existing studies of extracts from grape pomace have evaluated their stability over relatively short storage periods, generally not exceeding 3–4 months [27,31], while data regarding longer-term storage remain scarce. The preservation of antioxidant activity over extended periods is a key quality parameter for food supplements and, therefore, requires further investigation.
The present study aimed to develop an extract from the seeds obtained as a by-product of red Syrah grape vinification and to evaluate: (1) its polyphenolic, nutritional, and mineral composition; (2) the effects of long-term storage conditions over a period of 10 months; and (3) the degradation kinetics of polyphenolic compounds during storage. In addition, the study sought to identify the most suitable storage conditions of grape seed extract and the possibility for its application as a dietetic supplement and food additive.

2. Materials and Methods

2.1. Materials

The samples used in this study were grape seeds separated from grape pomace of red grape Vitis vinifera L. cv. Syrah, obtained from vinery Pomorie.

2.2. Chemicals

The chemicals used for the experiment were ethanol 99.9% v/v (Valerus, Sofia, Bulgaria), methanol, gallic acid, 2N Folin–Ciocalteu reagent, sodium carbonate, sodium nitrate, aluminum trichloride, sodium hydroxide, hydrogen chloride, Vanillin, 2,2-diphenyl-1-picrylhydrazyl, 2,2′-azino-bis (3-ethylbenzothiazoline-6-sulfonic acid, potassium persulfate, petroleum ether, sulfuric acid, acetone, hydrogen peroxide, all purchased from Sigma-Aldrich Co., Steinheim am Albuch, Germany. The reagents for HPLC analysis, as phosphoric acid, acetonitrile, (+)-catechin, (−)-epicatechin, (−)-epigallocatechin gallate, procyanidin B1, procyanidin B2, procyanidin B3, procyanidin C1 were purchased by Sigma-Aldrich Co., Steinheim am Albuch, Germany which were HPLC-grade. Deionized water purified by ELGA’s water purification systems (Lane end Business Park Lane End, High Wycombe HP14 3BY, UK) was used throughout the experiments.

2.3. Preparation of Grape Seed Extract

Grape seeds were separated from the pomace of the grape cultivar Syrah. Then they were washed with water and dried in oven (Heraeus acutherm, Hanau, Germany) at 40 °C for 24 h and at room temperature (23 °C) for 10 days. The different dried grape seeds were further processed separately. They were ground in a grinder. The grape seeds were milled in a coffee grinder (MKM, 7000 Bosh, Germany) to obtain particles size smaller than 0.5 mm.
To 10 g of grape seed powder, 100 mL of 70% aqueous ethanol was added, and the mixture was stirred using a magnetic stirrer (MMS-3000, Boeco, Hamburg, Germany) at a constant stirring rate of 500 rpm, at room temperature, for 3 h. The mixture was centrifuged at 6000 rpm for 10 min by centrifuge (CompactStar CS 4, VWWR, Equipnet, Boston, MA, USA). The supernatant was then separated and concentrated to 5 mL in a vacuum evaporator (Rotavapor R-215, Buchi, Flawil, Switzerland), at 45–50 °C and 100–175 hPa vacuum pressure. The concentrated extract was divided in three parts. The first part remained in liquid form, the second part was dried at 40 °C; the third part was lyophilized at temperature between −40 °C and −50 °C, then up to the temperature of 0 °C and a pressure of 103 torr, after which positive temperatures up to 40 °C were applied, with pressure values of 102 torr, for a duration of 4–8 h (VirTis, Warminster, PA, USA). All the obtained samples were stored in a dark place, at room temperature (23 °C) and in a refrigerator at 4 °C.

2.4. Determination of Grape Seed Extract Color

The color characteristics of the grape seed extract (GSE) was determined using a CR-410 Chroma Meter (Minolta Co., Osaka, Japan) according to the method described by Hassan et al. [32]. A total of 5 mL of the extract concentrate were utilized for the study. The parameters of measurement were 13 mm port size, illuminant D65, and a 10° standard observer. The X-Rite’s white and black standards were used to calibrate the chroma meter. Color results were determined in the CIE L* a* b* scale. The L* value represents lightness; a* and b* values represent redness and yellowness, respectively. These three parameters (lightness (L*), redness (a*) and yellowness (b*)) were determined for all obtained extracts by using three parallel samples from each of them.

2.5. Determination of Total Phenolic Content of GSEs

The total phenolic content was determined using the Folin–Ciocalteu assay [33]. The liquid extract (10 μL with concentration 200 µg/mL) was diluted with 990 μL of ethanol and the mixture was vortexed. Then, it was dried at 40 °C and the lyophilized extracts (0.002 g) were dissolved in 300 μL of water and 700 μL of ethanol. These were vortexed and centrifuged at 13,000 rpm for 15 min. Then, 50 µL of the sample was mixed with 50 µL 2N Folin–Ciocalteu reagent and 300 µL 75 g/L sodium carbonate. Then, the mixture was incubated for 30 min in a dark place. Then, deionized water (2.6 mL) was added to the mixture and the absorbance of the solution was measured at 725 nm on a 6900 UV–Vis JENWAY spectrophotometer (Colmworth, UK). All the samples were tested in triplicate. The standard curve was obtained based on gallic acid with a concentration of 50–450 µg/mL in ethanol. TPC was calculated as milligram equivalent gallic acid per gram of dried matter (mg GAE/g dw).

2.6. Determination of Flavonoids of GSEs

Total flavonoids were determined using an aluminum complexation assay [34]. The liquid extracts (10 μL with concentration 800 µg/mL) were diluted with 990 μL of ethanol and the mixture was vortexed. The dry and lyophilized extracts (0.002 g) were dissolved in 300 μL of water and 700 μL of ethanol. They were vortexed, then centrifuged at 13,000 rpm for 15 min. Then, 100 µL of the sample was mixed with 1 mL deionized water and 75 µL of 5% sodium nitrate and the mixture was incubated for 5 min. Then, 150 µL of 2% aluminum trichloride was added and the sample was incubated for 6 min. After that, 4 mL of water and 500 µL 1N sodium hydroxide were added. The mixture was incubated for 10 min in a dark place. The absorbance of the solution was measured at 510 nm on a 6900 UV–Vis JENWAY spectrophotometer (Colmworth, UK). All the samples were tested in triplicate. The standard curve was obtained on the basis of a methanol solution of quercetin with a concentration of 0.1–1 mg/mL. Total flavonoids were expressed as milligram-equivalent quercetin per gram of dry weight matter, mg QE/g dw.

2.7. Determination of Procyanidins of GSEs

Procyanidins were estimated according to the procedure described by Brezoiu et al. [35]. An extract solution with a concentration of 500 µg/mL in methanol was prepared. A calibration curve was obtained using the absorption of catechin solutions with concentrations ranging from 20 to 500 µg/mL. Different mixtures were prepared and incubated for 20 min at 30 °C. Then, their absorption was measured at 500 nm using the JENWAY 6900 spectrophotometer (Colmworth, UK). All the samples were tested in triplicate.
The mixtures were as follows:
A0 = [1 mL methanol + 2.5 mL methanol + 2.5 mL 9 mol/L HCl];
Ab = [1 mL methanol + 2.5 mL 1% vanillin solution + 2.5 mL 9 mol/L HCl];
Ac = [1 mL CT (20–500 µg/mL) or GSE + 2.5 mL methanol + 2.5 mL 9 mol/L HCl];
As = [1 mL CT (20–500 µg/mL) or GSE + 2.5 mL 1% vanillin + 2.5 mL 9 mol/L HCl].
Absorption was calculated for each standard and sample solution, as follows (1):
A = (As − Ab) − (Ac − A0)
The total procyanidin content in each test solution was calculated from the calibration curve and expressed as mg (+)-catechin per gram of dried matter (mg CE/g dw).

2.8. Determination of Antioxidant Capacity by ABTS Assay

The ABTS assay was carried out as described by Sofi et al. [36]. The ABTS radical was prepared by mixing equimolar amounts of 2.6 mM of potassium persulfate and 7.4 mM ABTS, followed by 16 h incubation in a dark place, at room temperature. Before analysis, 1 mL ABTS+● solution was diluted with 60 mL methanol to achieve absorbance of 1.1 ± 0.02 at 734 nm. Samples (100 µL of 1 mg/mL in methanol) were left to react with 2 mL of ABTS+● solution for 10 min, in a dark place. Afterwards, the solution absorbance was measured at 734 nm by UV–Vis JENWAY 6900 spectrophotometer (Colmworth, UK). All the samples were tested in triplicate. The formula used for the calculation is as follows (2):
% inhibition of ABTS* activity = (A − B))/A × 100
A—the absorbance of the control; B—the absorbance of the sample.

2.9. Determination of Antioxidant Capacity by DPPH Assay

Determination of the DPPH radical scavenging activity was performed as described by Sofi et al. [36]. The sample (100 µL of 1 mg/mL in methanol) was mixed with 2 mL of daily prepared DPPH solution (24 mg in 100 mL methanol) for 20 min at room temperature. The decrease in absorbance was read spectrophotometrically at 515 nm by UV–Vis JENWAY 6900 spectrophotometer (Colmworth, UK). All the samples were tested in triplicate. The formula used for the calculation is (3):
% inhibition of DPPH* activity = (A − B))/A × 100
A—the absorbance of the control; B—the absorbance of the sample

2.10. Degradation Kinetics of GSE Polyphenols During Storage Period

The degradation kinetics were calculated from the determined antioxidant capacity values of different grape seed extracts during the storage period [37]. The reaction rate constants (k) and half-life time (t1/2) were calculated from the first-order kinetics using the following Equations (4) and (5):
ln (Ct/Co) = kt
t1/2 = ln (2)/k
where Co is the initial antioxidant capacity and Ct is the antioxidant capacity at reaction time (t).
The quotient indicator (Q10) was calculated, expressing the temperature dependence of the reaction rate constants according to Equation (6):
Q10 = (k2/k1) (10/T2−T1)
where k1 and k2 are the reaction rate constants, T1 and T2 are storage temperatures.
D represents the time that it takes for the compound or quality criterion to lose 90% of its quality and is calculated for the first-order kinetics, as written below (Equation (7)):
D = 2.303/k
where k (month−1) is the reaction rate constant.

2.11. RP-HPLC Analyses of Grape Seed Extracts

The RP-HPLC analyses were performed with Dionex UltiMate 3000 UHPLC, equipped with a diode array detector (Thermo Fischer Scientific, Waltham, MA, USA). The column was Agilent Zorbax Stable bond C18 (250 × 4.6 mm ID, 5 μm) with guard column Zorbax Stable bond C18 (12.5 × 4.6 mm ID, 5 μm). The gradient mode was made by two eluents. Eluent A contained 0.1% phosphoric acid in water, and eluent B contained acetonitrile (Table 1). The injection volume was 10 μL and the flow rate was 0.7 mL/min. The column oven was set on 25 °C. The detector was a diode array detector at 280 nm. The grape seed extracts were solved in a 90/10 ratio of eluent A/eluent B at the concentration 10 mg/mL. All samples were filtered by 0.45 μm filter units.
The obtained peaks in the chromatograms were proved by a standard solution of the polyphenolic compounds: gallic acid, (+)-catechin, (−)-epicatechin, (−)-epigallocatechin gallate, procyanidin B1, procyanidin B2, procyanidin B3, and procyanidin C1. The standards were used to obtain the trendline and derivate of equations and R2.

2.12. Determination of Nutritional Value and Mineral Profile of Syrah Grape Seed Extract

The ash, crude protein, crude fat, total carbohydrate and total dietary fiber contents of grape seed extract were determined using standard AOAC methods. Moisture was determined by drying at 100 °C to constant weight according to AOAC method 934.01 [38]. Ash content was determined according to AOAC 923.03 [38] using a Barnstead Thermolyne 30,400 muffle furnace (Texas City, TX, USA). The amount of protein in the sample was determined using a modified Kjeldahl method (AOAC 976.05) [38], which involved digestion of the sample with sulfuric acid, followed by distillation of the ammonia and titration of the residual acid. A factor of 5.6 was used to convert the nitrogen content into protein [39]. Fat content was determined using modified AOAC method 945.16 [38], using petroleum ether as a solvent and a Soxtec TM 2050 apparatus (FOSS, Hoganas, Sweden). Total dietary fiber content was determined by the enzymatic-gravimetric method AOAC 993.19 [38], involving gelatinization of the samples with thermostable α-amylase, followed by enzymatic digestion with protease and amyloglucosidase to remove proteins and starch. The solution was then treated with ethanol to precipitate the soluble fiber; the resulting residue was filtered, washed with ethanol and acetone, dried, and weighed. All analyses were performed in triplicate. Total carbohydrate content was calculated using Equation (8):
% carbohydrates = 100 − (% moisture + % protein + % ash + % fat + % fiber)
The mineral content of the grape seed extract was determined by pre-grinding the sample and sieving it through a sieve with a pore size of φ < 500 µm. Then, a quantity of 0.25 g was weighed with an analytical accuracy of 0.0001 g and transferred to a Teflon container. The containers were left with the lids open for a period of 24 h. The next day, 2 mL of hydrogen peroxide was added to each sample, and the containers were hermetically sealed. Two blank samples were prepared and subjected to the same procedures as the analyzed sample. Mineralization was performed in a PreeKem microwave system, model M6, equipped with an H16 rotor. The decomposition process proceeded according to a preset five-stage program: (1) heating to 100 °C at 300 W for 5 min, followed by maintaining the temperature for another 5 min; (2) heating to 100 °C at 350 W for 8 min and holding for 3 min; (3) reaching 120 °C at 650 W with holding for 5 min; (4) holding at 120 °C and 900 W for 3 min; and (5) heating to 180 °C at 1350 W with a holding time of 3 min. After completion of the mineralization, the vessels were cooled for about 10 min, after which they were carefully opened and the lids were washed with ultrapure water. The solutions were filtered through a blue-band filter and quantitatively transferred into 100 mL volumetric flasks, which were made up to the mark with ultrapure water. The mineral composition of the extracts was determined by ICP–MS analysis with a Thermo Scientific iCAP Q instrument (GmbH, Bremen, Germany).

2.13. Statistical Analysis

For the statistical analysis of the results, a one-way analysis of variance (ANOVA) was performed using SPSS (SPSS 19.0, Chicago, IL, USA) for all variables considered in the study. The least squares mean (LSM) values were separated using Fisher’s LSD test. All statistical tests of LSM were performed for a significance level of p < 0.05.

3. Results and Discussion

3.1. The Influence of Seed Drying and Extract Storage Conditions on the Extract Polyphenolic Content During 10 Months

Grape seed extracts were obtained and their yield and color characteristics were determined. Then, the combined effect of grape seed drying conditions and extract storage on the extract polyphenolic indicators was studied. The research was conducted using seeds from red grapes of the Syrah variety. Syrah is a dark-skinned grape variety originating from France’s Rhône Valley. The seeds were separated from the pomace of vinified Syrah grapes obtained from the Pomorie vineyard. The separated seeds were washed thoroughly with water and dried at room temperature 23 °C, in the dark, for 10 days and at a temperature of 40 °C for 24 h. These conditions were selected because some authors [29,30] showed that, at temperatures above 60 °C, the degradation of polyphenols is greater. In addition, they are more economically efficient. The residual moisture in both types of dried seeds was measured. A small difference in residual moisture was found between seeds dried at 40 °C (5.43%) and those dried at room temperature (5.65%). Then, the polyphenols from both types of dried seeds were extracted to monitor the degree of biodegradation of the polyphenols due to the two types of drying. The extraction was carried out using a mixture of ethanol and water in a ratio of 70:30. It lasted for 3 h, while stirring with a magnetic stirrer, after which the supernatant was separated by centrifugation. The resulting supernatant was concentrated using a vacuum evaporator and an aqueous concentrate (0.2 g/5 mL) was obtained. The yield of the extracts obtained from seeds dried at the two different temperatures was determined and their color characteristics were examined (Table 2).
It was found that the yield of the extract obtained from seeds dried at 40 °C was slightly higher than that from seeds dried at 23 °C. The obtained yield results are comparable to the results presented by other authors [40,41]. Both extracts are brown red in color. The values for transparency and intensity of the red color of the extract obtained from seeds dried at the higher temperature are slightly lower than those of the extract obtained from seeds dried at 23 °C. For the yellow color component, the result is the opposite; it is higher for the extract obtained from seeds dried at 40 °C. The probable reason for the difference in color characteristics may be due to the higher temperature for drying of the seeds (40 °C), at which degradation processes take place, albeit to a low degree, leading to a slight reduction in the more unstable flavonoids, (−)-epicatechin, (+) catechin, and procyanidins. Similar degradation changes have been noted by other authors, although the temperature applied (40 °C) for drying the seeds was not very high [27,30].
Each concentrated extract of grape seeds dried at room temperature and at 40 °C was divided into three parts. The first part was preserved in liquid form without further processing. The second part was subjected to additional drying at 40 °C for 24 h, and the third part was lyophilized. These stages are schematically presented in Figure 1.
Each of the three forms of the extract was stored at 4 °C in a refrigerator and at 23 °C in the dark for 10 months, with analyses of the polyphenol content being performed at 0, 3, 6, and 10 months.
Important characteristics for assessing the efficacy of grape seed extracts are the polyphenolic content (TPC), total flavonoids (TF), and procyanidins (PC). The initial values (0 month) of TPC, TF and PC of liquid, dried at 40 °C, and lyophilized GSEs were determined. Extracts prepared from dried seeds at room temperature (23 °C) and at 40 °C were used. First, an assessment was made of the influence of the seed drying conditions on the polyphenolic indicators of the three forms of the extracts. For the dried seed extracts at 23 °C, the following values were obtained: TPC—242.34 mg GAE/g, TF—170.98 mg QE/g, and PC—138.15 mg CE/g. For the liquid extracts, the results are slightly lower by about 1–2%, respectively, TPC—236.57 mg GAE/g, TF—163.30 mg QE/g, and PC—128.34 mg CE/g. The same analyses were performed on the extracts obtained from seeds dried at 40 °C (Table 3, 0 month).
The comparison of the obtained data shows that all values of the studied polyphenolic parameters are slightly higher when the seeds are dried at 40 °C compared to those obtained at 23 °C. The probable reason for this is the fact that the residual moisture in the samples dried at 40 °C is slightly lower. Nevertheless, the results of the samples dried both ways are very close. When storing the samples over time, this trend persists; for this reason, only the polyphenolic indicators of the samples obtained from seeds dried at 40 °C are presented in Table 3. Furthermore, this type of drying is preferred because the drying time is 10 times shorter than drying at 23 °C.
Second, the influence of the three forms of the extract on the values of the polyphenolic parameters was investigated. Table 3 shows that all polyphenolic indices of the lyophilized and dried-at-40 °C samples are slightly higher than those of the liquid samples. The probable reason for this is that the liquid concentrate is an aqueous solution, which slightly reduces the polyphenolic indicators. The negative influence of residual moisture in the extracts has been discussed in a number of publications [27,42].
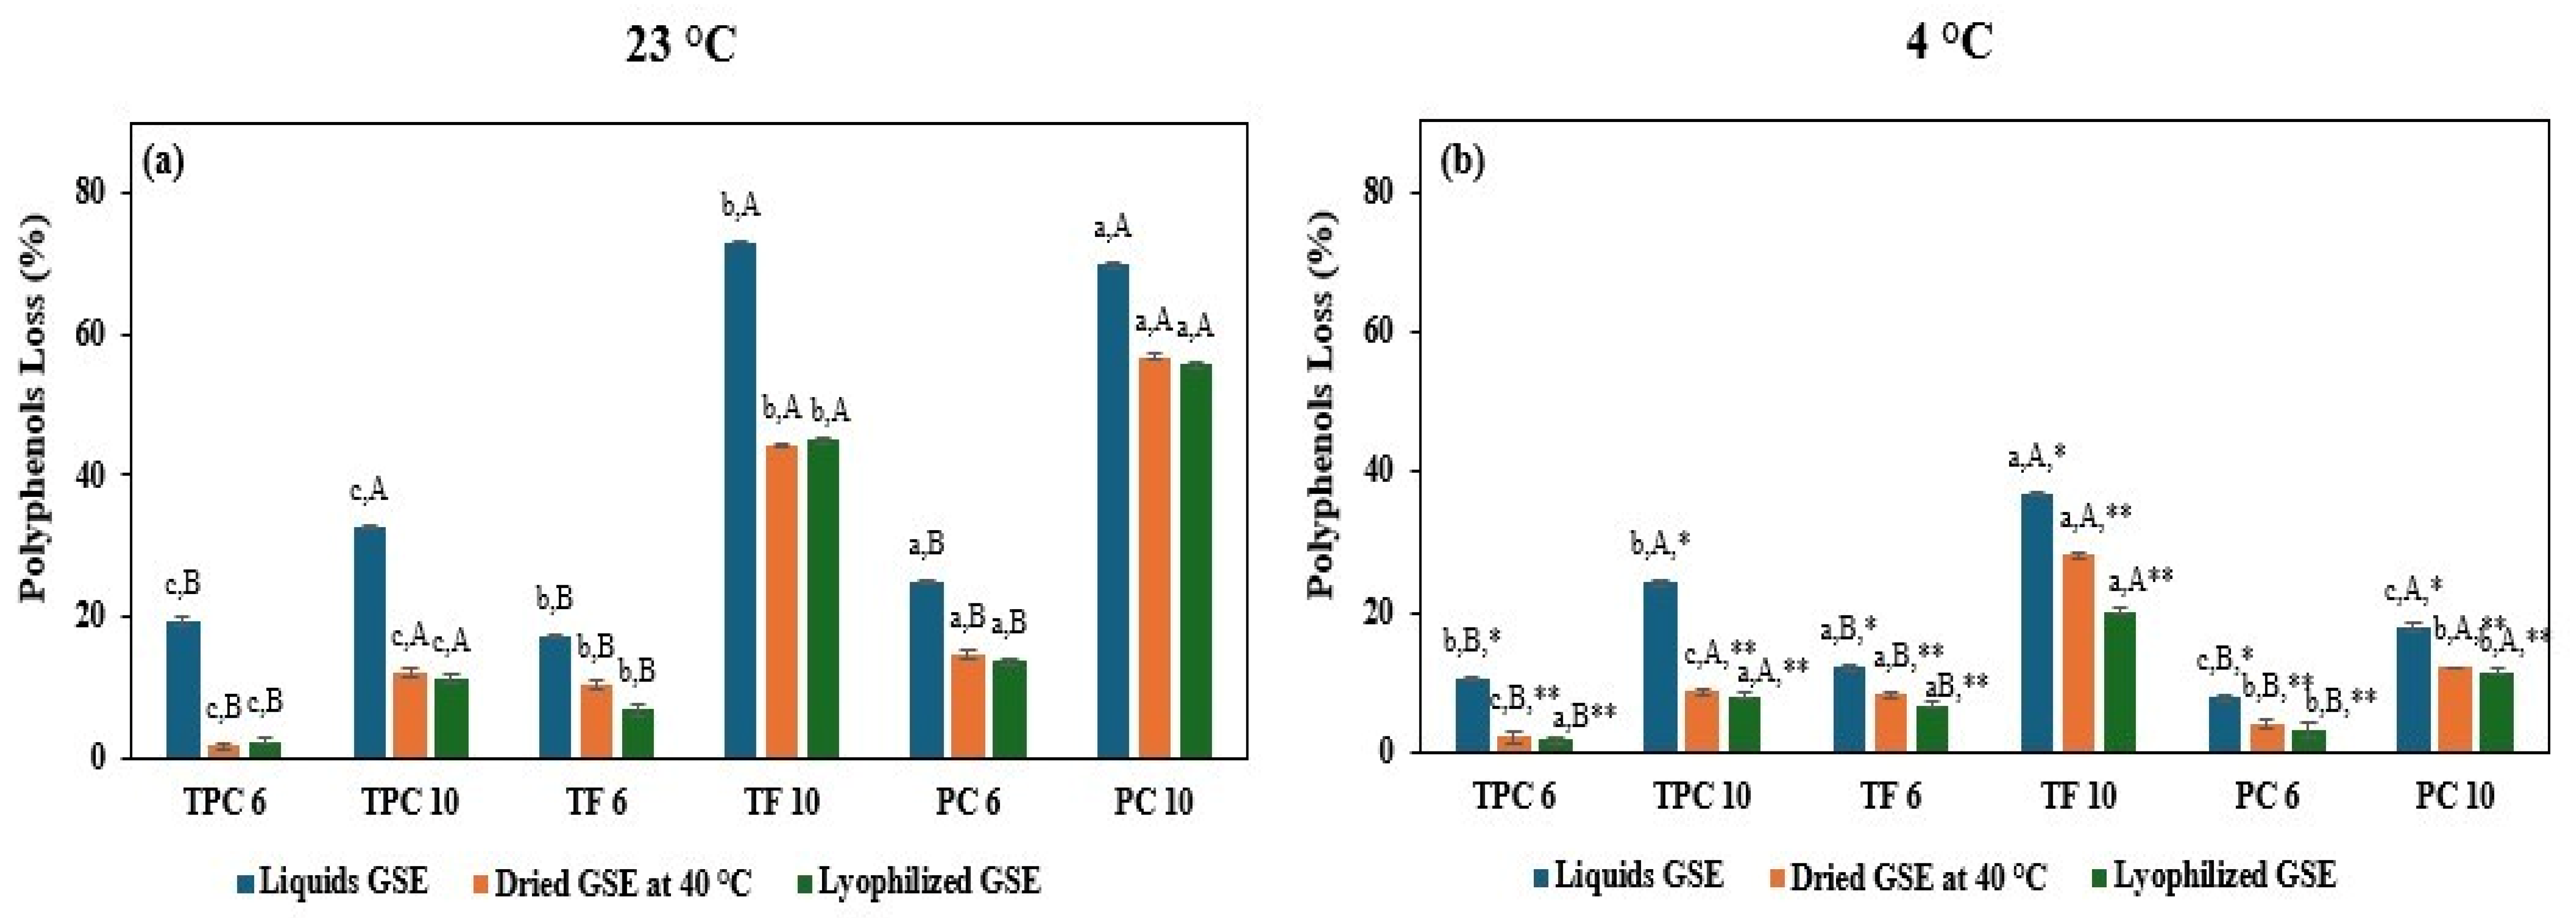
Third, the influence of the storage conditions of the extracts for 10 months was studied under two different conditions—in the dark at 23 °C and in a refrigerator at 4 °C. All TPC, TF, and PC indicators were determined at the 3rd, 6th, and 10th months. Of the three parameters, the TPC values were the highest, followed by TF and PC. This trend continued throughout the entire storage time of the samples. At the 3rd month, the values of the three parameters in the dried samples slightly changed (1–2%) compared to the initial values from the zero month and in both storage regimes. In the liquid samples in the storage regime at 4 °C, these percentages were preserved; however, at 23 °C, the reduction in the values of the three parameters reached about 8%. Therefore, at up to three months, the indicators were stable and there were no major biodegradation changes. At the 6th month, in both storage regimes, a greater reduction in all indicators compared to the initial values was observed. These differences are best represented by determining the percentage loss of polyphenols resulting from degradation processes (Figure 2).
Figure 2 shows that the percentage losses of PC and TF are greater than those of TPC. It is obvious that, when storing the samples at 23 °C for 6 months, there are more significant degradation changes in the liquid samples. In this case, for all three parameters, the losses are about 20%, while at 4 °C, these losses are two times lower.
The degradation changes are the greatest at the 10th month. Even when storing the samples in the refrigerator, a more significant percentage loss of polyphenols is observed. In this storage mode (4 °C), the losses of flavonoids are the highest, as in dry samples they are 28%, and in liquid samples they are 36%. The losses of flavonoids are much higher in samples stored at 23 °C, for dry samples (44%) and for liquid samples (73%), accordingly. An interesting fact is that the percentage losses of procyanidins in samples stored in the refrigerator are lower than those of flavonoids and in all forms of extracts (about 15%). Obviously, at this temperature, the biodegradation processes in flavonoids are faster compared to procyanidins. At the higher storage temperature (23 °C), all samples show a significantly higher percentage loss of procyanidins, about 60%, and almost reach the losses of flavonoids. It is likely that at higher temperatures, the degradation of procyanidins accelerates and their percentage loss equals that of flavonoids. It is noticeable that the TPC values are slightly more reduced than those of TF and PC. In dry samples, and in both storage regimes, the percentage loss of TPC is 10%, while in liquid samples it is different, at 23 °C, it is 32%, and at 4 °C, it is 24%.. The percentage loss in TPC in all samples stored at 23 °C is three times less than that of flavonoids, and about four times less than that of procyanidins. The low reduction in TPC values compared to those of TF and PC at the 6th and the 10th month is impressive. The reason for this is probably the degradation of flavonoids and procyanidins to monomers with a lower molecular weight, which, respectively, increase the TPC values. This fact has also been found by many other authors [43,44].

3.2. The Influence of Seed Drying and Extract Storage Conditions on the Extract Antioxidant Capacity During 10 Months

The other very important characteristic of GSE is its antioxidant activity. The antioxidant (AO) activity of all extracts stored in the dark at 23 °C and in the refrigerator at 4 °C was determined. The analyses were carried out by two methods, the DPPH and ABTS methods. The results are presented in Table 4.
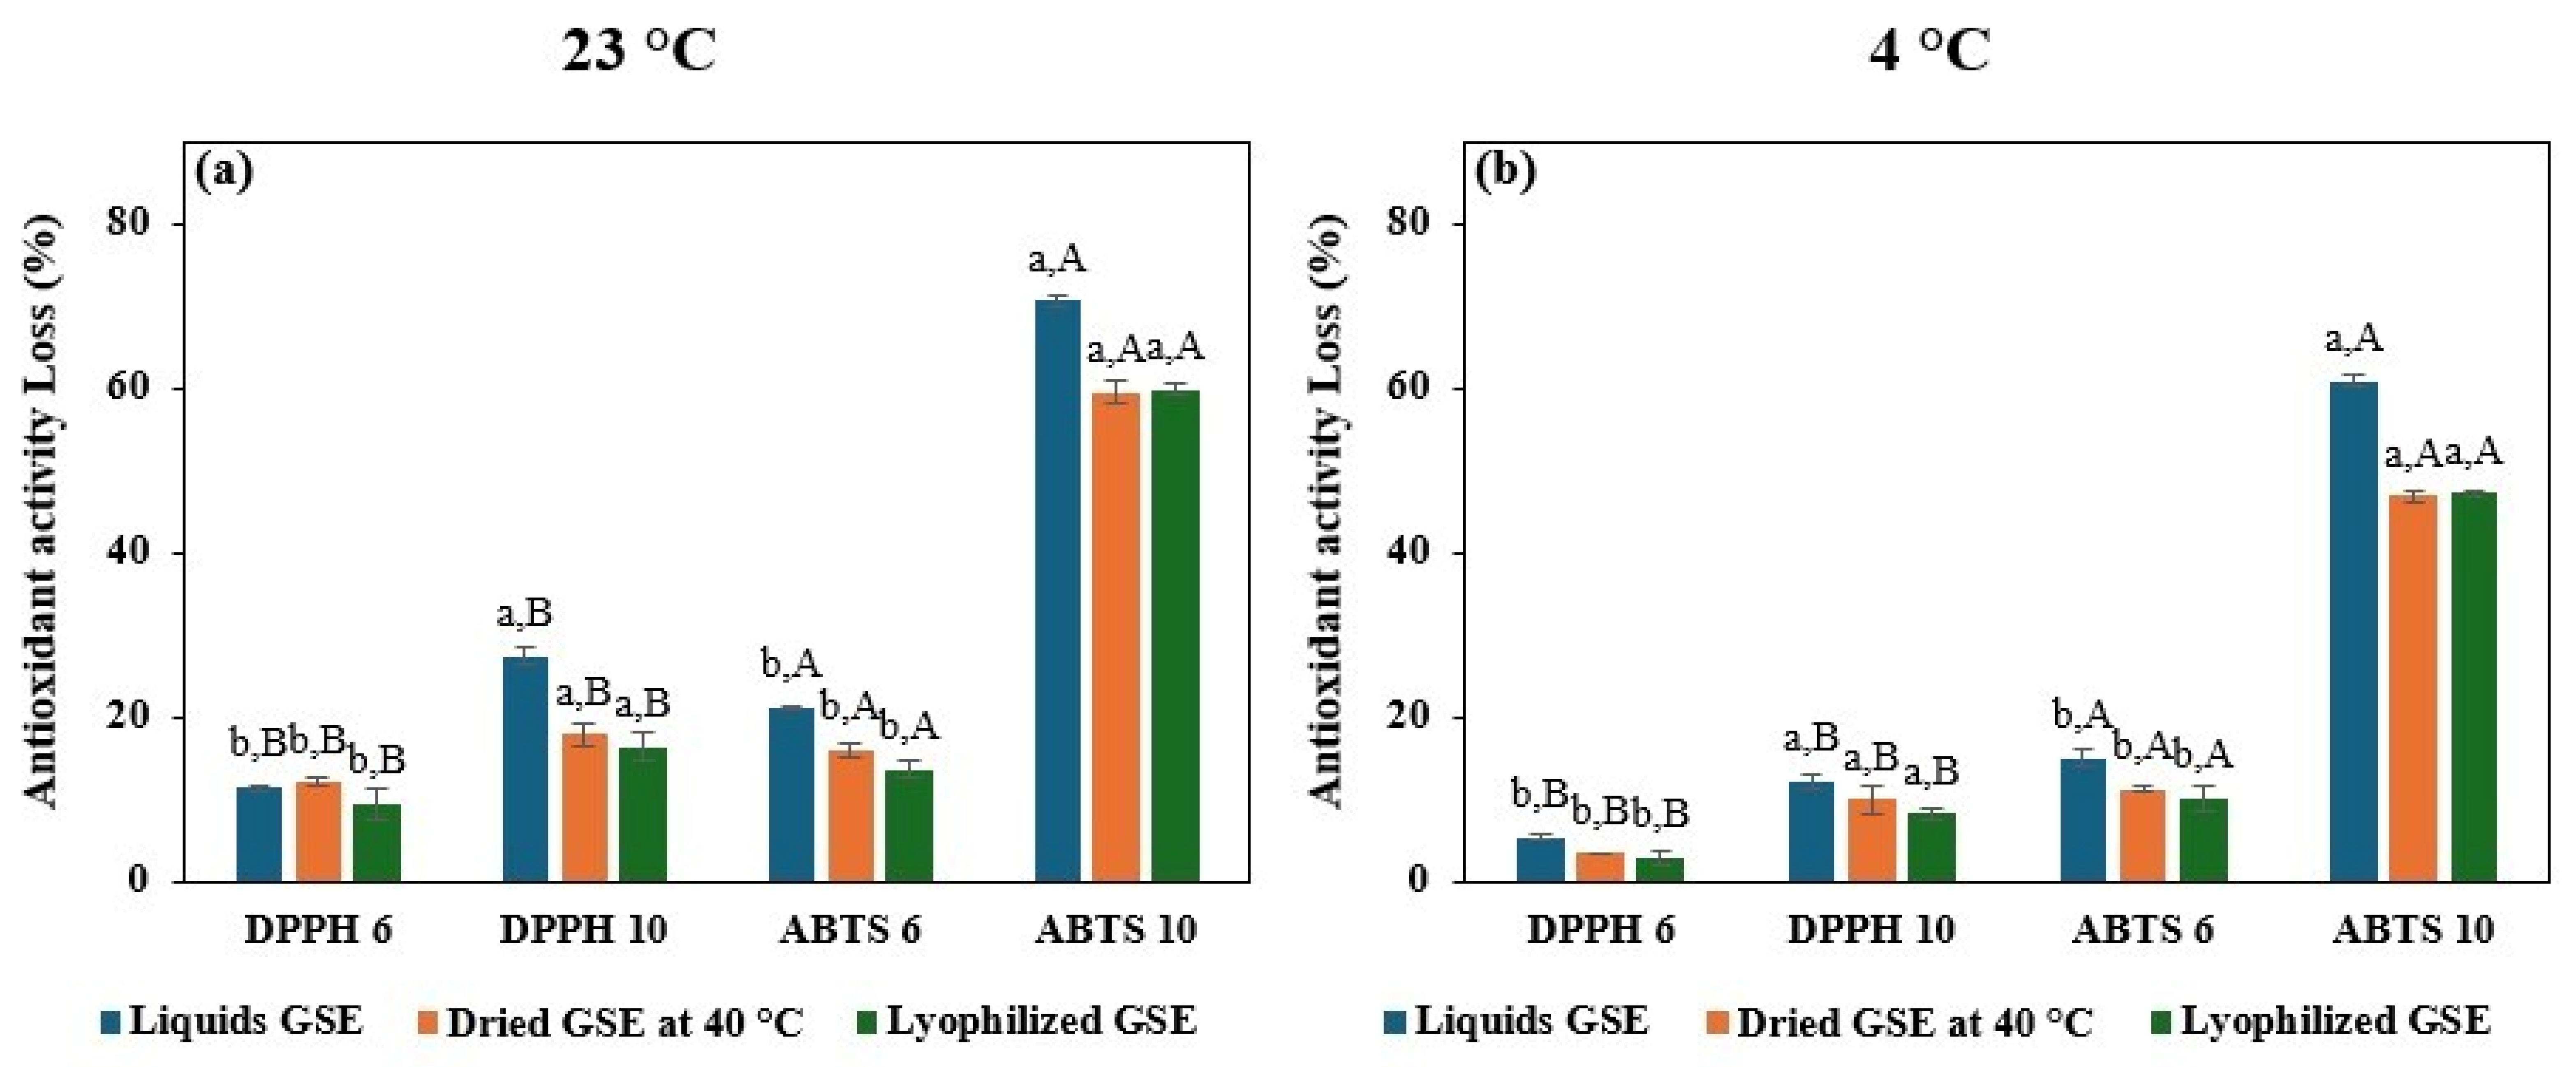
The obtained results correlate with the values of the polyphenol parameters presented in Table 3. The trend in the difference in AO activity between the liquid and dried samples corresponds to the trend determined for polyphenols. The same applies to the difference between the results of the samples at room temperature and in the refrigerator. It is obvious that the antioxidant activity measured by both methods, of all samples, is preserved to a greater extent when they are stored in the refrigerator than at room temperature. It is interesting that the values of AO activity obtained by the DPPH method decreased less during the 10 months than the values of AO activity measured by the ABTS method. This is very clearly seen by presenting the percentage loss of the DPPH and ABTS antioxidant activity values during storage of the samples at the 6th and 10th month (Figure 3).
It is obvious that the percentage loss of AO activity obtained by both methods is much greater when storing the extracts at 23 °C compared to those at 4 °C. The percentage loss is greater in liquid samples compared to dry samples. At 6 months, the antioxidant activity determined by the DPPH method at 4 °C in all forms of the extracts has a 4% loss, while in samples stored at 23 °C, the percentage loss is about 10%. The percentage loss of AO activity determined by the ABTS method is higher, at 4 °C it is about 12% for all forms of the extract; at 23 °C, it is about 19%. At the 10th month, more significant degradation changes are reported. The percentage loss determined by the DPPH method of the samples stored at 4 °C is about 11%; for those stored at 23 °C it is about 25%. The percentage loss of ABTS AO activity of all samples stored at 4 °C also increases significantly, to about 50%, while for those stored at 23 °C, the loss is 65%. Regardless of the method used to determine the antioxidant activity, the dry forms of the samples had about a 10% lower percentage loss than the liquid forms. It was found that at the 10th month, the loss of AO capacity measured by the ABTS method was about three times greater than that of the AO capacity measured by the DPPH method. It is known that the mechanism of action of the two methods is different [45,46]. DPPH assay radicals (DPPH●) are reduced through the acceptance of a hydrogen atom (H●) from antioxidant compounds. The scavenging efficiency of this assay is strongly influenced by the number and availability of hydroxyl groups present in phenolic compounds. In contrast, the ABTS assay radical cation (ABTS●+) is generated via a single-electron transfer mechanism. Therefore, the antioxidant activity measured by the two methods depends on the chemical structure and reaction mechanism of the antioxidant compounds. The greater reduction in AO potential values observed after 10 months of storage when measured by the ABTS assay, compared to the DPPH assay, may be explained by several factors. Proanthocyanidins and hydrolisable tannins are large and structurally complex polyphenolic compounds with a high electron-donating capacity, enabling highly effective interaction with ABTS radicals [47]. However, during prolonged storage, these compounds are likely degraded into different simpler phenolic compounds, including phenolic acids. The degradation of complex polyphenols into phenolic acids during storage has been reported by numerous authors [27,48]. Phenolic acids still contain hydroxyl groups capable of scavenging DPPH radicals, which may explain the relatively preserved antioxidant activity measured by the DPPH method. In contrast, the antioxidant capacity determined by the ABTS assay decreased markedly, probably due to the degradation of proanthocyanidins and hydrolisable tannins during long-term storage. Another possible explanation for the reduced AO activity values may be changes in the pH of the reaction medium. The optimal pH for the ABTS radical reaction system is approximately 7.4. If the degradation products alter the reaction medium or are unable to efficiently participate in single-electron transfer reactions under these conditions, lower antioxidant capacity values may be obtained. A decrease in pH is possible because the degradation of larger polyphenolic molecules results in the formation of phenolic acids. The degradation of complex polyphenols, mainly “galloylated” procyanidin galotannins into gallic acids was further confirmed by HPLC analysis of the individual extract components. The results demonstrated that, after 10 months of storage, the concentration of gallic acid increased by approximately 1.5-fold compared to the initial values, whereas the concentrations of the remaining phenolic compounds decreased to varying extents.

3.3. Degradation Kinetics of Extract Antioxidant Capacity During 10 Months Storage at 23 and 4 °C

The results obtained for the antioxidant potential of the extracts at 0, 3, 6 and 10 months (Table 3) show that degradation processes occur, which intensify towards 6 months and 10 months. In order to make a more complete quantitative assessment of these processes, the kinetic degradation models were studied during storage of the extracts for 10 months at 23 °C and at 4 °C. Degradation was monitored based on the decrease in antioxidant activity during storage of the samples. The reaction rate constant (k), half-life time (t1/2), coefficient of determination (R2), quality criterion to lose 90% of AO activity (D), and quotient indicator (Q10) parameters are shown in Table 5.
It was found that the degradation of phenolic compounds, expressed by the reduction in antioxidant activity, follows first-order reaction kinetics (R2 0.8–0.98). The kinetic degradation rate (k) of DPPH and ABTS antioxidant activities of samples stored at 4 °C are lower compared to those determined at 23 °C. In addition, the k-values of samples in liquid form are higher compared to those of dry extract samples, regardless of whether they are dried at 40 °C or by lyophilization. There is a large difference in the k-values of DPPH antioxidant activity with those of ABTS activities. It is obvious that the kinetic degradation rate (k) of ABTS activities is significantly higher compared to those of DPPH activities. This is completely understandable, since, as we commented above, the mechanism of the reaction of ABTS and DPPH radicals is different. During the degradation period, the larger polyphenol molecules that are highly active with ABTS are degraded to simpler compounds that retain some capacity to capture DPPH radicals, but that reduce their capacity to ABTS radicals. These differences will be proven in the next point, when determining the individual components of the extracts by HPLC analyses at the beginning and end of storage. The time t1/2 is defined as the time required for 50% degradation of the polyphenols in the extract and reduction in antioxidant activity. With faster degradation reactions, k-values are higher and t1/2 values are shorter. From Table 5, based on DPPH activities, it can be seen that liquid samples stored at 23 °C have three times higher k-values and faster degradation reactions compared to those at 4 °C. For dry samples under the same conditions, this ratio is two times. Therefore, at 23 °C, the degradation changes calculated on the basis of DPPH activities occur to a higher extent and faster than those at 4 °C. In the results calculated on the basis of ABTS activities, it can be seen that the k-values are higher compared to those calculated on the basis of DPPH activities. Here, too, there is a difference in the k-values obtained at 23 and 4 °C, as again, the samples at 23 °C are faster by 1.2 times compared to those occurring at 4 °C. In addition, the liquid concentrates of all samples using the DPPH and ABTS methods have higher k-values and lower t1/2 values compared to the dry samples.
The quotient indicator (Q10) expressing the temperature dependence of the reaction rate constants was calculated (Table 5). It can be seen that the values of these indicators are very close in both DPPH and ABTS methods for liquid and dry at 40 °C and for lyophilized samples. The quality criterion (D) was also calculated. Its values are directly proportional to those for t1/2. These indicators predict when 90% of the degradation of phenolic compounds will occur, but in this case are based on the obtained rate constants of 10 months.
The results convincingly show that the degradation processes are weaker when the extracts are in dry form and stored at a temperature of 4 °C. The obtained differences in the kinetic parameters based on the antioxidant activities of the extracts determined by the DPPH and ABTS methods clearly confirm the statement that, in order to determine the antioxidant activity of a given antioxidant, it is necessary to apply several methods, with different mechanisms of action, in order for the assessment to be more realistic.

3.4. Determination of the Individual Components of Liquid and Lyophilized Grape Seed Extracts at 0 and at 10 Months

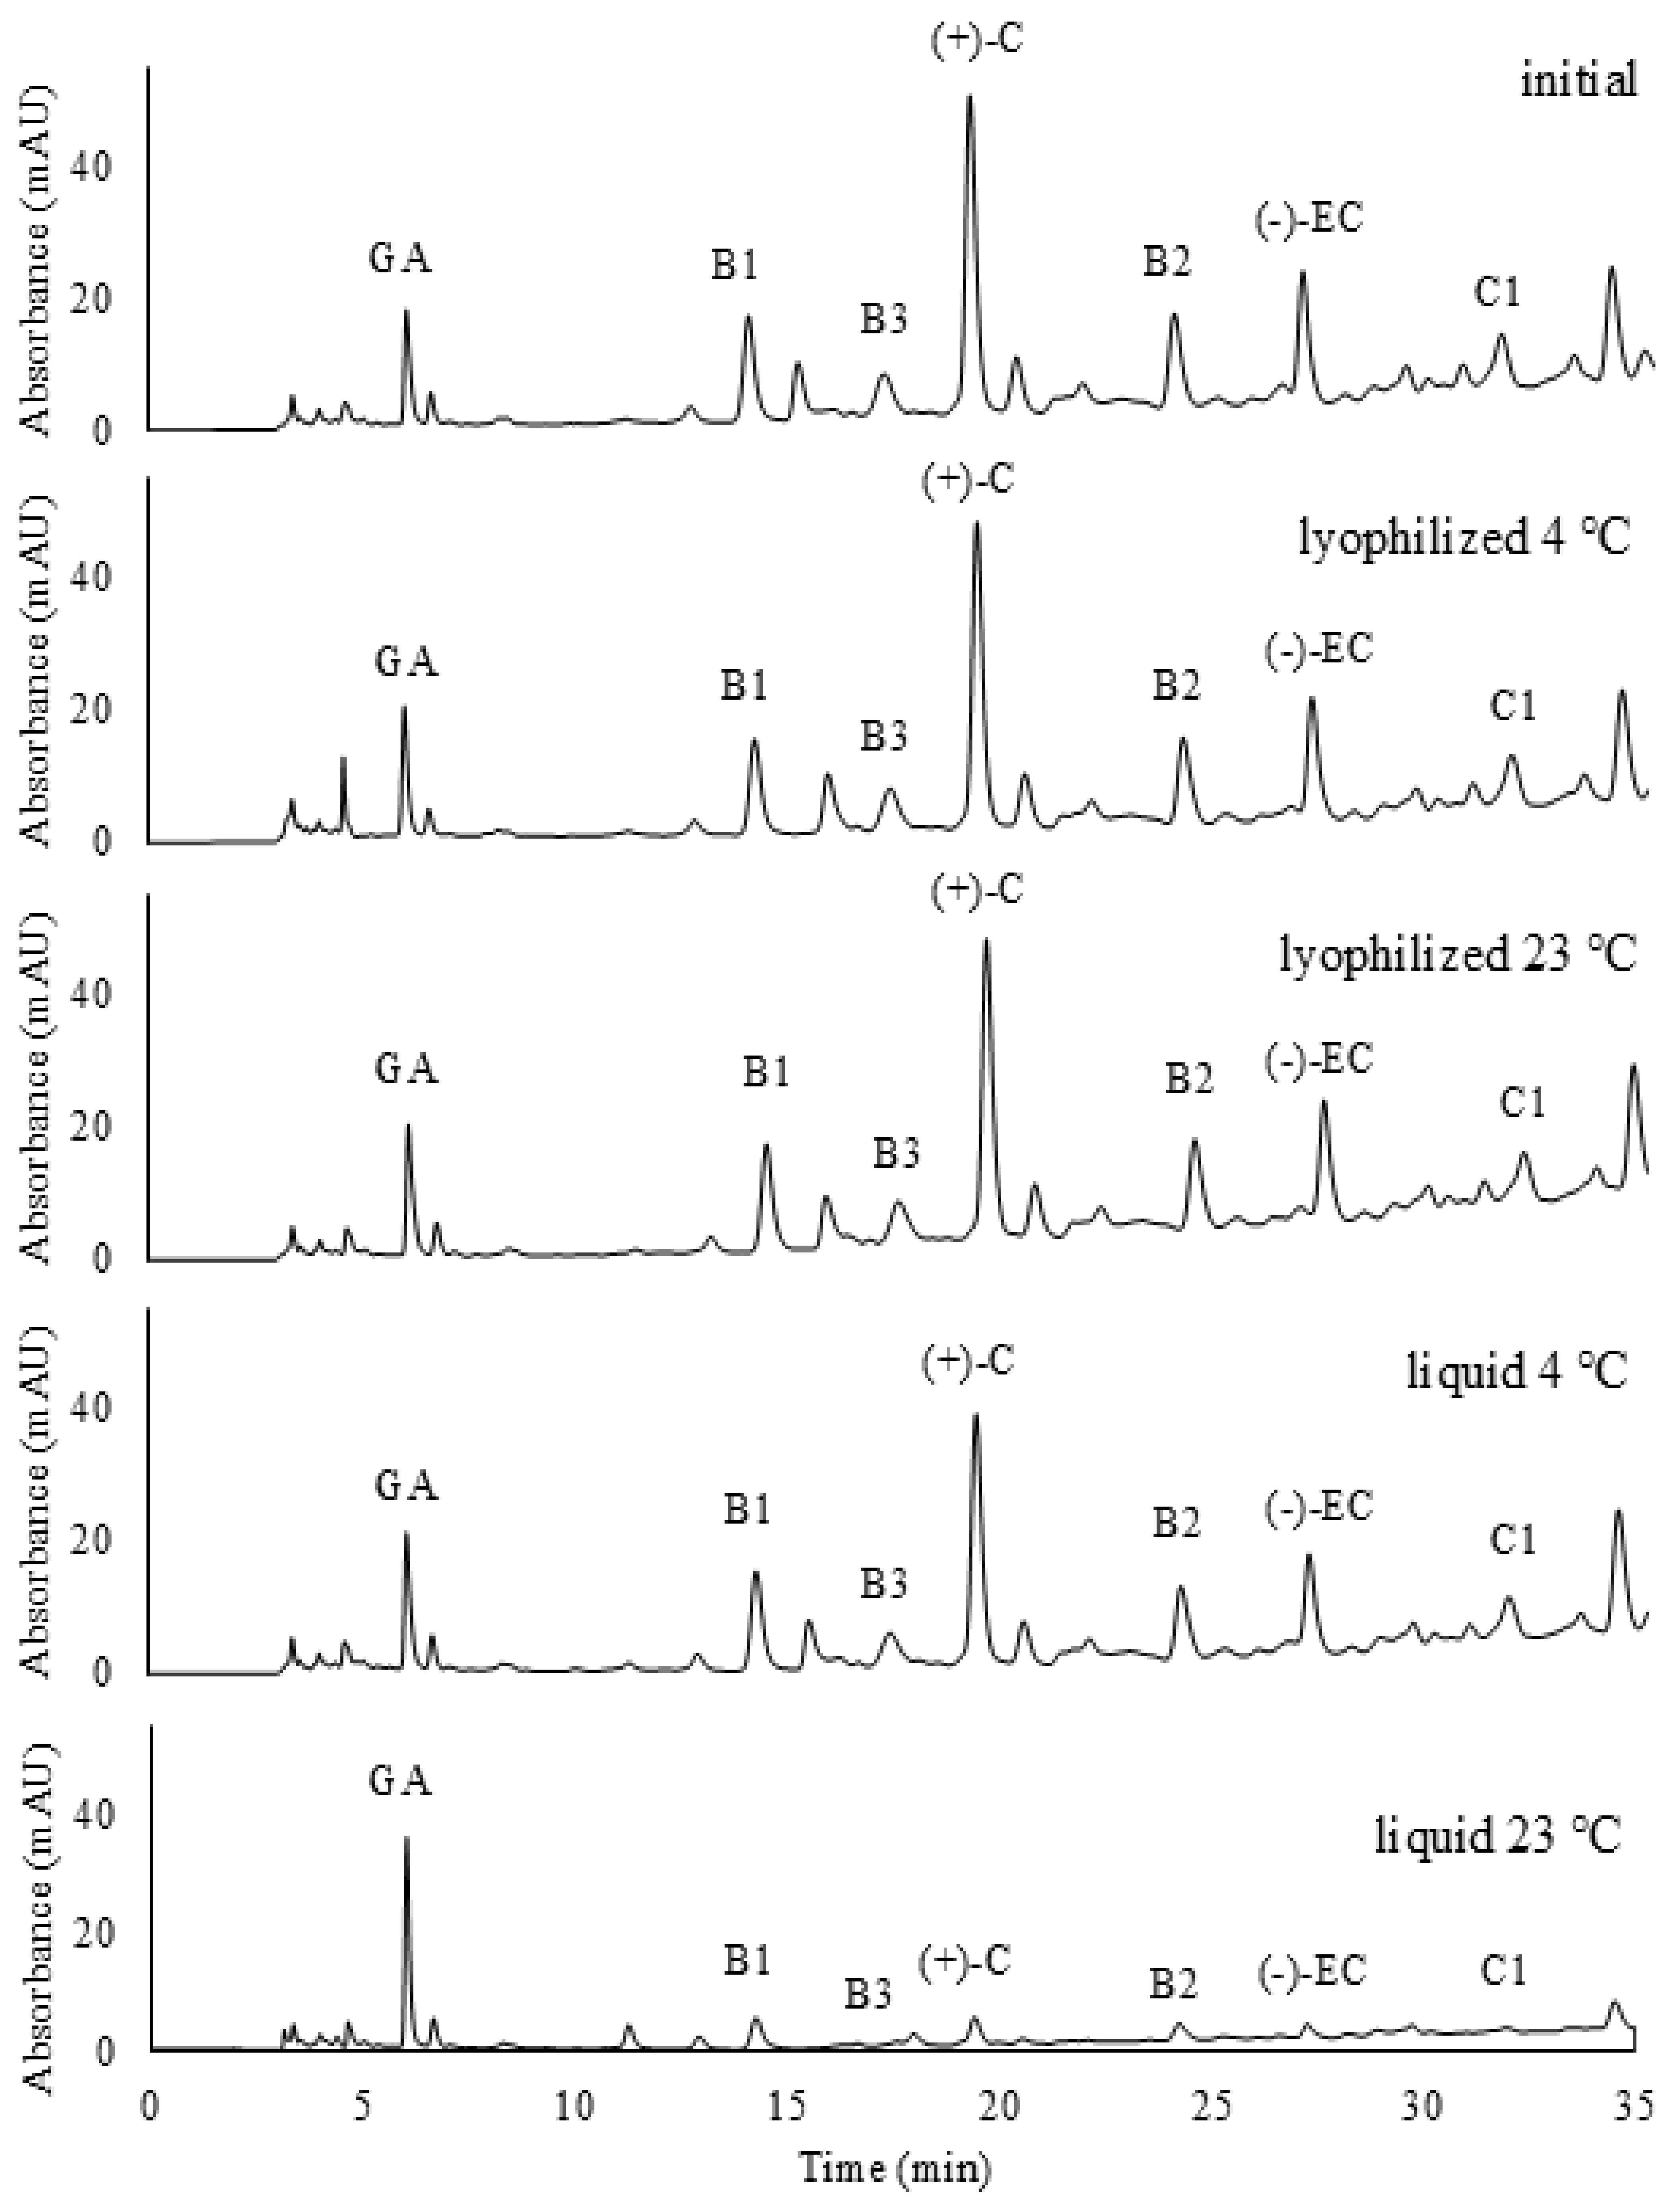
Degradation processes during storage of the extracts lead to changes in the content of the individual compounds in them. HPLC analyses of the lyophilized and liquid samples stored at 23 and 4 °C for 10 months were performed to identify and quantify the chemical compounds contained in them. The obtained results were compared with those of the initial samples. The aim was to determine the polyphenols content at the end of the story period. There are no data in scientific publications on the study of degradation changes of individual compounds over such a long period (10 months). Results presented by other authors for a maximum period of 6 months are found, but for an extract made from grape stems [44]. The use of the extracts as a dietary or nutritional supplement in foods requires that their antioxidant activity be studied for a longer period of storage. It is also necessary to monitor the changes in the content of individual compounds in the extracts over this period and to determine the optimal conditions for their storage. For this purpose, a comparison of the individual composition of the samples stored at 23 °C and 4 °C was made for both the liquid extract concentrate and the lyophilized samples. HPLC analyses of the dried samples at 40 °C are not presented, since their results are very close to those of the lyophilized ones. The sequence of eluted target compounds is presented in the chromatograms (Figure 4) and in Table 6.
The seed extracts are rich in monomeric flavan-3-ols: (+) catechin, (−) epicatechin, dimers: procyanidins B1, B2, B3 and trimer: procyanidin C1. From Table 6, it is obvious that the concentrations of (+)-catechin in the initial sample is very high, 22.01 mg/g. In second place are the concentrations of procyanidin B1 (11.87 mg/g) and (−)-epicatechin (10.12 mg/g). Of the identified procyanidins, the highest content is procyanidin B1 (11.87 mg/g), followed by procyanidin B2 (6.58 mg/g), and procyanidin C1 (1.23 mg/g). The lowest content is for procyanidin B3 (0.61 mg/g). When comparing the HPLC results of the two lyophilized samples stored at 4 °C and at room temperature in the dark, at the 10th month with those at 0 months, it can be seen that there is little difference in the contents for individual components. For the lyophilized samples stored at 23 °C, the difference is slightly larger. In both cases, the degradation changes are greatest for procyanidin C1 and epicatechin: the loss is 19.27% and 16.43% at the 10th month at 4 °C; at 23 °C, the losses are 26.63% and 22.42%, respectively. These are followed by procyanidin B3, B2, catechin, and, finally, procyanidin B1. Procyanidin C1, a type-B trimer, is generally considered to be less stable than procyanidin dimers such as B1, B2, and B3 [49,50]. The geometric and energy parameters show that catechin appears more stable than epicatechin [51]. The hydroxyl group position on the ring C of the catechol structure represents a factor that influences this relative stability. The global and local reactivity parameters reveal that epicatechin is more reactive than catechin.
It is impressive that the degradation change in procyanidin B1 is very small. The procyanidins (B1, B2, and B3) are “B-type” procyanidins with similar molecular weights and hydroxyl group counts. They differ in their structural configurations and monomer pairings [52]. Despite that they have specific differences, it is believed that procyanidin B1 has a good sterically protected structure and a compact form compared to the other two isomers, B2 and B3 [49,53]. These theoretical data fully support our results. It is obvious that the remaining procyanidins and epicatechin are the most sensitive to oxidation, followed by catechin. Interestingly, at 10 months, an increase in the concentration of gallic acid is observed in both samples (Table 6). The content of the identified compounds in the liquid concentrates is lower compared to those of the lyophilized samples. The liquid sample stored at 4 °C has smaller degradation changes; however, the sample stored at room temperature has significant changes. At 10 months, in the sample stored at 23 °C, the compounds procyanidin C1, epicatechin, procyanidin B3, and catechin are almost completely degraded. These compounds in the same sample at 4 °C have about 3–4 times higher contents compared to those at 23 °C. The losses of the compounds procyanidin C1, epicatechin, procyanidin B3, and catechin at 4 °C are 38.02, 34.06, 32.98, and 22.73%, respectively. At 23 °C, the losses are very high, at 99.74, 99.90, 98.70 and 92.03%, respectively. The concentration of gallic acid in a liquid sample stored at 23 °C increased by 50.7%. The increase in gallic acid content during polyphenol degradation has also been found by other authors [27,48]. It is believed that mainly “galloylated” procyanidins, which have gallic acid molecules attached to the central flavonoid structure, can degrade at temperature or over time to give free gallic acid [49,53]. The hydrolysable galotannins can also degrade to free gallic acid [52]. In this case, the ester bonds linking gallic acid units to a central core of galotannins (usually glucose) broke down at thermal hydrolysis or over time and separated a free gallic acid. This fully explains the increase in the content of gallic acid. The increased results for gallic acid correlate with the high value of total phenolic contents presented in Table 3. Probably, the gallic acid, which has three hydroxyl groups, preserves the DPPH antioxidant capacity of the extract in the 10th month. In addition, the degradation of proantocyanidins and tannins decreased the ABTS capacity at the 10th month (Table 4).
The results in Table 6 show that the lyophilized samples have smaller degradation changes in the ten-month storage period, especially those stored at 4 °C. The behavior of the extract, dried at 40 °C, is similar. This is why a chromatographic analysis of these samples was not performed. The results obtained from the liquid concentrate show that, when storing the liquid sample at 4 °C, the degradation changes are slightly greater than the values of the lyophilized sample at 23 °C; however, when stored at 23 °C, almost complete degradation of the more oxidation-sensitive individual compounds occurs and the concentration of gallic acid increases by 50.7%.

3.5. Determination of Nutritional Value and Mineral Profile of Syrah Grape Seed Extract

In order to fully assess the suitability of the extract to be used as a dietary supplement or as a food additive to various food products, it is necessary to investigate its nutritional values and mineral composition. The nutritional value and macro- and micromineral contents of the obtained extract are presented in Table 7.
It was found that Syrah extract contains 10.5% proteins. It is known that grape seeds contain a significant number of proteins, including albumins, globulins, and glutelins [54]. The percent of fat was 1.66% and saturated acids were 0.27%. The percent of carbohydrates was high, at 77.29%. The energy values were 366.2 kcal/100 g. The mineral contents of the studied grape seed extract were determined by Thermo Scientific iCAP Q ICP-MS. The studied elements play an important role in the formation of bones and teeth, enzyme structure, muscle contraction, kidney function, proper heart rhythm, nerve signaling, etc. [55]. The minerals composition of grape seed extract is summarized in Table 7. The total amount of macroelements was 6281.76 mg/kg metal macroelements and the amount of microelements was 25.3 mg/kg. The highest content was potassium (4367 mg/kg), followed by phosphorus (1416 mg/kg), calcium (223.27 mg/kg), and magnesium (223.03 mg/kg). Microelements, like zinc, copper, selenium and iron,. are very important for health. The analysis of microelements showed that Fe, Cu and Zn are major minerals of the varieties. The results obtained show that the extract has not only a very high phenolic content and antioxidant capacity, but also very good nutritional values and mineral contents.

4. Conclusions

The seed extract of the red grape cultivar Syrah was shown to have a high polyphenolic content, favorable nutritional value, and a rich mineral composition. The effects of two commonly applied storage temperatures (23 and 4 °C) on the stability of the extract in lyophilized, dried at 40 °C, and liquid concentrate forms for a long time period (10 mounts) were investigated. The results demonstrated that the polyphenolic characteristics of the lyophilized and oven-dried (40 °C) grape seed extracts stored at 4 °C remained relatively stable over the 10-month storage period, with losses of 10% TPC, 28% TF, and 15% PC. The lyophilized extract exhibited slightly lower losses compared to the extract dried at 40 °C. Similarly, the antioxidant activity of extracts stored at 4 °C remained comparatively stable, with only an 11% reduction in DPPH activity, whereas the ABTS activity indicated an approximately 50% decrease after 10 months of storage. Both forms of dried extracts showed approximately 1.5 times greater stability than the liquid concentrate at 4 °C. At 23 °C, the dried extracts showed only about 5% lower antioxidant activity values compared to storage at 4 °C, while the liquid concentrate demonstrated significantly reduced stability. Regarding individual phenolic compounds, the greatest degradation after 10 months was observed for procyanidin C1 and epicatechin, followed by catechin and procyanidin B3. Despite the degradation of some phenolic compounds, the antioxidant activity of dried extract forms stored at 4 °C, measured by the DPPH assay, retained approximately 89% of its initial value after 10 months. Overall, the obtained results clearly demonstrate that the most suitable storage conditions for GSE are 4 °C and in dried extract forms. Furthermore, the results confirm the strong potential of the obtained extract for application as a dietary supplement and as a food additive in various food products.

Author Contributions

Conceptualization, T.G. and Y.I.; methodology, Y.I. and Z.C.; data curation, P.G.; writing—original draft preparation, Y.I. and T.G.; writing—review and editing, Y.I. and T.G.; visualization, P.G., statistical analysis, G.N.; supervision, T.G. All authors have read and agreed to the published version of the manuscript.

Funding

This research received no external funding.

Data Availability Statement

The original contributions presented in this study are included in the article. Further inquiries can be directed to the corresponding author.

Conflicts of Interest

The authors declare no conflicts of interest.

Abbreviations

The following abbreviations are used in this manuscript:
ABTS2,2′-azino-bis(3-ethylbenzothiazoline-6-sulfonic acid)
DPPH2,2-diphenyl-1-picrylhydrazyl
dwDry weight
GSEGrape seed extract
PCProcyanidins
TPCTotal phenolic content
TFTotal flavonoids

References

  1. Bhutani, M.; Gaur, S.S.; Shams, R.; Dash, K.K.; Shaikh, A.M.; Béla, K. Valorization of grape by-products: Insights into sustainable industrial and nutraceutical applications. Future Foods 2025, 12, 100710. [Google Scholar] [CrossRef]
  2. Karastergiou, A.; Gancel, A.-L.; Jourdes, M.; Teissedre, P.-L. Valorization of Grape Pomace: A Review of Phenolic Composition, Bioactivity, and Therapeutic Potential. Antioxidants 2024, 13, 1131. [Google Scholar] [CrossRef]
  3. Jin, Q.; O’Hair, J.; Stewart, A.C.; O’Keefe, S.F.; Neilson, A.P.; Kim, Y.-T.; McGuire, M.; Lee, A.; Wilder, G.; Huang, H. Compositional characterization of different industrial white and red grape pomaces in Virginia and the potential valorization of the major components. Foods 2019, 8, 667. [Google Scholar] [CrossRef]
  4. Jin, Q.; O’Keefe, S.F.; Stewart, A.C.; Neilson, A.P.; Kim, Y.T.; Huang, H. Techno-economic analysis of a grape pomace biorefinery: Production of seed oil, polyphenols, and biochar. Food Bioprod. Process. 2021, 127, 139–151. [Google Scholar] [CrossRef]
  5. Sochorova, L.; Prusova, B.; Jurikova, T.; Mlcek, J.; Adamkova, A.; Baron, M.; Sochor, J. The Study of Antioxidant Components in Grape Seeds. Molecules 2020, 25, 3736. [Google Scholar] [CrossRef]
  6. Chen, Y.; Wen, J.; Deng, Z.; Pan, X.; Xie, X.; Peng, C. Effective utilization of food wastes: Bioactivity of grape seed extraction and its application in food industry. J. Funct. Foods 2020, 73, 104113. [Google Scholar] [CrossRef]
  7. Garcia-Cabezon, C.; Teixeira, G.G.; Dias, L.G.; Salvo-Comino, C.; García-Hernandez, C.; Rodriguez-Mendez, M.L.; Martin-Pedrosa, F. Analysis of Phenolic Content in Grape Seeds and Skins by Means of Bio-Electronic Tongue. Sensors 2020, 20, 4176. [Google Scholar] [CrossRef]
  8. Di Stefano, V.; Buzzanca, C.; Melilli, G.M.; Indelicato, S.; Mauro, M.; Vazzana, M.; Arizza, V.; Lucarini, M.; Durazzo, A.; Bongiorno, D. Polyphenol Characterization and Antioxidant Activity of Grape Seeds and Skins from Sicily: A Preliminary Study. Sustainability 2022, 14, 6702. [Google Scholar] [CrossRef]
  9. Pozzo, L.; Grande, T.; Raffaelli, A.; Longo, V.; Weidner, S.; Amarowicz, R.; Karamać, M. Characterization of Antioxidant and Antimicrobial Activity and Phenolic Compound Profile of Extracts from Seeds of Different Vitis Species. Molecules 2023, 28, 4924. [Google Scholar] [CrossRef]
  10. Hegedüs, I.; Andreidesz, K.; Szentpéteri, J.L.; Kaleta, Z.; Szabó, L.; Szigeti, K.; Gulyás, B.; Padmanabhan, P.; Budan, F.; Máthé, D. The Utilization of Physiologically Active Molecular Components of Grape Seeds and Grape Marc. Int. J. Mol. Sci. 2022, 23, 11165. [Google Scholar] [CrossRef] [PubMed]
  11. Sochorova, L.; Prusova, B.; Cebova, M.; Jurikova, T.; Mlcek, J.; Adamkova, A.; Nedomova, S.; Baron, M.; Sochor, J. Health effects of grape seed and skin extracts and their influence on biochemical markers. Molecules 2020, 25, 5311. [Google Scholar] [CrossRef]
  12. Mokrani, M.; Brochot, A.; Urdaci, M.C.; Biombalance, T.M. A Specific Oligomeric Procyanidin-Rich Grape Seed Extract as Multifunctional Ingredient Integrating Antibacterial, Antioxidant, and Anti-Inflammatory Activities with Beneficial Gut–Brain Axis Modulation. Antioxidants 2025, 14, 1484. [Google Scholar] [CrossRef] [PubMed]
  13. Unusan, N. Proanthocyanidins in grape seeds: An updated review of their health benefits and potential uses in the food industry. J. Funct. Foods 2020, 67, 103861. [Google Scholar] [CrossRef]
  14. Jebur, A.B.; El-Sayed, R.A.; El-Demerdash, F.M. Grape seeds: Nutritional value, health advantages, and industrial applications. Food Med. Homol. 2026, 3, 9420100. [Google Scholar] [CrossRef]
  15. Ivanov, Y.; Atanasova, M.; Godjevargova, T. Nutritional and Functional Values of Grape Seed Flour and Extract for Production of Antioxidative Dietary Supplements and Functional Foods. Molecules 2025, 30, 2029. [Google Scholar] [CrossRef] [PubMed]
  16. Tarek, K.; Farid, A.; Safwat, G. Extraction of grape seeds by different solvents affects the activities of the resultant extract. AMB Express 2025, 15, 51. [Google Scholar] [CrossRef]
  17. Bonifacino, C.; Dauber, C.; Martínez, A.; Tourné, F.; Irigaray, B.; Vieitez, I.; Abirached, C. Towards a sustainable utilization of Tannat grape seeds: Extraction of bioactive compounds through green technologies and waste revalorization. J. Supercrit. Fluids 2026, 230, 106850. [Google Scholar] [CrossRef]
  18. Dimić, I.; Teslić, N.; Putnik, P.; Bursać Kovačević, D.; Zeković, Z.; Šojić, B.; Mrkonjić, Ž.; Čolović, D.; Montesano, D.; Pavlić, B. Innovative and Conventional Valorizations of Grape Seeds from Winery By-Products as Sustainable Source of Lipophilic Antioxidants. Antioxidants 2020, 9, 568. [Google Scholar] [CrossRef]
  19. Panić, M.; Damjanović, A.; Radošević, K.; Cvjetko Bubalo, M.; Dujmić, F.; Škegro, M.; Radojčić Redovniković, I.; Brnčić, M. Enhanced Preparative-Scale Extraction from Graševina Grape Pomace Using Ultrasound-Assisted Extraction and Natural Deep Eutectic Solvents. Appl. Sci. 2024, 14, 6185. [Google Scholar] [CrossRef]
  20. Tomasi, I.I.T.; Santos, S.C.R.; Boaventura, R.A.R.; Botelho, C.M.S. Optimization of microwave-assisted extraction of phenolic compounds from chestnut processing waste using response surface methodology. J. Clean. Prod. 2023, 395, 136452. [Google Scholar] [CrossRef]
  21. Cozmuta, A.M.; Peter, A.; Nicula, C.; Jastrzębska, A.; Jakubczak, M.; Purbayanto, M.A.K.; Bunea, A.; Bora, F.; Uivarasan, A.; Szakács, Z.; et al. The impact of visible light component bands on polyphenols from red grape seed extract powder encapsulated in alginate–whey protein matrix. Food Chem. 2024, 23, 101758. [Google Scholar] [CrossRef]
  22. ElGamal, R.; Song, C.; Rayan, A.M.; Liu, C.; Al-Rejaie, S.; ElMasry, G. Thermal Degradation of Bioactive Compounds during Drying, Process of Horticultural and Agronomic Products: A Comprehensive Overview. Agronomy 2023, 13, 1580. [Google Scholar] [CrossRef]
  23. Sokač, T.; Gunjević, V.; Pušek, A.; Tušek, A.J.; Dujmić, F.; Brnčić, M.; Ganić, K.K.; Jakovljević, T.; Uher, D.; Mitrić, G.; et al. Comparison of Drying Methods and Their Effect on the Stability of Graševina Grape Pomace Biologically Active Compounds. Foods 2022, 11, 112. [Google Scholar] [CrossRef]
  24. Teles, A.A.C.; Chávez, D.W.H.; Gomes, F.S.; Cabral, L.M.C.; Tonon, R.V. Effect of temperature on the degradation of bioactive compounds of Pinot Noir grape pomace during drying. Braz. J. Food Technol. 2018, 21, e2017059. [Google Scholar] [CrossRef]
  25. Guaita, M.; Panero, L.; Motta, S.; Mangione, B.; Bosso, A. Effects of high-temperature drying on the polyphenolic composition of skins and seeds from red grape pomace. LWT 2021, 145, 111323. [Google Scholar] [CrossRef]
  26. Taşeri, L.; Gülcü, M.; Aktaş, T. Comparison of Grape Pomace Drying Using a Solar Dryer and Under Open Sun Conditions. Vitic. Stud. 2023, 3, 31–40. [Google Scholar] [CrossRef]
  27. Gerardi, C.; Durante, M.; Tufariello, M.; Grieco, F.; Giovinazzo, G. Effects of Time and Temperature on Stability of Bioactive Molecules, Color and Volatile Compounds during Storage of Grape Pomace Flour. Appl. Sci. 2022, 12, 3956. [Google Scholar] [CrossRef]
  28. Silvestri, A.-C.; Burdet, J.-P.; Steiner-Convers, L. Comparison of various storage conditions to preserve polyphenols in red-grape pomace. In IVES Conference Series, Macrowine 2016; International Viticulture and Enology Society (IVES): Villenave d’Ornon, France, 2024. [Google Scholar]
  29. Castillo, A.; Celeiro, M.; Rubio, L.; Bañobre, A.; Otero-Otero, M.; Garcia-Jares, C.; Lores, M. Optimization of bioactives extraction from grape marc via a medium scale ambient temperature system and stability study. Front. Nutr. 2022, 9, 1008457. [Google Scholar] [CrossRef] [PubMed]
  30. Ferreyra, S.; Bottini, R.; Fontana, A. Temperature and light conditions affect stability of phenolic compounds of stored grape cane extracts. Food Chem. 2023, 405, 134718. [Google Scholar] [CrossRef]
  31. Ageyeva, N.M.; Anastasia, N.; Tikhonova, A.N.; Burtsev, B.V.; Biryukova, S.A.; Globa, E.V. Grape pomace treatment methods and their effects on storage. Foods Raw Mater. 2021, 9, 215–223. [Google Scholar] [CrossRef]
  32. Hassan, H.E.; Rahman, A.A.; Farag, M.H.; Salam, Z.A.; Shehata, F.M. Impact of ultraviolet irradiation processing on quality of fresh beef meat during cold storage. CIGR J. 2015, 17, 130–139. [Google Scholar]
  33. Singleton, V.L.; Rossi, J.A. Colorimetry of total phenolics with phosphomolybdic-phosphotungstic acid reagents. Am. J. Enol. Vitic. 1965, 16, 144–158. [Google Scholar] [CrossRef]
  34. Krasteva, D.; Ivanov, Y.; Chengolova, Z.; Godjevargova, T. Antimicrobial Potential, Antioxidant Activity, and Phenolic Content of Grape Seed Extracts from Four Grape Varieties. Microorganisms 2023, 11, 395. [Google Scholar] [CrossRef]
  35. Brezoiu, A.M.; Matei, C.; Deacinu, M.; Stanciuc, A.M.; Trifan, A.; Gaspar-Pintiliescu, A.; Berger, D. Polyphenols extract from grape pomace. Characterization and valorisation through encapsulation into mesoporous silica-type matrices. Food Chem. Toxicol. 2019, 133, 110787. [Google Scholar] [CrossRef]
  36. Sofi, F.R.; Raju, S.V.; Lakshmisha, L.P.; Ratankumar, S.R. Antioxidant and antimicrobial properties of grape and papaya seed extracts and their application on the preservation of Indian mackerel (Rastrelliger kanagurta) during ice storage. J. Food Sci. Technol. 2016, 53, 104–117. [Google Scholar] [CrossRef]
  37. Fernandez-Rosillo, F.; Cabrejos-Barrios, E.M.; Chávez Quintana, S.G.; Quiñones-Huatangari, L. Polyphenol Degradation Kinetics of Specialty Coffee in Different Presentations. Foods 2025, 14, 3600. [Google Scholar] [CrossRef] [PubMed]
  38. AOAC. Official Methods of Analysis, 18th ed.; Association of Official Analytical Chemists: Washington, DC, USA, 2005. [Google Scholar]
  39. Mariotti, F.; Tomé, D.; Mirand, P.P. Converting nitrogen into protein—Beyond 6.25 and Jones’ factors. Food Sci. Nutr. 2008, 48, 177–184. [Google Scholar] [CrossRef]
  40. Silva, V.; Igrejas, G.; Falco, V.; Santos, T.; Torres, C.; Oliveira, A.; José Eduardo Pereira, E.J.; Amaral, S.A.; Poeta, P. Chemical composition, antioxidant and antimicrobial activity of phenolic compounds extracted from wine industry by-products. Food Control 2018, 92, 516–522. [Google Scholar] [CrossRef]
  41. Weseler, A.R.; Bast, A. Masquelier’s grape seed extract: From basic flavonoid research to a well-characterized food supplement with health benefits. Nutr. J. 2017, 16, 5. [Google Scholar] [CrossRef] [PubMed]
  42. Yarovaya, L.; Waranuch, N.; Wisuitiprot, W.; Khunkitti, W. Chemical and Mechanical Accelerated and Long-Term Stability Evaluation of Sunscreen Formulation Containing Grape Seed Extract. J. Cosmet. Dermatol. 2022, 21, 3. [Google Scholar] [CrossRef]
  43. Zhang, Y.; Truzzi, F.; D’Amen, E.; Dinelli, G. Effect of Storage Conditions and Time on the Polyphenol Content of Wheat Flours. Processes 2021, 9, 248. [Google Scholar] [CrossRef]
  44. Esparza, I.; Cimminelli, M.J.; Moler, J.A.; Jiménez-Moreno, N.; Ancín-Azpilicueta, C. Stability of Phenolic Compounds in Grape Stem Extracts. Antioxidants 2020, 9, 720. [Google Scholar] [CrossRef]
  45. Platzer, M.; Kiese, S.; Herfellner, T.; Schweiggert-Weisz, U.; Miesbauer, O.; Eisner, P. Common, Trends and Differences in Antioxidant Activity Analysis of Phenolic Substances Using Single Electron Transfer Based Assays. Molecules 2021, 26, 1244. [Google Scholar] [CrossRef] [PubMed]
  46. Wołosiak, R.; Drużyńska, B.; Derewiaka, D.; Piecyk, M.; Majewska, E.; Ciecierska, M.; Worobiej, E.; Pakosz, P. Verification of the Conditions for Determination of Antioxidant Activity by ABTS and DPPH Assays—A Practical Approach. Molecules 2022, 27, 50. [Google Scholar] [CrossRef]
  47. Liang, L.; Liu, Y.; Wu, L.; Weng, L.; Qiu, H.; Zhong, W.; Meng, F. Advances in Extraction Protocols, Degradation Methods, and Bioactivities of Proanthocyanidins. Molecules 2024, 29, 2179. [Google Scholar] [CrossRef] [PubMed]
  48. Antony, A.; Farid, M. Effect of Temperatures on Polyphenols during Extraction. Appl. Sci. 2022, 12, 2107. [Google Scholar] [CrossRef]
  49. Zakharov, A.Y.; Berillo, D.; Ng, A.; Aidarkhanov, D.S.; Tukesheva, A.V.; Temirkulova, K.M.; Tanybayeva, A.; Mansurov, Z.A.; Balanay, M.P.; Pavlenko, V.V. Procyanidins: Structural Properties, Production Methods, and Modern Applications. Molecules 2026, 31, 223. [Google Scholar] [CrossRef]
  50. Cosme, F.; Aires, A.; Pinto, T.; Oliveira, I.; Vilela, A.; Gonçalves, B.A. Comprehensive Review of Bioactive Tannins in Foods and Beverages: Functional Properties, Health Benefits, and Sensory Qualities. Molecules 2025, 30, 800. [Google Scholar] [CrossRef]
  51. Eugène, E.A.; N’Guessan, R.B.; Ganiyou, A.; Sawaliho, B.H. Catechin and Epicatechin. What’s the More Reactive? Comput. Chem. 2022, 10, 53–70. [Google Scholar] [CrossRef]
  52. Assoma, B.A.; Bede, L.A.; Yapo, K.D.; N’Guessan, B.R.; Say, M.V. Theoretical study of the structure and acidity of condensed tannin monomers. Int. J. Biol. Chem. Sci. 2018, 12, 2438–2445. [Google Scholar] [CrossRef]
  53. Chen, J.; Chen, Y.; Zheng, Y.; Zhao, J.; Yu, H.; Zhu, J. The Relationship between Procyanidin Structure and Their Protective Effect in a Parkinson’s Disease Model. Molecules 2022, 27, 5007. [Google Scholar] [CrossRef] [PubMed]
  54. Mrázková, M.; Sumczynski, D.; Orsavová, J. Influence of Storage Conditions on Stability of Phenolic Compounds and Antioxidant Activity Values in Nutraceutical Mixtures with Edible Flowers as New Dietary Supplements. Antioxidants 2023, 12, 962. [Google Scholar] [CrossRef] [PubMed]
  55. Gharibzahedi, S.M.T.; Jafari, S.M. The importance of minerals in human nutrition: Bioavailability, food fortification, processing effects and nanoencapsulation. Trends Food Sci. Technol. 2017, 62, 119–132. [Google Scholar] [CrossRef]
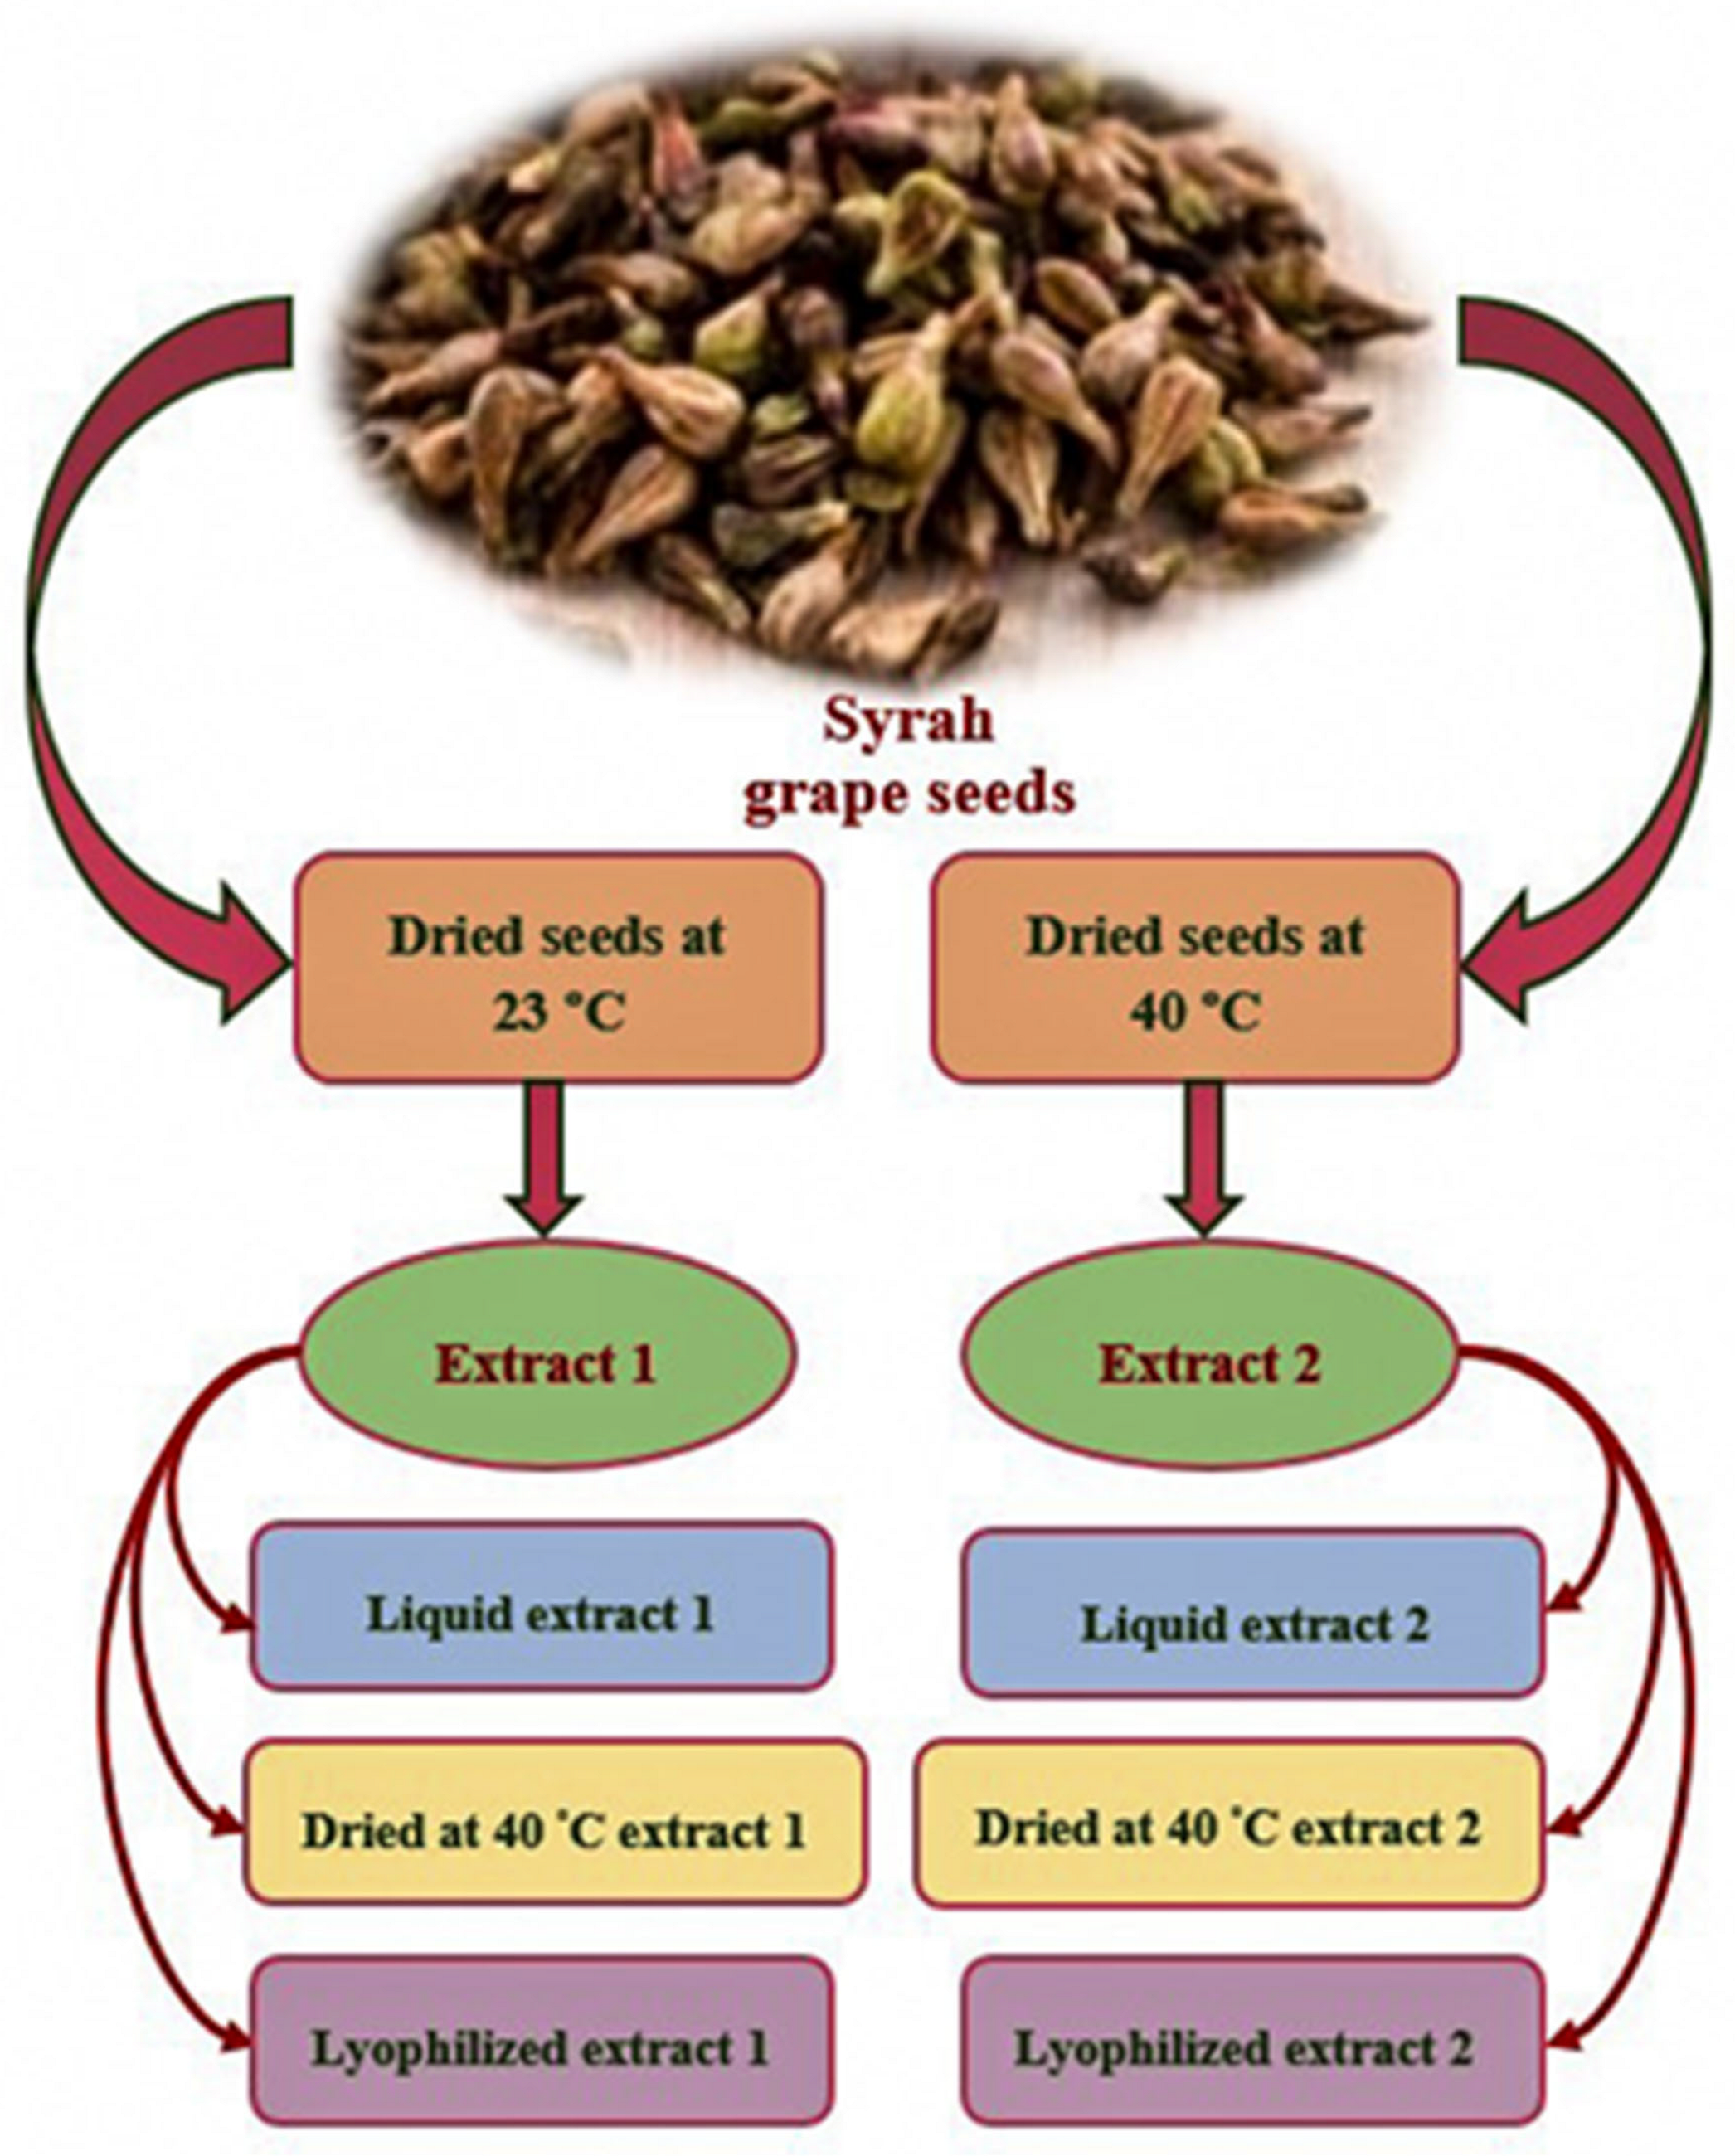
Figure 1. Types of grape seed extract samples.
Processes 14 01721 g001
Figure 2. The influence of storage conditions of grape seed extracts: (a) at 23 °C; and (b) at 4 °C on polyphenols loss, at 6 and 10 months (%). Small letters indicate significant statistical differences (p < 0.05) in polyphenols between different polyphenolic parameters (TPC, TF and PC); capital letters indicate statistically significant differences (p < 0.05) in polyphenols between samples stored for 6 and 10 months; * and ** indicate significant statistical differences (p < 0.05) in polyphenols between different forms (liquid GSE, dried GSE at 40 °C and lyophilized GSE) according to Fisher’s LSD test.
Processes 14 01721 g002
Figure 3. The influence of storage conditions of grape seeds: (a) at 23 °C; and (b) at 4 °C on antioxidant activity loss at 6 and 10 months (%). Small letters indicate statistically significant differences (p < 0.05) in antioxidant activity between samples stored for 6 and 10 months; capital letters indicate statistically significant differences (p < 0.05) in antioxidant activity between samples with different forms (DPPH and ABTS), according to Fisher’s LSD test.
Processes 14 01721 g003
Figure 4. Chromatograms of Syrah seed extract stored for 0 and 10 months in lyophilized and liquid forms. GA—gallic acid, C—(+)-catechin, EC—(−)-epicatechin, B1—procyanidin B1, B2—procyanidin B2, B3—procyanidin B3, C1—procyanidin C1.
Processes 14 01721 g004
Table 1. Gradient mode for RP-HPLC analyses of polyphenols in grape seed extracts.
Time (min)Eluent A (%)Eluent B (%)
0–79010
7–408020
40–657525
Table 2. Influence of seed drying conditions on extract yield and color characteristics of extract concentrates.
Seed Drying Temperature (°C)Yield (%)Color Brightness
(L* Value)
Red Component of the Color (a* Value)Yellow Component of the Color (b* Value)
23.00 ± 0.0011.70 ± 0.11 b30.05 ± 0.09 a17.29 ± 0.35 a8.83 ± 0.04 b
40.00 ± 0.0012.79 ± 0.06 a29.76 ± 0.35 a15.24 ± 0.12 b9.57 ± 0.10 a
Standard deviation: mean ± SD (n = 3). Different letters within each column indicate significant statistical differences (p < 0.05) among the samples, according to Fisher’s LSD test.
Table 3. The influence of storage conditions on polyphenolic values of different forms of grape seed extracts, stored at 23 °C and at 4 °C in a dark place.
StorageStorage
Period
ParametersLiquid GSEDried GSE at 40 °CLyophilized GSE
0
month
TPC (mg GAE/g dw)240.98 ± 2.80241.23 ± 2.96243.78 ± 3.21
TF (mg QE/g dw)164.55 ± 2.03168.52 ± 2.25171.02 ± 2.23
PC (mg CE/g dw)130.99 ± 1.45135.34 ± 1.73138.57 ± 1.77
23 °C3
months
TPC (mg GAE/g dw)220.94 ± 0.69 a,B,**237.25 ± 1.36 a,B,*241.84 ± 1.82 a,B,*
TF (mg QE/g dw)155.98 ± 0.49 a,B,*163.47 ± 0.69 a,B,*170.37 ± 1.22 a,B,*
PC (mg CE/g dw)122.75 ± 0.66 a,B,*130.92 ± 0.44 a,B,*135.89 ± 0.62 a,B,*
6
months
TPC (mg GAE/g dw)194.22 ±1.56 b,B,**230.96 ± 0.09 b,B,*237.70 ± 1.07 b,B,*
TF (mg QE/g dw)136.17 ± 0.37 b,B,*150.94 ± 1.16 b,B,*159.29 ± 1.30 b,B,*
PC (mg CE/g dw)98.24 ± 0.11 b,B,*115.69 ± 0.90 b,B,*119.64 ± 0.54 b,B,*
10 monthsTPC (mg GAE/g dw)162.06 ± 0.37 c,B,**212.14 ± 1.39 c,B,*216.22 ± 1.71 c,B,*
TF (mg QE/g dw)44.20 ± 0.11 c,B,*93.93 ± 0.56 c,B,*94.20 ± 0.49 c,B,*
PC (mg CE/g dw)39.44 ± 0.62 c,B,*58.36 ± 0.51 c,B,*61.50 ± 0.40 c,B,*
4 °C3
months
TPC (mg GAE/g dw)227.58 ± 1.63 a,A,**238.55 ± 1.10 a,A,*242.41 ± 1.01 a,A,*
TF (mg QE/g dw)159.34 ± 0.76 a,A,*164.39 ± 1.47 a,A,*170.51 ±1.03 a,A,*
PC (mg CE/g dw)125.89 ± 0.62 a,A,*132.96 ± 0.82 a,A,*138.38 ± 0.89 a,A,*
6
months
TPC (mg GAE/g dw)215.71 ± 0.39 b,A,**236.03 ±1.82 b,A,*239.46 ± 0.95 b,A,*
TF (mg QE/g dw)144.69 ± 0.90 b,A,*154.80 ± 0.59 b,A,*159.58 ± 0.68 b,A,*
PC (mg CE/g dw)120.74 ± 0.66 b,A,*129.82 ± 0.89 b,A,*134.20 ± 1.39 b,A,*
10 monthsTPC (mg GAE/g dw)182.66 ± 0.81 c,A,**220.47 ± 0.76 c,A,*223.96 ± 1.34 c,A,*
TF (mg QE/g dw)104.00 ± 0.33 c,A,*121.25 ± 0.81 c,A,*136.71 ± 0.71 c,A,*
PC (mg CE/g dw)107.69 ± 0.89 c,A,*119.00 ± 0.14 c,A,*122.54 ± 0.68 c,A,*
Standard deviation: mean ± SD (n = 3). Small letters within each column indicate significant statistical differences (p < 0.05) in polyphenols between sample storage for different storage times; * and ** indicate statistically significant differences (p < 0.05) in polyphenols between samples with different forms (liquid GSE, dried GSE at 40 °C and lyophilized GSE); capital letters indicate statistically significant differences (p < 0.05) in polyphenols between samples stored at different temperatures (23 °C and 4 °C), according to Fisher’s LSD test.
Table 4. The influence of storage conditions on antioxidant capacities (%), measured by DPPH and ABTS methods of liquid, dried, and lyophilized grape seed extracts, stored at 23 °C and at 4 °C in a dark place.
StorageStorage
Period
Antioxidant Activity
(%)
Liquid GSEDried GSE at 40 °CLyophilized GSE
0
month
DPPH84.68 ± 2.0785.98 ± 2.0586.35 ± 2.02
ABTS79.88 ± 1.8680.06 ± 1.8081.07 ± 1.82
23 °C3
months
DPPH81.95 ± 0.25 a,B81.93 ± 0.11 a,B83.18 ± 1.49 a,B
ABTS76.28 ± 0.84 a,B76.47 ± 0.60 a,B76.84 ± 0.23 a,B
6
months
DPPH75.04 ± 0.25 b,B75.63 ± 0.41 b,B78.31 ± 1.59 b,B
ABTS63.05 ± 0.23 b,B67.33 ± 0.72 b,B70.02 ± 0.92 b,B
10 monthsDPPH61.44 ± 0.97 c,B70.62 ± 1.15 c,B72.20 ± 1.44 c,B
ABTS23.46 ± 0.61 c,B32.41 ± 1.19 c,B32.58 ± 0.59 c,B
4 °C3
months
DPPH85.12 ± 1.10 a,A85.59 ± 0.91 a,A86.69 ± 0.90 a,A
ABTS79.81 ± 1.03 a,A80.31 ± 0.87 a,A80.87 ± 0.40 a,A
6
months
DPPH83.00 ± 0.30 b,A83.10 ± 0.06 b,A83.87 ± 0.64 b,A
ABTS67.87 ± 0.80 b,A71.06 ± 0.24 b,A72.92 ± 1.22 b,A
10 monthsDPPH77.04 ± 0.71 c,A77.45 ± 1.44 c,A79.29 ± 0.51 c,A
ABTS31.27 ± 0.54 c,A42.60 ± 0.57 c,A42.81 ± 0.27 c,A
Standard deviation: mean ± SD (n = 3). Small letters indicate statistically significant differences (p < 0.05) in antioxidant activity between sample storage for different storage times (3, 6, and 10 months); capital letters indicate statistically significant differences (p < 0.05) in antioxidant activity between samples stored at different temperatures (23 °C and 4 °C), according to Fisher’s LSD test.
Table 5. Degradation kinetic parameters, on the basis of antioxidant capacity of the liquid and dried samples at 40 °C and lyophilized extracts during 10 months of storage at 23 °C and 4 °C in a dark place.
Type of ExtractDPPH Antioxidant Activity
23 °C4 °C
k
(Month−1)
R2D
(Month)
t1/2
(Month)
k
(Month−1)
R2D
(Month)
t1/2
(Month)
Q10
(4–23 °C)
Liquid0.032 ± 0.0050.92669.79 ± 0.7221.3 ± 0.250.010 ± 0.0020.828230.20 ± 2.5673.7 ± 0.651.85 ± 0.18
Dried at 40 °C0.020 ± 0.0040.991115.15 ± 1.2234.1 ± 0.410.009 ± 0.0010.913255.89 ±2.4875.3 ± 0.761.61 ± 0.15
Lyophilized0.018 ± 0.0030.990127.94 ± 1.3138.1 ± 0.430.008 ± 0.0010.894287.88 ±3.0179.6 ± 0.781.54 ± 0.14
ABTS Antioxidant Activity
23 °C4 °C
k
(Month−1)
R2D
(Month)
t1/2
(Month)
k
(Month−1)
R2D
(Month)
t1/2
(Month)
Q10
(4–23 °C)
Liquid0.122 ± 0.0140.81418.88 ± 0.755.7 ± 0.070.094 ± 0.0100.79624.50 ± 0.887.4 ± 0.081.15 ± 0.09
Dried at 40 °C0.089 ± 0.0090.81525.87 ± 0.927.8 ± 0.080.062 ± 0.0070.80737.14 ± 0.9810.2 ± 0.091.21 ± 0.12
Lyophilized0.087 ± 0.0090.80126.47 ± 0.957.9 ± 0.090.064 ± 0.0080.79735.98 ± 0.8710.9 ± 0.091.18 ± 0.10
Standard deviation: mean ± SD (n = 3), Kkreaction rate constant, t1/2—half-life time, D—quality criterion to lose 90% of AO activity and Q10—quotient indicator.
Table 6. Polyphenols in lyophilized and liquid Syrah grape seed extracts, analyzed by HPLC at 0 and 10 months, in mg/g expressed by dry weight (n = 5). Values in parentheses indicate decrease percentage to the initial values of the individual compounds during storage for 10 months., only for the gallic acid percentage increase.
CompoundsInitial Extract,
0 Month
Lyophilized Extract,
Stored at 10 Months
Liquid Extract.
Stored at 10 Months
23 °C4 °C23 °C4 °C
Gallic acid0.92 ± 0.061.07 ± 0.00 a,B
(14.02%)
increase
1.04 ± 0.00 b,B
(11.54%)
increase
1.88 ± 0.03 a,A
(51.06%)
increase
1.11 ± 0.00 b,A
(17.12%)
increase
Procyanidin B111.87 ± 0.4511.71 ± 0.0.05 b,A
(1.35%)
11.79 ± 0.01 a,A
(0.68%)
7.86 ± 0.06 b,B
(33.78%)
11.45 ± 0.06 a,B
(3.54%)
Procyanidin B30.61 ± 0.060.54 ± 0.00 b,B
(11.48%)
0.55 ± 0.01 a,B
(9.84%)
0.01 ± 0.00 b,A
(98.36%)
0.43 ± 0.03 a,A
(29.51%)
(+)-Catechin22.01 ± 0.8820.30 ± 0.00 b,A
(7.77%)
20.86 ± 0.07 a,A
(5.23%)
1.76 ± 0.00 b,B
(92.01%)
17.05 ± 0.05 a,B
(22.54%)
Procyanidin B26.59 ± 0.215.97 ± 0.00 b,A
(9.41%)
5.98 ± 0.00 a,A
(9.26%)
3.27 ± 0.05 b,B
(50.38%)
5.53 ± 0.02 a,B
(16.08%)
(−)-Epicatechin10.12 ± 0.437.86 ± 0.01 b,B
(22.33%)
8.48 ± 0.03 a,B
(16.21%)
0.01 ± 0.00 b,A
(99.9%)
6.71 ± 0.05 a,A
(33.70%)
Procyanidin C11.23 ± 0.140.91 ± 0.01 b,A
(26.02%)
0.91 ± 0.00 a,A
(26.02%)
0.003 ± 0.00 b,B
(99.76%)
0.78 ± 0.02 a,B
(36.59%)
Standard deviation: mean ± SD (n = 3). Small letters indicate statistically significant differences (p < 0.05) in individual compound content between samples stored at different temperatures (23 °C and 4 °C); capital letters indicate statistically significant differences (p < 0.05) in individual compound contents between samples with different forms (lyophilized and liquid extract), according to Fisher’s LSD test.
Table 7. Nutrient composition and mineral profile of Syrah grape seed extract.
Parameters(%)Elements(mg/kg)
Ash1.11 ± 0.10Al2.71 ± 0.14
Moisture9.41 ± 0.56Fe6.48 ± 0.26
Protein10.5 ± 0.45K4367 ± 42.15
Fat1.66 ± 0.17Ca223.27 ± 2.05
Fatty acid composition: saturated fatty acids0.27 ± 0.05Mg223.03 ± 2.03
Carbohydrates77.29 ± 3.10Cu10.33 ± 1.45
Total sugar (invert)64.04 ± 3.90Na<49.77 ± 1.12
Crude cellulose (water-insoluble fiber)<0.03 ± 0.021Se<0.10 ± 0.03
Chlorides<0.36 ± 0.067P1416± 21.96
Energy value366.2 ± 0.52 (kcal/100 g)Cr0.33 ± 0.087
Zn8.06 ± 0.32
Standard deviation: mean ± SD (n = 3).
Disclaimer/Publisher’s Note: The statements, opinions and data contained in all publications are solely those of the individual author(s) and contributor(s) and not of MDPI and/or the editor(s). MDPI and/or the editor(s) disclaim responsibility for any injury to people or property resulting from any ideas, methods, instructions or products referred to in the content.