Article

Numerical Simulation of the Influence of Heterogeneity and Fracture Geometry on Rock Mechanical Properties and Energy Characteristics

1
School of Energy and Mining Engineering, China University of Mining and Technology (Beijing), Beijing 100083, China
2
Inner Mongolia Research Institute, China University of Mining and Technology (Beijing), Ordos 017010, China
3
China Coal Research Institute, Beijing 100013, China
*
Author to whom correspondence should be addressed.
Processes 2026, 14(11), 1709; https://doi.org/10.3390/pr14111709
Submission received: 16 April 2026 / Revised: 16 May 2026 / Accepted: 20 May 2026 / Published: 25 May 2026

Abstract

The geometric characteristics of these fractures have a substantial influence on the mechanical and energy properties of heterogeneous rocks. This study calibrated the experimental results using the finite-discrete element method (FDEM). An orthogonal design was employed to investigate the effects of the homogeneity coefficient, fracture angle, fracture length, and fracture aperture on the mechanical and energy characteristics of fractured sandstone. The main factors influencing the mechanical properties and energy characteristics of rocks were explored through multi-factor correlation analysis. The effects of fracture geometric features and heterogeneity on the mechanical properties and energy characteristics of rocks were analyzed by single-factor analysis. A regression model between peak stress and fracture geometric features was established. The results show the following: The homogeneity coefficient and fracture length have a significant impact on the elastic modulus of fractured sandstone. The fracture angle and fracture length have a significant influence on the peak strain, elastic strain energy and total energy of fractured sandstone. The fracture angle, fracture length and homogeneity coefficient have a significant effect on the peak stress of fractured sandstone. The elastic modulus and peak stress show a logarithmic relationship with the homogeneity coefficient, while the elastic strain energy and total energy have a logarithmic relationship with the crack length. The peak strain and peak stress have a quadratic polynomial relationship with the crack angle, and the elastic strain energy and total energy also have a quadratic polynomial relationship with the crack angle. The elastic modulus, peak strain, and peak stress have a logarithmic relationship with the crack length. The predicted values of peak stress and numerical calculation errors of fractured rocks mainly range from 0.07% to 7.76%, with an average error of 2.58%. Both the peak stress prediction values and the numerical calculation results show a “U”-shaped change trend, first decreasing and then increasing with the increase in the fracture angle. This study investigates the influence of fracture geometric characteristics on the mechanical and energy characteristics of heterogeneous rocks, which is of great significance for the stability control of fractured rock masses and the optimization of underground engineering parameters. The core challenge for future research lies in revealing the intrinsic connection among fracture geometric features, rock mass heterogeneity, and multi-field coupling effects to meet the complex engineering demands of deep mining, thereby serving the safe production and disaster prevention of deep mines.

1. Introduction

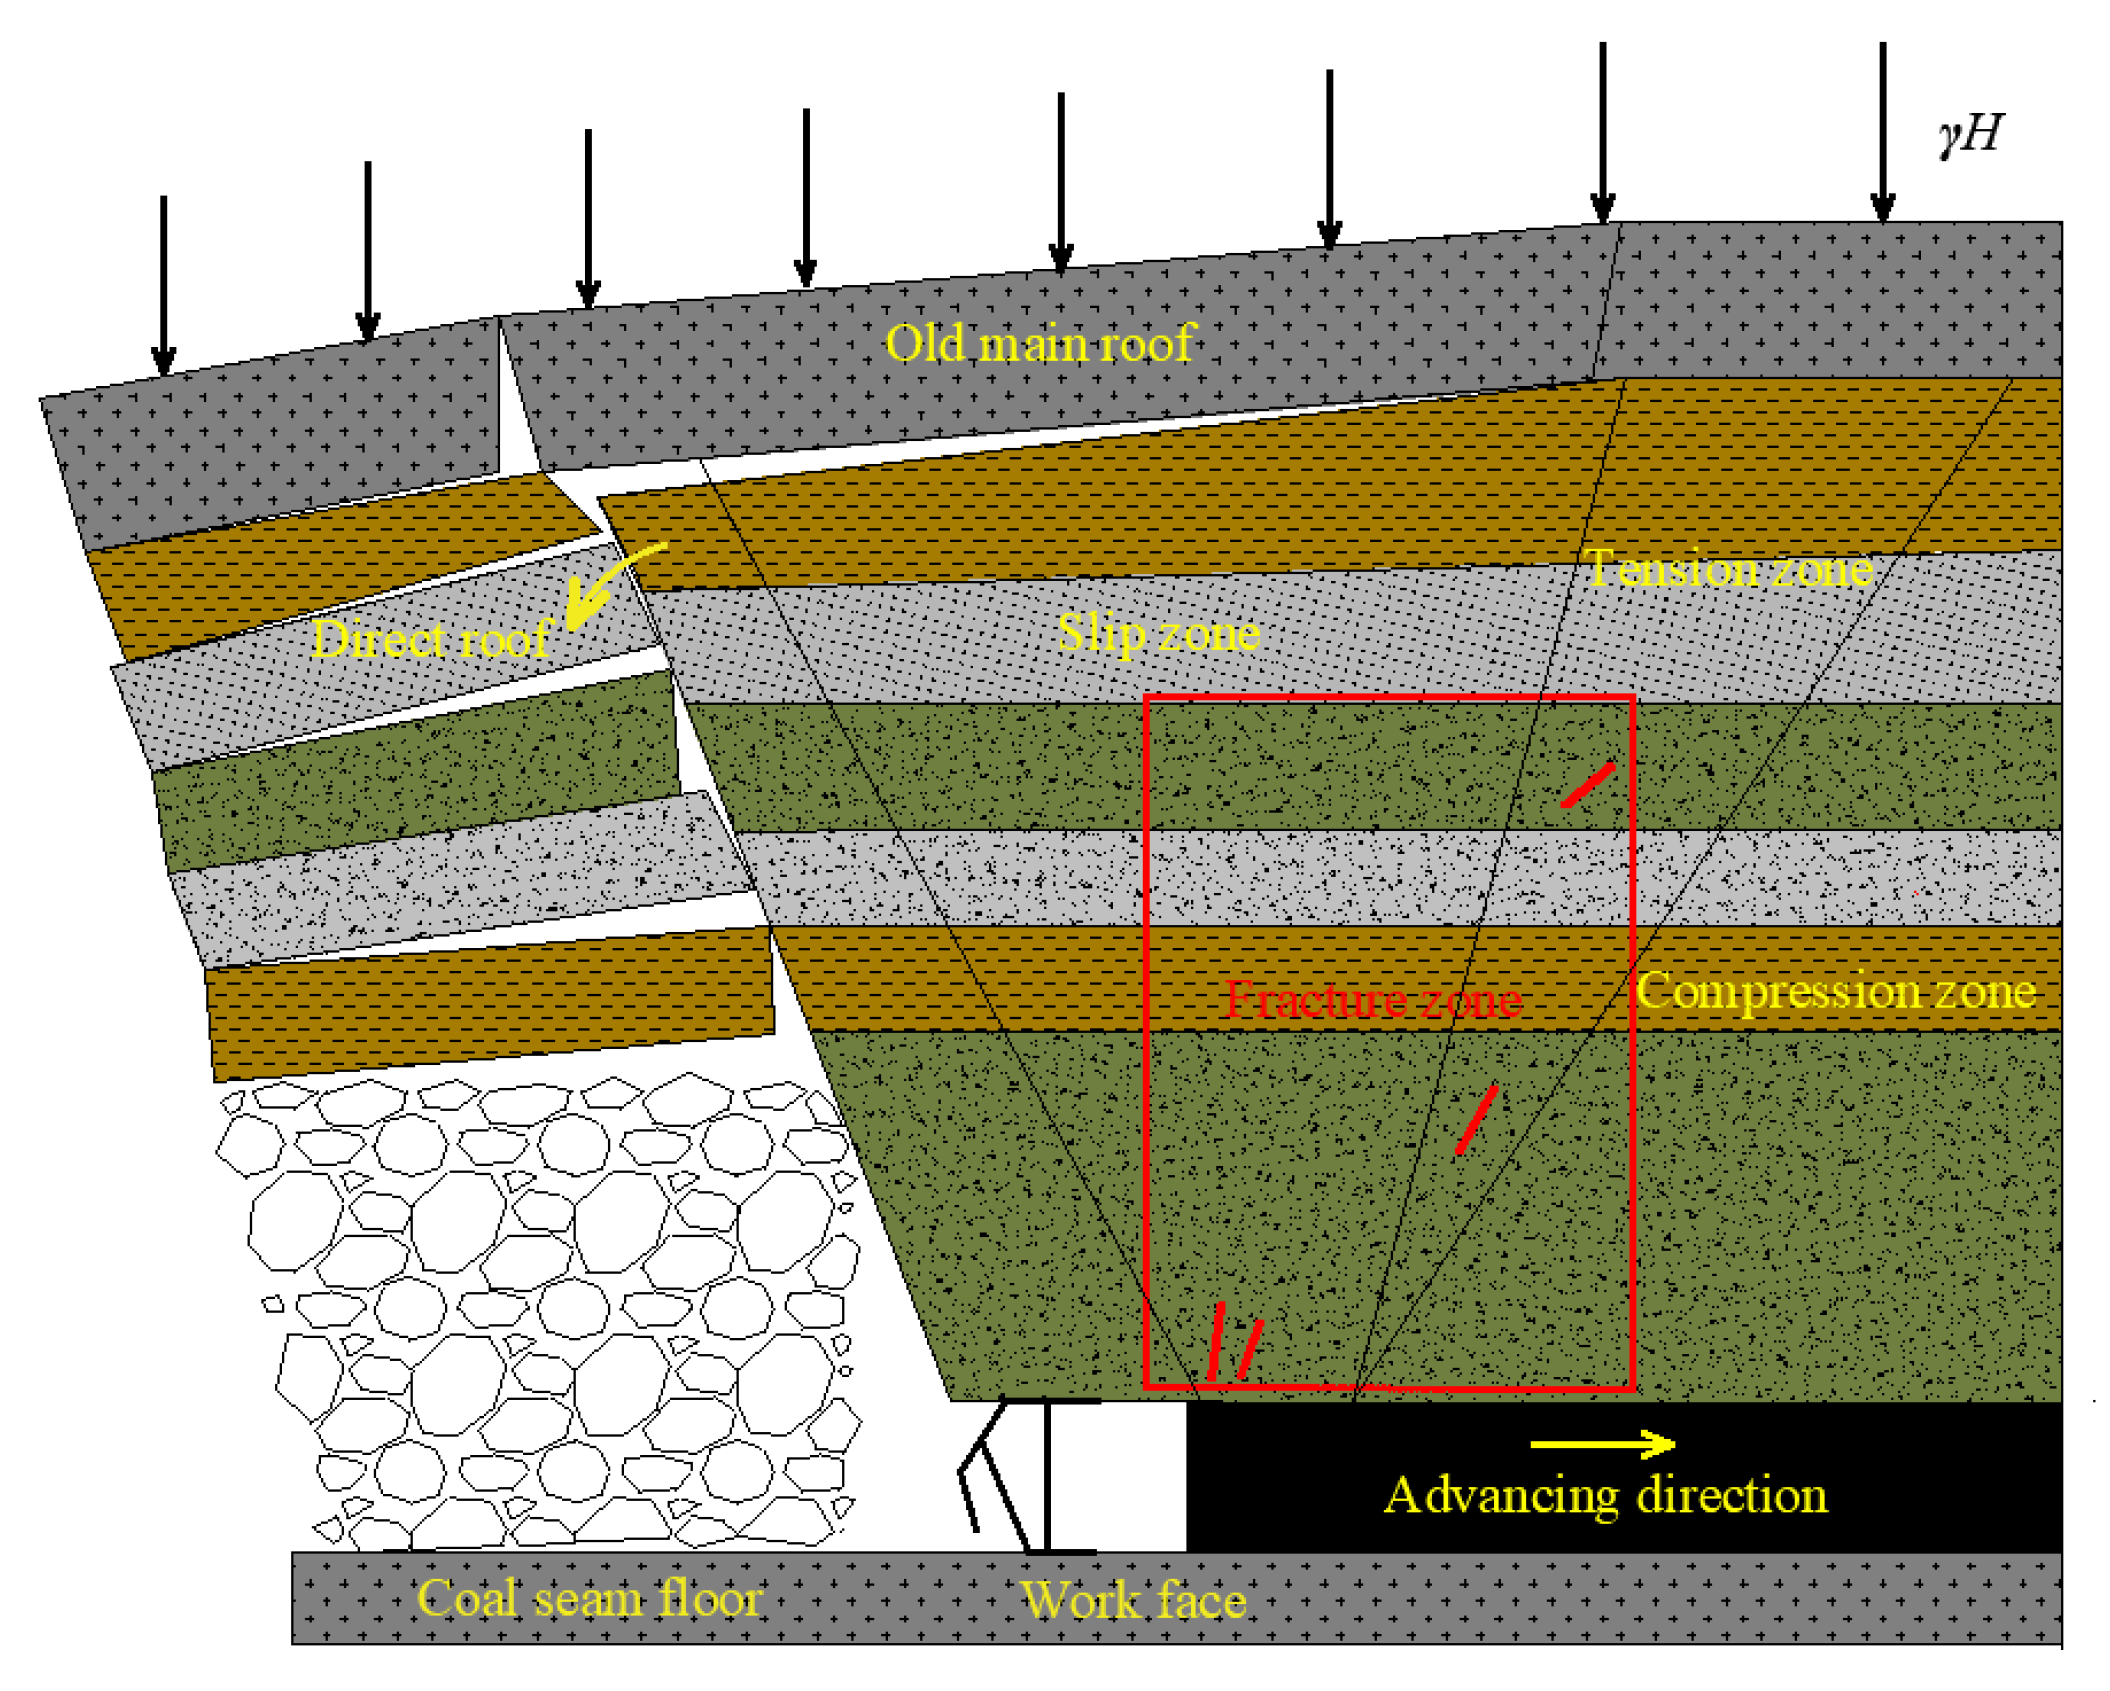
As a naturally formed heterogeneous entity, rocks have a complex internal structure due to substantial differences in the chemical composition, grain size, morphology, and spatial distribution of the constituent minerals. The inherent heterogeneity of rocks has a significant impact on the strength, stiffness, deformation process, and the ultimate fracture mechanism [1,2,3,4]. Underground engineering activities, including blasting, drilling, and excavation, have the potential to initiate or exacerbate the propagation of internal cracks in rocks, causing micro-cracks to evolve into macroscopic fractures [5,6,7]. The presence of fractures substantially weakens the mechanical properties of rocks, consequently leading to various engineering geological disasters, including tunnel collapses, slope instability, and microseism in underground mines [8,9,10]. As shown in Figure 1, when underground coal seams are mined, the roof can be divided into compression zones, tension zones and shear zones according to the stress state [11]. Due to stress concentration, cracks appear in a certain range in front of the hydraulic support, and there are also many discontinuous natural cracks in the rock strata [12,13,14]. The interaction between various cracks and the surrounding rock directly affects the performance and service life of the hydraulic support, and also poses serious safety hazards to the working face. As coal mining gradually progresses to greater depths, dynamic geological disasters are becoming increasingly prominent [15,16]. Deep coal seam mining results in the formation of complex multi-crack interactions within the strata. Analyzing the mechanical properties and energy characteristics of single-crack rocks under uniaxial compression can help understand the stress concentration mechanism, failure mode transformation, and energy dissipation laws in complex field environments. Therefore, studying the influence of crack geometric characteristics on the mechanical and energy characteristics of heterogeneous rocks is of great significance for the safe production of coal mines.
Currently, the primary research methods for rock mechanical properties encompass field measurement, laboratory experiments, and numerical simulation. Among these, the rock mechanical properties acquired through field measurement methods are relatively reliable. Nevertheless, owing to intricate geological conditions, high measurement costs, and challenging construction, the field measurement method for rock mechanical properties has not been extensively applied thus far [17,18,19,20]. In the context of laboratory experiments, Huang et al. [21] conducted an investigation into the influence of fracture angle on the mechanical properties of rocks. They discovered that the elastic modulus and peak strength of fractured rocks increase as the fracture angle increases. Wang et al. [22] conducted an investigation into the influence of fracture length and fracture angle on the mechanical properties of rock-like materials. Their findings indicated that the peak strength of rock-like materials exhibits an inverse proportionality to the crack length, whereas the crack angle exerts a relatively minor influence on the peak strength of rock-like materials. Liu and Jiang et al. [23,24] conducted an investigation into the influence of fracture angle on the mechanical properties of rocks. They discovered that the peak strength of fractured rocks initially decreased and subsequently increased as the fracture angle changed. Qin et al. [25] conducted an analysis of the influence of fracture angle, connectivity, spacing, and roughness on the mechanical properties of rocks and the mechanism of crack propagation. They discovered that the peak strength exhibited a “V”-shaped distribution, initially decreasing and subsequently increasing as the fracture angle increased. The peak strength declined with the increase in fracture spacing, connectivity, and aperture. Yang et al. [26] analyzed the influence of confining pressure and different crack distribution patterns on the mechanical properties of rocks, and concluded that the triaxial compressive strength of rocks increases linearly with the increase in confining pressure, but increases nonlinearly with the increase in crack angle. Li et al. [27] conducted an investigation into the influence of different crack locations and crack spacings on the mechanical properties of rocks. They discovered that when the distance from the horizontal single crack to the end of the specimen decreased and the spacing between the double cracks increased, the mechanical properties of the rocks exhibited a significant decline. Shan et al. [28,29] investigated the influence of different fracture roughness and fracture angles on the mechanical properties of rocks. They found that the peak stress increased with the increase in roughness, and the peak stress decreased first and then increased with the increase in fracture angle. These studies indicated that the mechanical properties of rocks are closely associated with the distribution form and geometric characteristics of the fractures.
Owing to the high cost and lengthy time cycle of laboratory experiments, numerical simulation has emerged as a crucial approach for investigating the mechanical behavior of rocks [30,31]. Numerical simulation encompasses three methods: the finite element method (FEM), the discrete element method (DEM), and the finite-discrete element method (FDEM). In comparison with the finite element method, the discrete element method (DEM) and the finite-discrete element method (FDEM) are capable of simulating the movement and separation of blocks and are more appropriate for studying the crack propagation and failure mechanism of rocks [20]. In the domain of the discrete element method (DEM), Jiang et al. [32] conducted an investigation into the multi-parameter phased characteristics of acoustic emission in rocks under uniaxial compression and discovered that tensile cracks were predominantly generated during the loading process. Chen et al. [33] conducted an investigation into the influence of various crack forms on the strength and deformation characteristics of rocks. Their findings indicated that the horizontal crack model exerts a more significant impact on the peak strength, peak strain, and elastic modulus of rocks compared to the vertical crack model. Liu et al. [34] conducted an investigation into the influence of varying numbers of fractures on the mechanical properties of rocks and the energy evolution law. Their findings indicated that as the number of fractures increases, the elastic modulus of rocks gradually decreases. Liu et al. [35] proposed an elastic–brittle bonding model to characterize the bonding force at different locations within a block. This model is capable of not only effectively simulating the fracture between blocks but also comprehensively replicating the fracture behavior within the block.
The Finite-Discrete Element Method (FDEM) integrates the advantages of the finite element method (FEM) and the discrete element method (DEM), and it is capable of effectively simulating the rock fracture process [36,37]. At present, FDEM primarily encompasses the ICZM and ECZM. In order to enhance the computational efficiency of FDEM, CPU or GPU acceleration techniques are frequently employed [38,39,40]. Owing to the low memory consumption and ease of parallelization in FDEM calculations, Fukuda and Liu et al. [41,42] employed CUDA technology to develop a general GPU-parallelized version of the operation program. Meanwhile, Maeda et al. [39] implemented the leader–follower algorithm to substitute the complex and hard-to-parallelize adaptive mesh repartitioning process in the traditional ECZM, thereby attaining efficient parallelization of ECZM-FDEM on GPGPU. In the domain of the finite-discrete element method (FDEM), Deng et al. [43,44,45] put forward a micromechanical calibration method and explored the influence of the size effect on the mechanical properties of soft–hard interbedded rocks. It was demonstrated that both the peak strength and the elastic modulus of composite rock samples declined as the height-to-diameter ratio of the samples increased. Moreover, it was noted that composite failure represents the fundamental failure mode of layered rock masses. Liu et al. [46] developed a numerical model of heterogeneity to investigate the mechanical properties and damage evolution characteristics of rocks under uniaxial compression. Their research indicated that the variation in the number of shear micro-cracks exhibits a high degree of consistency with the actual macroscopic failure mode of rocks. Yuan et al. [47] conducted an investigation into the influence of crack angle, length, and position on the mechanical properties of rocks and the law of energy evolution. They discovered that when the crack angle was 40° and the crack length was 15 mm, the rock sample could effectively release elastic energy. Duan et al. [2] investigated the influence of the rock heterogeneity coefficient on mechanical properties and found that the peak stress decreased as the heterogeneity coefficient increased. Deng et al. [30] investigated the influence of the rock homogeneity coefficient on mechanical properties and found that the peak stress increased with the increase in the homogeneity coefficient. The above research indicates that the FDEM numerical method can be applied to study the influence of fracture characteristics and homogeneity on the mechanical properties of rocks and crack propagation. This will contribute to a deeper understanding of rock failure mechanisms, thereby providing a theoretical basis for the prediction and prevention of deep rock mass disasters.
The relevant research on the influence of fracture geometric characteristics on rock mechanical properties in recent years is shown in Table 1. Analysis of Table 1 reveals that existing research mainly investigates the influence of a few factors of fracture geometric characteristics (angle, length, aperture, shape, position, roughness, and quantity) on the mechanical properties of homogeneous rocks through the control variable method. The research schemes typically involve 4 to 30 tests. However, studies that comprehensively consider the coupling effects of multiple factors of fracture geometric characteristics and rock heterogeneity on rock mechanical properties are relatively scarce. Based on this background, this paper calibrates the parameters of the laboratory uniaxial compression test results based on the FDEM numerical method. By designing orthogonal experiments (81 groups), it reveals the influence of the coupling effect of four factors—heterogeneity, fracture angle, fracture length, and fracture aperture—on the mechanical and energy characteristics of rocks. Finally, a regression model of the peak stress of fractured sandstone and the geometric characteristics of fractures is established, and the rationality of the model is verified. This research helps to deepen the understanding of the main controlling factors of rock mechanical and energy characteristics, and at the same time, is conducive to promoting the safe and efficient production of coal mines.

2. Numerical Models and Methods

2.1. Governing Equations

FDEM divides the rock into triangular elements. The deformation of the triangular elements follows Newton’s second law. The motion equation of each time step is calculated using the second-order forward difference method. The motion equation of the nodes is:
M x ¨ + C x ˙ = F
where M is the mass of the element node, C is the damping matrix, x ¨ is the second derivative of the element node, and x ˙ is the first derivative of the element node.
C = D f 2 h ρ E I
where D f is the damping factor, h is the element size, ρ is the element density, E is the elastic modulus of the material, and I is the unit matrix.

2.2. Failure Modes and Constitutive Relations

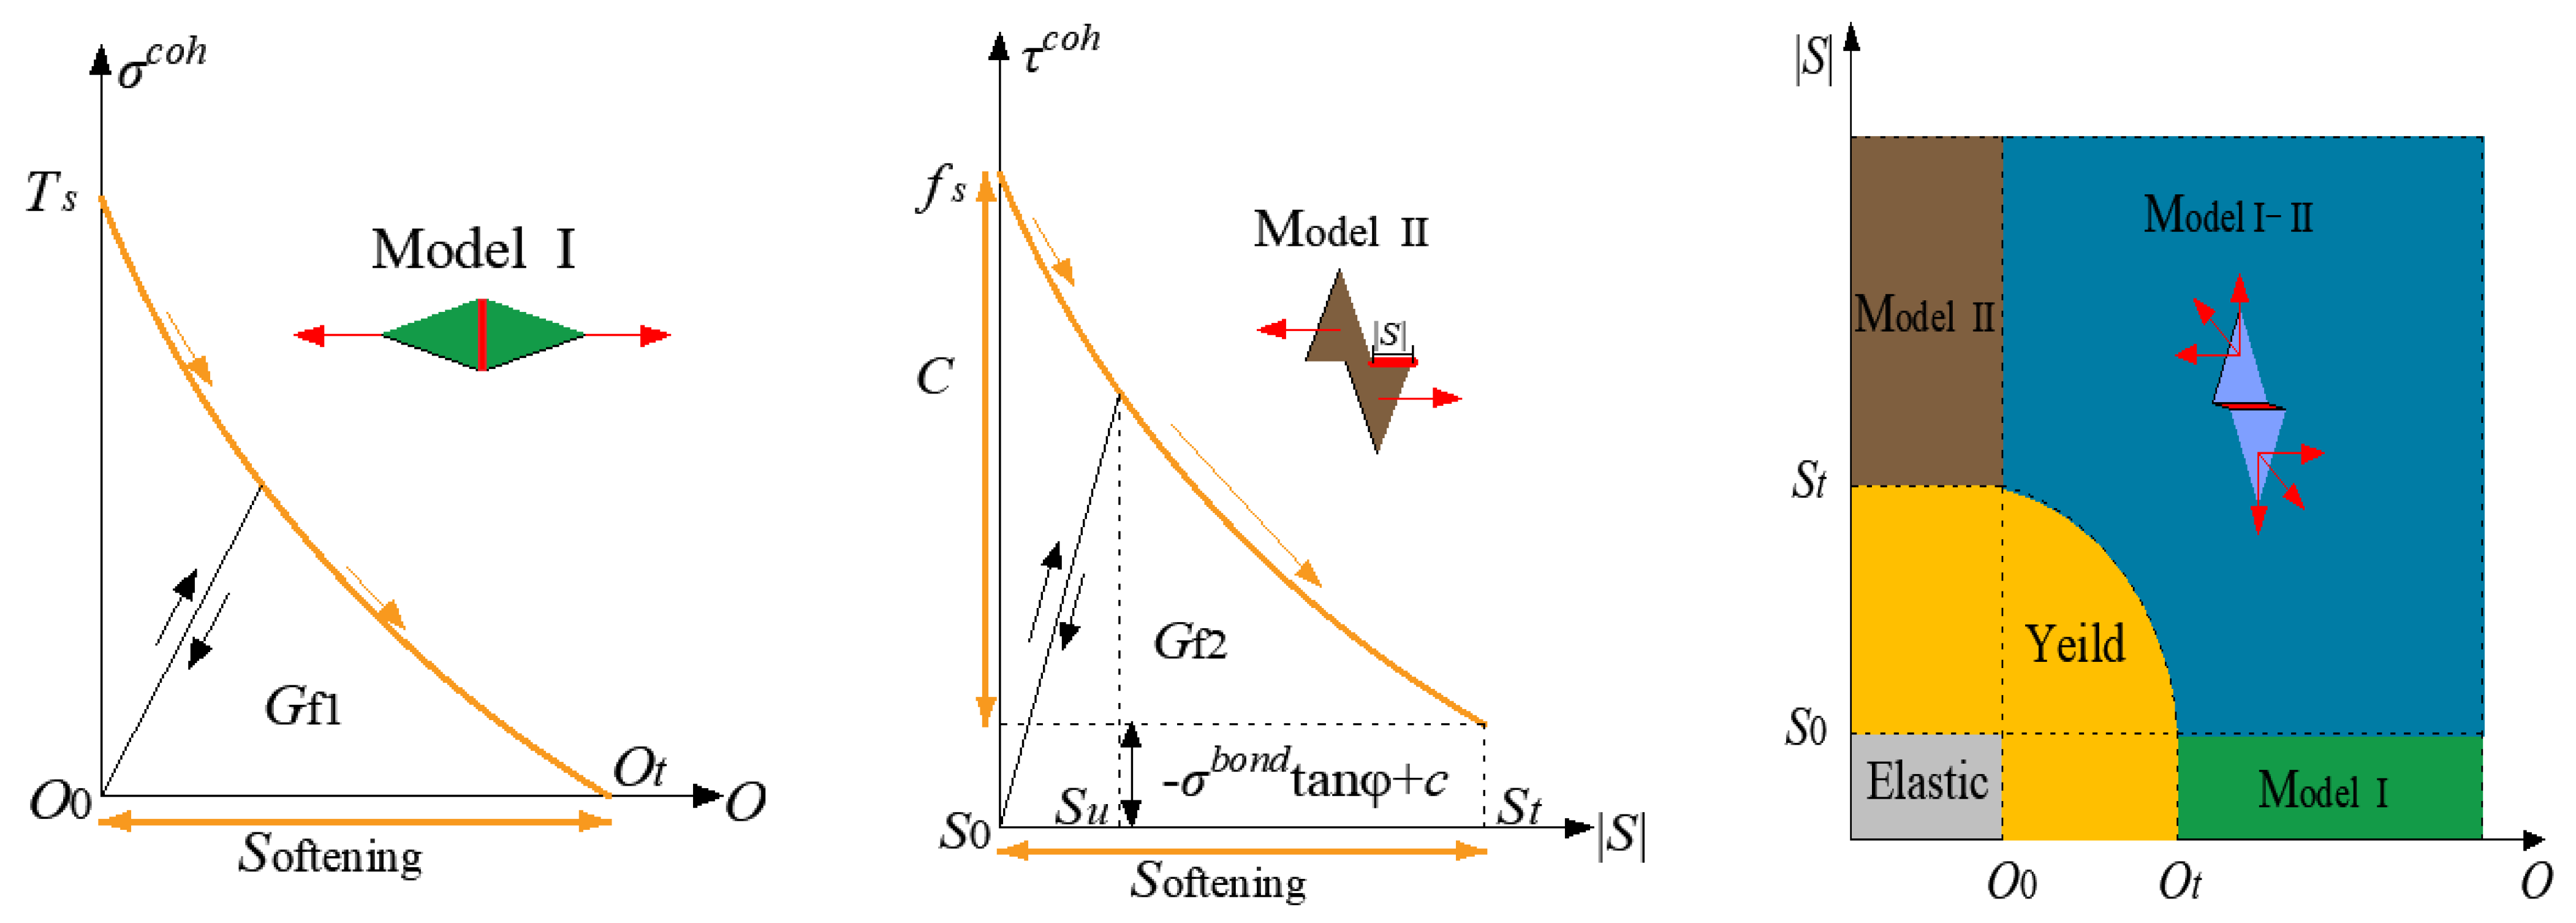
The cohesive zone model (CZM), a model in fracture mechanics, is typically employed to describe the progressive failure process of cracks. The CZM can effectively portray the crack initiation, growth, and fracture processes of diverse materials. The CZM primarily encompasses the internal cohesive zone model (ICZM) and the external cohesive zone model (ECZM) [41,48]. In the ICZM, prior to the numerical model calculation, all adjacent nodes of the triangular elements have been inserted. Once specific conditions are satisfied, the connection between the nodes will fail, and fracture will occur. In contrast to ICZM, ECZM does not insert nodes between triangular elements until the material enters the softening stage. When the normal stress at a node surpasses the tensile strength (Equation (3)) or the shear stress exceeds the shear strength (Equation (4)), nodes will be dynamically inserted between the triangular elements. Subsequently, the inserted nodes enter the softening stage of the cohesive zone model. The crack fracture propagation criterion is shown in Figure 2 [49,50]. When compared with the traditional ICZM, the ECZM not only avoids the problem of reduced numerical calculation efficiency that is caused by inserting nodes between all elements prior to numerical calculation, but also reduces the calibration parameters (no penalty parameters are required) [51]. In this research, the ECZM is employed for numerical analysis.
σ n T s
τ σ n   tan φ + c
where σn and τ is the normal stress and shear stress acting on the interface between two adjacent elements, c is cohesion, φ is the angle of internal friction, and Ts is the tensile strength.
The stress of the post-peak joint element is reduced and redistributed. The normal force and shear force are calculated as:
σ = f D T s
τ = f D f s
where σ and τ represent the normal stress and shear stress acting on the interface between two adjacent elements, respectively, f(D) is the loss function, Ts the tensile strength, and fs is the shear strength.
D is the loss factor related to the failure type of the joint, and its calculation is as follows:
D = O O 0 O t O 0 M o d e l   I D = S S 0 S t S 0 M o d e l   II D = O O 0 O t O 0 2 + S S 0 S t S 0 2 M o d e l   I   II
f(D) is used to represent the post-peak strain softening behavior, and it is calculated using the formula (18) from relevant research [52], as follows:
f D = 1 a + b 1 a + b exp D a + c b a + b 1 a b a 1 D + b 1 D c
where a, b, and c are empirical curve fitting parameters equal to 0.63, 1.8, and 6.0, respectively.

2.3. Model Validation

The reliability of the numerical model serves as a crucial foundation for performing numerical calculations. Prior to conducting subsequent numerical analyses, it is essential to calibrate the macroscopic and microscopic parameters of heterogeneous sandstone. When conducting an analysis of rock materials from a microscopic perspective, the influence of rock heterogeneity on rock mechanical properties and failure characteristics can be described through the Weibull distribution [53,54]. The deformation parameters (elastic modulus) and strength parameters (cohesion and tensile strength) of rock materials all adhere to the Weibull distribution. In the numerical model, the elastic modulus is primarily reflected in the block element, whereas cohesion and tensile strength are primarily reflected in the quadrilateral joint element. When the elastic modulus of the rock conforms to the Weibull distribution, its probability density function is [30]:
f E = m E 0 E E 0 m 1 exp E E 0 m
where E is the elastic modulus of any triangular cell, E0 is the desired elastic modulus, and m is the homogeneity coefficient.
The cumulative distribution function corresponding to Equation (9) is as follows:
F E = 1 exp E E 0 m
According to Equation (10), the elastic modulus of any triangular element can be calculated as:
E = E 0 ln 1 1 F E 1 / m
where F(E) is a uniform distribution function between 0 and 1. Random values between 0 and 1 are assigned to all triangular elements in the FDEM numerical model.
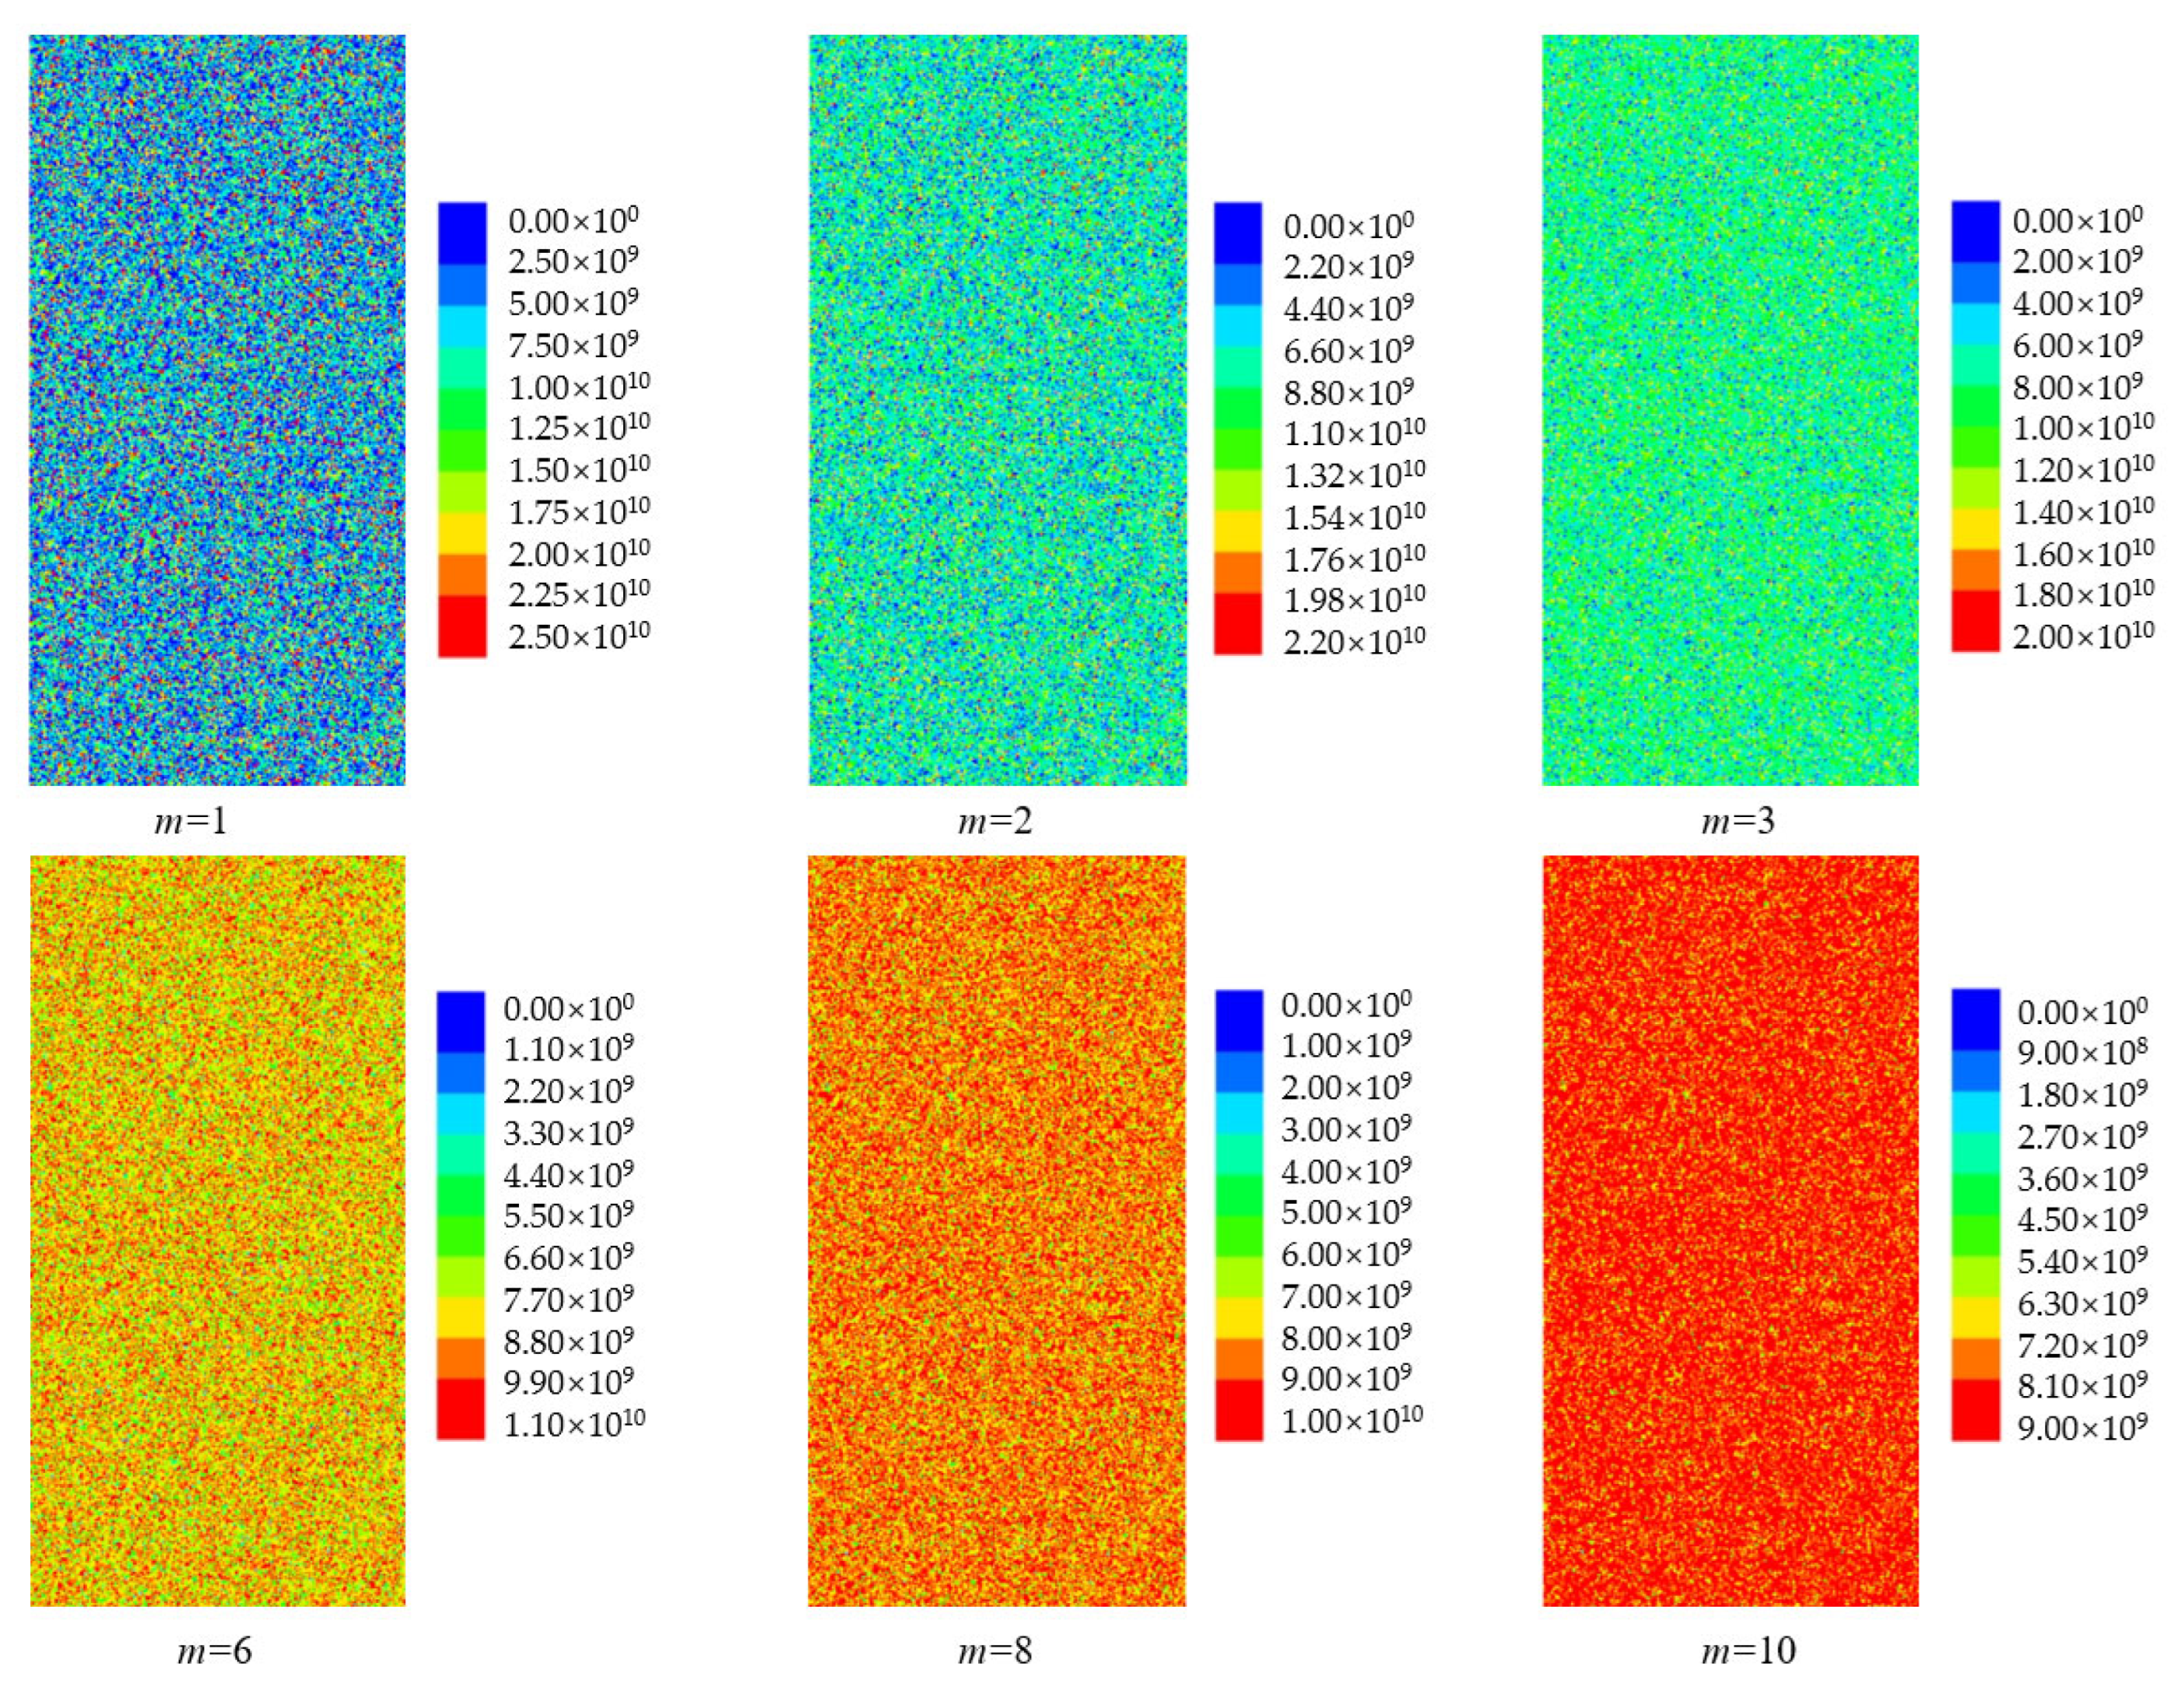
Based on Equation (11), the elastic modulus is assigned to all triangular elements. The distribution cloud diagrams of the elastic modulus for numerical models with different homogeneity coefficients are presented in Figure 3. By analyzing Figure 3, it is evident that as the homogeneity coefficient increases, the overall difference in the elastic modulus distribution cloud diagrams of the numerical models decreases, suggesting that the homogeneity of the rock is directly proportional to the coefficient of homogeneity.
The higher the elastic modulus of a rock, the greater its cohesion and tensile strength, and the following relationship exists:
E i E j = c i c j = f t i f t j
where Ei, ci, and fti are the elastic modulus, cohesion, and tensile strength of triangular element i; Ej, cj, and ftj are the elastic modulus, cohesion, and tensile strength of triangular element j.
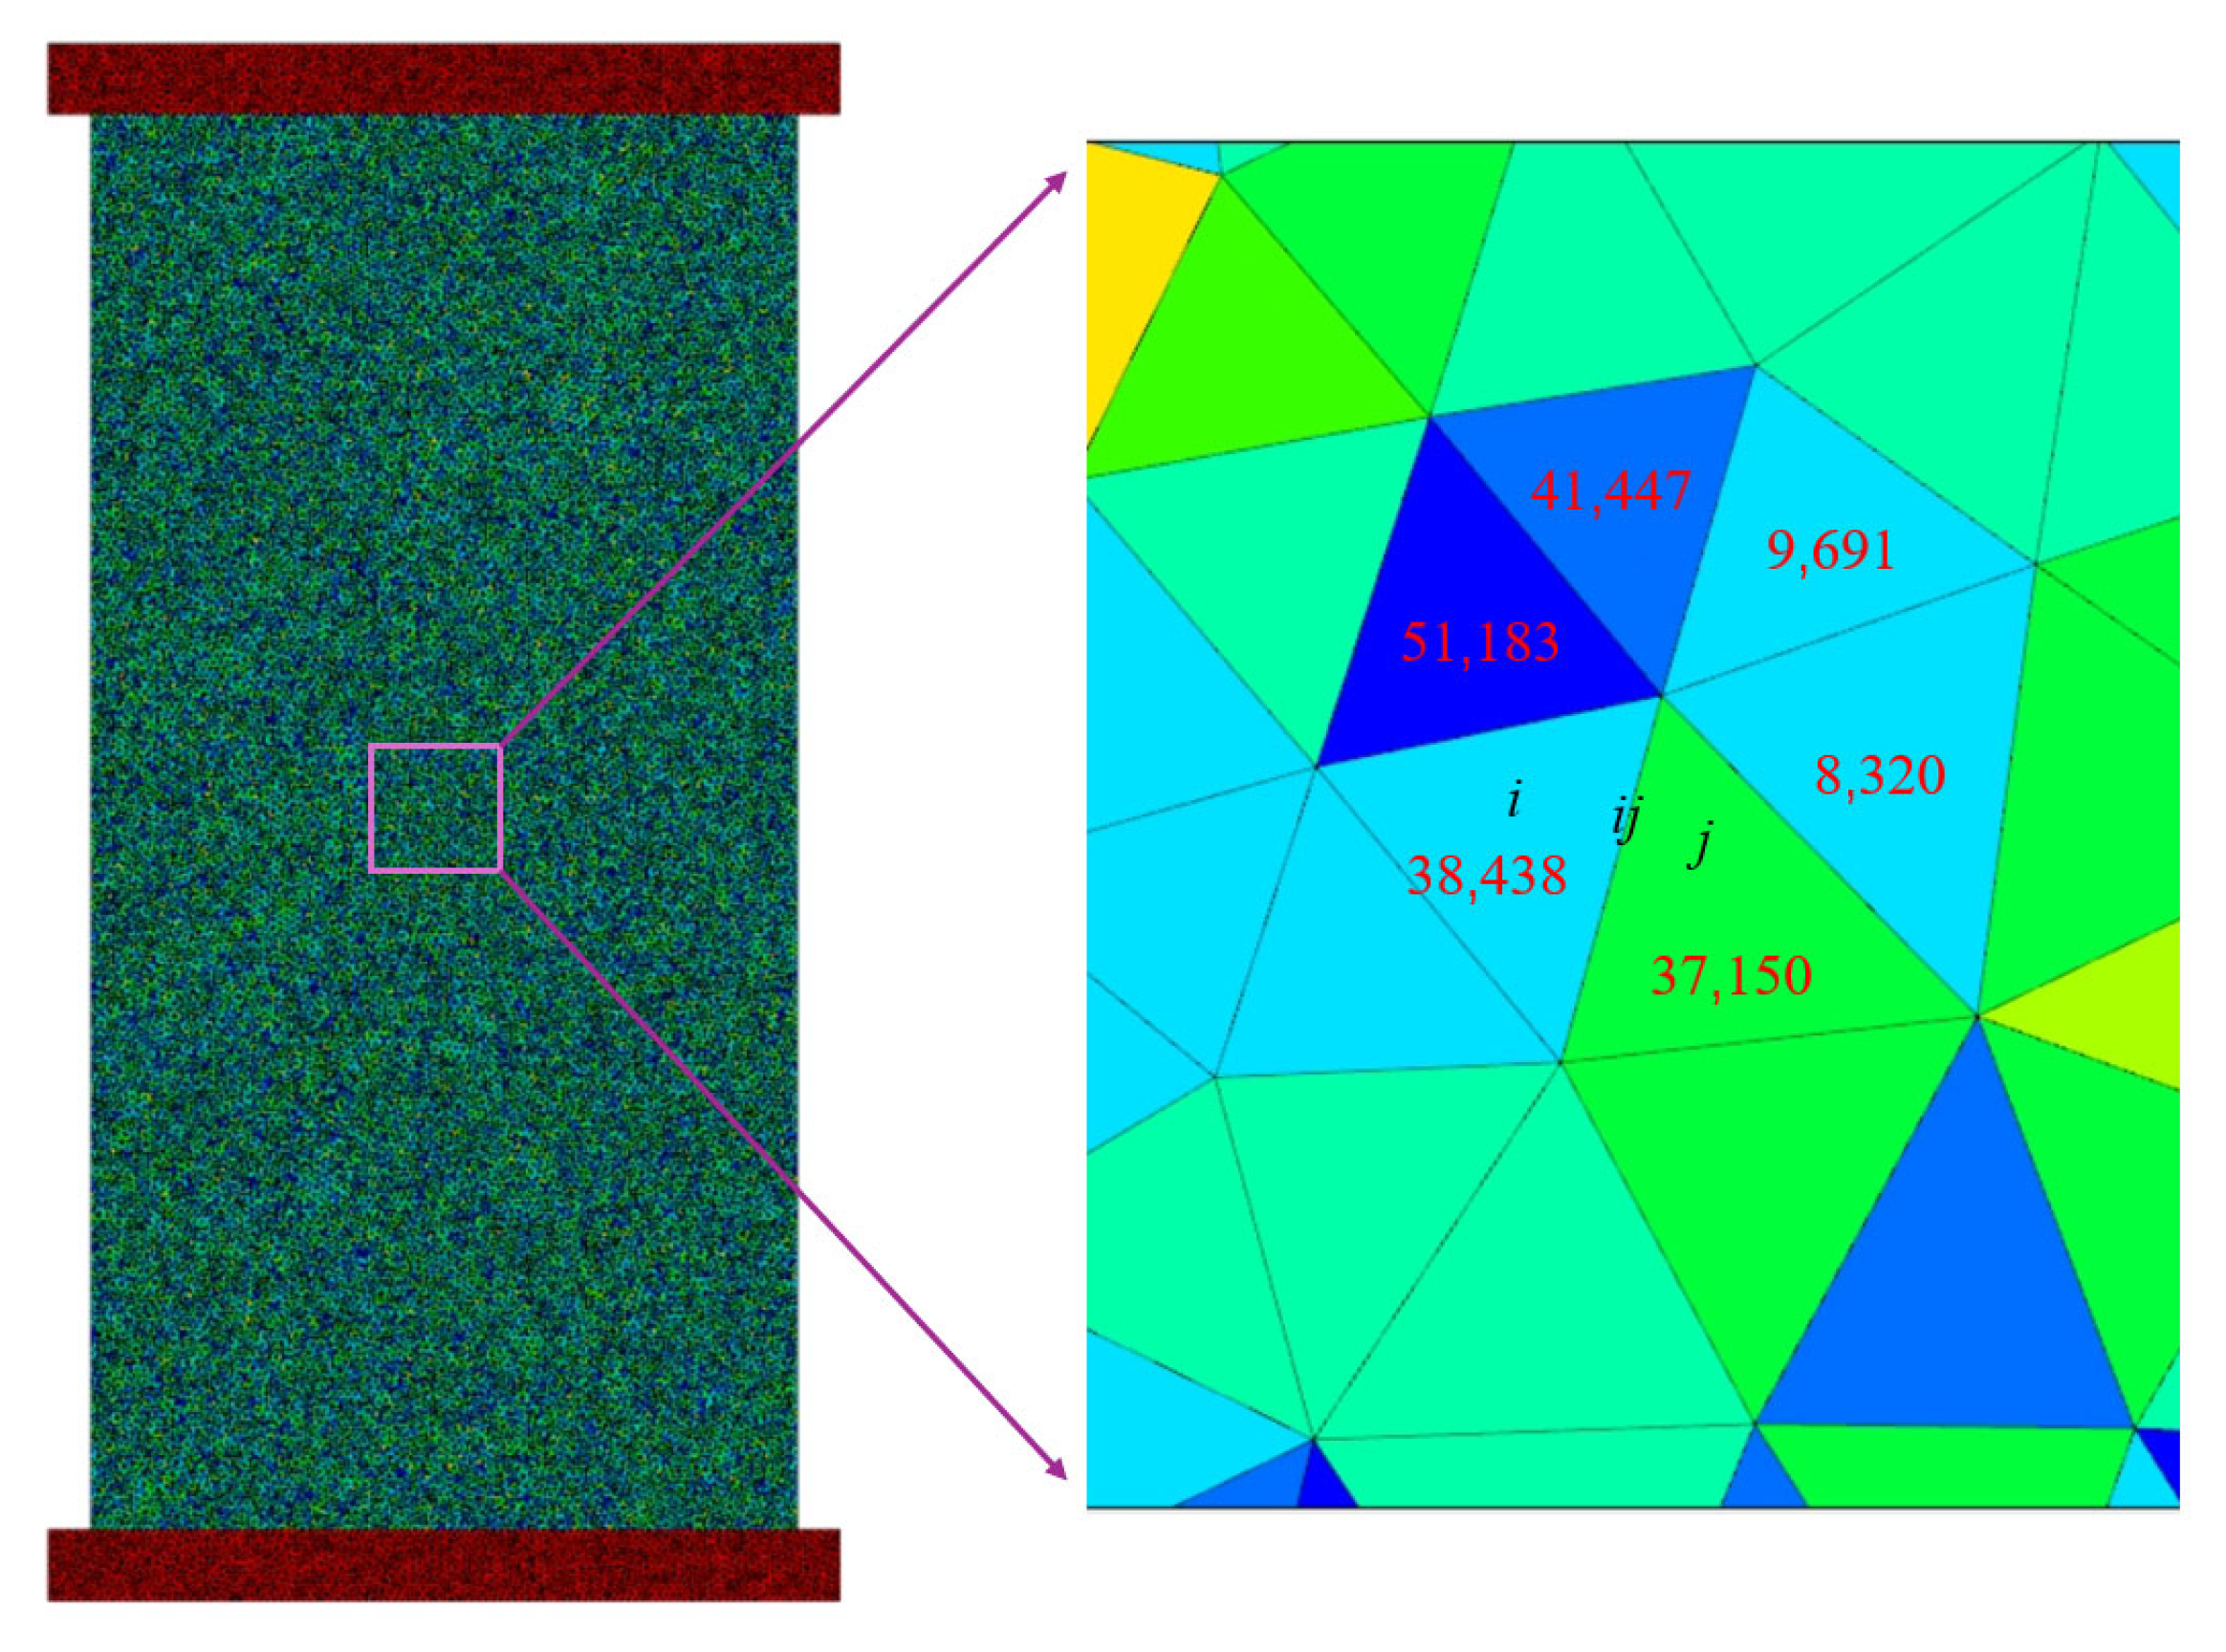
The assignment of cohesion and tensile strength for quadrilateral joint elements is depicted in Figure 4. By taking a specific area in the middle of the specimen as an example, the triangular element numbered 38438 is designated as triangular element i, and the triangular element numbered 37150 is designated as triangular element j. Subsequently, the quadrilateral joint element formed by these two elements (38438 and 37150) is denoted as ij. The cohesion, tensile strength, and fracture energy of the quadrilateral joint element ij are [30]:
C i j = E i + E j 2 E 0 C 0 f t i j = E i + E j 2 E 0 f t 0 G I i j = E i + E j 2 E 0 G I 0 G II i j = E i + E j 2 E 0 G II 0
where cij, ftij, GIij, and GIIij are cohesion, tensile strength, Type I fracture energy, and Type II fracture energy of quadrilateral ij; C0, ft0, GI0, and GII0 are the expected values of cohesion, tensile strength, Type I fracture energy, and Type II fracture energy.
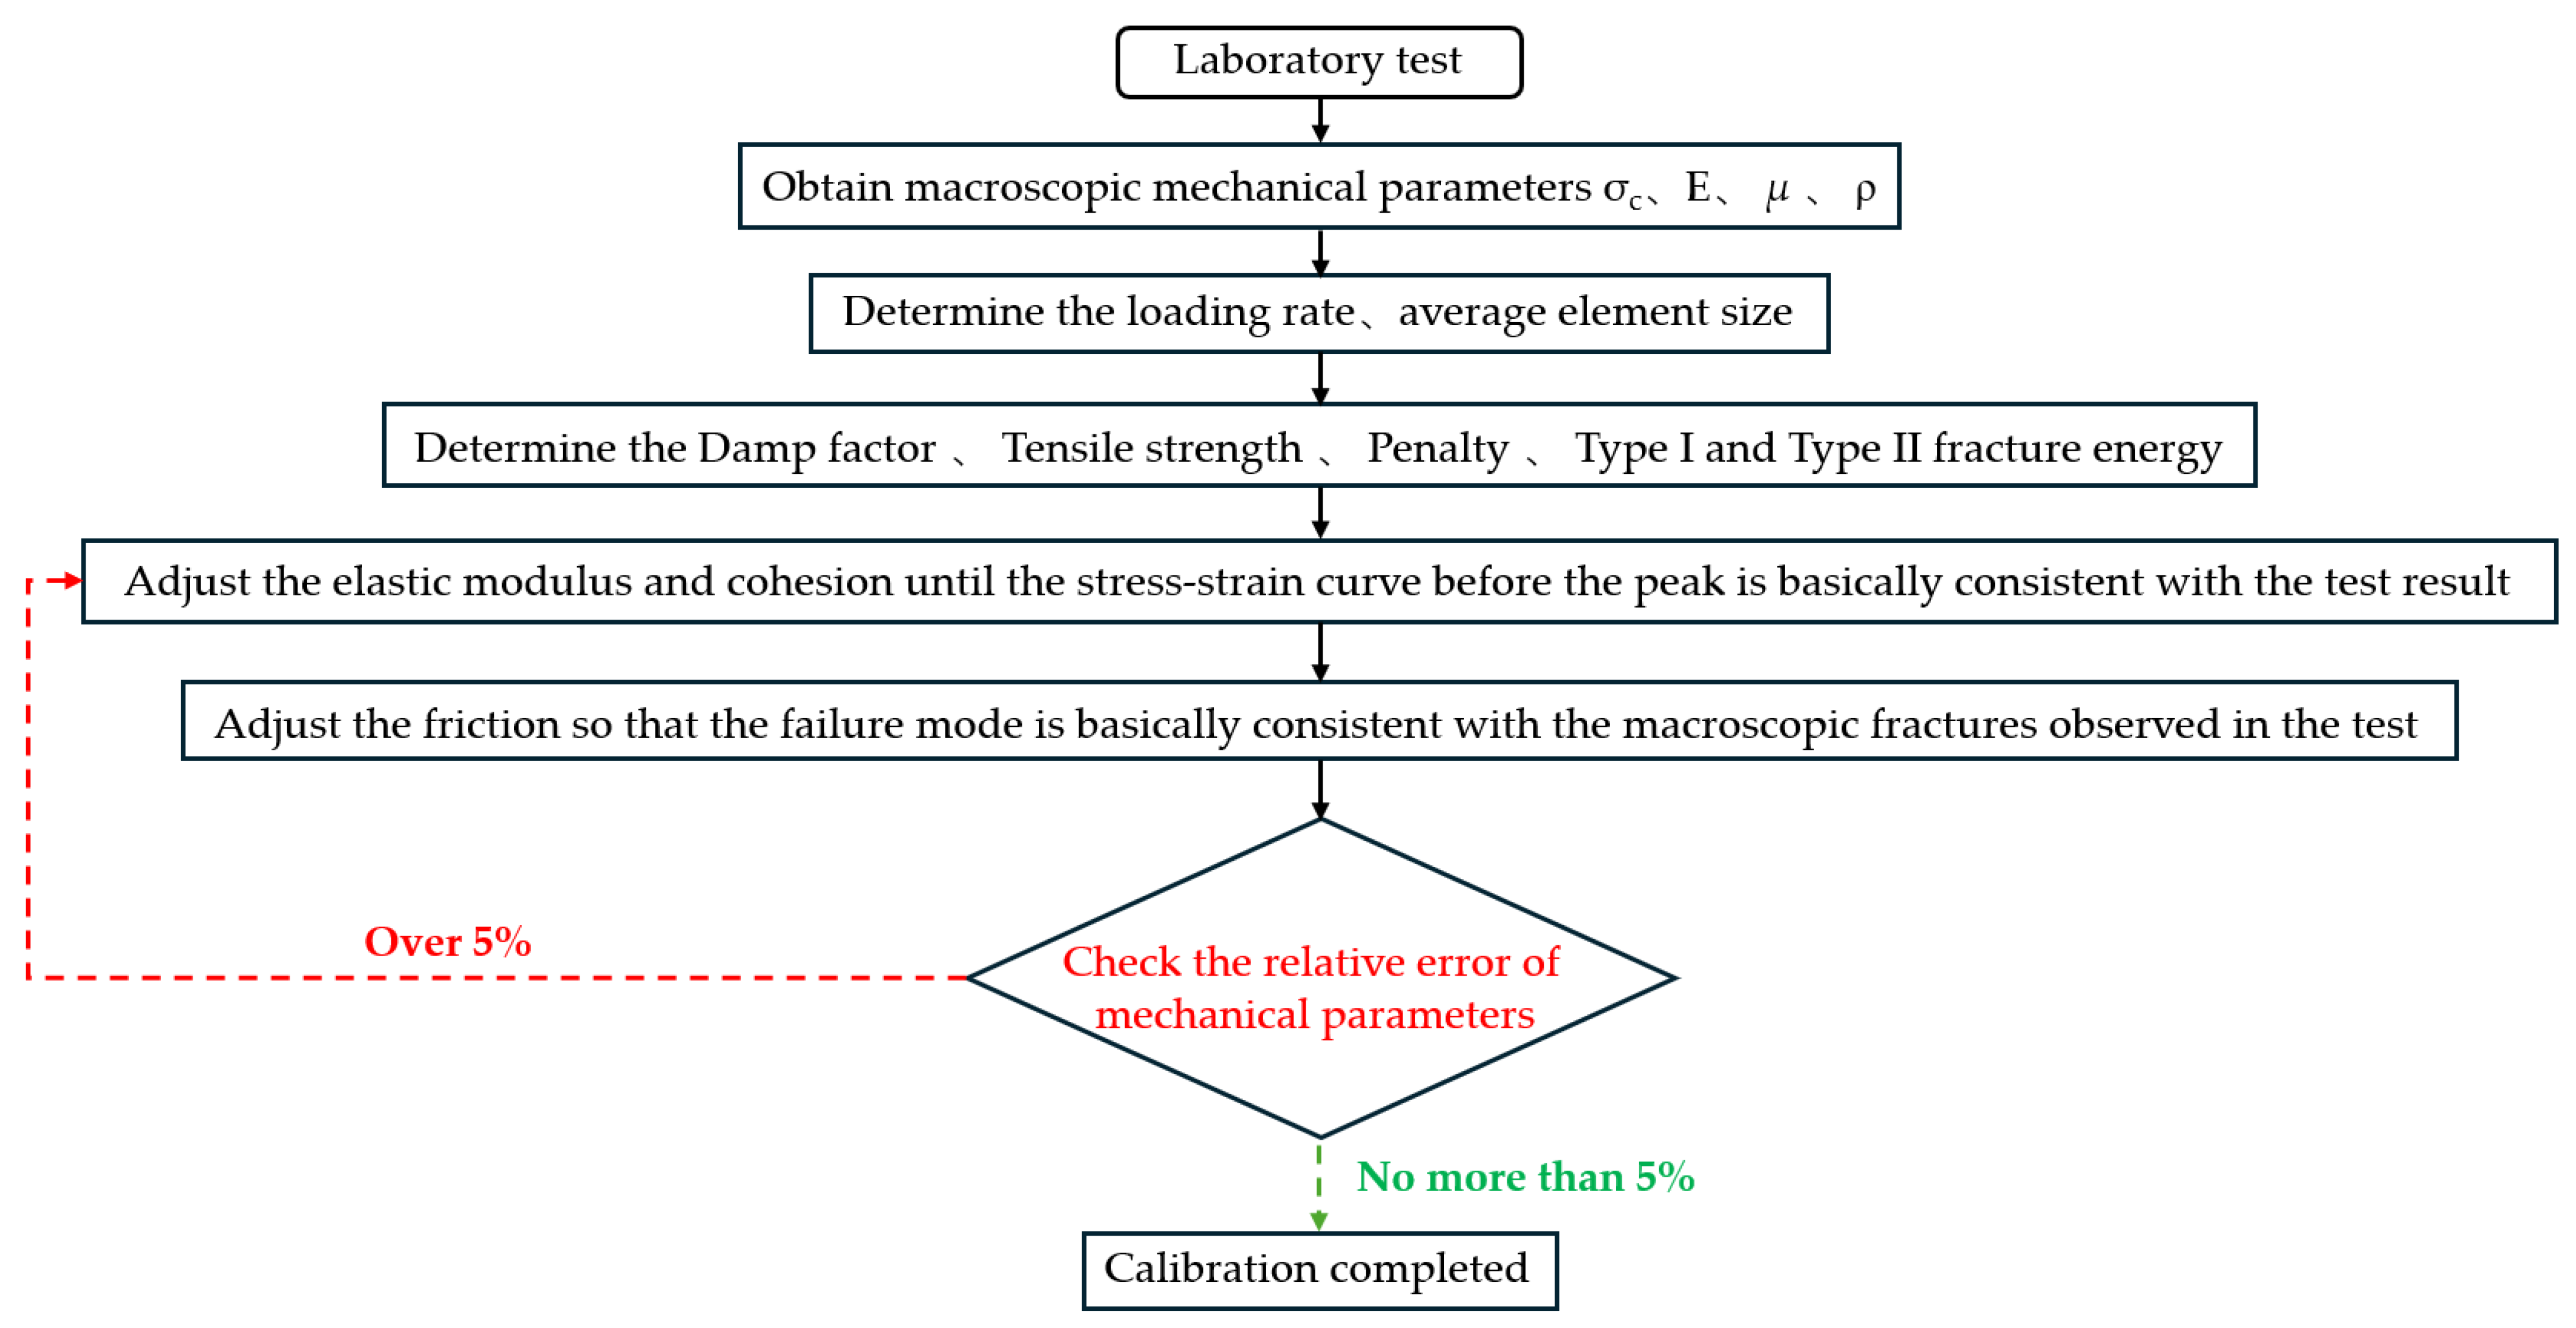
This study performs a numerical analysis utilizing the ECZM within the PCDC software (v2025), with the damping factor being set to 1. Through the application of mass scaling techniques, equilibrium can be attained in a smaller number of iteration steps. The input parameters of the numerical model are mainly reflected in the Mohr–Coulomb elastoplastic constitutive model and the external cohesion model of the micro-crack element. In this paper, the heterogeneity coefficient is taken as 3.5. The elastic modulus of all triangular elements is assigned based on Equation (11) [55], and the elastic modulus of all quadrilateral joint elements is assigned based on Equation (13). A numerical model consistent with the size of the indoor experimental sample is established. The input parameters of the numerical simulation are calibrated through the trial-and-error method, and the calibration procedure is shown in Figure 5.
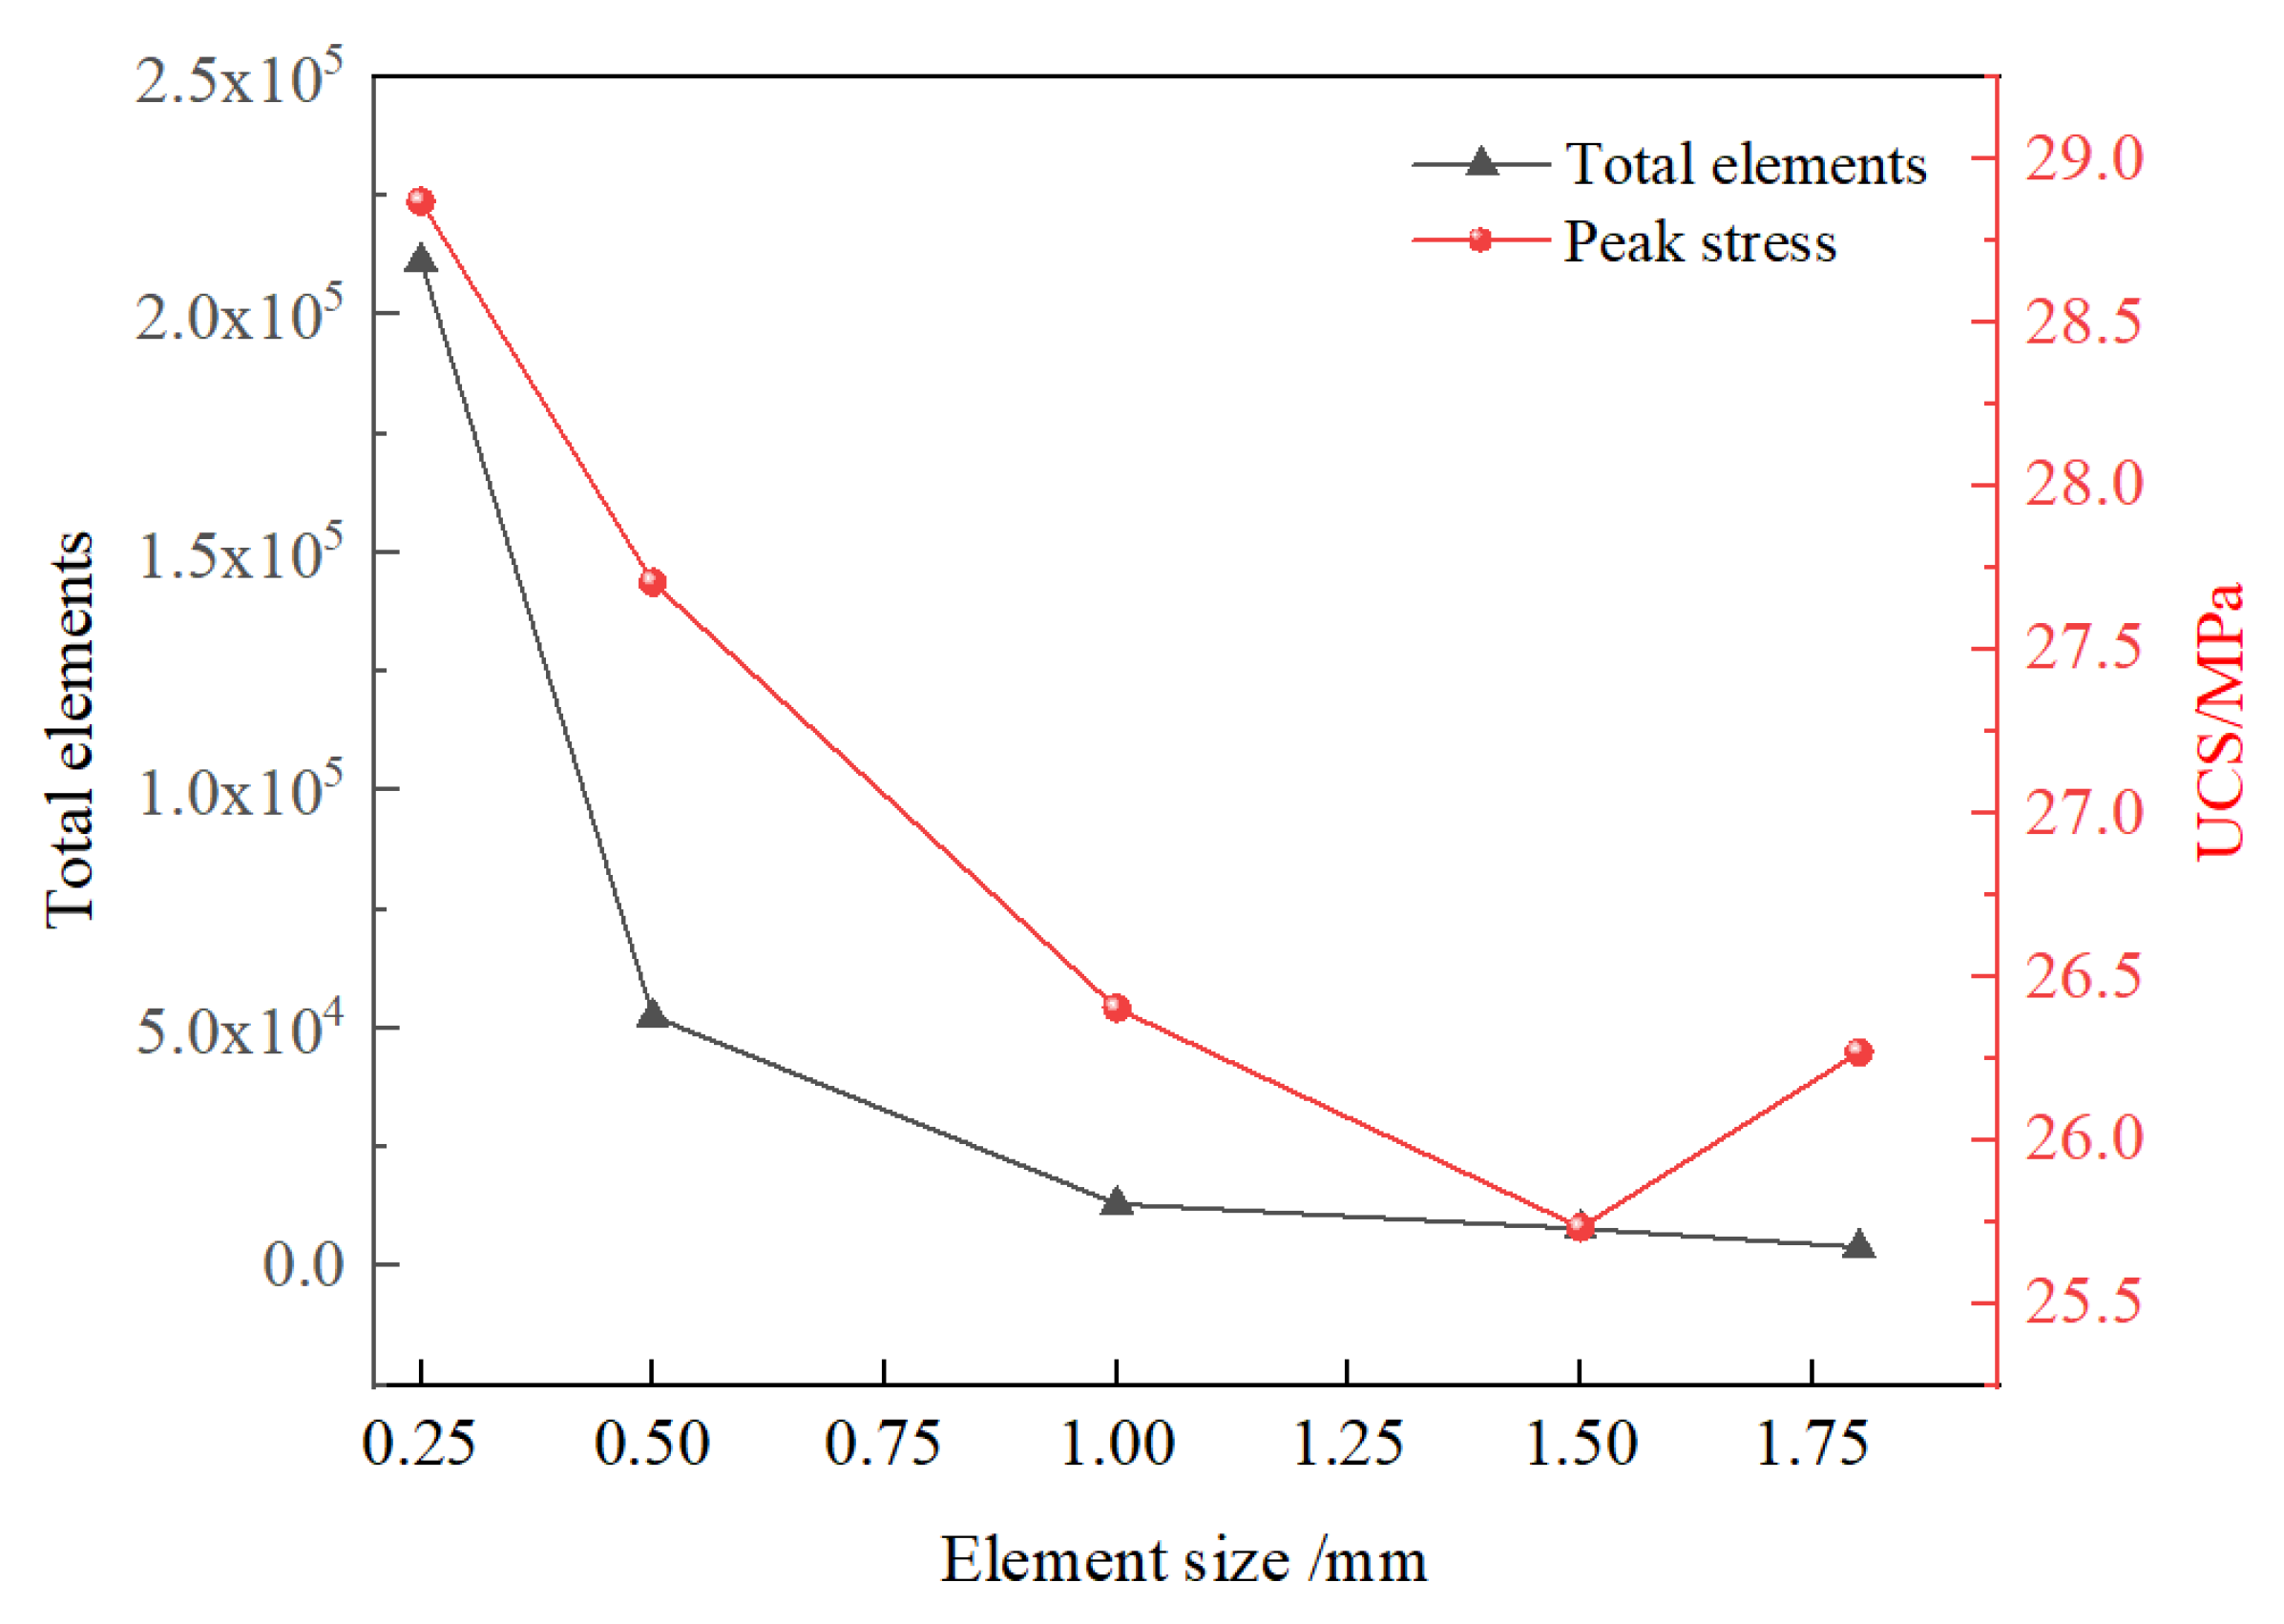
The unit size and loading rate of the model have a significant impact on the strength [52]. In this paper, the relevant parameters from existing literature are adopted to study the influence of unit size and loading rate on strength [56]. The relationship between the model element and the peak stress is shown in Figure 6. The analysis reveals that when the element size is greater than 1.0 mm, the number of grid elements changes slightly but the peak stress fluctuates. When the element size increases from 0.25 mm to 0.5 mm, the peak stress decreases from 28.87 MPa to 27.71 MPa, with a reduction of 4.01%. The number of grid elements decreases from 211,376 to 52,616, a reduction ratio of 75.11%. Considering the numerical calculation efficiency and calculation accuracy, the average size of the model elements in this paper is 0.5 mm, and a total of 52,616 triangular elements are set.
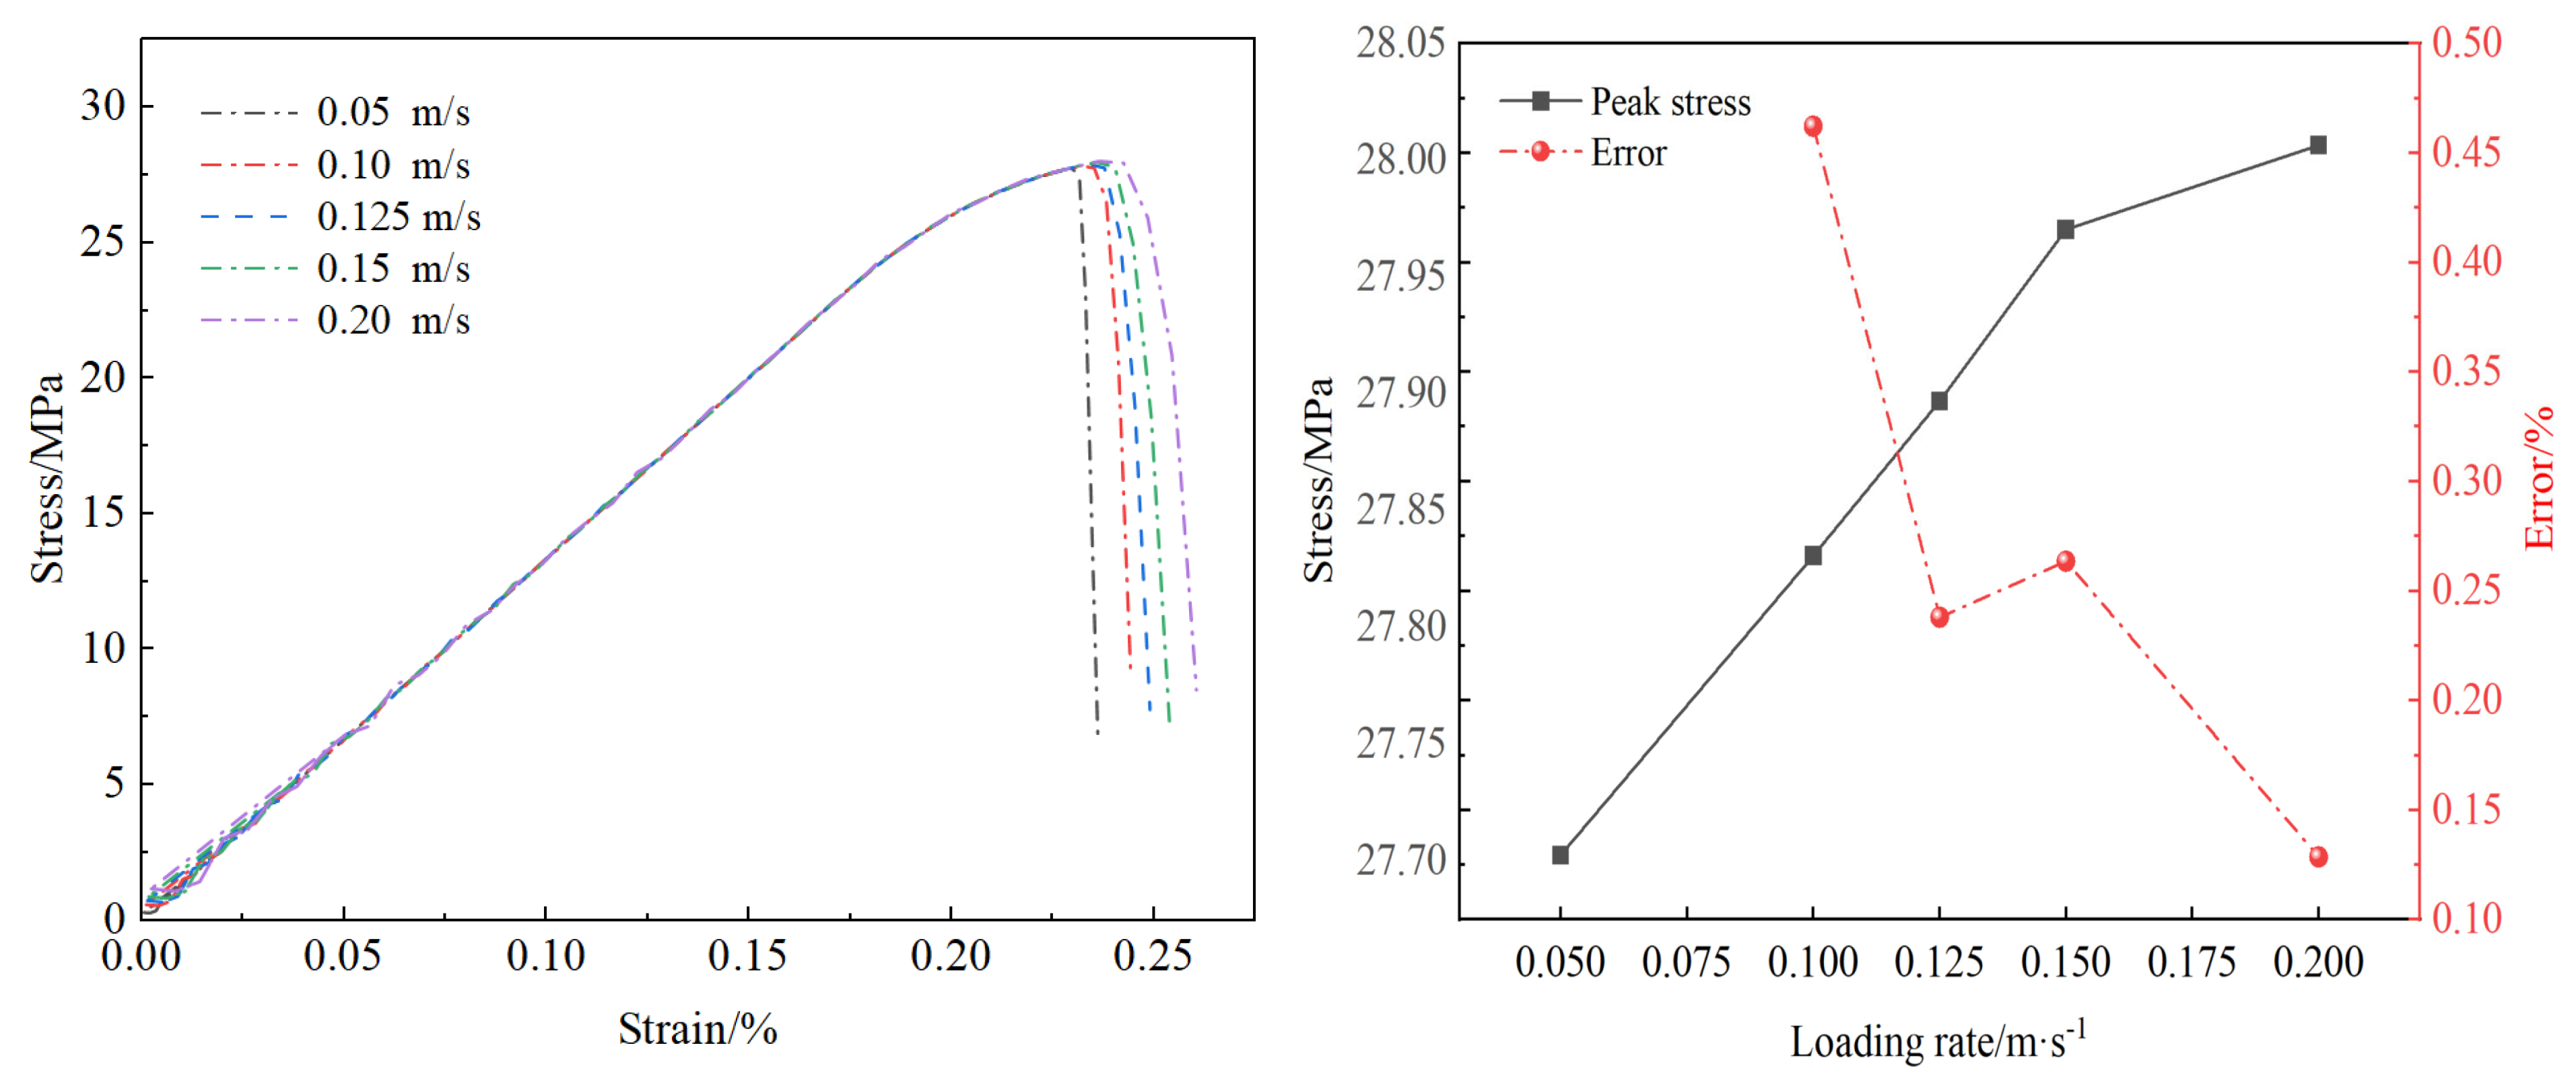
The relationship between loading rate and peak stress is shown in Figure 7. The relative error of peak stress is calculated by Equation (14) to analyze the influence of loading rate on the change in peak stress.
E l = σ f σ b σ f × 100 %
where El is the loading rate error, σf is the peak stress at the loading rate of the previous step, and σb is the peak stress at the loading rate of the subsequent step.
Analysis shows that when the loading rate is between 0.05 and 0.2 m/s, the stress–strain curves before the peak are basically consistent. When the loading rate increases from 0.10 m/s to 0.20 m/s, the relative error of the peak stress gradually decreases, although the relative error of the peak stress reaches the minimum value of 0.13% at a loading rate of 0.2 m/s. Relevant studies have shown that when the loading rate is less than 0.25 m/s (the displacement rate of the upper and lower loading plates is 0.125 m/s), the loading rate has a relatively small impact on the uniaxial compressive strength (UCS) and Brazilian tensile splitting strength (BDTS) [57]. When the loading rate is 0.125 m/s, the relative error of the peak stress reaches a relatively small value of 0.24%. Based on the above analysis, the loading rate in the numerical analysis of this paper is set at 0.125 m/s.
In the numerical model, the influence of gravity is ignored, and the maximum time step is calculated according to Equation (15):
Δ t max = L ρ / E
where Δ t max is the maximum time step, L is the average cell size, ρ is the triangular cell density, and E is the elastic model of the triangular cell.
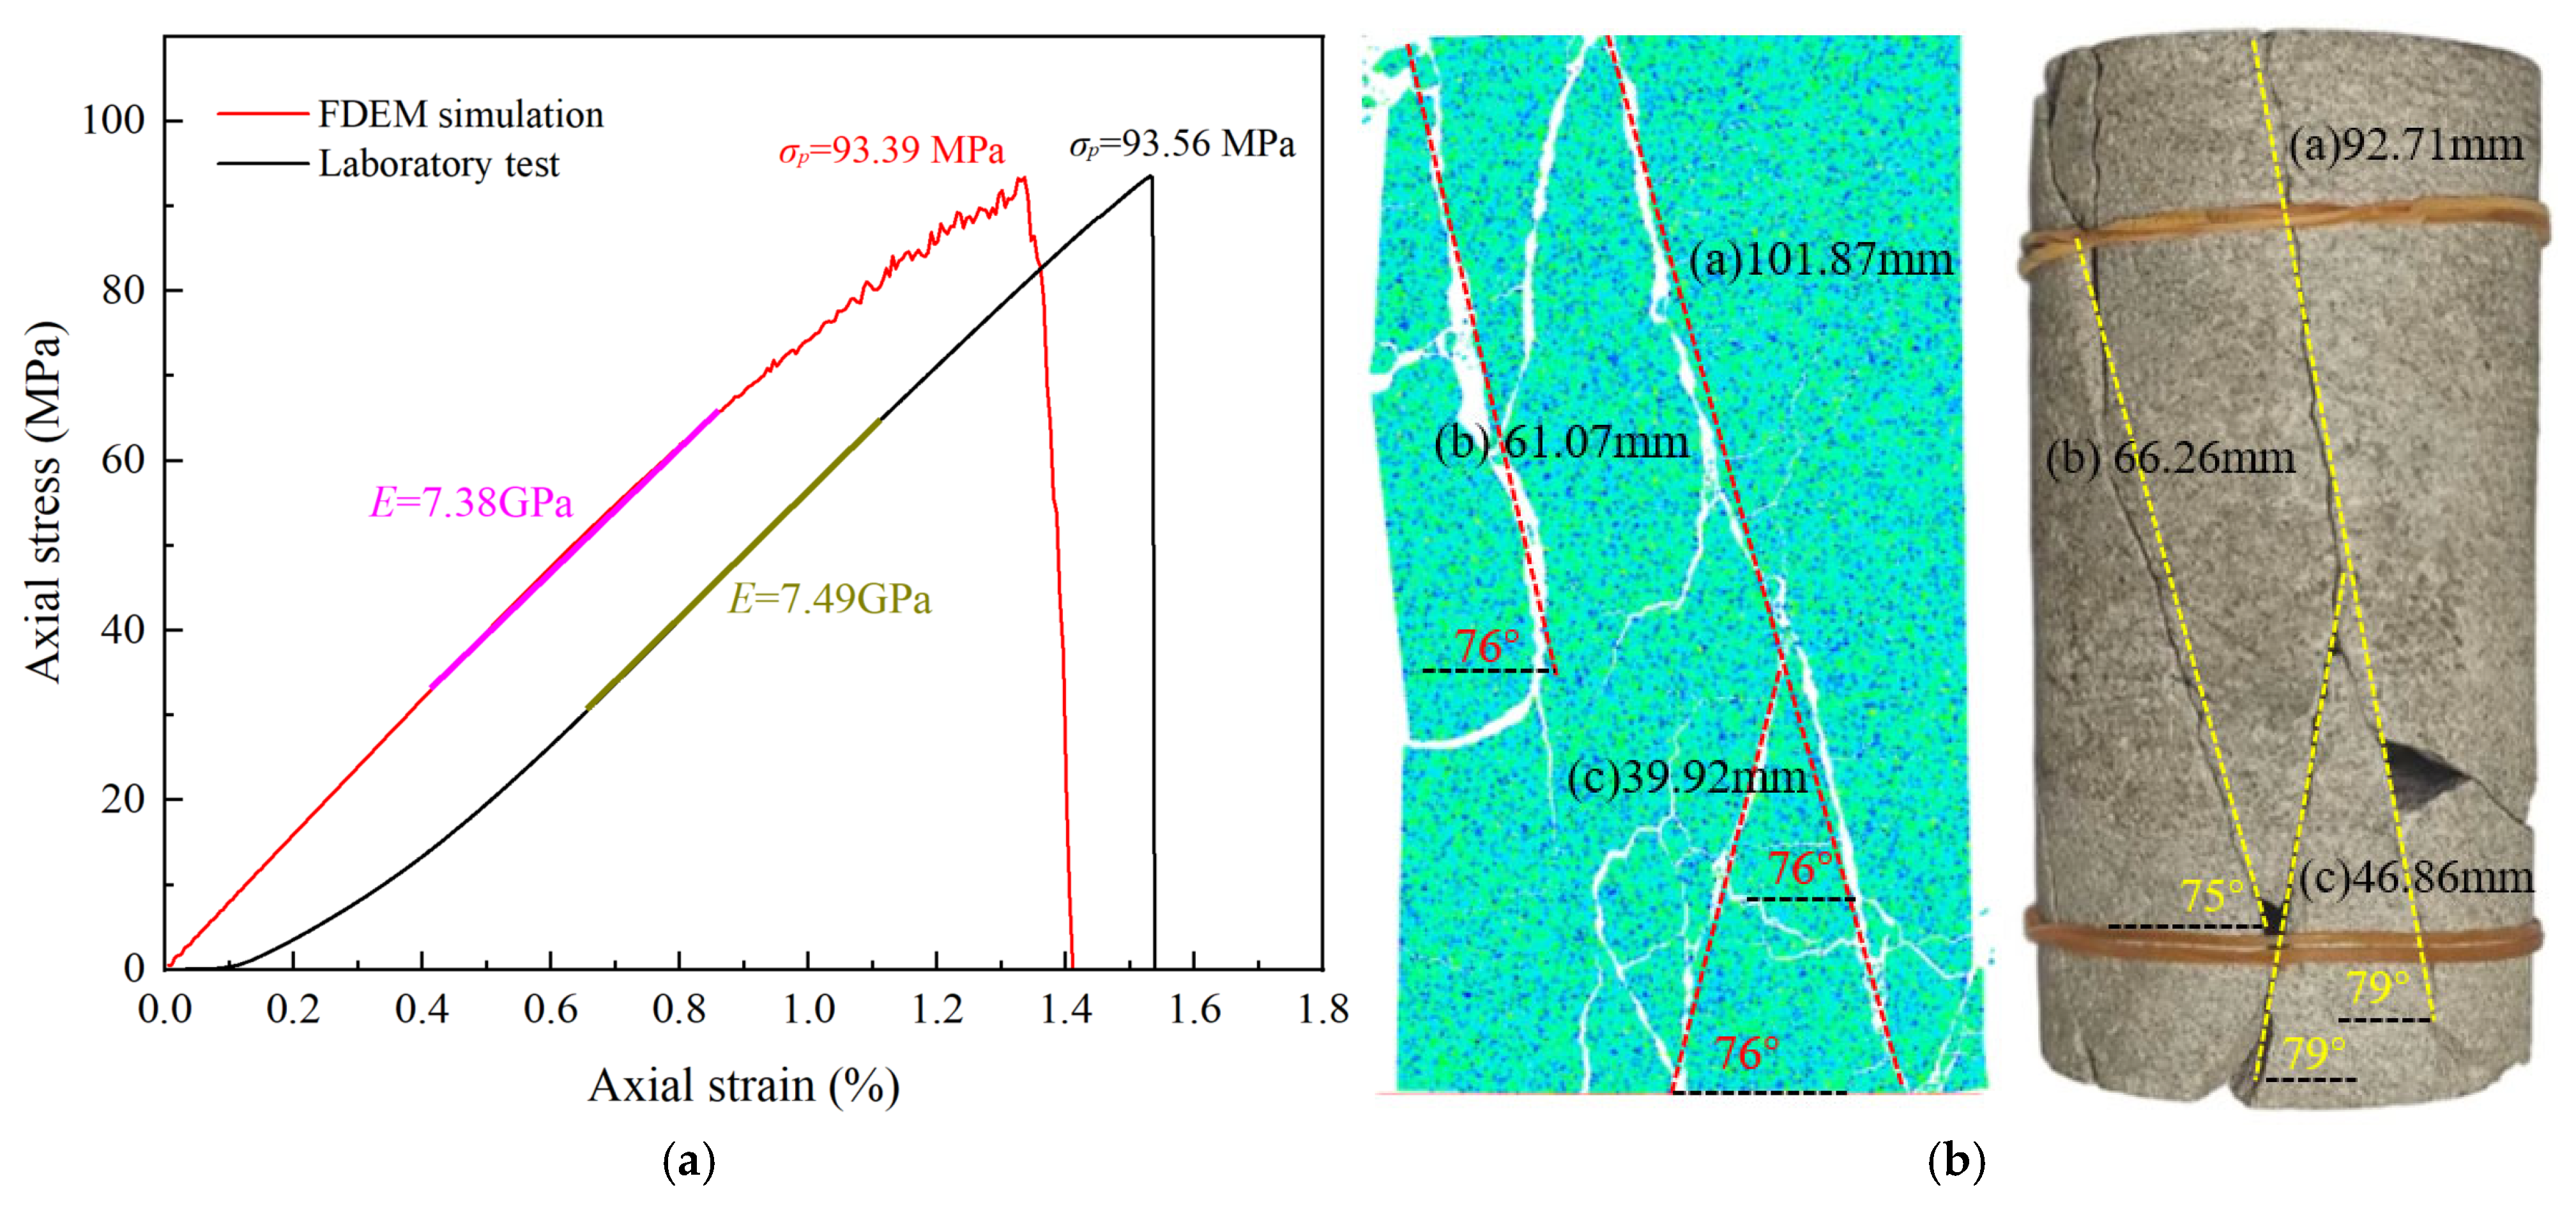
According to Equation (15), the maximum time step is 2.73 × 10⁻⁷ s. In this paper, the simulation takes 2.5 × 10⁻⁷ s. The collection interval of the stress–strain curve is 2000 steps. Calibration is typically carried out in accordance with the method shown in Figure 5, and usually 20 simulation calculations are required to meet the error of elastic modulus within ± 3% and the error of peak stress within ±4%. The input parameters of the calibrated Mohr–Coulomb elastoplastic constitutive model are shown in Table 2, and the input parameters of the external cohesion model of the micro-crack element are shown in Table 3. The comparison of experimental and numerical simulation results is shown in Figure 8. Analyzing Figure 8a, the elastic modulus from numerical simulation is 7.38 GPa, the peak strength is 93.39 MPa, and the peak strain is 1.33%. The elastic modulus from the indoor experiment is 7.49 GPa, the peak strength is 93.56 Mpa, and the peak strain is 1.53%. Analyzing Figure 8b, the failure characteristics of both the indoor experimental rock samples and the numerical simulation results are three shear fractures. The fracture lengths in the experimental results range from 46.86 to 92.71 mm, and the fracture angles range from 75 to 79 degrees. The fracture lengths in the numerical simulation range from 39.92 to 101.87 mm, and the angle is 76 degrees. Overall, the errors in fracture length and angle are relatively small, indicating that when using the calibrated parameter combination, the errors in mechanical properties and failure characteristics between the experiment and numerical simulation results are relatively small.

2.4. Numerical Simulation Scheme

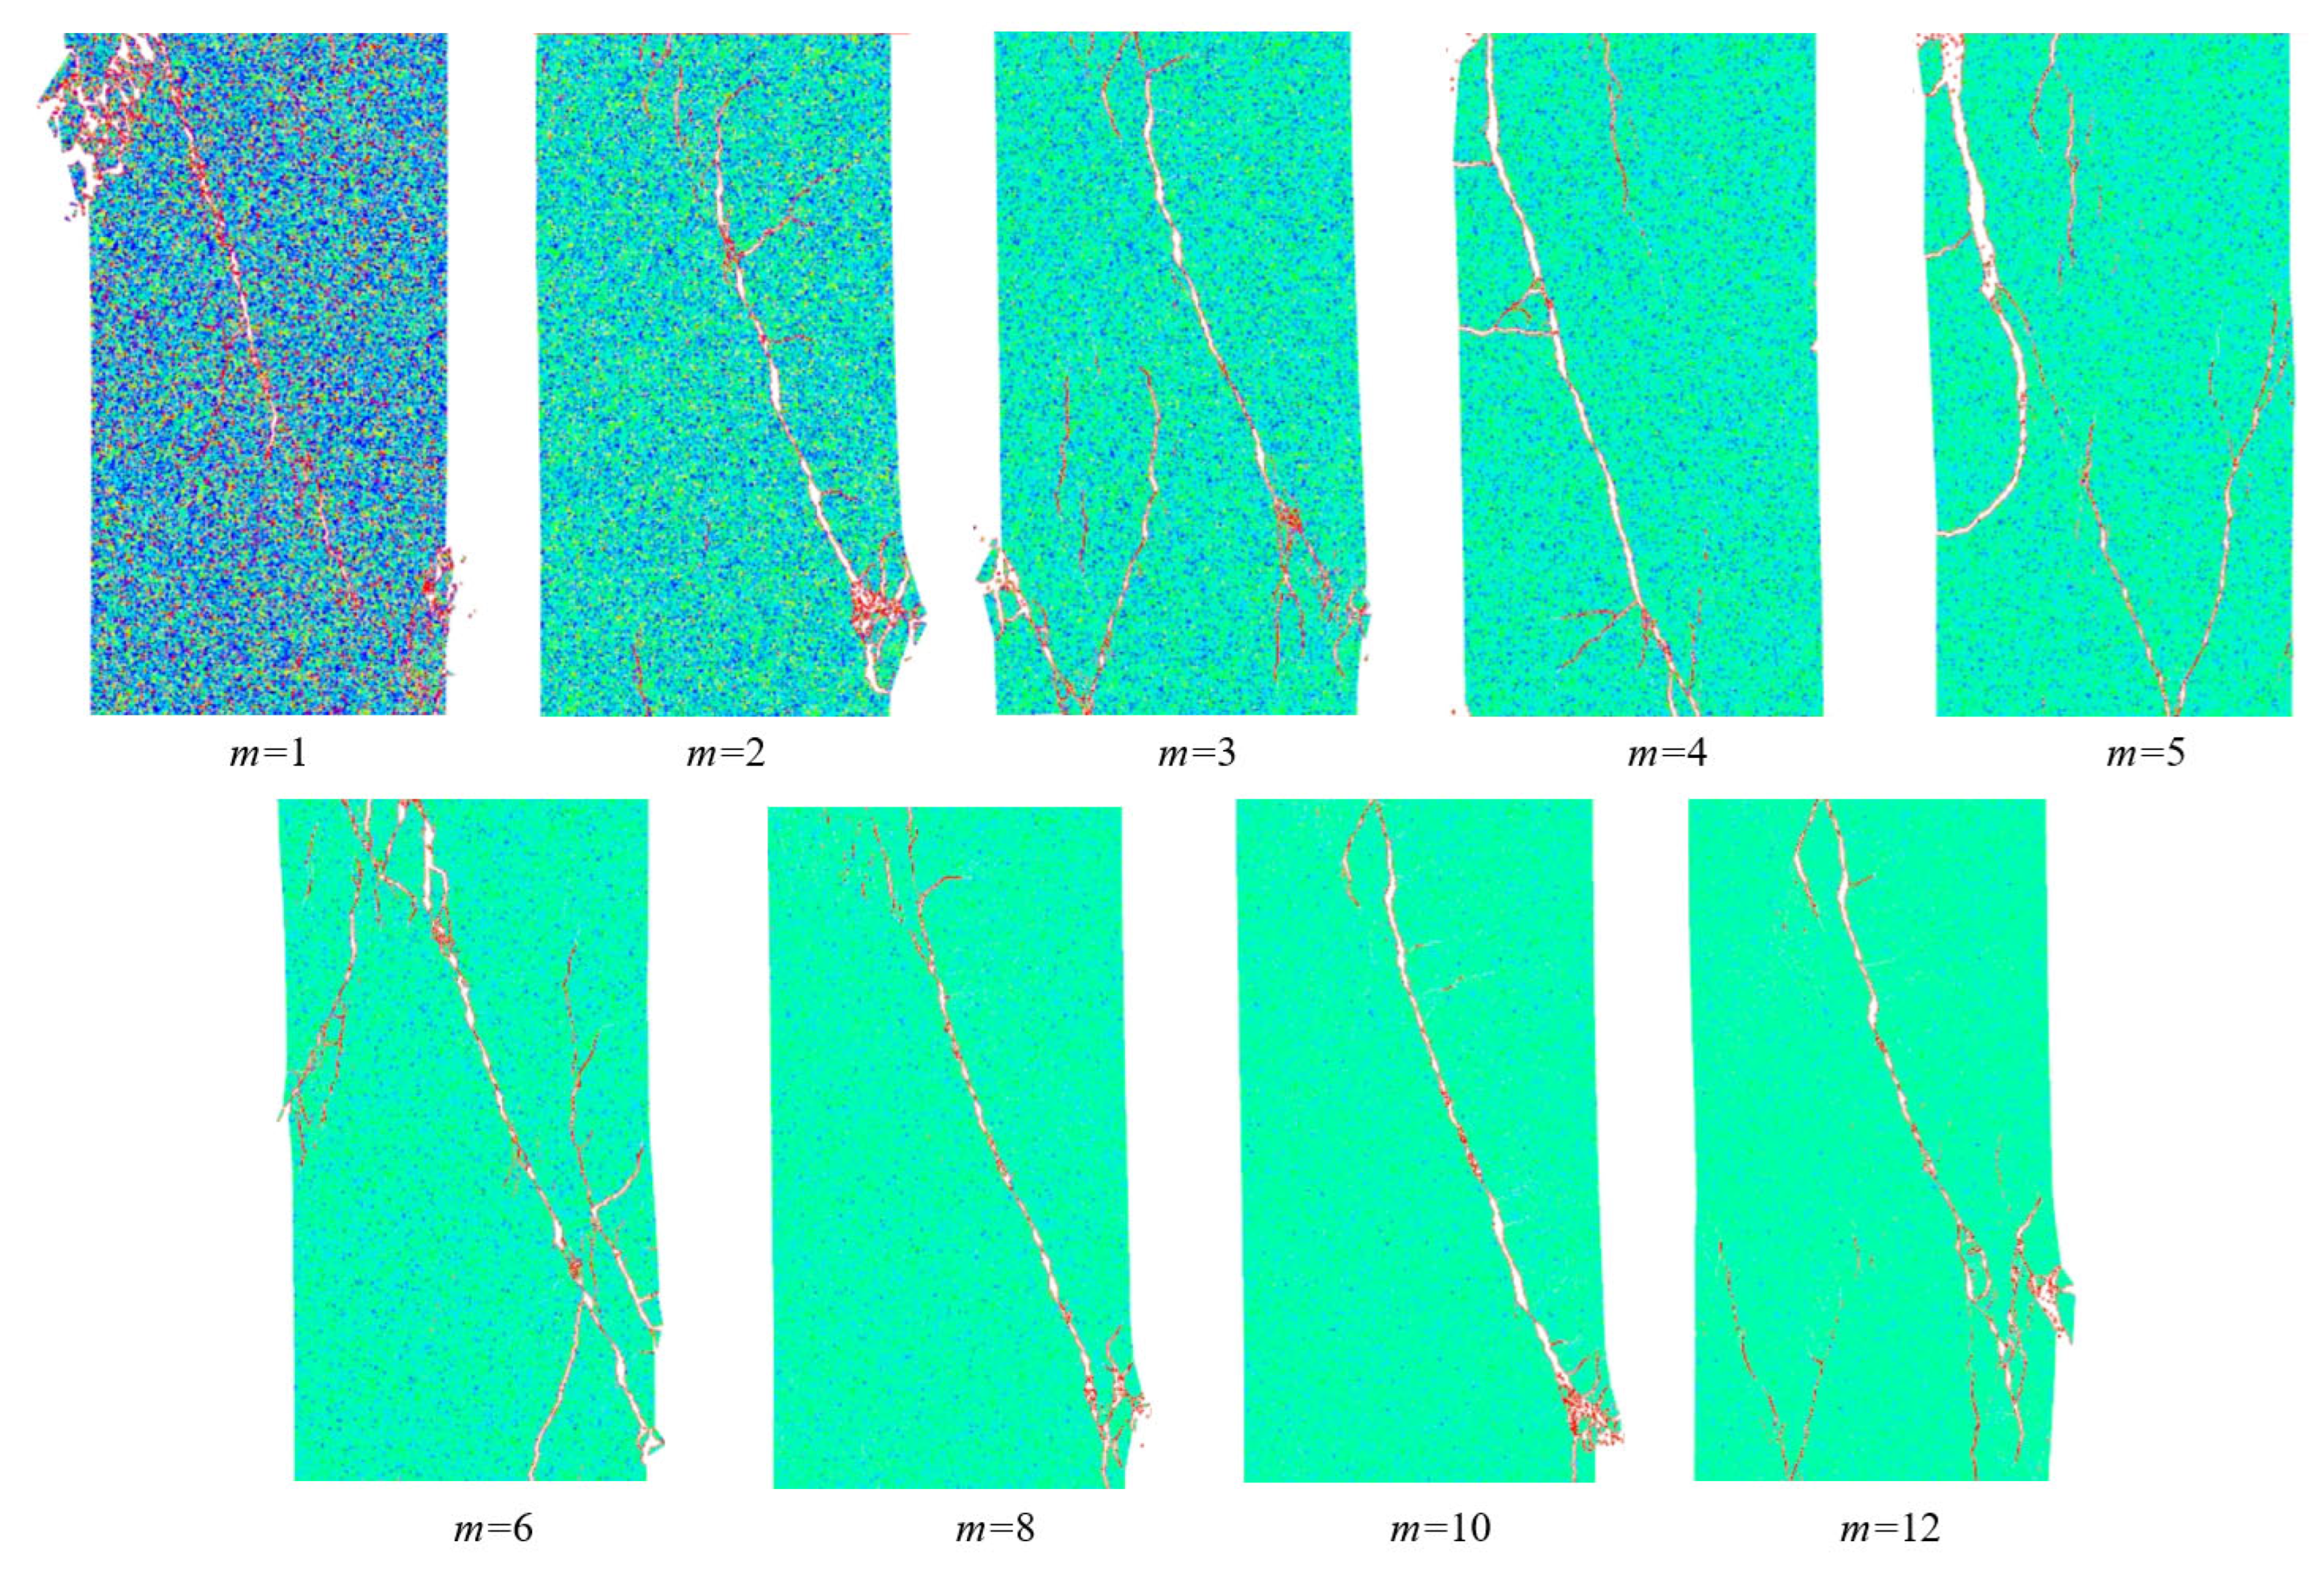
The failure modes of rocks under different homogeneity coefficients are presented in Figure 9. It can be inferred that when the homogeneity coefficient varies significantly while other mesoscopic parameters remain the same, the failure modes are essentially identical to those when the homogeneity coefficient is 3.5. The failure modes of rocks are all shear failure, which suggests that the overall response of other mesoscopic parameters remains physically reasonable when the homogeneity coefficient changes.
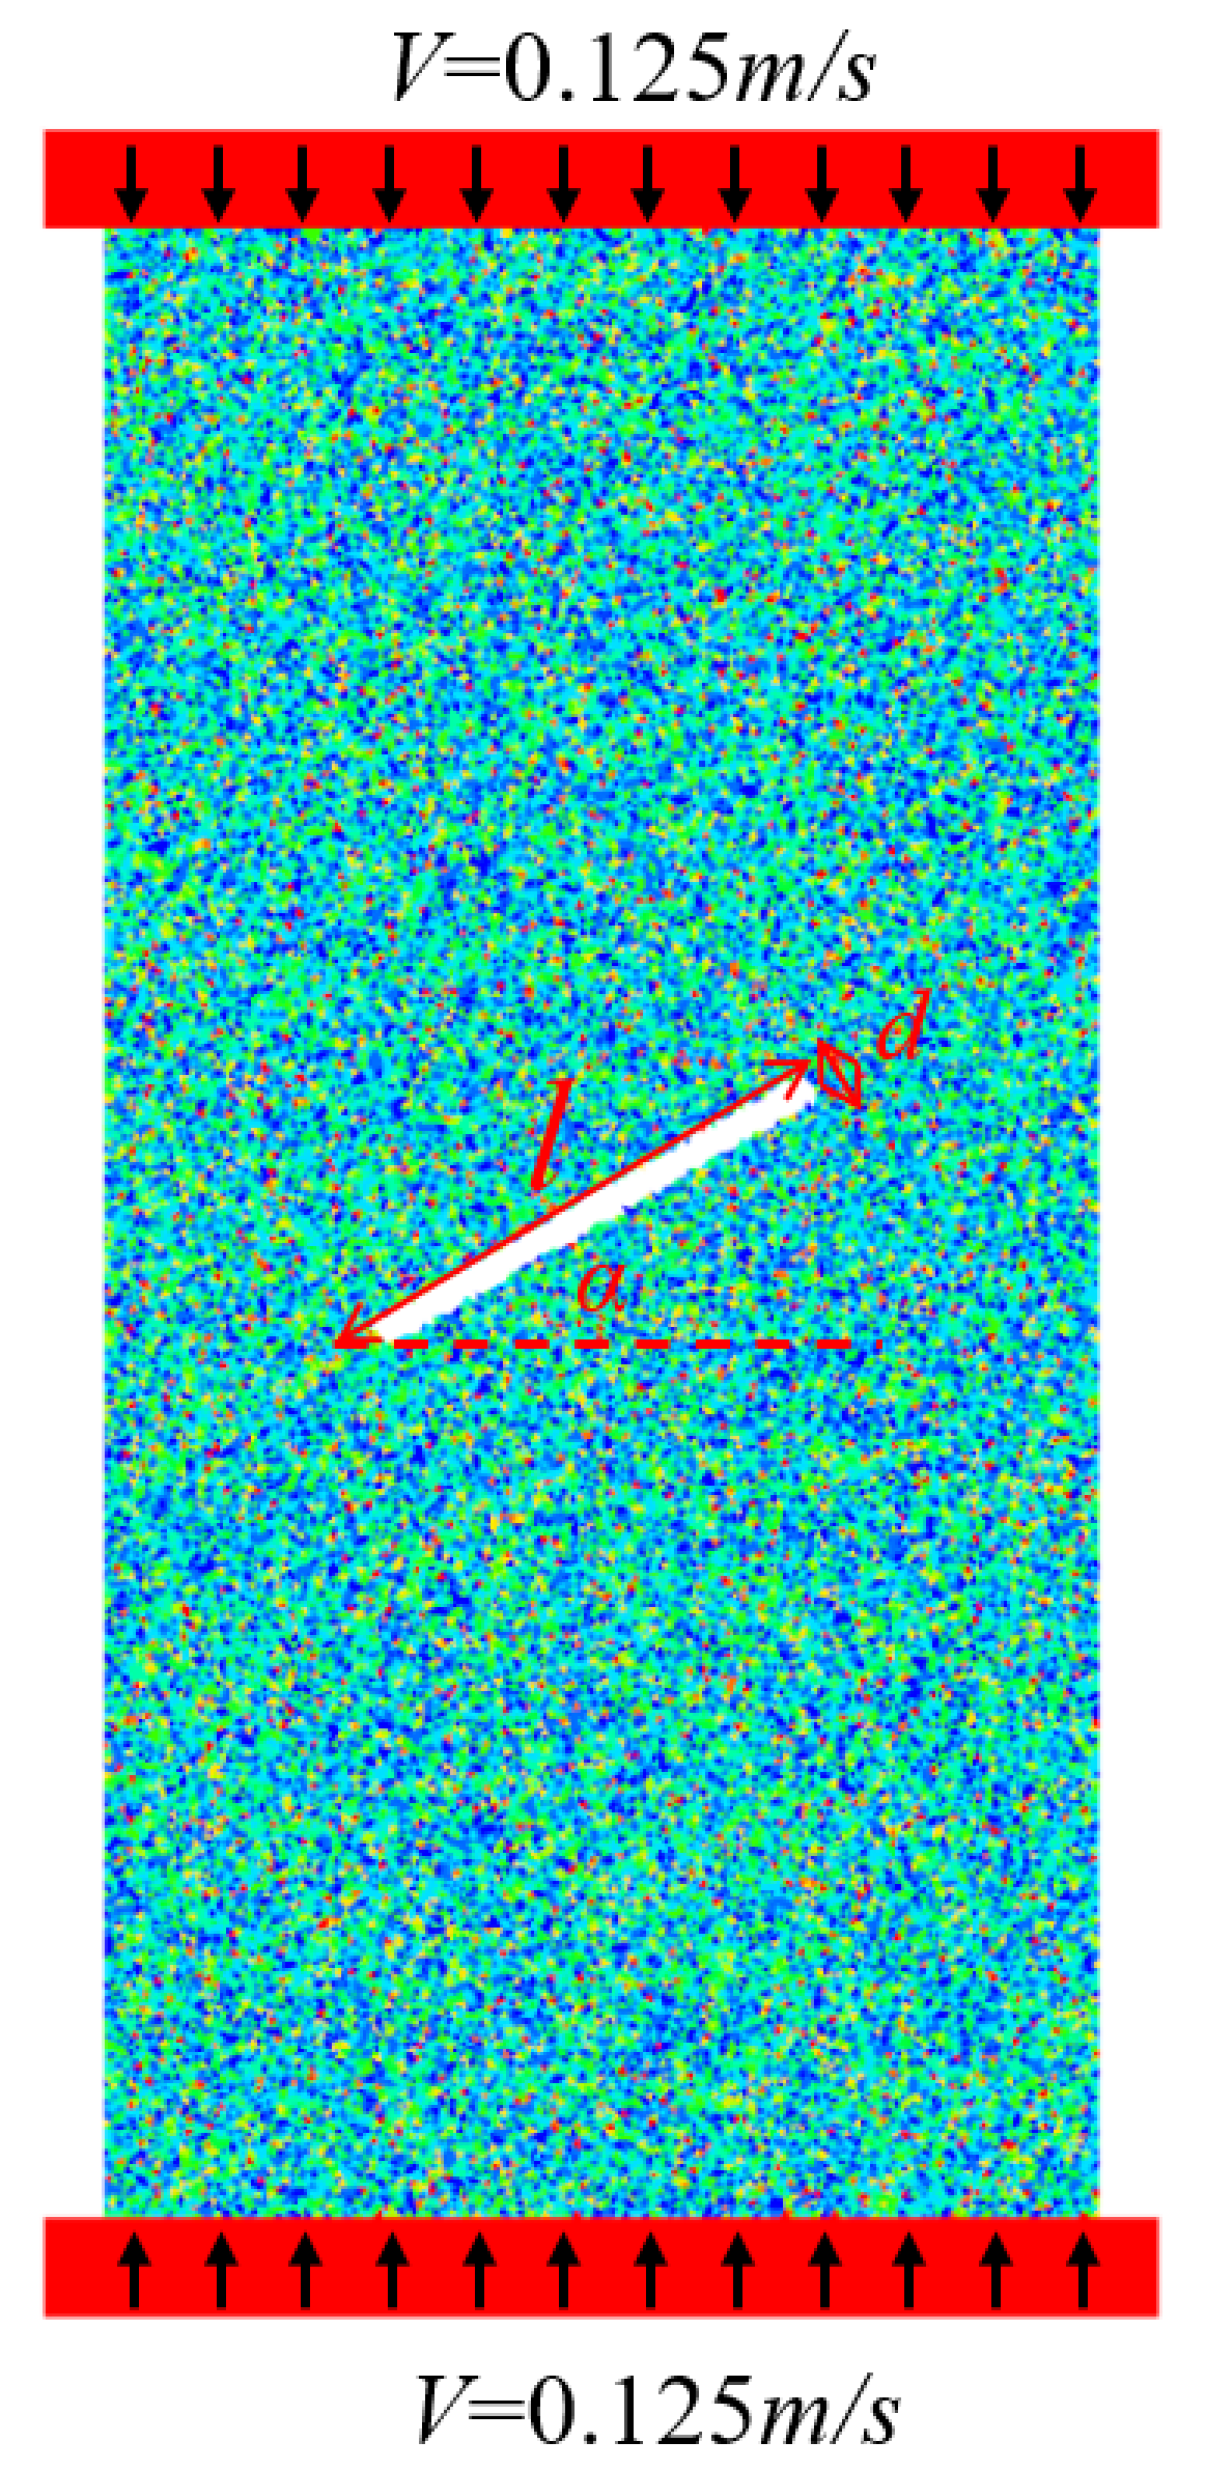
To analyze the influence of each parameter on the evolution law of mechanical properties of sandstone under the condition of multi-factor coupling, four factors, namely homogeneity coefficient (1, 2, 3, 4, 5, 6, 8, 10, 12), fracture angle (0°, 15°, 30°, 45°, 60°, 75°, 90°), fracture length (5 mm, 10 mm, 15 mm, 20 mm, 25 mm), and fracture aperture (0.5 mm, 1.0 mm, 1.5 mm, 2.0 mm, 2.5 mm), were selected. A total of 1575 full-factor combinations were designed. To reduce the computational cost, an L81 orthogonal numerical simulation test scheme was adopted. Orthogonal experiments can achieve balanced and comparable levels of each factor, avoid confounding, and still effectively detect the main effects and two-factor interaction effects. The parameters of the numerical simulation are shown in Figure 10. The specific test scheme and numerical results statistics are detailed in Appendix A.

2.5. Calculation Method

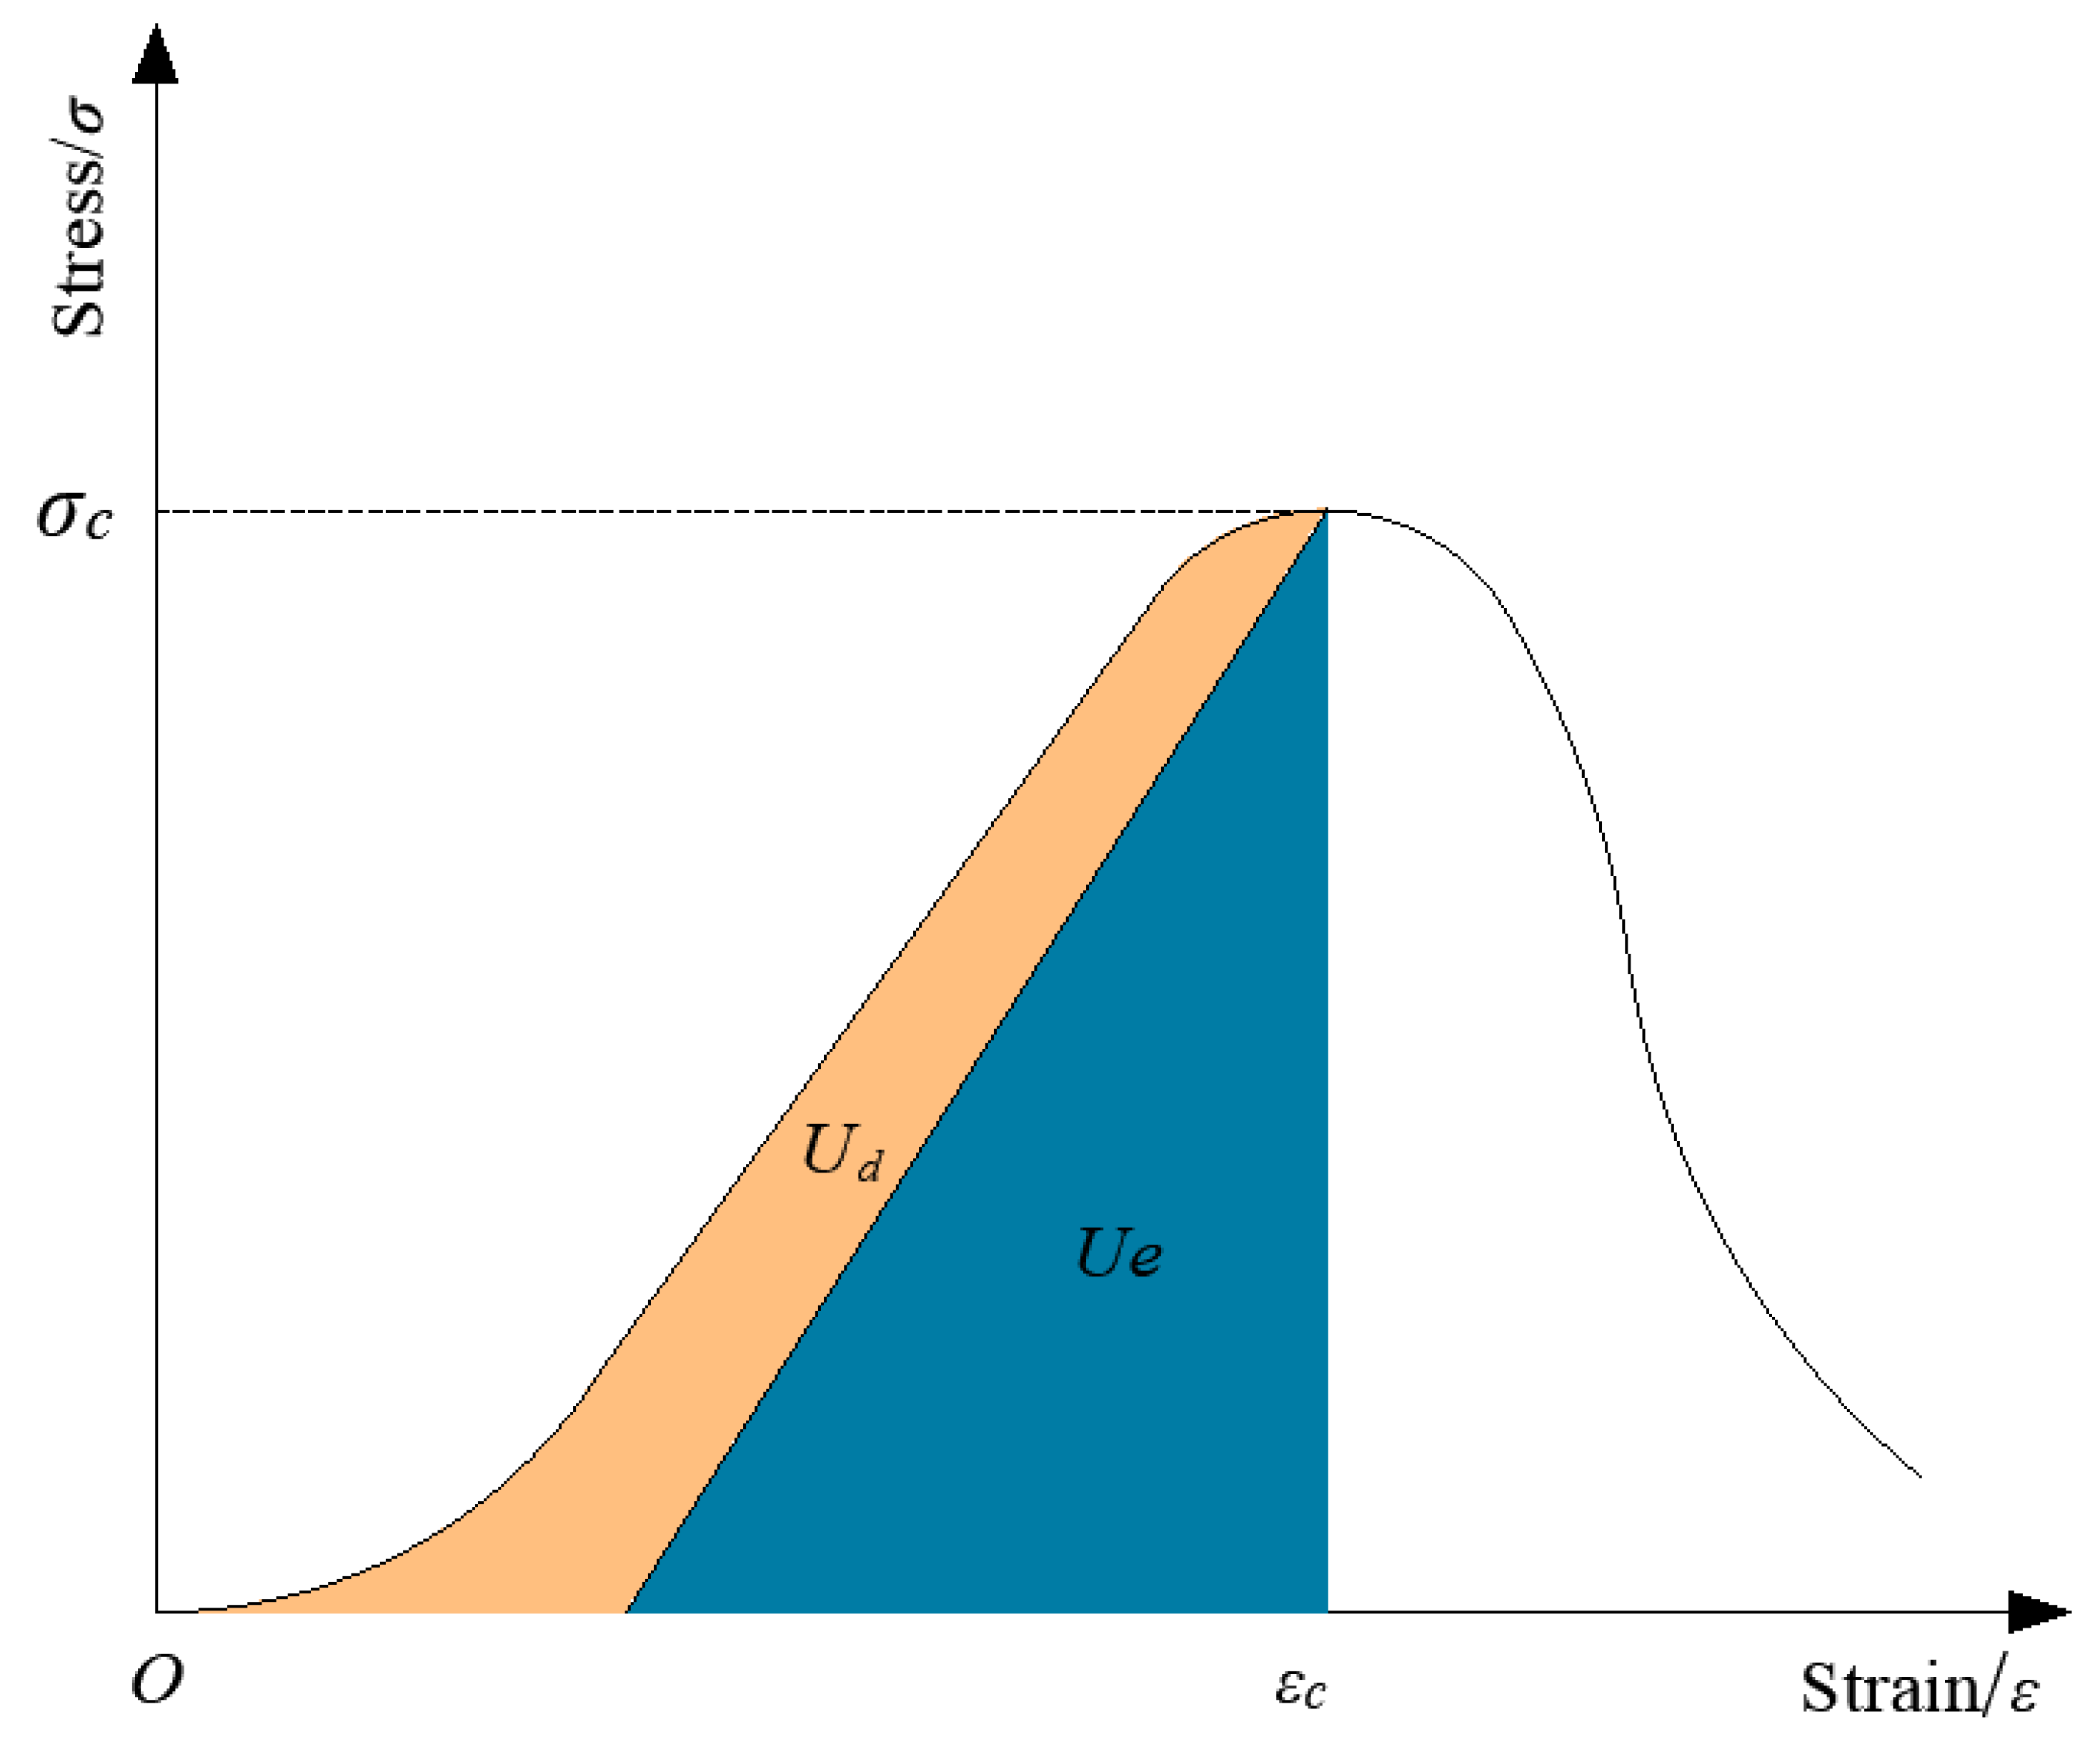
According to relevant studies [58,59], the accumulation and dissipation of energy are associated with the entire deformation and failure process of rocks. Studying the energy accumulation and dissipation of rocks is beneficial for assessing the damage state of rocks. According to the law of conservation of energy, it is assumed that no significant external heat exchange takes place during the uniaxial compression process, and the energy loss resulting from heat exchange and heat dissipation can be neglected. In the pre-peak stage, the total input energy is entirely converted into elastic strain energy and dissipated energy, and their relationship is presented in Equation (16):
U = U d + U e
where U is the total energy prior to the peak, Ud is the dissipated energy prior to the peak, and Ue is the elastic strain energy prior to the peak.
Under uniaxial compression conditions, the relationship between the cumulative energy of rocks and the stress–strain curve is presented in Figure 11, and the calculation of the cumulative energy is as depicted in Equations (17) to (18).
U = 0 ε c σ d ε
U e = σ c 2 2 E
Therefore, the calculation of the dissipated energy is presented as shown [47]:
U d = 0 ε c σ d ε σ c 2 2 E

3. Results and Analysis

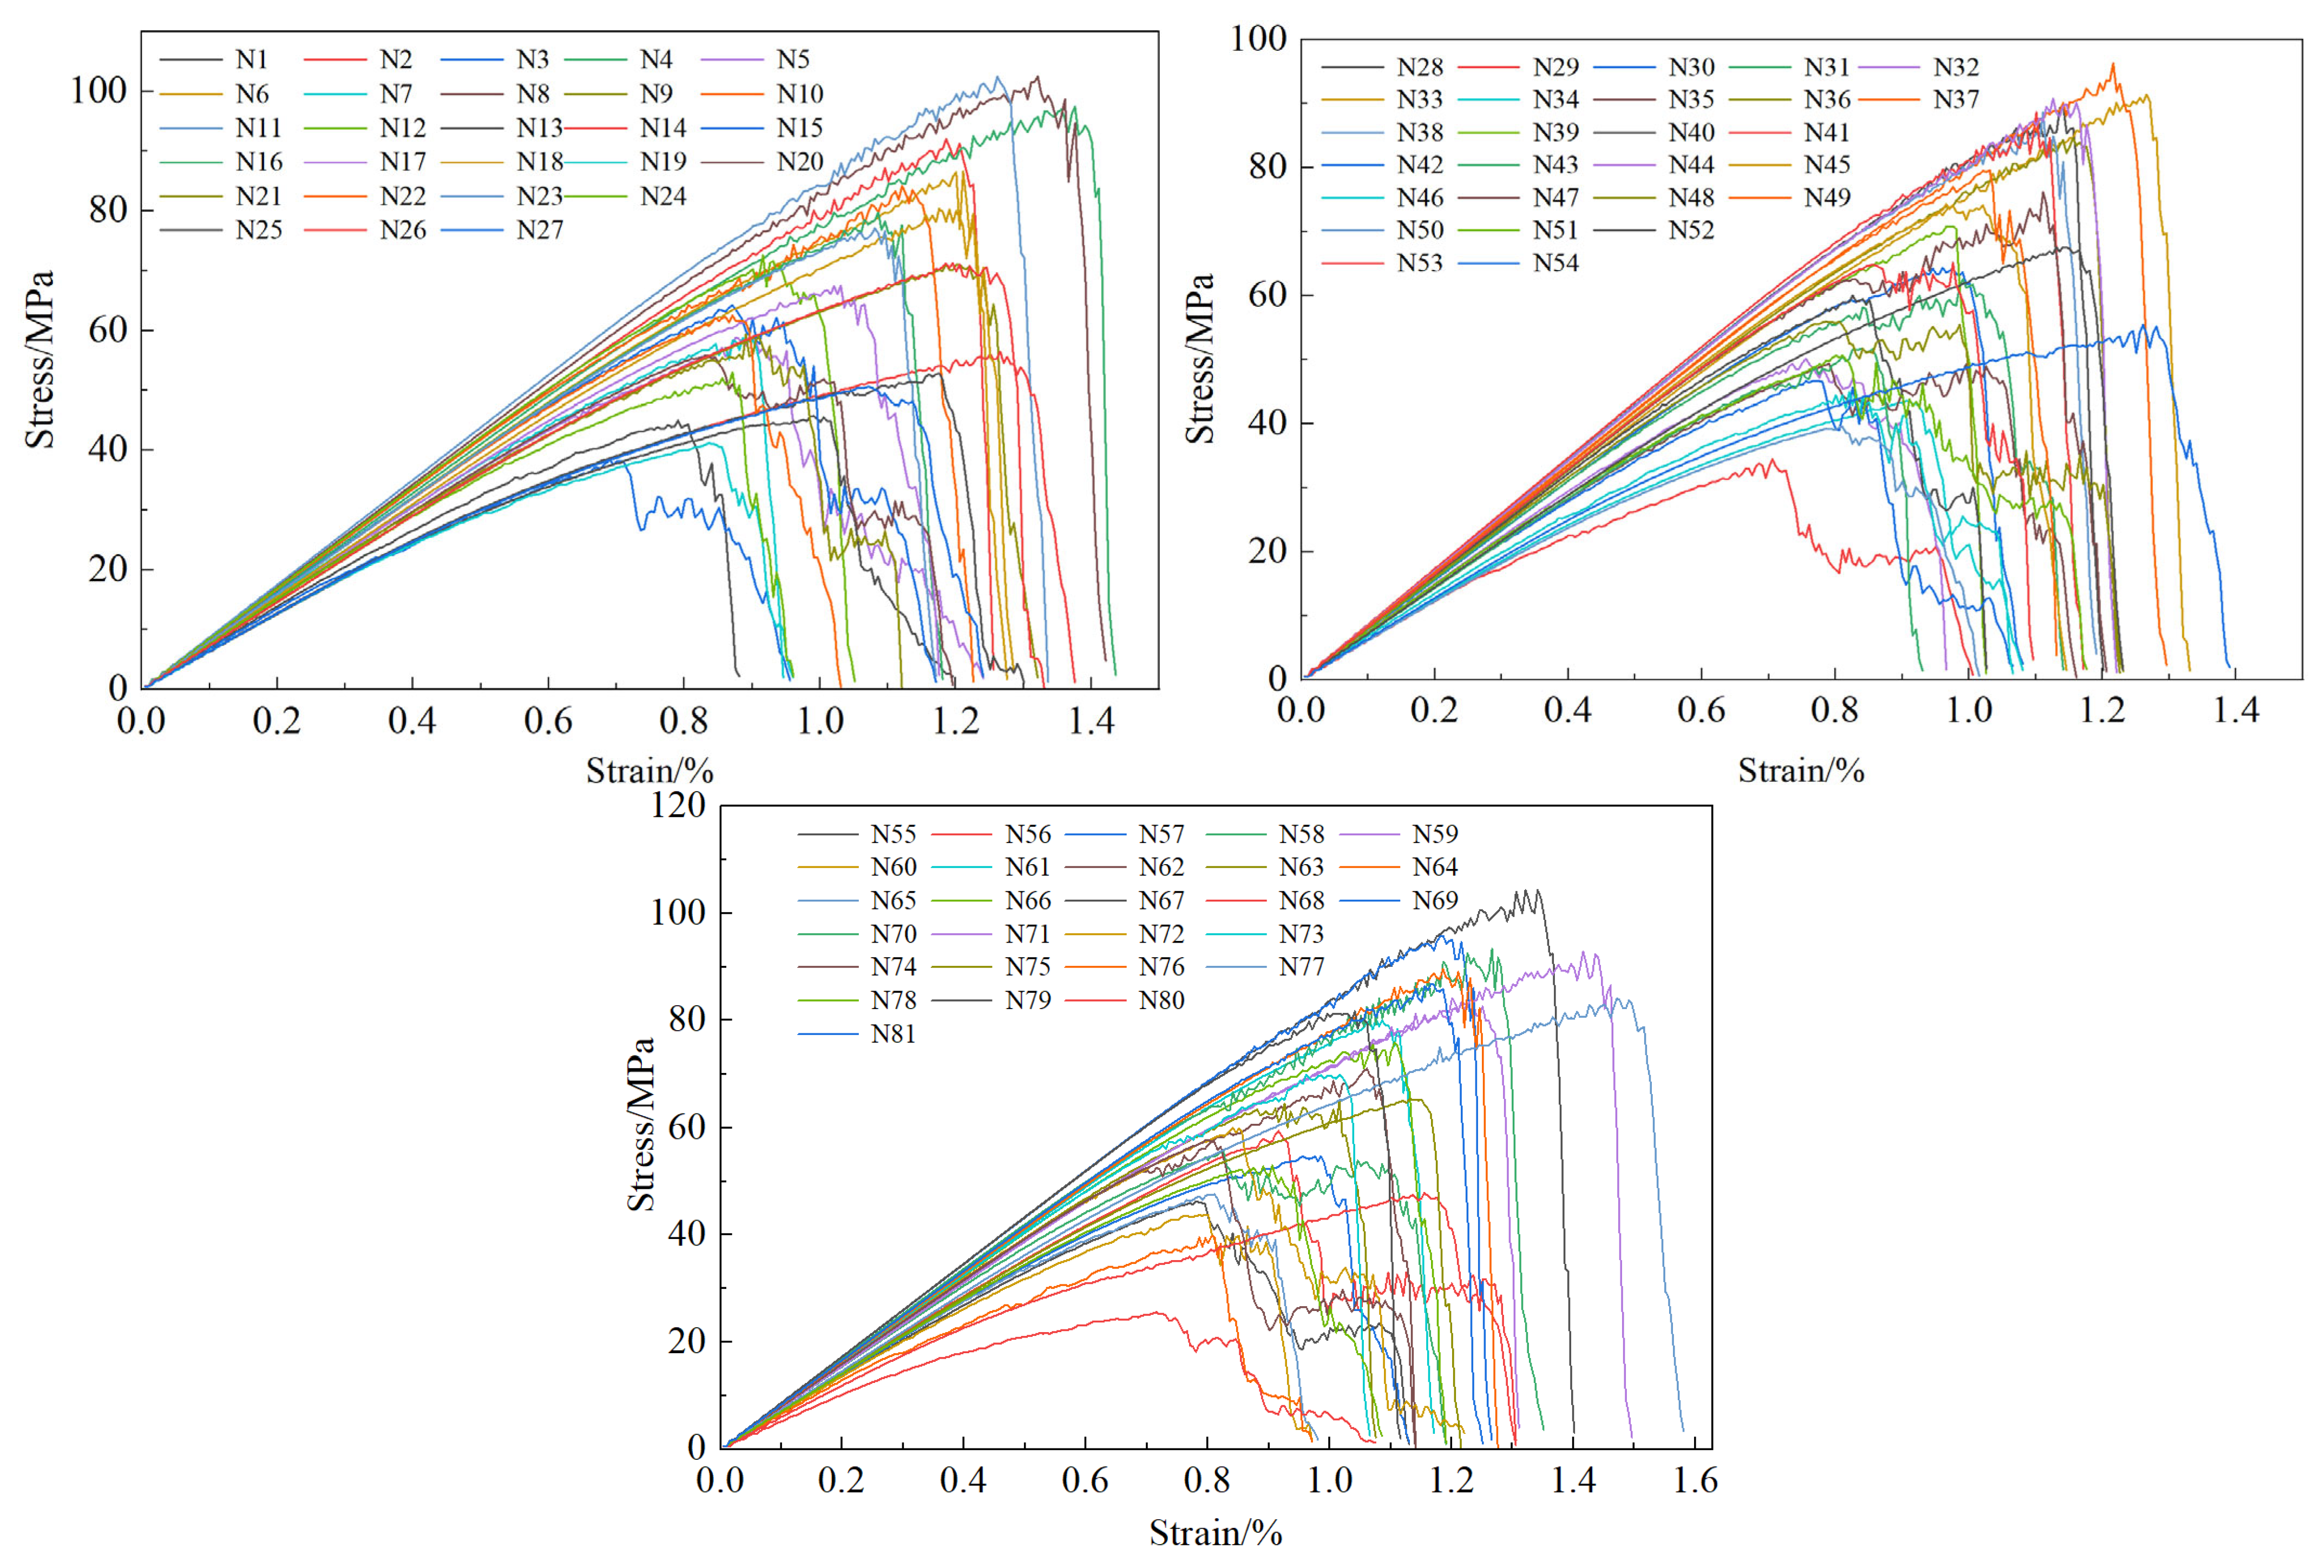
The stress–strain curves of sandstone under uniaxial compression under the coupling effect of multiple factors are shown in Figure 12. It can be seen that the stress–strain curves under the action of multiple factors are basically consistent in the pre-peak stage, all showing significant nonlinearity; however, there are significant differences in the post-peak stage, with some showing a brittle characteristic of sharp decline and some showing a plastic characteristic of slow stepwise change. The influence of each factor on the mechanical properties of sandstone under the coupling effect of multiple factors is rather complex, and the mechanical properties are closely related to the energy characteristics. Therefore, it is necessary to further clarify the important influencing factors affecting the mechanical properties and energy characteristics of fractured sandstone.

3.1. Correlation Analysis of Mechanical Properties

The Pearson correlation coefficient R is extensively employed to measure the degree of correlation between two variables, and its calculation is presented as shown in Equation (20):
R = ( x - x ¯ ) ( y - y ¯ ) ( x - x ¯ ) 2 ( y - y ¯ ) 2
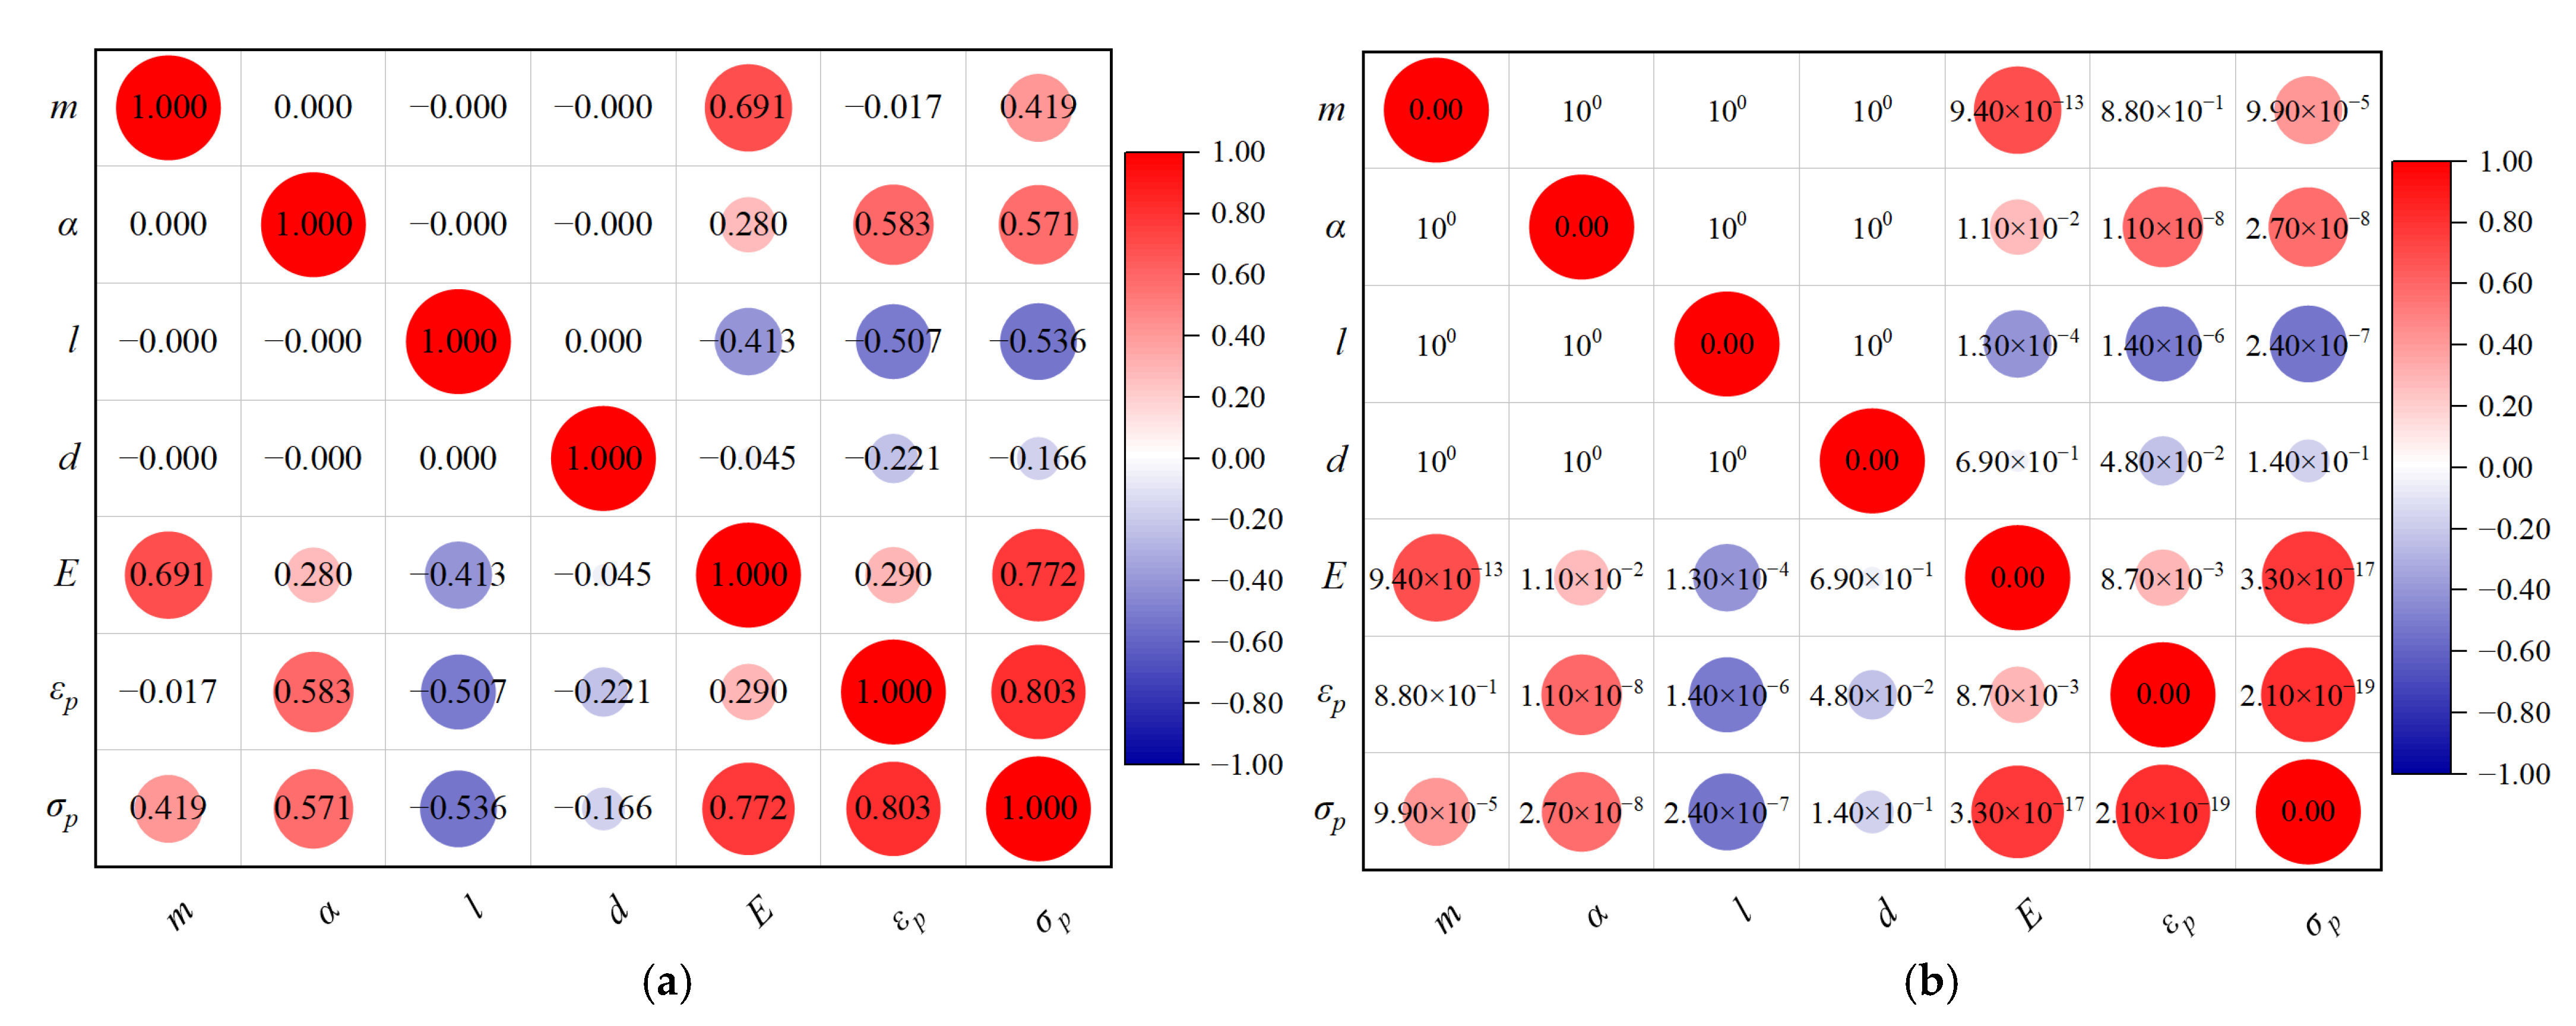
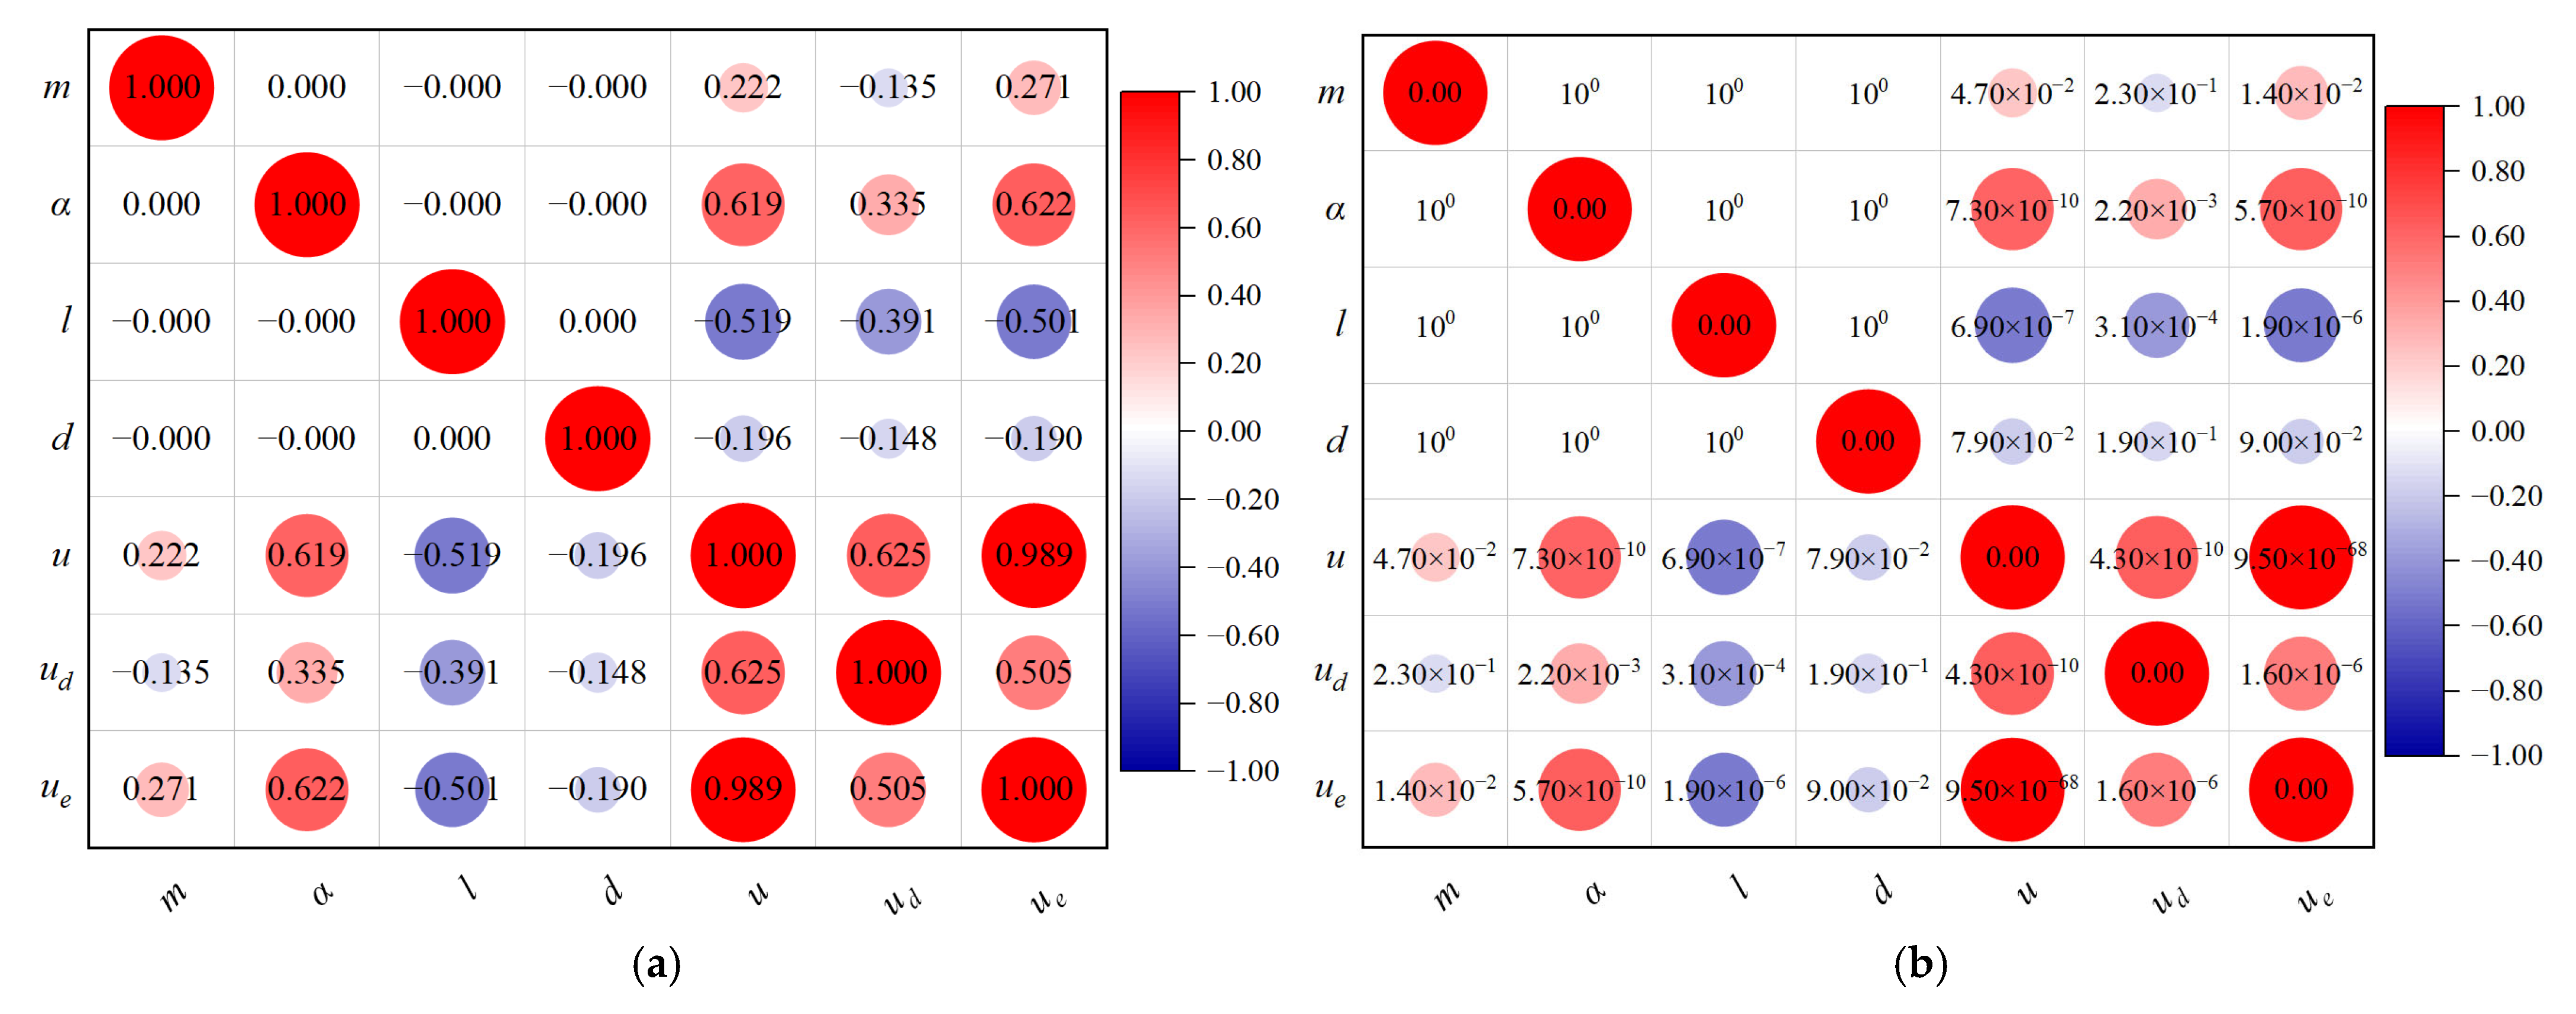
The Pearson correlation coefficient R ranges from −1 to 1. A larger absolute value of the coefficient implies a stronger correlation between the two variables. An absolute value approaching 0 suggests no correlation between the variables. Conducting significance tests on correlation coefficients is an essential step to ensure the validity of inferences from sample statistics to population parameters. Based on the t-test results of 81 groups, it is concluded that when the absolute value of the Pearson correlation coefficient ranges from 0 to 0.22, the variables are not significantly correlated. Only when the absolute value of the Pearson correlation coefficient exceeds 0.22 is the correlation considered significant. Specifically, a range from 0.22 to 0.28 indicates a weak correlation, 0.3 to 0.45 represents a moderate correlation, 0.5 to 0.7 signifies a strong correlation, and 0.8 to 1.0 denotes an extremely strong correlation. This paper qualitatively classifies the data correlation according to the above-mentioned criteria, and the correlation levels are solely used to represent the degree of data association. The significance test (p-value) and correlation coefficients of multiple factors with respect to the mechanical parameters of fractured sandstone are presented in Figure 13.
An analysis of Figure 13 indicates that the correlation coefficients between the homogeneity coefficient, fracture angle, fracture length, and fracture aperture and the elastic modulus are 0.691, 0.280, −0.413, and −0.045 respectively, with corresponding p-values of 9.40 × 10⁻¹³, 0.011, 1.30 × 10⁻⁴, and 0.69. This implies that the homogeneity coefficient has a strong correlation with the elastic modulus, the fracture angle has a weak correlation with the elastic modulus, the fracture length has a moderate correlation with the elastic modulus, and the fracture aperture has no significant relationship with the elastic modulus. The correlation coefficients between the homogeneity coefficient, fracture angle, fracture length, and fracture aperture and the peak strain are −0.017, 0.583, −0.507, and −0.221 respectively, with corresponding p-values of 0.88, 1.10 × 10⁻⁸, 1.40 × 10⁻⁶, and 0.048. This suggests that the homogeneity coefficient has no significant relationship with the peak strain, the fracture angle has a strong correlation with the peak strain, the fracture length has a strong correlation with the peak strain, and the fracture aperture has a weak correlation with the peak strain. The correlation coefficients between the homogeneity coefficient, fracture angle, fracture length, and fracture aperture and the peak stress are 0.419, 0.571, −0.536, and −0.166 respectively, with corresponding p-values of 9.90 × 10⁻⁵, 2.70 × 10⁻⁸, 2.40 × 10⁻⁷, and 0.14. This indicates that the homogeneity coefficient has a moderate correlation with the peak stress, the fracture angle has a strong correlation with the peak stress, the fracture length has a strong correlation with the peak stress, and the fracture aperture has no significant relationship with the peak stress.

3.2. Correlation Analysis of Energy Characteristics

Figure 14 presents the correlation coefficient heat map of multiple factors influencing the energy characteristics of fractured sandstone. After a comprehensive analysis of Figure 14, it becomes apparent that the correlation coefficients of the homogeneity coefficient, fracture angle, fracture length, and fracture aperture with total energy are 0.222, 0.619, −0.519, and −0.196 respectively, and the corresponding p-values are 0.047, 7.30 × 10⁻¹⁰, 6.90 × 10⁻⁷, and 0.079 respectively. This indicates that the homogeneity coefficient has a weak correlation with total energy, the fracture angle has a strong correlation with total energy, the fracture length has a strong correlation with total energy, and the fracture aperture has no significant relationship with total energy. The correlation coefficients of the homogeneity coefficient, fracture angle, fracture length, and fracture aperture with dissipated energy are −0.135, 0.335, −0.391, and −0.148 respectively, and the corresponding p-values are 0.23, 0.0022, 3.10 × 10⁻⁴, and 0.19 respectively. This implies that the homogeneity coefficient and fracture aperture have no significant relationship with dissipated energy, while the fracture angle and fracture length have a moderate correlation with dissipated energy. The correlation coefficients of the homogeneity coefficient, fracture angle, fracture length, and fracture aperture with elastic strain energy are 0.271, 0.622, −0.501, and −0.190 respectively, and the corresponding p-values are 0.014, 5.70 × 10⁻¹⁰, 1.90 × 10⁻⁶, and 0.09 respectively. This suggests that the homogeneity coefficient has a weak correlation with elastic strain energy, the fracture angle has a strong correlation with elastic strain energy, the fracture length has a strong correlation with elastic strain energy, and the fracture aperture has no significant relationship with elastic strain energy.

3.3. Single-Factor Analysis of Mechanical Properties

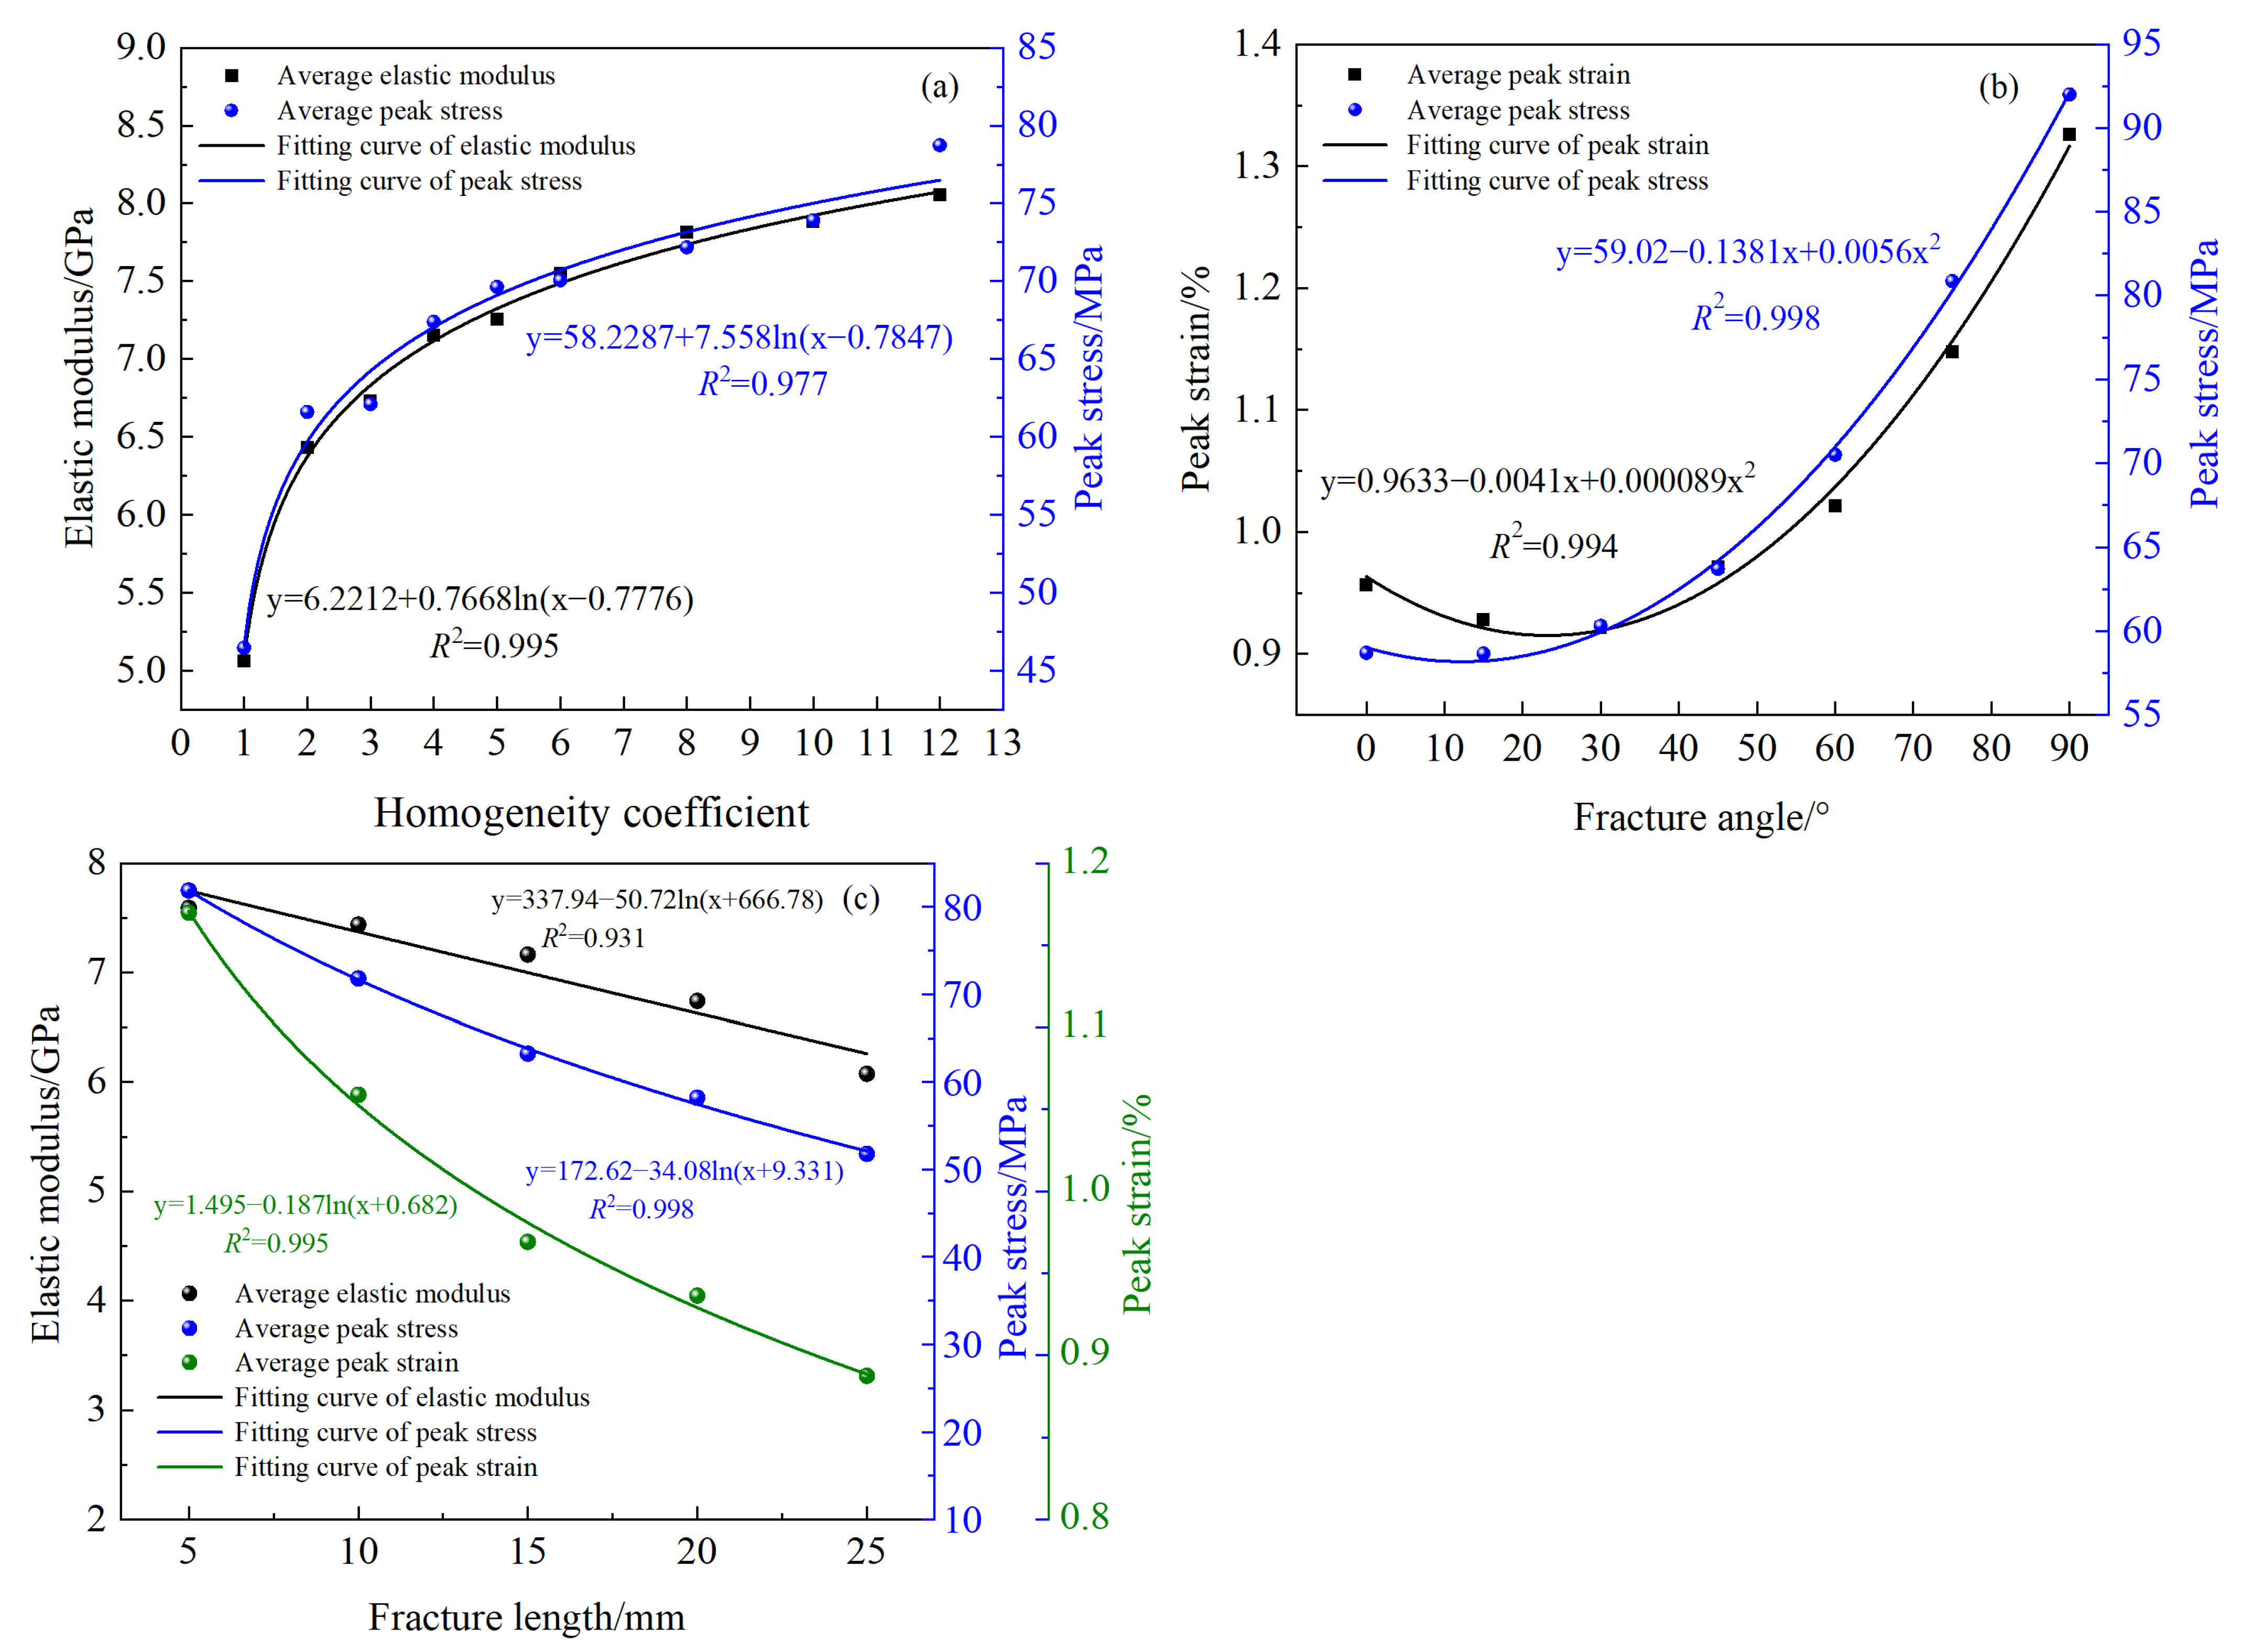
The influence of single factors on the mechanical properties of fractured sandstone is presented in Figure 15. By analyzing Figure 15a, it is evident that the average elastic modulus of fractured sandstone gradually increases as the homogeneity coefficient increases; however, the amplitude of the increase is inconsistent. When the homogeneity coefficient rises from 1 to 2, the average elastic modulus increases from 5.06 GPa to 6.43 GPa, an increase of 1.37 GPa. When the homogeneity coefficient increases from 2 to 12, the average elastic modulus increases from 6.43 GPa to 8.05 GPa, an increase of 1.62 GPa. The average peak stress of fractured sandstone also gradually increases with the increase in the homogeneity coefficient, yet the amplitude of the increase is inconsistent. When the homogeneity coefficient increases from 1 to 2, the average peak stress increases from 46.48 MPa to 61.60 MPa, an increase of 15.12 MPa. When the homogeneity coefficient increases from 2 to 12, the average peak stress increases from 61.60 MPa to 78.73 MPa, an increase of 17.13 MPa. It can be observed that the logarithmic function can effectively describe the relationship between the average elastic modulus, the average peak stress, and the homogeneity coefficient.
Analysis of Figure 15b indicates that both the average peak strain and the average peak stress of fractured sandstone display a “U”-shaped trend, where they first decrease and then increase as the fracture angle increases. When the fracture angle rises from 0° to 30°, the average peak strain drops from 0.95% to 0.92%, representing a reduction of 0.03%. When the fracture angle increases from 30° to 90°, the average peak strain climbs from 0.92% to 1.32%, showing an increase of 0.40%. When the fracture angle goes from 0° to 15°, the average peak stress declines from 58.70 MPa to 58.65 MPa, with a decrease of 0.05 MPa. When the fracture angle increases from 30° to 90°, the average peak stress ascends from 58.65 MPa to 92.00 MPa, presenting an increase of 33.35 MPa. It can be noted that a quadratic polynomial can effectively depict the relationship between the average peak strain, the average peak stress, and the fracture angle.
Analysis of Figure 15c indicates that the average elastic modulus, average peak strain, and average peak stress of fractured sandstone all decline as the fracture length increases. When the fracture length increases from 5 mm to 25 mm, the average elastic modulus drops from 7.59 GPa to 6.07 GPa, a decrease of 1.52 GPa; the average peak stress decreases from 81.87 MPa to 51.78 MPa, a decrease of 30.09 MPa; and the average peak strain decreases from 1.17% to 0.88%, a decrease of 0.29%. It can be noted that a logarithmic function can effectively depict the relationship between the average elastic modulus, average peak strain, and average peak stress and the fracture length.
Based on the relationship of the influence magnitudes of various factors on the mechanical properties of fractured sandstone, it is evident that the influencing factors of the elastic modulus of fractured sandstone, ranked by importance, are the homogeneity coefficient and the fracture length; the influencing factors of the peak strain of fractured sandstone, ranked by importance, are the fracture angle and the fracture length; the influencing factors of the peak stress of fractured sandstone, ranked by importance, are the fracture angle, the fracture length, and the homogeneity coefficient.

3.4. Single-Factor Analysis of Energy Characteristics

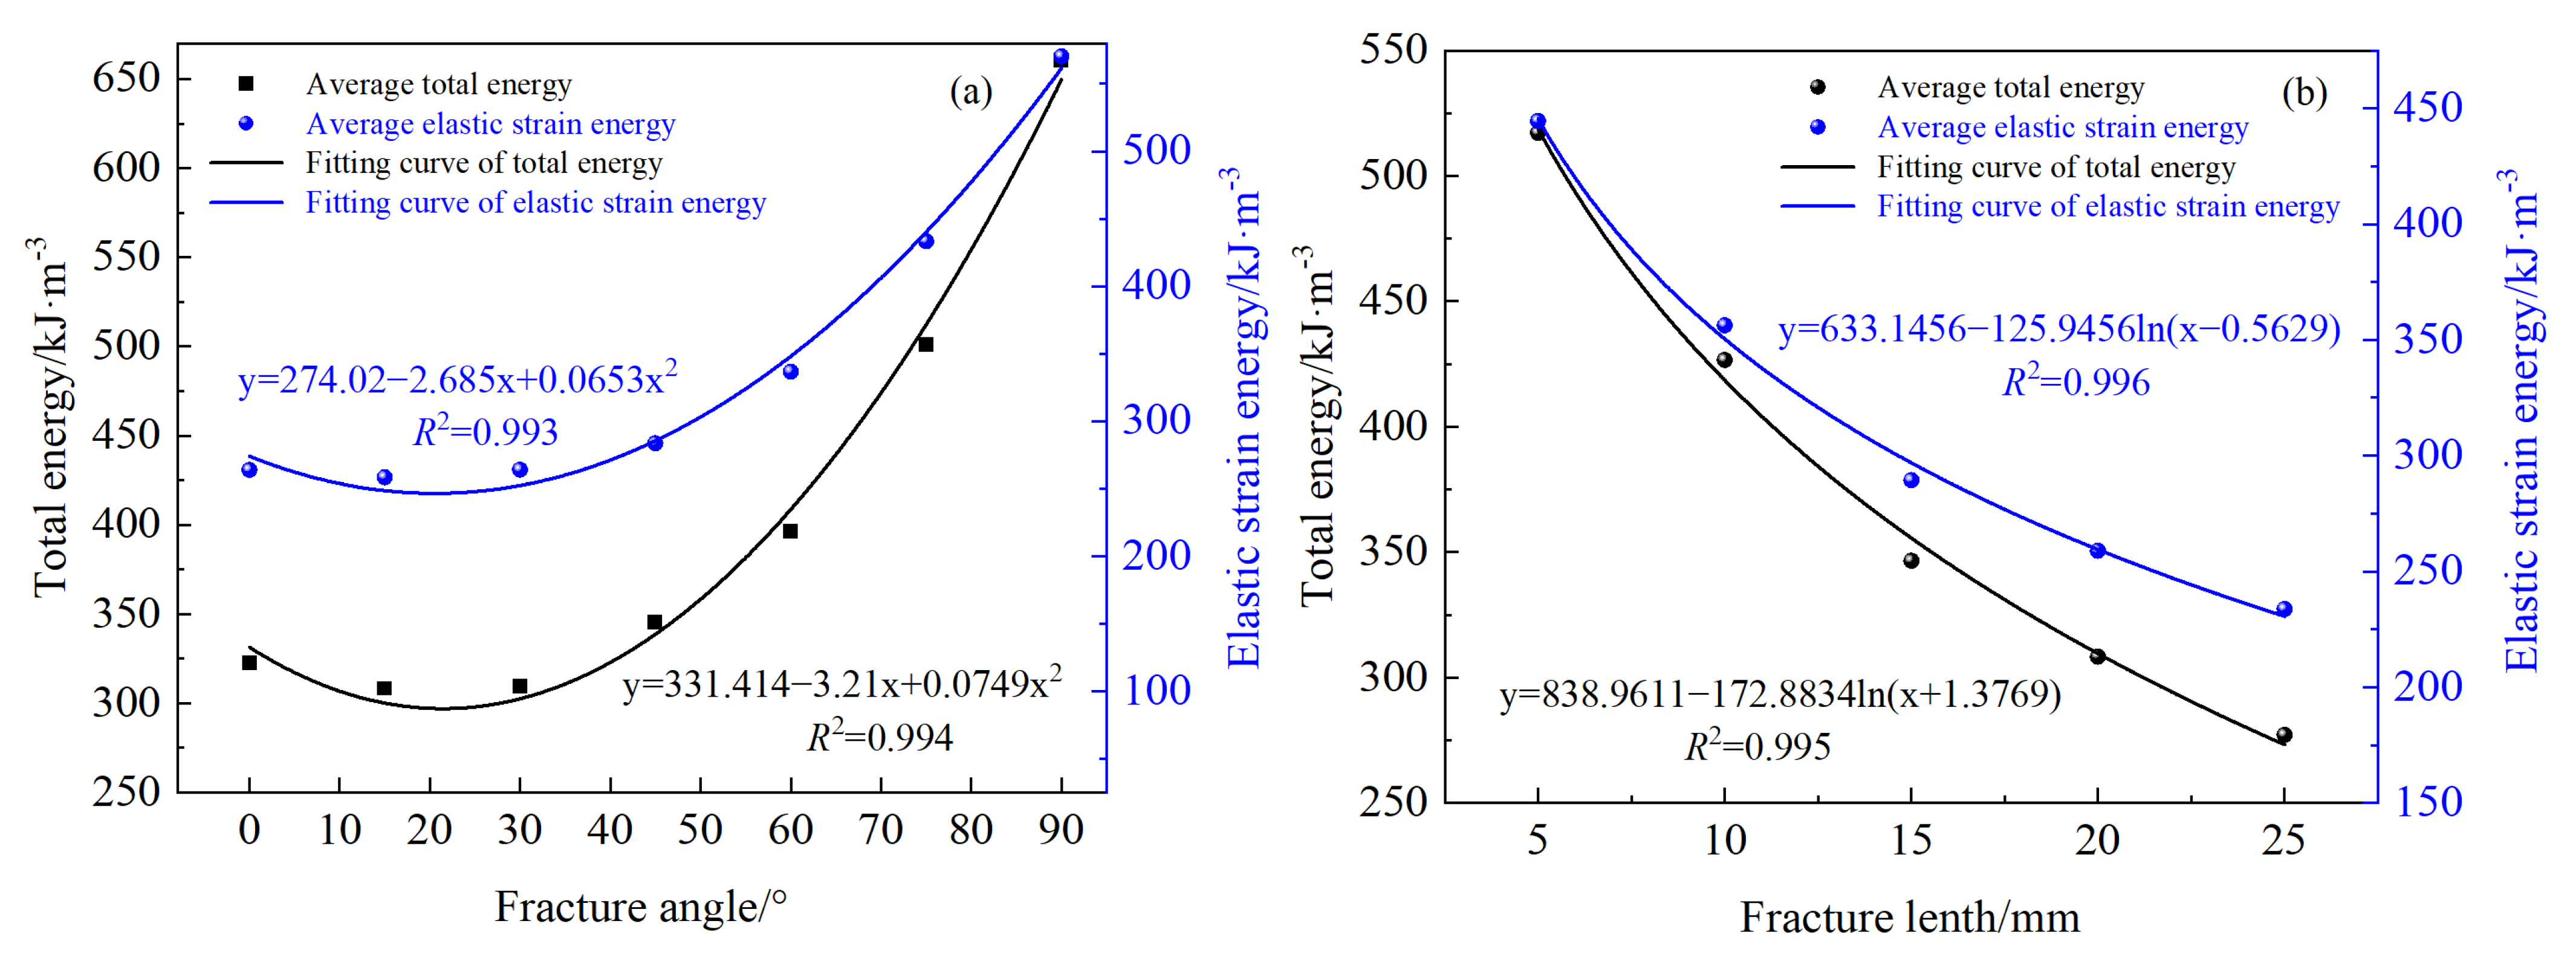
The influence of a single factor on the energy characteristics of fractured sandstone is presented in Figure 16. By analyzing Figure 16a, it is evident that both the average elastic strain energy and the average total energy of fractured sandstone display a “U”-shaped trend of initially decreasing and subsequently increasing as the fracture angle increases. When the fracture angle increases from 0° to 15°, the average elastic strain energy decreases from 263.87 kJ/m3 to 258.35 kJ/m3, a reduction of 5.52 kJ/m3, and the average total energy decreases from 322.62 kJ/m3 to 308.36 kJ/m3, a decrease of 14.26 kJ/m3. When the fracture angle increases from 15° to 90°, the average elastic strain energy increases from 258.35 kJ/m3 to 570.27 kJ/m3, an increase of 311.92 kJ/m3, and the average total energy increases from 308.36 kJ/m3 to 660.37 kJ/m3, an increase of 352.01 kJ/m3. It can be observed that a quadratic polynomial can effectively describe the relationship between the average elastic strain energy, the average total energy, and the fracture angle.
An analysis of Figure 16b indicates that both the average elastic strain energy and the average total energy of the fractured sandstone decline nonlinearly as the fracture length increases. When the fracture length increases from 5 mm to 25 mm, the average elastic strain energy decreases from 444.59 kJ/m3 to 233.67 kJ/m3, representing a reduction of 210.92 kJ/m3. Meanwhile, the average total energy decreases from 517.16 kJ/m3 to 277.04 kJ/m3, with a reduction of 240.12 kJ/m3. It is observable that the logarithmic function can effectively depict the relationship among the average elastic strain energy, the average total energy, and the fracture length. By considering the magnitude of the influence of each factor on the energy characteristics of the fractured sandstone, it can be determined that the influencing factors of the elastic strain energy and the total energy of the fractured sandstone, ranked by importance, are the fracture angle and the fracture length.

3.5. Model Construction of Peak Stress

The previous analysis has revealed that the factors with strong correlation to the peak stress of fractured sandstone are the fracture angle and the fracture length. Conducting a detailed quantitative analysis of the influence of these two types of fracture geometric parameters serves as a crucial link between the mesoscopic structural defects of rocks and their macroscopic mechanical responses. To further examine the relationship between the peak stress and the fracture angle and fracture length, numerical simulation calculations were performed under the conditions of m = 10 and d = 1.5 mm for different fracture angles (0°, 15°, 30°, 45°, 60°, 75°, 90°) and different fracture lengths (5 mm, 10 mm, 15 mm, 20 mm, 25 mm). The rock failure modes can be categorized as tensile splitting, tensile shearing, and shear splitting based on the fracture angle [60]. The relationship between the peak stress and the fracture angle and fracture length, established through multiple nonlinear regression using the results of numerical calculations, is presented in Equation (21), and the error calculation is shown in Equation (22).
σ p = 0.002 α 2 0.015 α 51.524 ln ( l + 10.864 ) + 227.728                                         0 ° α 15 ° 80.281 α 2 + 6021.279 α 56.208 ln ( l + 18.265 ) 108126.27             30 ° α 45 ° 0.006 α 2 0.116 α 22599.9 ln ( l + 33296.432 ) + 235411.089             60 ° α 90 °
where σp is the peak stress, α is the fracture angle, and l is the fracture length.
E p = σ p r σ s i σ s i × 100 %
where Ep is the error, σpr is the model prediction value, and σsi is the numerical calculation result.
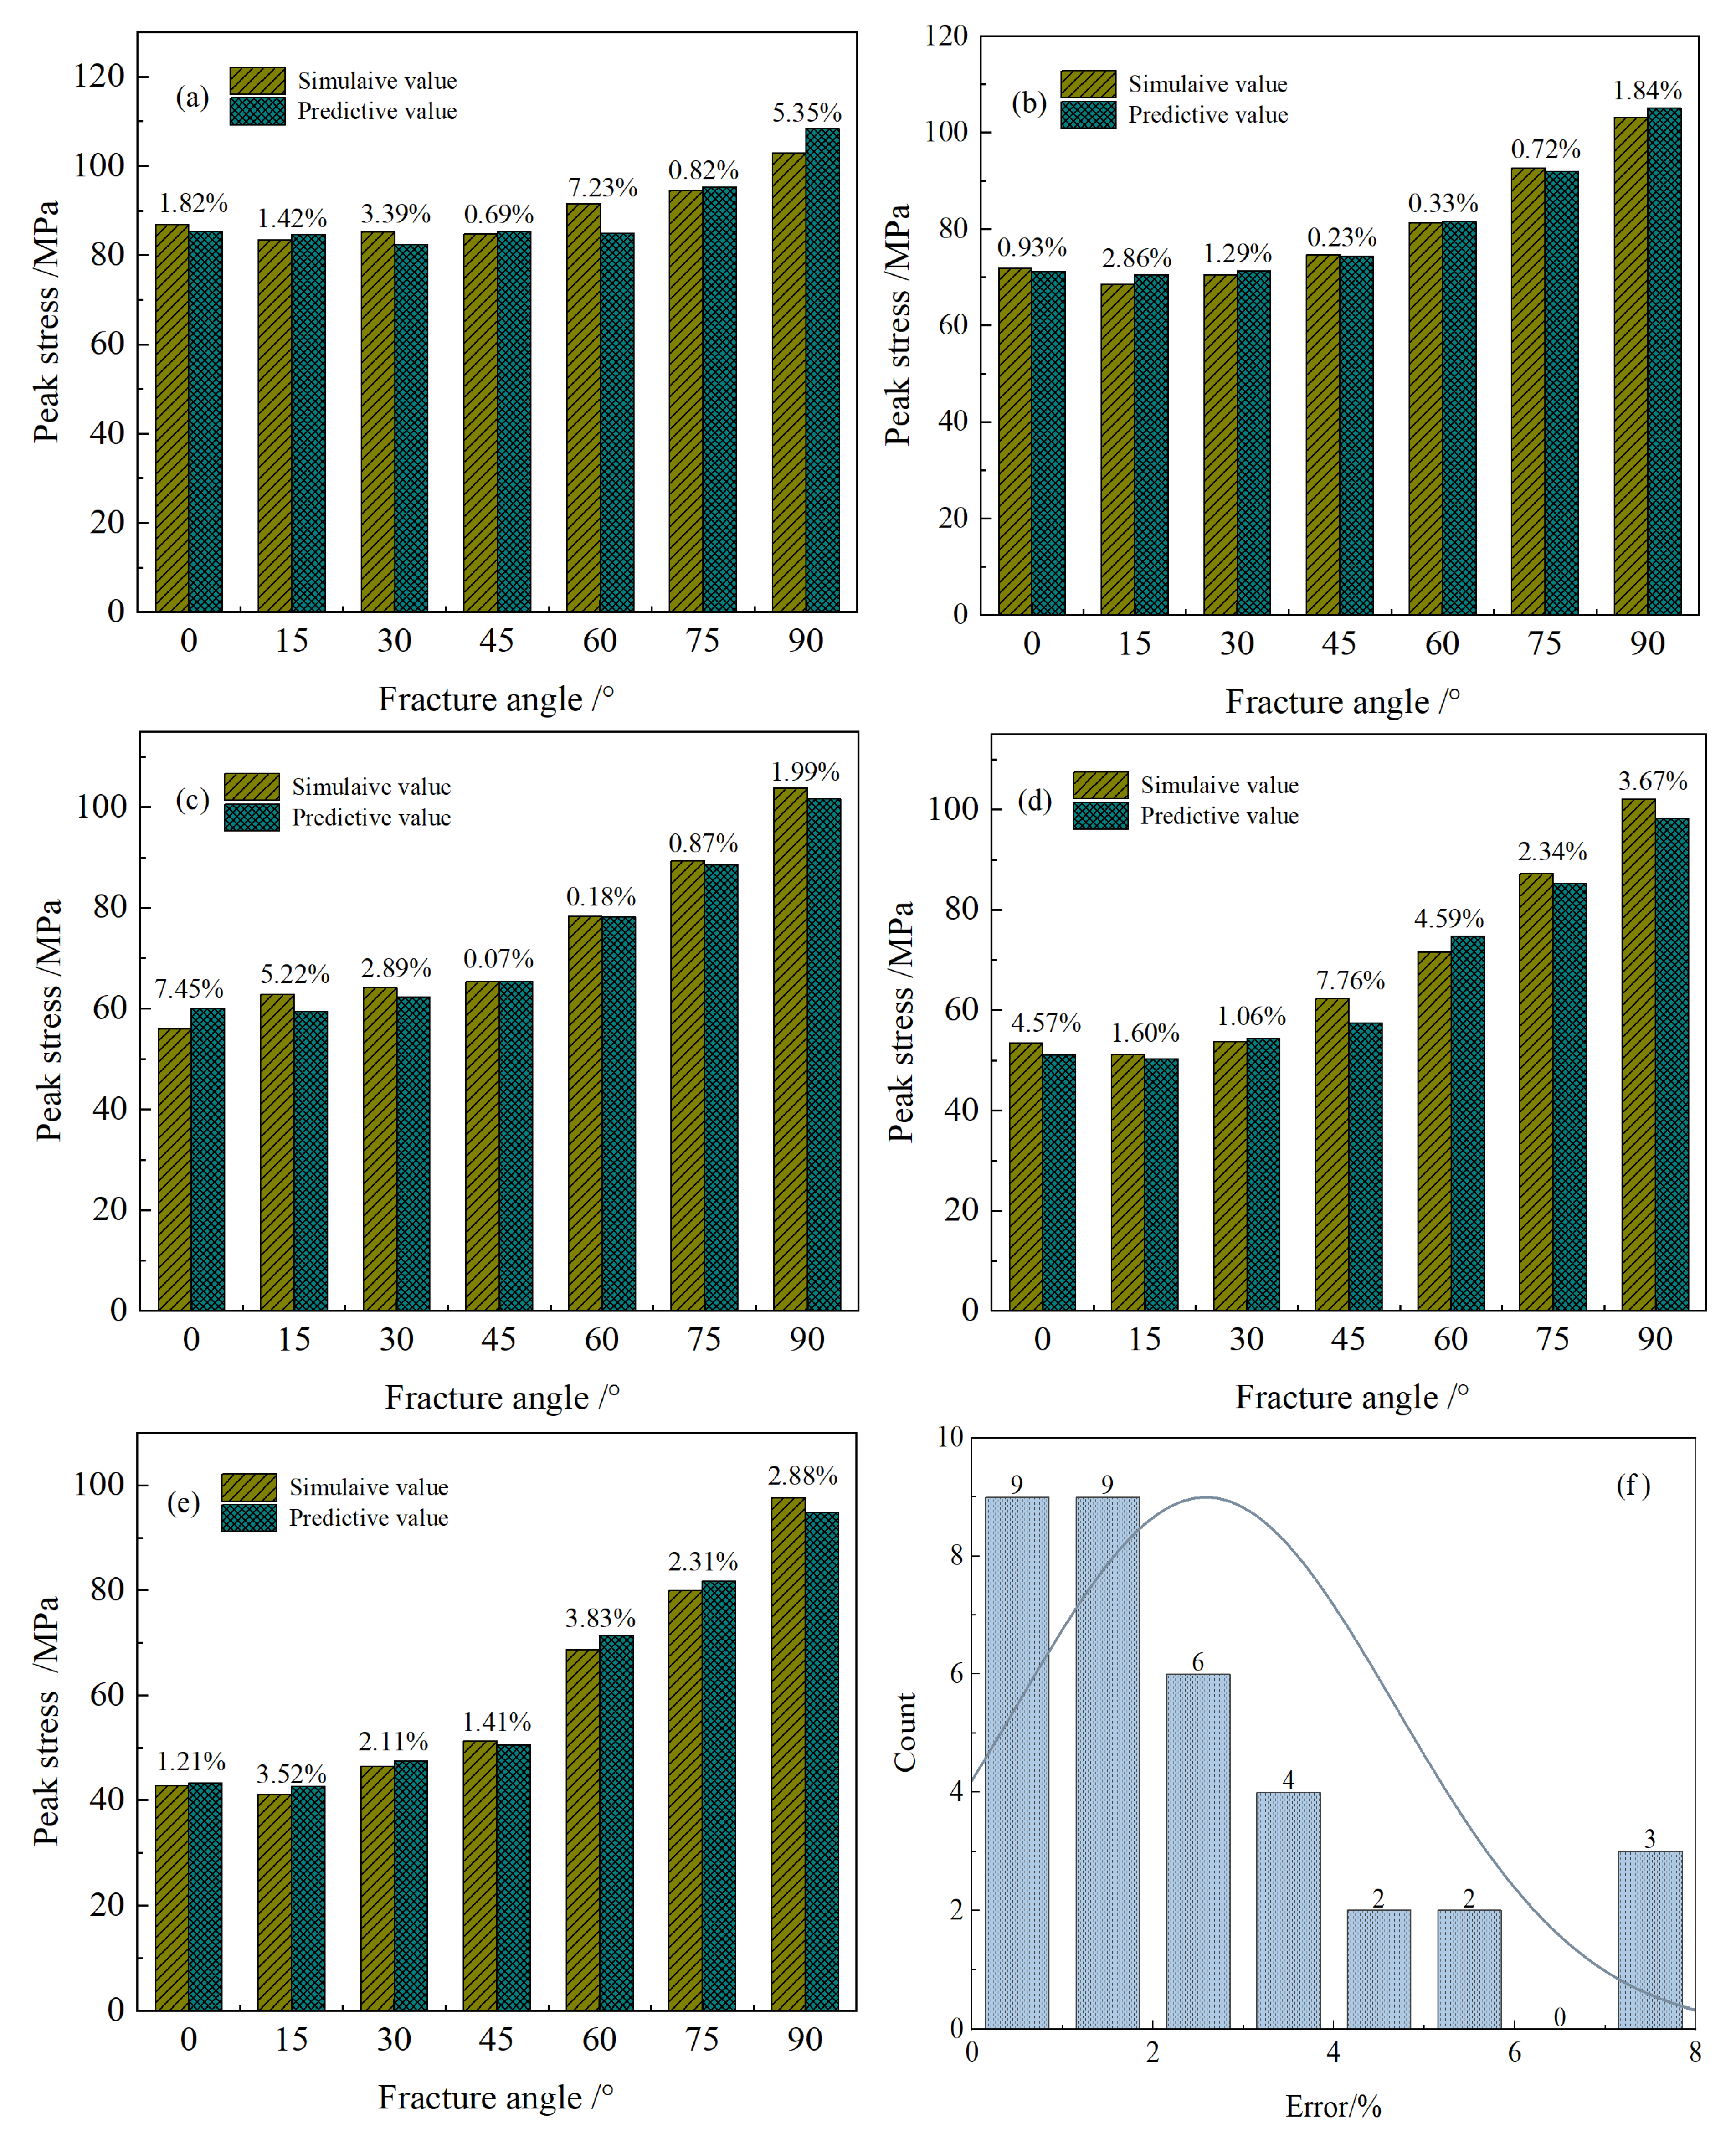
The relationship between the predicted peak stress values calculated based on Equations (21) to (22) and the numerical calculation results is presented in Figure 17. It is evident that when the crack length is 5 mm, the error between the predicted peak stress value and the numerical calculation ranges from 0.69% to 7.23%, with an average error of 2.96%. When the crack length is 10 mm, the error ranges from 0.23% to 2.86%, with an average error of 1.17%. When the crack length is 15 mm, the error ranges from 0.07% to 7.45%, with an average error of 2.67%. When the crack length is 20 mm, the error ranges from 1.06% to 7.76%, with an average error of 3.66%. When the crack length is 25 mm, the error ranges from 1.21% to 3.83%, with an average error of 2.47%. In summary, within the crack length range of 5 to 25 mm, the error between the predicted peak stress values and the numerical calculation results ranges from 0.07% to 7.76%, with an average error of 2.58%. Both exhibit a “U”-shaped trend of initially decreasing and then increasing as the crack angle increases. Data with errors between 0.06% and 5.50% account for 91.43%, and those between 7.20% and 7.80% account for 8.57%. Overall, the errors are relatively small, indicating that the proposed Equation (21) demonstrates good rationality in predicting the peak stress.

4. Discussion

In the past, the mechanical properties and energy characteristics of fractured rocks were predominantly investigated using the control variable method, and the variables under study had certain limitations. Nevertheless, the influence of the geometric characteristics and heterogeneity of fractures on the mechanical properties and energy characteristics of fractured sandstone is the outcome of the interaction of multiple factors. In this paper, through the design of orthogonal experiments and numerical simulation, the influence of the coupling of four factors, namely the homogeneity coefficient, fracture angle, fracture length, and fracture aperture, on the mechanical properties and energy characteristics of rocks was analyzed. The analysis indicates that the homogeneity coefficient is strongly correlated with the elastic modulus, and the elastic modulus increases as the homogeneity coefficient increases, which is consistent with the characteristic that the peak strength of rocks increases as the homogeneity improves [61,62]. The correlation between the fracture angle and the peak stress is strong. The peak strength shows a “U” trend of first decreasing and then increasing with the increase in the fracture angle, which is consistent with previous research results [63,64]. However, the fracture angle at which the peak strength reaches its minimum is not the same, which is related to the combined effect of factors such as the internal friction angle of the rock, frictional resistance, stress concentration, fracture angle, and fracture length. The fracture angle is strongly correlated with the total energy and elastic strain energy. The total energy and elastic strain energy show a “U” trend of first decreasing and then increasing with the increase in the fracture angle, which explains the essential reason why the peak intensity first decreases and then increases as the fracture angle increases. The fracture length is strongly correlated with the peak stress. The peak strength gradually decreases with the increase in the fracture length, which is relatively consistent with previous research results [65], but the fracture length at which the peak strength reaches its minimum is not the same. This is related to factors such as the internal friction angle of the rock, frictional resistance, stress concentration, and fracture angle. The fracture length is strongly correlated with the total energy and elastic strain energy. The total energy and elastic strain energy decrease with the increase in the fracture length, which explains the essential reason why the peak strength gradually decreases with the increase in the fracture length. In the peak strength prediction model, the regression model between peak stress and fracture angle is a quadratic polynomial, while the regression model between peak stress and fracture length exhibits a negative logarithmic relationship. The error between the predicted value and the simulated value of the prediction model is relatively small, which indirectly demonstrates the rationality that the main influencing factors of peak strength are fracture angle and fracture length.
It is noteworthy that the correlation between the aperture of fractures, their mechanical properties, and energy characteristics is relatively weak. Relevant research has indicated that as the aperture and length of fractures increase, the peak stress gradually decreases because of the stress concentration at the ends of the fractures. The relationship between the peak stress and the length and aperture of the fractures is as follows [60]:
σ p = 2 E η π ( l / 2 + d ) = λ 2 E η π
where σp is the peak stress, λ is the influence coefficient of fracture aperture, η is the surface energy per unit area of the fracture surface, and E is the elastic modulus.
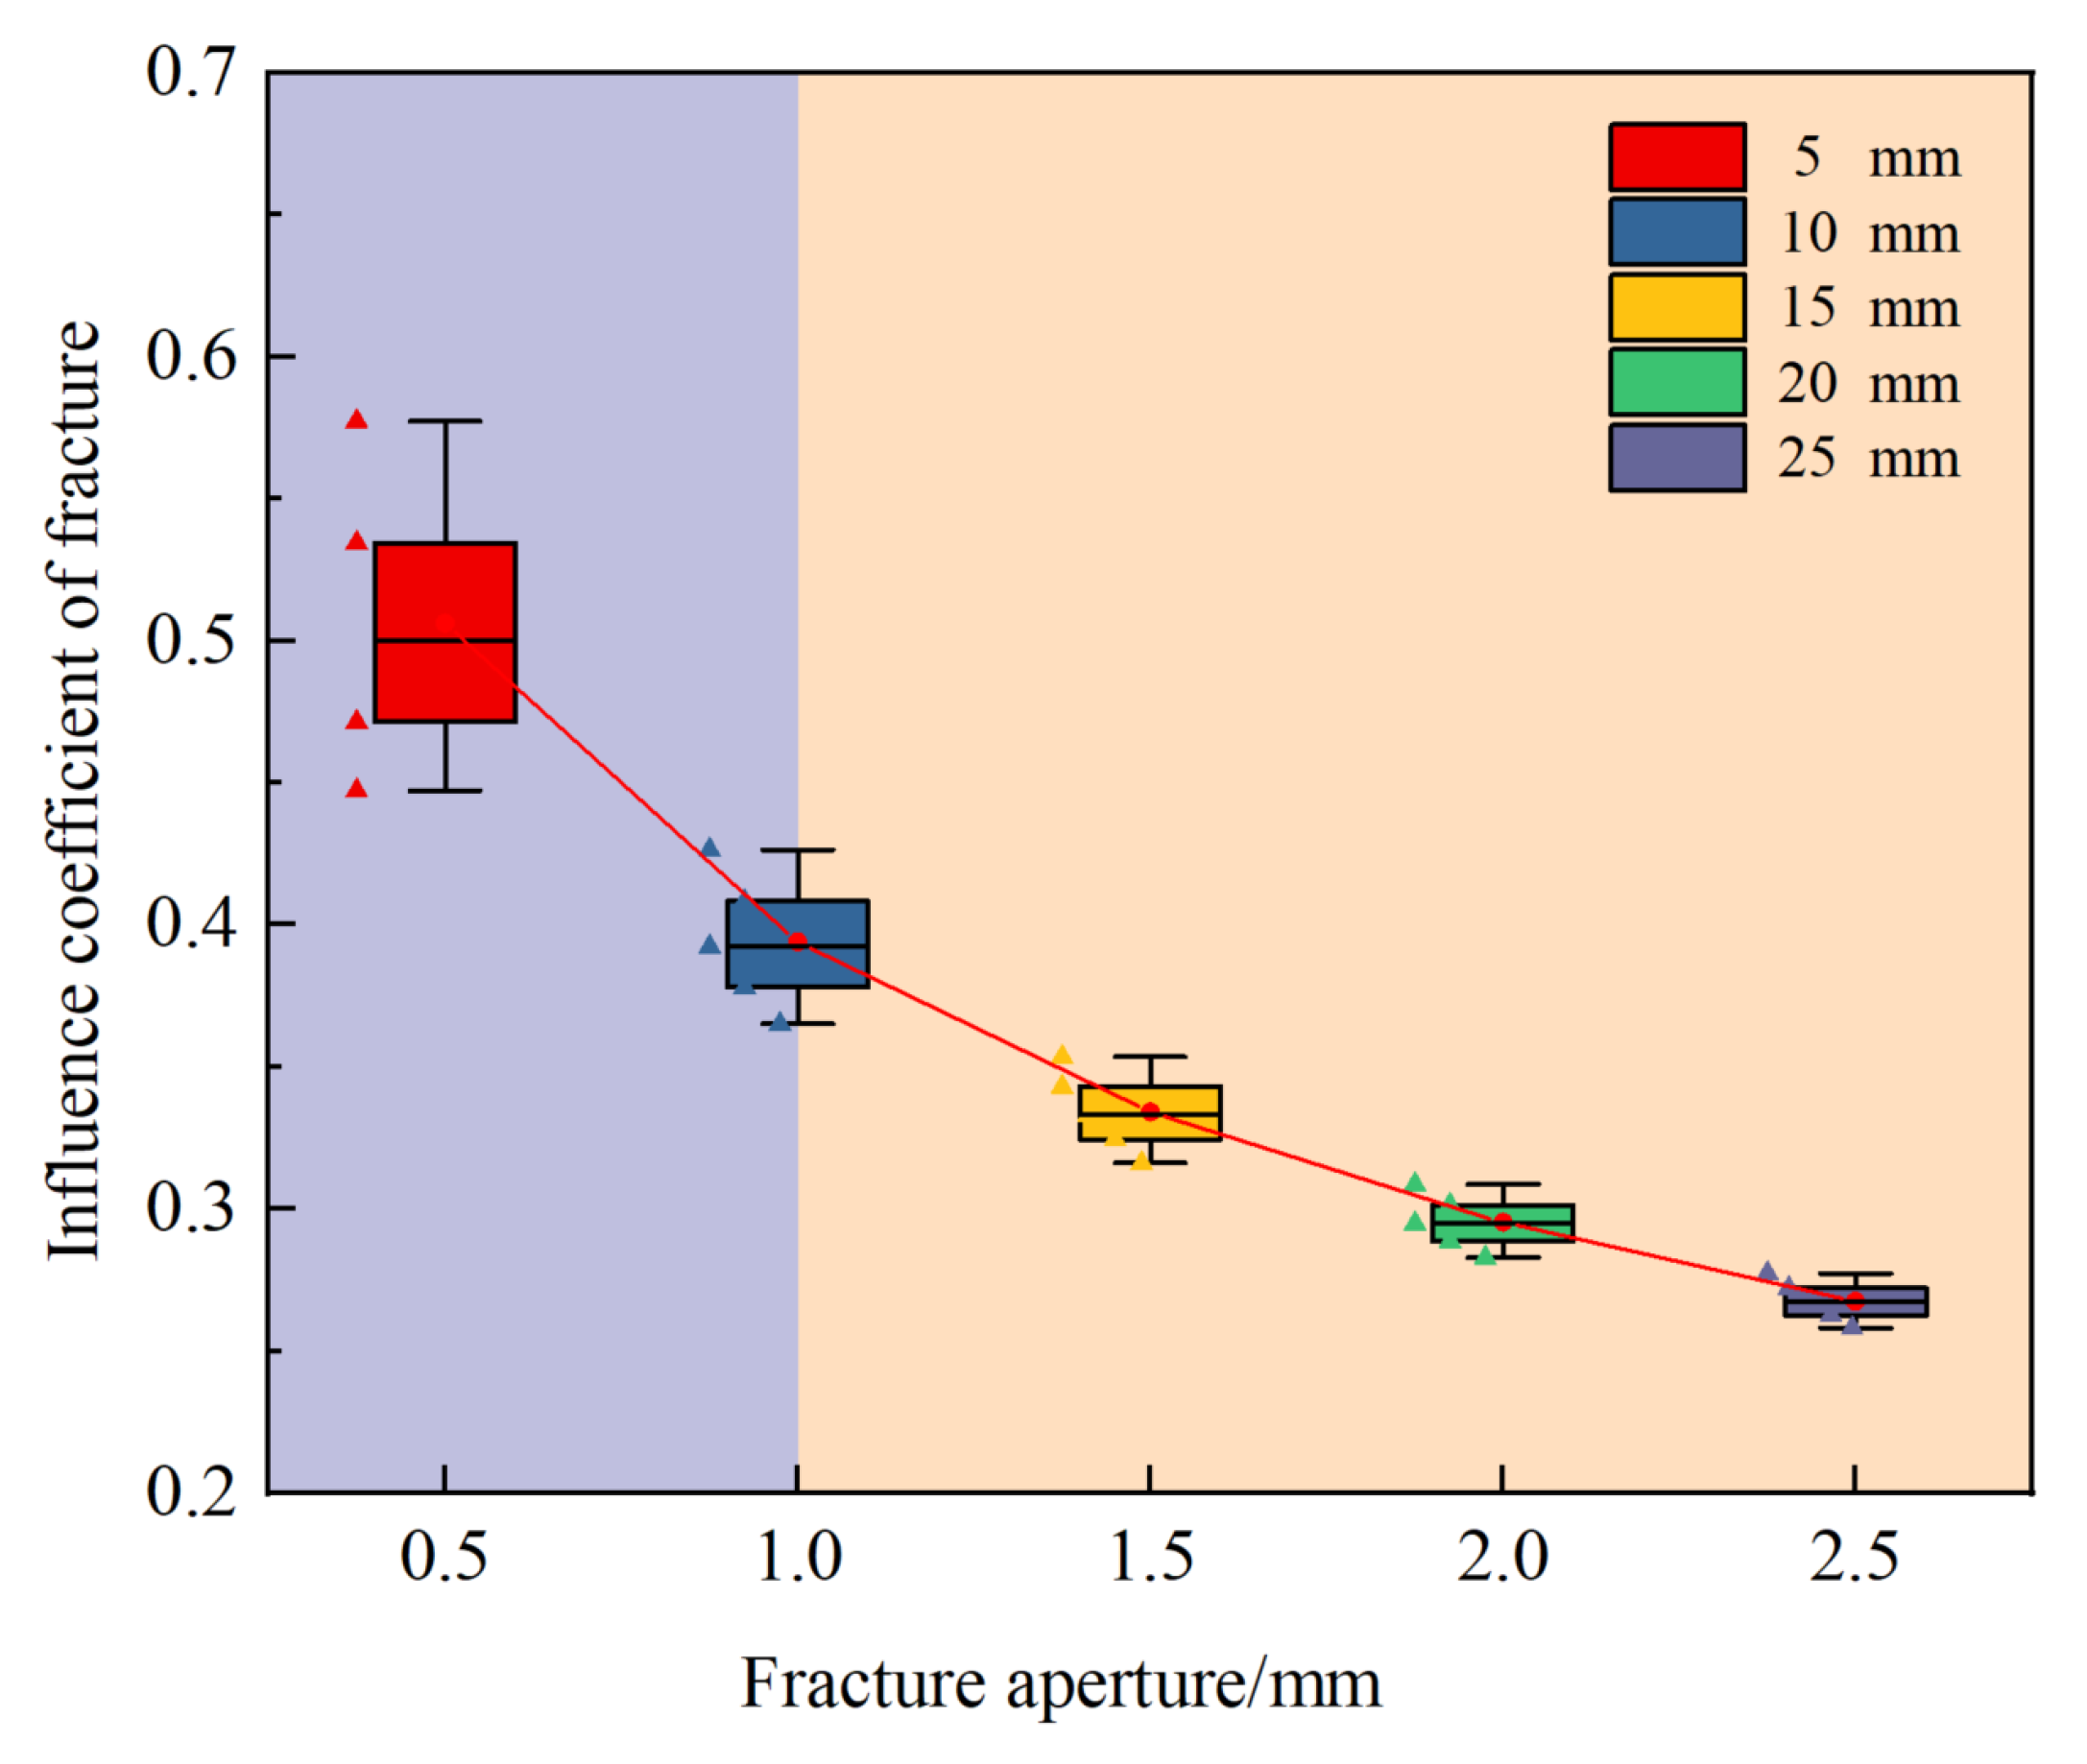
The relationship between the aperture of fractures and the fracture influence coefficient under different fracture lengths is presented in Figure 18. When the fracture aperture is less than 1.0 mm, the fracture aperture influence coefficient ranges from 0.37 to 0.58, with a variation range of 0.21. When the fracture aperture is greater than 1.0 mm, the fracture aperture influence coefficient ranges from 0.26 to 0.35, with a variation range of 0.09. This suggests that when the fracture aperture is less than 1.0 mm, the fracture aperture has a more significant impact on the peak stress, which is consistent with the findings of previous research [66]. The relatively small variation range of the fracture aperture results in a smaller influence of the fracture aperture on the peak stress.
However, this study still exhibits certain deficiencies. Although the mesoscopic parameters calibrated through the uniaxial compression of a single sample can relatively well characterize the mechanical properties of sandstone, the strength of sandstone may vary to a certain degree due to the coefficients of variation in water content, porosity, and average particle size [67]. Future research should enhance physical and numerical simulations of uniaxial tensile and triaxial tests, and utilize multiple physical test data to comprehensively validate the mesoscopic parameters calibrated numerically. The numerical simulation in this paper employs the Weibull distribution to characterize the heterogeneity of rocks. Mineral grains, cement, pores, and local weak planes exert a significant influence on rock heterogeneity, which might deviate from the actual mineral distribution characteristics within rocks. Subsequently, methods such as digital images or CT scans should be employed to accurately reconstruct the non-homogeneity of rocks to the greatest extent possible. The FDEM numerical method fails to account for the nonlinear mechanical behavior of the stress–strain curve in the compaction stage, leading to a certain disparity between the peak strain of numerical simulation and experimental data. Subsequently, the FDEM program requires improvement to take into account the nonlinear mechanical behavior of the stress–strain curve in the compaction stage. Meanwhile, the real three-dimensional stress environment underground, deep disturbance stress, temperature, geological faults, and structures may all have a substantial impact on the mechanical and energy characteristics of rocks. This paper offers a valuable preliminary insight into the influence of fracture geometric characteristics on the mechanical and energy characteristics of heterogeneous rocks. The existing research can serve as an initial exploration of methods to mitigate safety hazards in coal mining faces. The core challenge of future research lies in uncovering the intrinsic relationship between fracture geometric characteristics, rock heterogeneity, and multi-field coupling effects to meet the complex engineering requirements of deep mining, thereby contributing to the safe production and disaster prevention and control of deep mines.

5. Conclusions

This paper primarily studies the influence of heterogeneity and fracture geometric characteristics (angle, length, aperture) on the mechanical and energy characteristics of rocks by numerical simulation. It explores the primary controlling factors that affect the mechanical and energy characteristics of rocks, conducts multi-factor correlation and single-factor analyses, and establishes a peak strength regression model and validates this model; the key findings are summarized as follows:
(1)
The homogeneity coefficient exhibits a strong correlation with the elastic modulus and a moderate correlation with the peak stress; the fracture angle demonstrates a strong correlation with the peak strain and peak stress; the fracture length shows a moderate correlation with the elastic modulus and a strong correlation with the peak strain and peak stress; the fracture aperture has no significant relationship with the elastic modulus and peak stress, and has a weak correlation with the peak strain.
(2)
The homogeneity coefficient exhibits a weak correlation with the total energy and elastic energy, and there is no significant relationship with the dissipated energy. The fracture angle demonstrates a strong correlation with the total energy and elastic energy, and a moderate correlation with the dissipated energy. The fracture length shows a strong correlation with the total energy and elastic energy, and a moderate correlation with the dissipated energy. The fracture aperture shows no significant relationship with the total energy, elastic energy, or dissipated energy.
(3)
The homogeneity coefficient and fracture length have a significant impact on the elastic modulus of fractured sandstone. The fracture angle and fracture length have a significant influence on the peak strain, elastic strain energy and total energy of fractured sandstone. The fracture angle, fracture length and homogeneity coefficient have a significant effect on the peak stress of fractured sandstone.
(4)
The elastic modulus and peak stress show a logarithmic relationship with the homogeneity coefficient, while the elastic strain energy and total energy have a logarithmic relationship with the crack length. The peak strain and peak stress have a quadratic polynomial relationship with the crack angle, and the elastic strain energy and total energy also have a quadratic polynomial relationship with the crack angle. The elastic modulus, peak strain, and peak stress have a logarithm relationship with the crack length.
(5)
The regression model for the peak stress of fractured rock in relation to the fracture angle is a quadratic polynomial, while the regression model in relation to the fracture length exhibits a linear relationship. The predicted values of the peak stress of fractured rock and the numerical calculation errors are predominantly distributed within the range of 0.07% to 7.76%, with an average error of 2.58%. Both the predicted values of the peak stress and the numerical calculation results demonstrate a “U”-shaped change trend, initially decreasing and then increasing as the fracture angle increases.

Author Contributions

Conceptualization, B.C.; methodology, B.C., C.L. and Z.T.; software, B.C. and L.Z.; formal analysis, J.Y. and Z.T.; data curation, J.Y. and L.Z.; writing—original draft preparation, B.C. and C.L.; writing—review and editing, B.C. and L.Z.; visualization, B.C. and Z.T.; funding acquisition, C.L. All authors have read and agreed to the published version of the manuscript.

Funding

This research was funded by the Ordos Postdoctoral Research Fund, grant number OPRF2403.

Data Availability Statement

The original contributions presented in this study are included in the article. Further inquiries can be directed to the corresponding author.

Acknowledgments

We express our gratitude to Wuhan Geomechsim Technologies for providing the student version of PCDC2D (v2025) and to the after-sales staff for their assistance in using the software.

Conflicts of Interest

Author Chunwei Ling was employed by China Coal Research Institute. The remaining authors declare that the research was conducted in the absence of any commercial or financial relationships that could be construed as potential conflicts of interest.

Appendix A

Table A1. Orthogonal experiment table and statistical results of numerical simulation (L81).
Numbermα/°l/mmd/mm E/GPaεp/%σp/MPaU/kJ·m−3Ud/kJ·m−3Ue/kJ·m−3
1402026.180.7944.96197.8234.25163.57
2675528.141.1991.98570.4150.63519.78
3615251.55.540.6938.36143.4210.60132.82
45901527.761.3897.41735.03123.58611.45
5415150.57.100.8858.84273.3029.47243.83
64751017.701.2186.59561.8274.65487.17
71030200.57.260.8759.06277.4537.16240.29
8890518.341.32102.48722.9693.64629.32
9215526.611.1971.16467.8185.00382.81
101015100.57.991.0980.42468.8563.97404.87
111290150.58.631.26102.43679.2071.17608.03
1212301028.300.9572.62367.0249.20317.82
131451025.430.9945.73266.9474.30192.64
14190202.55.041.2756.49420.37104.02316.35
15615102.57.870.8764.25296.4834.15262.33
1644551.57.781.0979.76456.2547.18409.07
17360150.57.291.0367.50383.4770.92312.55
18330517.271.1879.83510.3071.91438.39
1920201.55.590.8441.13196.0844.78151.30
20315102.57.250.8355.82249.3834.54214.84
21630200.56.840.9560.33313.8747.76266.11
226451517.840.8762.54293.8244.21249.61
23415527.791.0877.09449.9568.28381.67
241202026.710.8753.00257.4048.09209.31
2510515.291.1852.83369.26105.58263.68
2621550.56.601.2071.27476.4591.59384.86
271751525.331.0750.65314.0273.45240.57
281275201.58.431.1489.66541.9065.10476.80
29302524.770.7134.46133.599.11124.48
30460152.57.560.9664.36342.3768.38273.99
31801527.300.9962.62349.8181.07268.74
3210452527.070.7650.21203.7325.53178.20
33490101.57.621.2791.48616.8167.65549.16
34130101.55.450.9143.54228.6854.78173.90
3530151.56.790.7949.37212.5132.96179.55
36575151.57.931.1684.68524.8872.50452.38
376902018.131.2296.35601.3230.36570.96
3810052.58.411.1188.64513.1746.26466.91
3910602027.990.9770.85368.3554.12314.23
4012151517.740.8360.04265.0432.05232.99
41121551.58.591.0885.86494.5965.49429.10
425152016.580.7746.73196.5930.64165.95
43345201.56.800.8451.76238.1041.09197.01
4486051.58.39 1.13 90.78 527.59 36.52 491.07
456601028.14 0.97 74.30 376.73 37.77 338.96
464302515.86 0.80 44.03 193.59 28.27 165.32
478151028.00 1.03 69.83 403.87 99.08 304.79
48100151.57.70 0.81 55.96 248.06 44.61 203.45
49875250.58.32 1.03 79.57 436.42 56.11 380.31
501602015.55 0.81 39.54 182.74 41.98 140.76
51815201.56.79 0.81 50.46 226.10 38.51 187.59
52260101.56.64 1.13 67.59 425.53 81.44 344.09
53801018.09 0.98 65.19 369.81 107.30 262.52
541050.55.12 1.26 55.43 415.16 114.91 300.25
552301526.47 0.78 45.96 194.91 31.60 163.31
5640200.56.78 0.92 59.48 288.56 27.64 260.91
572451516.53 0.99 54.79 310.86 80.92 229.94
5860151.57.37 0.83 55.61 250.32 40.43 209.89
59375100.57.26 1.22 83.46 543.37 63.94 479.43
603152016.15 0.80 43.85 199.16 42.82 156.34
6153051.58.03 1.07 79.89 455.64 58.20 397.44
62845200.57.35 1.06 71.12 410.31 66.05 344.26
63501017.72 1.02 65.10 383.04 108.71 274.33
6450252.54.85 0.81 39.76 178.61 15.60 163.00
655152026.59 0.81 47.64 215.39 43.21 172.18
66545100.57.87 1.11 75.81 469.17 103.94 365.23
671090101.58.27 1.34 104.38 750.69 92.14 658.55
68115150.54.19 1.21 48.52 343.82 62.93 280.89
691075518.56 1.19 95.77 596.49 60.61 535.88
70120100.57.60 1.27 93.34 629.01 55.39 573.62
71390526.98 1.42 92.93 718.92 100.27 618.65
7210151517.70 0.84 60.05 271.33 37.23 234.10
7312602517.88 1.02 69.97 397.08 86.49 310.59
74830152.57.76 0.80 57.52 244.50 31.21 213.29
75275202.56.55 1.13 65.41 417.73 91.13 326.60
7656050.57.99 1.19 89.64 560.40 57.29 503.11
77290250.56.21 1.47 84.13 698.01 128.09 569.93
78201016.69 0.91 52.97 271.00 61.39 209.61
79124552.58.64 1.04 81.68 459.73 73.46 386.27
80115251.54.18 0.72 25.58 108.95 30.57 78.38
816050.58.11 1.17 86.81 543.91 79.40 464.51

References

  1. Chen, H.; Zhang, X.; Niu, Y.; Cong, D.; Ren, Y.; Wang, Y.-D. Heterogeneous Structure-Induced Excellent Functional Properties in Shape Memory Alloys: A Review. JOM 2023, 75, 1393–1404. [Google Scholar] [CrossRef]
  2. Duan, H.; Lu, Y.; Jiang, T.; Feng, X.; Liu, T. Numerical simulation of the influence of heterogeneity on the mechanical behaviour of prefabricated fissured granite. Eng. Fract. Mech. 2025, 330, 111693. [Google Scholar] [CrossRef]
  3. Hu, X.; Liao, D.; Hu, H.; Xie, S.; Xie, N.; Gong, X. The Influence of Mechanical Heterogeneity of Grain Boundary on Mechanical and Microcracking Behavior of Granite Under Mode I Loading Using a Grain-Based Model. Rock Mech. Rock Eng. 2024, 57, 3139–3169. [Google Scholar] [CrossRef]
  4. Lin, Q.; Cao, P.; Wen, G.; Meng, J.; Cao, R.; Zhao, Z. Crack coalescence in rock-like specimens with two dissimilar layers and pre-existing double parallel joints under uniaxial compression. Int. J. Rock Mech. Min. Sci. 2021, 139, 104621. [Google Scholar] [CrossRef]
  5. Lin, Q.; Zhang, S.; Lin, H.; Zhang, K.; Fan, W.; Huang, C.; Shao, Z.; Lan, M. Failure behavior of jointed rock masses containing a circular hole under compressive-shear load: Insights from DIC technique. Theor. Appl. Fract. Mech. 2025, 139, 105089. [Google Scholar] [CrossRef]
  6. Sun, B.; Liu, S.; Zeng, S.; Wang, S.; Wang, S. Dynamic characteristics and fractal representations of crack propagation of rock with different fissures under multiple impact loadings. Sci. Rep. 2021, 11, 13071. [Google Scholar] [CrossRef]
  7. Tang, H. Multi-scale crack propagation and damage acceleration during uniaxial compression of marble. Int. J. Rock Mech. Min. Sci. 2020, 131, 104330. [Google Scholar] [CrossRef]
  8. Wang, H.; Gao, Y.; Zhou, Y. Experimental and numerical studies of brittle rock-like specimens with unfilled cross fissures under uniaxial compression. Theor. Appl. Fract. Mech. 2022, 117, 103167. [Google Scholar] [CrossRef]
  9. Zhang, J.; Chen, Y.; Du, R.; Zhao, X.; Wu, J. Macroscopic and microscopic mechanical characteristics and crack propagation behavior of sandstone-like samples with single cracks under freeze–thaw cycles: Experimental and numerical simulation. Theor. Appl. Fract. Mech. 2024, 129, 104201. [Google Scholar] [CrossRef]
  10. Zhang, X.-P.; Wong, L.N.Y. Crack Initiation, Propagation and Coalescence in Rock-Like Material Containing Two Flaws: A Numerical Study Based on Bonded-Particle Model Approach. Rock Mech. Rock Eng. 2012, 46, 1001–1021. [Google Scholar] [CrossRef]
  11. Wu, Y.; Ma, D.; Hu, X.; Hao, Y.; Liu, C.; Zhou, H. Numerical simulation on the mechanical and fracture behavior of bedding argillaceous sandstone containing two pre-existing flaws. Theor. Appl. Fract. Mech. 2023, 127, 104047. [Google Scholar] [CrossRef]
  12. Liu, G.; Peng, J.; Zhang, Z.; Wang, Z.; Yang, Y. Numerical investigation of fluid-driven crack propagation and coalescence in granite specimen with two pre-existing flaws. J. Nat. Gas. Sci. Eng. 2020, 75, 103132. [Google Scholar] [CrossRef]
  13. Liu, Q.; Song, D.; Qiu, L.; Xiao, Y.; Yin, S.; Peng, Y.; Cao, Y.; Wang, H.; Gao, L. An experimental study of the resistivity response on fracture process of sandstone with pre-existing flaw. Theor. Appl. Fract. Mech. 2022, 121, 103487. [Google Scholar] [CrossRef]
  14. Wong, L.N.Y.; Li, H.-Q. Numerical study on coalescence of two pre-existing coplanar flaws in rock. Int. J. Solids Struct. 2013, 50, 3685–3706. [Google Scholar] [CrossRef]
  15. Song, D.; Liu, Q.; Qiu, L.; Zhang, J.; Khan, M.; Peng, Y.; Zhao, Y.; Wang, M.; Guo, M.; Hong, T. Experimental study on resistivity evolution law and precursory signals in the damage process of gas-bearing coal. Fuel 2024, 362, 130798. [Google Scholar] [CrossRef]
  16. Zhu, Y.; Qiu, L.; Song, D.; Li, Z.; Li, X.; Liu, Q.; Sun, Q.; Dang, J.; Liu, H. Methodology and application for identifying blank zones in coal seams using hydraulic flushing based on resistivity testing. Measurement 2026, 257, 119001. [Google Scholar] [CrossRef]
  17. Adhikary, D.P.; Guo, H. Modelling of Longwall Mining-Induced Strata Permeability Change. Rock Mech. Rock Eng. 2014, 48, 345–359. [Google Scholar] [CrossRef]
  18. Qu, Q.; Xu, J.; Wu, R.; Qin, W.; Hu, G. Three-zone characterisation of coupled strata and gas behaviour in multi-seam mining. Int. J. Rock Mech. Min. Sci. 2015, 78, 91–98. [Google Scholar] [CrossRef]
  19. Zhang, P.; Yang, T.; Yu, Q.; Xu, T.; Shi, W.; Li, S. Study of a Seepage Channel Formation Using the Combination of Microseismic Monitoring Technique and Numerical Method in Zhangmatun Iron Mine. Rock Mech. Rock Eng. 2016, 49, 3699–3708. [Google Scholar] [CrossRef]
  20. Zhang, S.; Zhang, D.; Zhao, Q.; Chi, M.; Zhang, W.; Yu, W. DEM Investigation of the Influence of Minerals on Crack Patterns and Mechanical Properties of Red Mudstone. Processes 2019, 7, 162. [Google Scholar] [CrossRef]
  21. Huang, Y.-H.; Yang, S.-Q.; Tian, W.-L.; Wu, S.-Y. Experimental and DEM study on failure behavior and stress distribution of flawed sandstone specimens under uniaxial compression. Theor. Appl. Fract. Mech. 2022, 118, 103266. [Google Scholar] [CrossRef]
  22. Wang, M.; Lu, Z.; Zhao, Y.; Wan, W. Peak strength, coalescence and failure processes of rock-like materials containing preexisting joints and circular holes under uniaxial compression: Experimental and numerical study. Theor. Appl. Fract. Mech. 2023, 125, 103898. [Google Scholar] [CrossRef]
  23. Jiang, T.; Pan, X.; Lei, J.; Zhang, J.; Wang, W. Rupture and Crack Propagation in Artificial Soft Rock with Preexisting Fractures Under Uniaxial Compression. Geotech. Geol. Eng. 2018, 37, 1943–1956. [Google Scholar] [CrossRef]
  24. Liu, Z.; Ma, C.; Wei, X.; Xie, W. Experimental study on mechanical properties and failure modes of pre-existing cracks in sandstone during uniaxial tension/compression testing. Eng. Fract. Mech. 2021, 255, 107966. [Google Scholar] [CrossRef]
  25. Qin, Y.; Xu, N.; Han, J.; Zhou, W. Experimental Study on the Effects of Geometric Parameters of Filled Fractures on the Mechanical Properties and Crack Propagation Mechanisms of Rock Masses. Rock Mech. Rock Eng. 2023, 56, 2697–2716. [Google Scholar] [CrossRef]
  26. Yang, S.-Q.; Li, H.; Du, S.-G.; Yong, R.; Wang, S.-S.; Tian, W.-L.; Hu, Y.-J.; Niu, Y. Experiment and Peridynamics Simulation on Failure Mechanical Behavior of Cylindrical Sandstone Containing Two Persisting Fissures Under Conventional Triaxial Compression. Rock Mech. Rock Eng. 2024, 58, 3129–3157. [Google Scholar] [CrossRef]
  27. Li, K.-S.; Chen, L.-X.; Zhao, Z.; Liu, C.-X. Experimental investigation on mechanical, acoustic, and fracture behaviors and the energy evolution of sandstone containing non-penetrating horizontal fissures. Theor. Appl. Fract. Mech. 2023, 123, 103703. [Google Scholar] [CrossRef]
  28. Shan, R.; Liu, N.; Sun, P.; Zhao, Z.; Dong, R.; Dou, H.; Meng, H.; Bai, Y. Experimental and numerical simulation study of rough jointed rock samples under triaxial compression conditions. Eng. Fract. Mech. 2025, 314, 110707. [Google Scholar] [CrossRef]
  29. Lei, R.; Zhang, Z.; Berto, F.; Ranjith, P.G.; Zhang, C. Strain localization and cracking behavior of sandstone with two gypsum-infilled parallel flaws. Theor. Appl. Fract. Mech. 2021, 112, 102873. [Google Scholar] [CrossRef]
  30. Deng, P.; Liu, Q.; Lu, H. FDEM numerical study on the mechanical characteristics and failure behavior of heterogeneous rock based on the Weibull distribution of mechanical parameters. Comput. Geotech. 2023, 154, 105138. [Google Scholar] [CrossRef]
  31. Zhang, S.; Qiu, S.; Jiang, Q.; Wang, B.; Hu, X.; Zhang, H. Numerical study of unstable failure behavior in heterogeneous rock pillar. Eng. Fract. Mech. 2023, 290, 109529. [Google Scholar] [CrossRef]
  32. Jiang, X.-Y.; Wu, D.; Zhao, Z.-X.; Yang, Y.; Tian, J.-W.; Wang, F.-L. Experimental and numerical study on the damage evolution and acoustic emission multi-parameter responses of single flaw sandstone under uniaxial compression. Theor. Appl. Fract. Mech. 2024, 133, 104535. [Google Scholar] [CrossRef]
  33. Chen, S.; Xia, Z.; Feng, F.; Giorgio, I. Numerical Simulation of Strength, Deformation, and Failure Characteristics of Rock with Fissure Hole Defect. Adv. Mater. Sci. Eng. 2020, 2020, 7048645. [Google Scholar] [CrossRef]
  34. Liu, S.; Xiao, F.; Li, T.; Zhang, B. Analysis of Impact Tendency and Sensitivity of Fractured Rock with Different Crack Arrest Measures. Sustainability 2022, 14, 13833. [Google Scholar] [CrossRef]
  35. Liu, S.; Zhang, Z. Modeling rock fragmentation by coupling Voronoi diagram and discretized virtual internal bond. Theor. Appl. Mech. Lett. 2020, 10, 321–326. [Google Scholar] [CrossRef]
  36. Lei, Q.H.; Doonechaly, N.G.; Tsang, C.F. Modelling fluid injection-induced fracture activation, damage growth, seismicity occurrence and connectivity change in naturally fractured rocks. Int. J. Rock Mech. Min. Sci. 2021, 138, 104598. [Google Scholar] [CrossRef]
  37. Munjiza, A.; Smoljanovic, H.; Zivaljic, N.; Mihanovic, A.; Divic, V.; Uzelac, I.; Nikolic, Z.; Balic, I.; Trogrlic, B. Structural applications of the combined finite-discrete element method. Comput. Part. Mech. 2020, 7, 1029–1046. [Google Scholar] [CrossRef]
  38. Lei, Z.; Rougier, E.; Knight, E.E.; Munjiza, A. A framework for grand scale parallelization of the combined finite discrete element method in 2d. Comput. Part. Mech. 2014, 1, 307–319. [Google Scholar] [CrossRef]
  39. Maeda, Y.; Ogata, S.; Fukuda, D.; Liu, H.Y.; Inui, T. Development of a GPGPU-parallelized FDEM based on extrinsic cohesive zone model with master-slave algorithm. Comput. Geotech. 2024, 166, 105942. [Google Scholar] [CrossRef]
  40. Yan, C.Z.; Wei, D.S.; Wang, G. Three-dimensional finite discrete element-based contact heat transfer model considering thermal cracking in continuous-discontinuous media. Comput. Methods Appl. Mech. Eng. 2022, 388, 114228. [Google Scholar] [CrossRef]
  41. Fukuda, D.; Mohammadnejad, M.; Liu, H.; Zhang, Q.; Zhao, J.; Dehkhoda, S.; Chan, A.; Kodama, J.; Fujii, Y. Development of a 3D Hybrid Finite-Discrete Element Simulator Based on GPGPU-Parallelized Computation for Modelling Rock Fracturing Under Quasi-Static and Dynamic Loading Conditions. Rock Mech. Rock Eng. 2019, 53, 1079–1112. [Google Scholar] [CrossRef]
  42. Liu, Q.; Wang, W.; Ma, H. Parallelized combined finite-discrete element (FDEM) procedure using multi-GPU with CUDA. Int. J. Numer. Anal. Methods Geomech. 2019, 44, 208–238. [Google Scholar] [CrossRef]
  43. Deng, P.; Liu, Q.; Huang, X.; Pan, Y.; Wu, J. FDEM numerical modeling of failure mechanisms of anisotropic rock masses around deep tunnels. Comput. Geotech. 2022, 142, 104535. [Google Scholar] [CrossRef]
  44. Deng, P.; Liu, Q.; Lu, H. A novel joint element parameter calibration procedure for the combined finite-discrete element method. Eng. Fract. Mech. 2022, 276, 108924. [Google Scholar] [CrossRef]
  45. Deng, P.; Liu, Q.; Lu, H.; Wu, Y. A FDEM study on the mechanical properties and failure behavior of soft-hard interbedded rocks considering the size effect. Eng. Fract. Mech. 2024, 310, 110489. [Google Scholar] [CrossRef]
  46. Liu, Q.; Deng, P. Numerical Study of Rock Fragmentation Process and Acoustic Emission by FDEM Based on Heterogeneous Model. Math. Probl. Eng. 2020, 2020, 2109584. [Google Scholar] [CrossRef]
  47. Yuan, H.; Liu, C.; Zhu, W.; Liu, X.; Qi, Q. Study on the mechanical behavior and energy characteristics of rocks with closed cracks based on combined finite-discrete element method. Comput. Geotech. 2025, 179, 107057. [Google Scholar] [CrossRef]
  48. Alfano, M.; Furgiuele, F.; Leonardi, A.; Maletta, C.; Paulino, G.H. Mode I fracture of adhesive joints using tailored cohesive zone models. Int. J. Fract. 2008, 157, 193–204. [Google Scholar] [CrossRef]
  49. Cheng, S.; Sheng, M.; Li, G.; Tian, S.; Ren, L. Numerical Modeling of 3D Hydraulic Fractures Propagation in Bedding-Riched Shale Oil Reservoir. Rock Mech. Rock Eng. 2026. [Google Scholar] [CrossRef]
  50. Li, M.; Deng, H.; Yang, C. A Case Study of Anthropogenic Landslide Evolution in a Fragmented Rock Slope. Transp. Infrastruct. Geotechnol. 2025, 13, 1. [Google Scholar] [CrossRef]
  51. Cai, W.; Gao, K.; Ai, S.; Wang, M.; Feng, Y.T. Implementation of extrinsic cohesive zone model (ECZM) in 2D finite-discrete element method (FDEM) using node binding scheme. Comput. Geotech. 2023, 159, 105470. [Google Scholar] [CrossRef]
  52. Tatone, B.S.A.; Grasselli, G. A calibration procedure for two-dimensional laboratory-scale hybrid finite–discrete element simulations. Int. J. Rock Mech. Min. Sci. 2015, 75, 56–72. [Google Scholar] [CrossRef]
  53. Liu, J.; Ma, F.; Guo, J.; Zhou, T.; Song, Y.; Li, F. Numerical Simulation of Failure Behavior of Brittle Heterogeneous Rock under Uniaxial Compression Test. Materials 2022, 15, 7035. [Google Scholar] [CrossRef]
  54. Tang, C.A.; Liu, H.; Lee, P.K.K.; Tsui, Y.; Tham, L.G. Numerical studies of the influence of microstructure on rock failure in uniaxial compression—Part I: Effect of heterogeneity. Int. J. Rock Mech. Min. Sci. 2000, 37, 555–569. [Google Scholar] [CrossRef]
  55. Zhu, X.; Zhang, Q.; Liang, M.; Zhang, W. Mining-induced damage evolution and infiltration failure in deep mudstone-sandstone interbedded strata. Results Eng. 2025, 28, 107095. [Google Scholar] [CrossRef]
  56. Liu, Q.; Deng, P. A numerical investigation of element size and loading/unloading rate for intact rock in laboratory-scale and field-scale based on the combined finite-discrete element method. Eng. Fract. Mech. 2019, 211, 442–462. [Google Scholar] [CrossRef]
  57. Liu, C.; Liu, X.; Wu, C.; Wang, E.; Wang, S.; Peng, H. Investigation of Multiscale Failure Mechanism of Red Bed Soft Rock using Grain-Based Finite-Discrete Element Method Combined with X-Ray Micro-computerized Tomography. KSCE J. Civ. Eng. 2023, 27, 1350–1367. [Google Scholar] [CrossRef]
  58. Liu, W.; Niu, S. Energy evolution properties and strength failure criterion of coal-fired slag concrete based on energy dissipation. Case Stud. Constr. Mater. 2022, 17, e01369. [Google Scholar] [CrossRef]
  59. Wang, G.; Fan, W.; You, J.; Tai, Z.; Li, C.; Zhu, G. Experimental Investigation on Mechanical Properties and Failure Behaviors of Concrete for Ultra-Deep Shafts Using Acoustic Emission and Energy Evolution Characteristics. Processes 2026, 14, 598. [Google Scholar] [CrossRef]
  60. Yue, Z.F.; Meng, F.Z.; Li, M.Z.; Han, J.H.; Wang, W.; Wang, F.L.; Wang, Z.Q. Influence of crack aperture and orientation on the uniaxial compressive behavior of rock. Eur. J. Environ. Civ. Eng. 2024, 28, 3388–3411. [Google Scholar] [CrossRef]
  61. Liu, L.; Zhao, C.; Luo, M.; Kang, G.; Ning, Y. Study on rock deformation and fracturing considering the spatially-correlated heterogeneity by discontinuous deformation analysis. Eng. Anal. Bound. Elem. 2026, 186, 106692. [Google Scholar] [CrossRef]
  62. Pan, C.; Li, X.; He, L.; Li, J. Study on the effect of micro-geometric heterogeneity on mechanical properties of brittle rock using a grain-based discrete element method coupling with the cohesive zone model. Int. J. Rock Mech. Min. Sci. 2021, 140, 104680. [Google Scholar] [CrossRef]
  63. Liu, J.; Zhang, H.; Bian, H.; Wen, W.; Zeng, L. Uniaxial Mechanical Properties and Failure Characteristics of Fractured Silty Mudstone. KSCE J. Civ. Eng. 2024, 28, 139–154. [Google Scholar] [CrossRef]
  64. Xia, B.; Li, Y.; Hu, H.; Luo, Y.; Peng, J. Effect of Crack Angle on Mechanical Behaviors and Damage Evolution Characteristics of Sandstone Under Uniaxial Compression. Rock Mech. Rock Eng. 2022, 55, 6567–6582. [Google Scholar] [CrossRef]
  65. Ma, Q.; Liu, X.; Tan, Y.; Elsworth, D.; Shang, J.; Song, D.; Liu, X.; Yan, F. Numerical study of mechanical properties and microcrack evolution of double-layer composite rock specimens with fissures under uniaxial compression. Eng. Fract. Mech. 2023, 289, 109403. [Google Scholar] [CrossRef]
  66. Shen, J.; Zhan, S.; Karakus, M.; Zuo, J. Effects of flaw width on cracking behavior of single-flawed rock specimens. Bull. Eng. Geol. Environ. 2020, 80, 1701–1711. [Google Scholar] [CrossRef]
  67. Alomari, E.M.; Ng, K.W.; Khatri, L.; Wulff, S.S. Effect of Physical Properties on Mechanical Behaviors of Sandstone under Uniaxial and Triaxial Compressions. Materials 2023, 16, 4867. [Google Scholar] [CrossRef]
Figure 1. Movement state of the roof strata induced by coal seam mining (modified from [11]).
Processes 14 01709 g001
Figure 2. Failure modes for ECZM (modified from [49,50]).
Processes 14 01709 g002
Figure 3. Cloud diagrams showing the distribution of elastic modulus for models with different values of the homogeneity coefficient.
Processes 14 01709 g003
Figure 4. Schematic diagram of cohesion and tensile strength assignment for quadrilateral joint elements.
Processes 14 01709 g004
Figure 5. Numerical simulation calibration procedure.
Processes 14 01709 g005
Figure 6. Relationship between unit size and peak stress.
Processes 14 01709 g006
Figure 7. Relationship between loading rate and peak stress.
Processes 14 01709 g007
Figure 8. Comparison of experimental and numerical simulation results. (a) Relationship between experimental and numerical simulation stress–strain; (b) Relationship between experimental and numerical simulation failure patterns.
Processes 14 01709 g008
Figure 9. Failure modes of rock under different homogeneity coefficients.
Processes 14 01709 g009
Figure 10. Schematic diagram of numerical simulation parameters.
Processes 14 01709 g010
Figure 11. Relationship between cumulative energy and stress–strain in the pre-peak stage.
Processes 14 01709 g011
Figure 12. Stress–strain curves of sandstone under uniaxial compression with the coupling effect of multiple factors.
Processes 14 01709 g012
Figure 13. Heat map for mechanical parameters of fractured rock affected by multiple factors. (a) Pearson’s correlation coefficient. (b) p-values of Pearson’s correlation coefficient.
Processes 14 01709 g013
Figure 14. Heat map for energy characteristics of fractured rock affected by multiple factors. (a) Pearson’s correlation coefficient. (b) p-values of Pearson’s correlation coefficient.
Processes 14 01709 g014
Figure 15. The influence of single factors on the mechanical properties of fractured sandstone: (a) homogeneity coefficient; (b) fracture angle; (c) fracture length.
Processes 14 01709 g015
Figure 16. The influence of single factors on the energy characteristics of fractured sandstone: (a) homogeneity coefficient; (b) fracture angle.
Processes 14 01709 g016
Figure 17. Relationship between the predicted peak stress values and the numerical calculation results: (a) l = 5 mm; (b) l = 10 mm; (c) l = 15 mm; (d) l = 20 mm; (e) l = 25 mm; (f) overall error distribution.
Processes 14 01709 g017
Figure 18. Relationship between fracture aperture and peak stress influence coefficient.
Processes 14 01709 g018
Table 1. The influence of fracture geometry characteristics on rock mechanical properties in previous studies.
Authors (Only
the First Author)
LithologyInfluencing FactorsMain Research Methods
Jiang, 2018;
Liu, 2021 [23,24]
Sandstone, artificial soft rockAngle of cracksExperiment
Chen, 2020 [33]Numerical sampleLength g and shape of cracksNumerical simulation
Liu, 2020 [46]Numerical sampleHeterogeneous of rockNumerical simulation
Lei, 2021 [29]SandstoneAngle, length of cracksExperiment
Huang, 2022 [21]SandstoneAngle of cracksExperiment and numerical simulation
Liu, 2022 [34]Numerical sampleNumber of cracksNumerical simulation
Wang, 2023 [22]Rock-like materialsLength and angle of cracksExperiment and numerical simulation
Qin, 2023 [25]Artificial rockAngle, opening, spacing, and roughness of cracksExperiment
Deng, 2023 [30]Numerical sampleHeterogeneity of rockNumerical simulation
Yang, 2024 [26]SandstoneLength, angle of cracks and pressureExperiment and numerical simulation
Li, 2023 [27]SandstoneSpacing and location of cracksExperiment
Duan, 2025 [2]Numerical sampleHeterogeneity coefficients of rock, angle of cracksNumerical simulation
Shan, 2025 [28]Rock-like materialsAngle, roughness of cracksExperiment and numerical simulation
Yuan, 2025 [47]Numerical sampleAngle, length, location of cracksNumerical simulation
Table 2. Mohr–Coulomb elastic–plastic constitutive model input parameters.
ParametersDensityYoung’s
Modulus
Poisson
Ratio
Penalty Damp Factor
Symbolρ (kg/m3)E0 (GPa)μP (GPa)Df
Fractured rock mass26808.990.148991.0
Table 3. Input parameters for the extrinsic cohesive zone model (ECZM) of fracture units.
ParametersFrictionCohesionTensile
Strength
Type I Fracture
Energy
Type II Fracture
Energy
Symbolφ (°)C (MPa)Ts (MPa)Gf1 (N/m)Gf2 (N/m)
Fractured rock mass39.1215.689.352452450
Disclaimer/Publisher’s Note: The statements, opinions and data contained in all publications are solely those of the individual author(s) and contributor(s) and not of MDPI and/or the editor(s). MDPI and/or the editor(s) disclaim responsibility for any injury to people or property resulting from any ideas, methods, instructions or products referred to in the content.