Article

Operational Analysis and Strategic Management of Tomographic Volumetric Additive Manufacturing Systems via Discrete Event Simulation


by
Juan León-Becerra
1,
Nicolás Orejarena-Osorio
2,
Sonia Polo-Triana
1,
Fernando Diaz-Gomez
1 and
Jorge Guillermo Díaz-Rodríguez
3,*
1
Grupo de Investigación SINERGIA, Universidad de Investigación y Desarrollo, Bucaramanga 680006, Colombia
2
Faculty of Natural Sciences and Engineering, Unidades Tecnológicas de Santander, Bucaramanga 680006, Colombia
3
Escuela de Ingenieria y Ciencias, Tecnologico de Monterrey, Guadalajara 45138, Jalisco, Mexico
*
Author to whom correspondence should be addressed.
Processes 2026, 14(11), 1689; https://doi.org/10.3390/pr14111689
Submission received: 15 April 2026 / Revised: 12 May 2026 / Accepted: 16 May 2026 / Published: 23 May 2026

Abstract

Tomographic volumetric additive manufacturing (VAM) is an innovative 3D printing technology that polymerizes an entire volume of photopolymer resin simultaneously. VAM enables an increased printing speed and higher output compared with traditional stereolithography, layer-by-layer printing. We explore the operational implications of adopting VAM in an intelligent manufacturing context by considering process planning and production control issues exacerbated by the time bottlenecks introduced in downstream post-processing stages. Discrete Event Simulation (DES) was used to model production flow for two conceptual scenarios: a small-batch low-mix production environment and a high-mix variable-batch production environment. We simulated production, analyzed bottlenecks and tested intervention strategies that may be implemented: (1) increasing the availability of post-processing equipment, (2) modifying the number of available printers and (3) implementing improved workforce scheduling to reassign skilled operators during downtime of certain machines to reduce waiting time. VAM can speed up the creation of the primary part, but post-processing steps such as curing, washing and finishing the produced part might nullify those savings. Through the intervention methods we studied, the overall system utilization rate can be increased. VAM can achieve higher throughput rates in intelligent manufacturing settings only when it is incorporated into intelligent planning systems with high-speed post-processing. We provide some operational considerations in scaling up the VAM manufacturing capability, specifically focusing on planning challenges and gaps in adoption within manufacturing contexts. In this context, we find that coupling data-driven simulation methods with process planning algorithms may further improve workflow in smart manufacturing environments.

1. Introduction

Manufacturing processes are broadly categorized into surface and property modification and form-creation processes. The latter can be further subdivided into subtractive and additive manufacturing (AM) [1]. AM is a transformative paradigm that constructs objects directly from digital 3D models by incrementally depositing materials layer-by-layer. It fundamentally differs from subtractive methods, which remove excess material from larger blocks.
While some AM systems can be limited by their ability to produce geometries, required support structures, and long turnaround times when making parts, other issues have prevented the mass industrial utilization of AM. With an Industry 4.0 approach, the modeling and simulation of processes are required to produce optimized and standardized processes [2]. This enables the rapid implementation of new additive manufacturing technologies. Currently, a new generation of technologies is addressing these limitations. Volumetric additive manufacturing (VAM) is the process that photopolymerizes an entire volume of material, a liquid resin, simultaneously and allows simultaneous curing across this entire volume. Consequently, this reduces the production time and enables large-volume and rapid manufacturing, along with integration into smart factories. Therefore, process planning and production control must be implemented for AM in industrial environments.
Process planning for AM includes part assignments, machine selection, orientation, build-plate location, process parameter selection, hatching or raster strategy determination. Production control guarantees consistency using computed tomography (CT), metrology and other tests. The integration of these processes lowers the production time, reduces production costs, improves accuracy, and makes processes sustainable for the industrial scale production required of mass production processes. Discrete Event Simulation (DES) is the process through which production processes are modeled, simulated, studied and optimized over time. In the DES model, a company’s production processes can be represented by incorporating parameters in the model that follow deterministic values or are subject to various statistical distributions that can model the inherent variation that exists [3,4]. The application of DES on AM has been employed for factory scheduling, resource sizing, calculating cost and energy tradeoffs and service workflows. Through different studies, the system may show 40–85% lower makespan values and improvements in production rate values of up to 4 times. However, problems arise in data collection/sharing and post-processing as well as ensuring the model fidelities of printed parts process [5,6,7].
This work is structured into five sections. After this Introduction, Section 2 reviews the state-of-the-art literature about Computed Axial Lithography (CAL) technology, as well as planning strategies for additive manufacturing. Section 3 is about the methodology applied. This section comprises a description of the research method and the materials used in the investigation, including the data collection methods, tools used to analyze the data and how the hypothetical use cases were designed. Section 4 presents the results obtained about production planning and control strategies of CAL systems, with the calculated metrics and a discussion on their limitations and possibilities. Finally, in Section 5, a summary of the key findings and significant future research areas is provided.
This study provides relevant insights into the capabilities and challenges of VAM equipment and the impact on the production planning and control needed for this unique manufacturing approach. The CAL technique, a variant in the VAM process family was employed; a DES model with one factor at a time (OFAT) variation was employed in conjunction with sensitivity analysis to study the synergistic effects of extremely fast printing speeds of VAM and the management of restrictive downstream operations like maturation, metrology, and finishing in relevant outcomes such as overall system productivity, enhanced cycle time, real-time process monitoring, resource utilization balance, and assets efficiency. The literature on VAM currently concentrates more on the advancement of materials and the possible application areas instead of the specific planning strategies for their industrial-scale operation. Moreover, the DES literature focuses on well-established manufacturing methods ignoring the role of very-low-time printing processes and their interaction with other factors in a factorial design sensitive analysis. As a limitation, the current analysis is based upon the literature and industrial data, and no experimental setup was performed.

2. Literature Review

2.1. Additive Manufacturing Process Planning

AM transformation of digital 3D models into physical objects is generally achieved using highly precise layer-by-layer deposition. The process typically begins with slicing algorithms that divide the model into printable cross sections; this is a crucial step in influencing material anisotropy and optimizing part orientation on the build platform. AM technologies encompass a wide array of materials, including various polymers and metal alloys, each presenting specific challenges related to their thermal dynamics, curing mechanisms, and subsequent post-processing needs. The ASTM 52900 standard provides a comprehensive classification of various AM processes [8], with Vat Photopolymerization being a particularly popular production method.
Printers are further classified into different categories based on the printing methodology and dimensionality. Printing occurs along a point-by-point (1D) path or layer by layer (2D). The point-by-point printing builds the printed object point by point through individual solidification, typically used in Binder Jetting, FDM printing, laser sintering, selective laser melting (SLM), SLS, SLA and 3D Printing (FDM). Efforts have been made to improve the efficiency by replacing single points with multiple points to shorten the process’s relatively limited printing speed, including multipoint array scanning or arrays of laser diodes. Layer-by-layer printing uses an energy source to expose an entire layer at once, for example, in DLP or LCD 3D Printers (Vat Polymerization), where the process results in an upward-standing component, layer upon layer solidified with UV light. More efficient forms of this process exist, such as continuous liquid interface production (CLIP), where controlled UV light is beamed up through an oxygen-permeable window onto a vat of resin, allowing the layer to continually form and be solidified.
Process planning approaches for AM are focused on ensuring build success and product quality. Numerous research efforts have been directed toward improving this planning process. Features are identified and classified using CAD models to provide AM parameters to manufacturing process software. STEP-NC-compliant planning allows geometry information to be applied directly during the AM planning phase. This process improves the accuracy and surface finish of parts by avoiding approximation techniques used in some legacy planning methods [9]. Hierarchical resource-based process planning allows for an optimized build direction and deposition direction of each layer. By analyzing available build machines, material types and parts to build, planning software can produce a less time-consuming build process, requiring less build time and fewer materials. However, the process remains sensitive to any of these three resource requirements that are poorly planned [10]. These key process planning strategies for manufacturing AM parts could easily apply to even advanced virtual additive manufacturing machines and printers.
An application area of Discrete Event Simulation (DES) models is additive manufacturing (AM) or even a complete production chain. DES may be used to make shop floor scheduling decisions or to compare supply chains or even the whole business processes involved in the AM chain. Al-zquebah et al. [5] proposed to use DES to model the factory sizing and scheduling. These authors estimated the number of machines to consider for production or a new facility, the required number of workers, their deployment and possible scheduling strategies, with different dispatched rules for improving factory makespan and throughput. This resulted in reduced makespans up to 78% by combining DES and optimization in the case of a powder bed fusion factory, as well as improvements in factory productivity with higher staff allocation or with advanced scheduling heuristics. Dental practices have also been modeled with a DES framework that allows for simulations of patient-specific AM of crowns in laboratories. The model could be used to estimate wait times or resource use or test inventory rules or routes. It also can help to decide the split between home manufacturing and lab outsourcing. Their results emphasized how inventory rules or rest times or routing between lab and practice have a crucial impact on the net profit, patient wait time and laboratory makespan, thereby enabling test scenarios that will lead to specific results [6]. Nevertheless, many limitations and requirements exist for a trustworthy application. A DES model for additive manufacturing must consider reasonable process parameters that are realistic in terms of the process time, failure rates and energy use; however, the literature still refers to the lack of valid relations among parameters measured in experiments and their implications at a full-scale factory simulation level, to perform sound trade-offs [7]. While post-processing can have a significant impact on time and costs, it is difficult to integrate it into a simulation model. Nevertheless, it was emphasized that studies simulating only production operations will underestimate both the costs of production or service and the bottlenecks [11]. As can be expected, bottlenecks change stations among the machines when the hardware (e.g., machine count) or workforce is different. Therefore, modelers should study more than one configuration of the factory system rather than focusing on a single machine setup [5]. Small policies or changes in available resources may cause large performance improvements or degradation that may cause erroneous conclusions if not supported by thorough studies of sensitivity [6].

2.2. State-of-the-Art in Volumetric Additive Manufacturing (VAM)

VAM is a revolutionary three-dimensional (3D) additive manufacturing technique that goes beyond the conventional one-dimensional and two-dimensional methods (like FDM or SLA). VAM uses a combination of volumetric energy modulation (VEM) algorithms to produce a specific 3D shape, a complete intricate energy dose distribution field (EDDF), that cures a full 3D volume. There are no moving parts and no repetitions at all, since it is built in a full 3D orientation, thereby simplifying machine hardware and reducing fabrication steps; consequently, it stands out as a paradigm shift in the 3D printing community.
Three distinct VAM light-dosage techniques were successfully demonstrated for part fabrication. The first, termed “additive light superposition”, utilizes the combined superposition of two or more light beams to solidify resin within a desired volume. The second method, known as “subtractive light superposition”, also involves the superposition of multiple beams; however, in this approach, one beam induces resin solidification, while another simultaneously inhibits it, thereby allowing for precise control over the cured volume. The third technique, tomographic VAM or CAL, is inspired by computed tomography (CT) image reconstruction [12]. In CAL, a photocurable resin is placed inside a cylindrical vial, which then rotates, while an LED or LCD projector continuously emits UV light, with the 2D mask changing in a manner similar to that in an X-ray scan, as shown in Figure 1. This allows parts to be printed concurrently, significantly reducing the production time. Among the most significant advantages of CAL is the drastically reduced fabrication time, which takes minutes instead of hours, achieving speeds or rates of approximately 10,000 mm3/min [13]. Furthermore, this technique inherently eliminates the need for support structures and enables the rapid printing of complex geometries while achieving isotropic mechanical properties [14].
VAM has emerged as a transformative approach in 3D printing, enabling the creation of complex geometries with enhanced efficiency and speed compared to traditional methods. Advancements in this field include microscale CAL (micro-CAL) and tomographic volumetric printing (TVP). Micro-CAL allows the fabrication of intricate microfluidic devices and optical elements with minimal feature sizes and high surface quality [15]. TVP has also been successfully applied to ceramics, utilizing preceramic polymers to create complex ceramic parts, showcasing high resolution and design freedom while maintaining structural integrity through pyrolysis [16]. Although these advancements present significant benefits, challenges remain in optimizing the material properties and scaling production for industrial applications.
The capabilities of VAM extend to a diverse range of applications. Table 1 summarizes the most relevant studies on VAM and the printing parameters used. Rodriguez-Pombo et al. [17] notably utilized VAM to fabricate personalized medicine, specifically paracetamol-loaded tablets, within 17 s via additive light superposition. Their study demonstrated that the drug release response could be precisely adjusted by modifying the ratio of monomer to diluent in the photosensitive resin. Bernal et al. [13] presented an application of VAM for creating parts with cell-laden hydrogels for tissue engineering, highlighting its potential in biomedical fields. Owing to its layerless and smooth finish, VAM holds significant promise for optics, enabling the production of high-quality lenses for communication technologies and healthcare devices. In the field of consumer goods, VAM can facilitate the rapid production of housings and components for electronic devices with complex geometries and shapes. The field of robotics also presents possibilities for VAM in both soft and modular robotics. In [13], the authors printed different forms such as a fluidic ball-cage valve with free-floating elements (height 10 mm and width 14 mm), a complex trabecular bone model (height 14 mm and width 12 mm), and a meniscus constructus (height 14 mm and width 12 mm). In [18], the authors performed with less than 20 rotations a gyroid and a Skye of 15 mm height and 15 and 10 mm width, respectively. Table 1 contains a list of parts and materials printed through CAL.
Moreover, biomedical engineering and pharmaceuticals are significant fields currently being developed by pioneers such as Tomolite, with Xolo Xube being the only commercially available solution for VAM. Finally, manufacturing and tooling represent sectors engaged in VAM that offer customizable part production, efficient batch production, and rapid manufacturing capabilities. Future applications are continuously being explored, often enabled by expanding the range of compatible materials used.
With respect to printing times, Whyte et al. [21] conducted a literature review indicating that printing times considered “slow” extend to 10 min (600 s), with a range of 7 to 900 s and an average of 85.5 s across various VAM studies. Notably, the printing time can be maintained, even when the printing volume is scaled up to three times, as reported by Bernal et al. [13]. Such reduced printing times provide significant advantages, particularly in the biomedical industry, because cell cultures are less affected by prolonged exposure to non-optimal environments. In addition, the use of a vat allows for more control over environmental factors within the printing volume.
Moreover, recent research has continued to expand the boundaries of VAM. Weisgraber et al. [22] created a “virtual VAM,” a simulation tool for the numerical experimentation of cure kinetics and the effects of different process parameters on the part, which proved useful for process control and optimization. Agrawal et al. [19] explored the possibility of using pressure waves (sound) to locate particles in a polymeric VAM system, thereby achieving VAM printing of orientable composite reinforcements. In an opinion article, Somers et al. [23] stated the need for a more accurate resolution mask to achieve nanometric precision, which is 15 orders of magnitude higher than current technology, highlighting the significant challenges associated with achieving this feature. Salajeghe et al. [24] proposed the use of viscoplastic resin to alleviate the problem of particle sedimentation in VAM, thereby offering an alternative production control system.
A comparison of photosensitive and traditional resins revealed significant advancements in sustainability, particularly through the use of renewable materials and recycling capabilities. Photosensitive resins, which are often derived from natural sources, exhibit biodegradability and low toxicity, making them more environmentally friendly than conventional resins. This transition has been supported by various innovative approaches to resin formulation and processing. Cook et al. [20] expands the material range of polymers used in VAM to thiol–ene photoresins; complementing the acrylate formulations, this uses oxygen not as an inhibitor but a radical scavenger, showing a wider range of tunable mechanical properties compared to traditional acrylate-based resins. Hausladen et al. [25] uses solid state photopolimerization to successfully print parts of Diciclopentandiene, expanding further the capacities for new materials and in new states other than liquid. Schwartz et al. [26] studied thiol-ene shape memory polymer (SMP) VAM producing structures with nearly full-shape recovery such as tripod, and three arm gripper. Photosensitive resins can be synthesized from renewable raw materials, such as plant oils and glycerol, which are inherently biodegradable and less toxic [27]. The incorporation of bio-based components into photopolymers enhances their sustainability profile, to reduce their reliance on fossil fuels [28]. New resin formulations, such as those using dynamic cyclic disulfide species, enable the recycling and reprinting of 3D-printed parts, thereby addressing the limitations of material reuse [29].

2.3. Gaps in the Current Literature

Although the literature covers material development and diverse application areas of VAM, there remains a notable gap in comprehensive studies focusing on its operational analysis and strategic management. While VAM does not typically produce parts layer by layer and is not bound by the problems and limitations that accompany support-free material printing with UV lamps, in essence, the field gaps are as follows: First, the integration of VAM in an industrial or manufacturing workflow and its process planning including which parts to assign to which VAM machines, what exposure strategy to use and which process parameters are necessary for maximum throughput and quality for a volumetric 3D-curing process; second, the study on production control systems for VAM, dealing with bottlenecks and ensuring quality; third, operational models describing the feasibility of operating multiple VAM printers in a VAM farm setup, addressing fluidics, material handling and incorporating principles of Industry 4.0, like real-time monitoring, statistical process control and smart material recycling in a fluid bed; fourth, an approach quantifying the effects of different variables in the outcomes of VAM. The current paper intends to provide a solution to the research problems mentioned.

3. Methodology

We use a mixed-methods approach that integrates numerical and qualitative assessments of the industrial and strategic management issues inherent in volumetric additive manufacturing (VAM) using CAL. The simulation methodology used discrete-event modelling and queuing theory principles under the control of variables that include the cycle time, the utilization of the machine, the number of workers and the defective pieces produced, whereas the analysed population was simulated in two examples, the former at a small scale with limited parts and the latter on a large scale; these two examples were chosen due to representing both extremes of the operational scenario for the additive manufacturing machines. The analysis obtained yielded results consistent with the objectives of the paper, enabling us to compare system behavior under modified scenarios, finding the primary critical limitations of the manufacturing processes. To verify how stable the process was and where the key limiting factor of this system lay, the one-factor-at-a-time method was used to quantify the response of the bottleneck capacity and the key performance indicators of throughput and the work-in-progress (WIP), given changes to each input parameter, on a one-by-one basis using discrete-event simulation code programmed and performed by SimPy, a Python Discrete-Event Simulation Framework (version 3.6). In Case 1 (atrial bioprinting), the selected variables were the maturation time, changing by 0, 7 and 14 days, the capacity of the perfusion bioreactors (1, 4 or 7 units) and the number of laboratory technicians/printers available (1 or 2 units). For Case 2 (optical lens manufacturing), the quality control defect rate (0%, 15% and 30%) was used instead of the maturation time, whereas the number of available printers/lab technicians remains either 1 or 2 units. A warm-up period of 0 was selected, as the model was treated as a terminating simulation that starts from an ‘empty and idle’ state, reflecting the actual beginning of the production batches for both bioprinting and lens manufacturing. The simulation was executed for a total duration of 70 days (10 weeks), providing a sufficiently large sample size to capture the operational variability of both processes. Finally, 50 replications were performed with independent random seeds. A base seed (123) was used, which increases by 1 in each iteration (base_seed + i). We explicitly applied random.seed() and numpy.random.seed() to ensure that the randomness of arrival rates and defects is fully traceable and reproducible and to achieve stable confidence intervals for our primary metrics. The result gained through these simulations, by expressing the sensitivity of each bottleneck capacity on changes to these variables on spider charts, allowed us to estimate the elasticity of the system. The Python code used for the discrete-event simulations performed is available as supplementary material, including the portion used to run the experiments to generate the data, using this clear set of parameters, hypotheses and tools, thus ensuring replicability of the study.

3.1. Description of Hypothetical Case Studies

To analyze the operational implications of VAM, two case studies are developed. Although hypothetical in their operational implementation, these cases are based on products whose manufacture by VAM has been demonstrated and characterized in the scientific literature. Each case is set in a production environment with different challenges: the first in the field of high-value-added bioprinting and the second in the manufacturing of high-precision optical components.

3.1.1. System Definition and Operational Environment

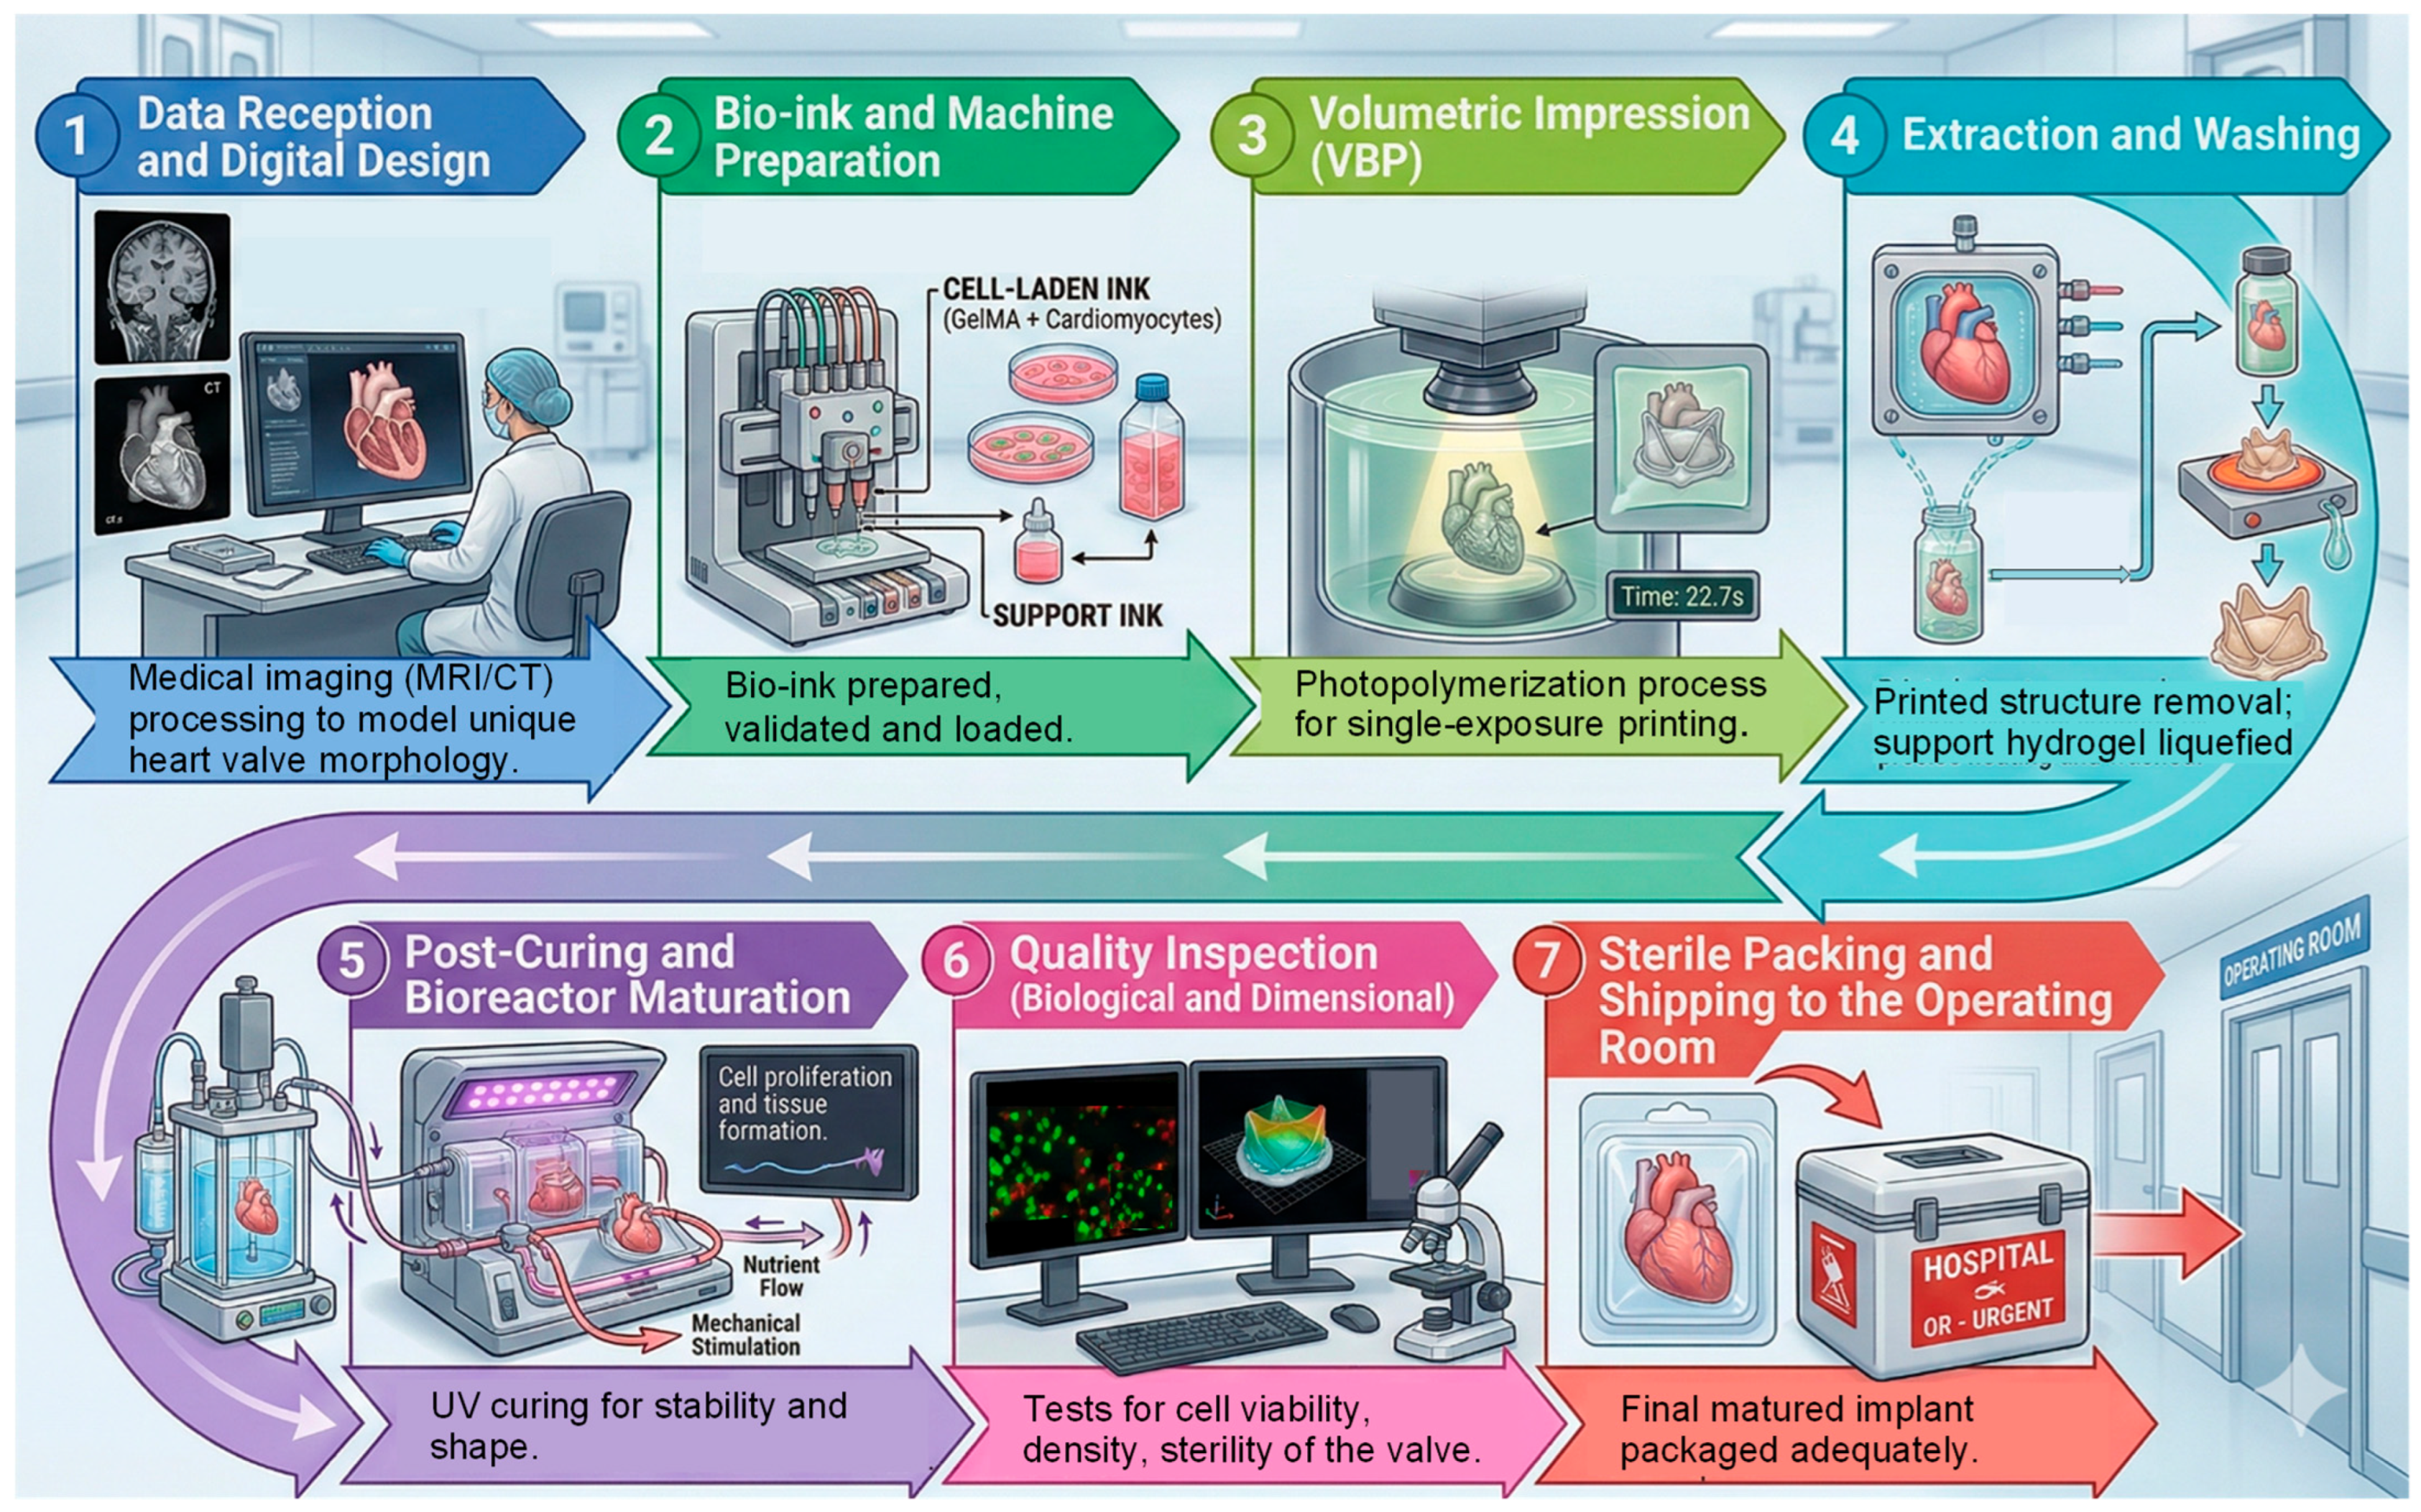
Case Study 1: Bioprinting a Personalized Atrium
Trial reconstruction is a significant clinical challenge owing to its complex 3D geometry (helix, antihelix, concha, etc.) and the low self-repair capacity of cartilage. Conventional procedures, such as costal cartilage autografting, involve multiple surgeries and notable morbidity at the donor site [30]. In contrast, 3D bioprinting has emerged as a promising alternative to reduce this morbidity and enable the manufacture of customized pinnae. As a technological benchmark, volumetric bioprinting (VBP) has proven capable of fabricating a human atrium model in 22.7 s, validating the potential of the technique for high-demand clinical environments where speed is critical [13]. A standard 1:1 scale construct of a human atrium with a volume of 4.14 cm3 has been defined [31]. A commercial hydrogel of high-purity methacrylated gelatin (GelMA), such as xoloGelMA X-Pure®, can be used as a bio-ink. This bio-ink uses a water-soluble dual-color photoinitiator (DCPI) [13]. The base formulation, demonstrated for VBP, is versatile for cell encapsulation [13,32,33]. The main indicator of quality is geometric fidelity [13]. The manufacture of the auricular construct is located in a point-of-care hospital biofabrication laboratory, and production is carried out under strict aseptic conditions. The demand for atrial reconstruction in a hospital setting is inherently stochastic. It originates from both programmed congenital cases and unplanned acute trauma [30]. To simulate this variability, the arrival of manufacturing orders was modeled following a Poisson distribution with an average rate (λ) of three cases per week. Two priority levels, “Scheduled” and “Urgent”, were introduced to assess their impact on production sequencing policies. The production pattern is make-to-order and operates during laboratory business hours (e.g., two shifts, five days a week).
Case Study 2: Making a Flat-Convex Singlet Lens
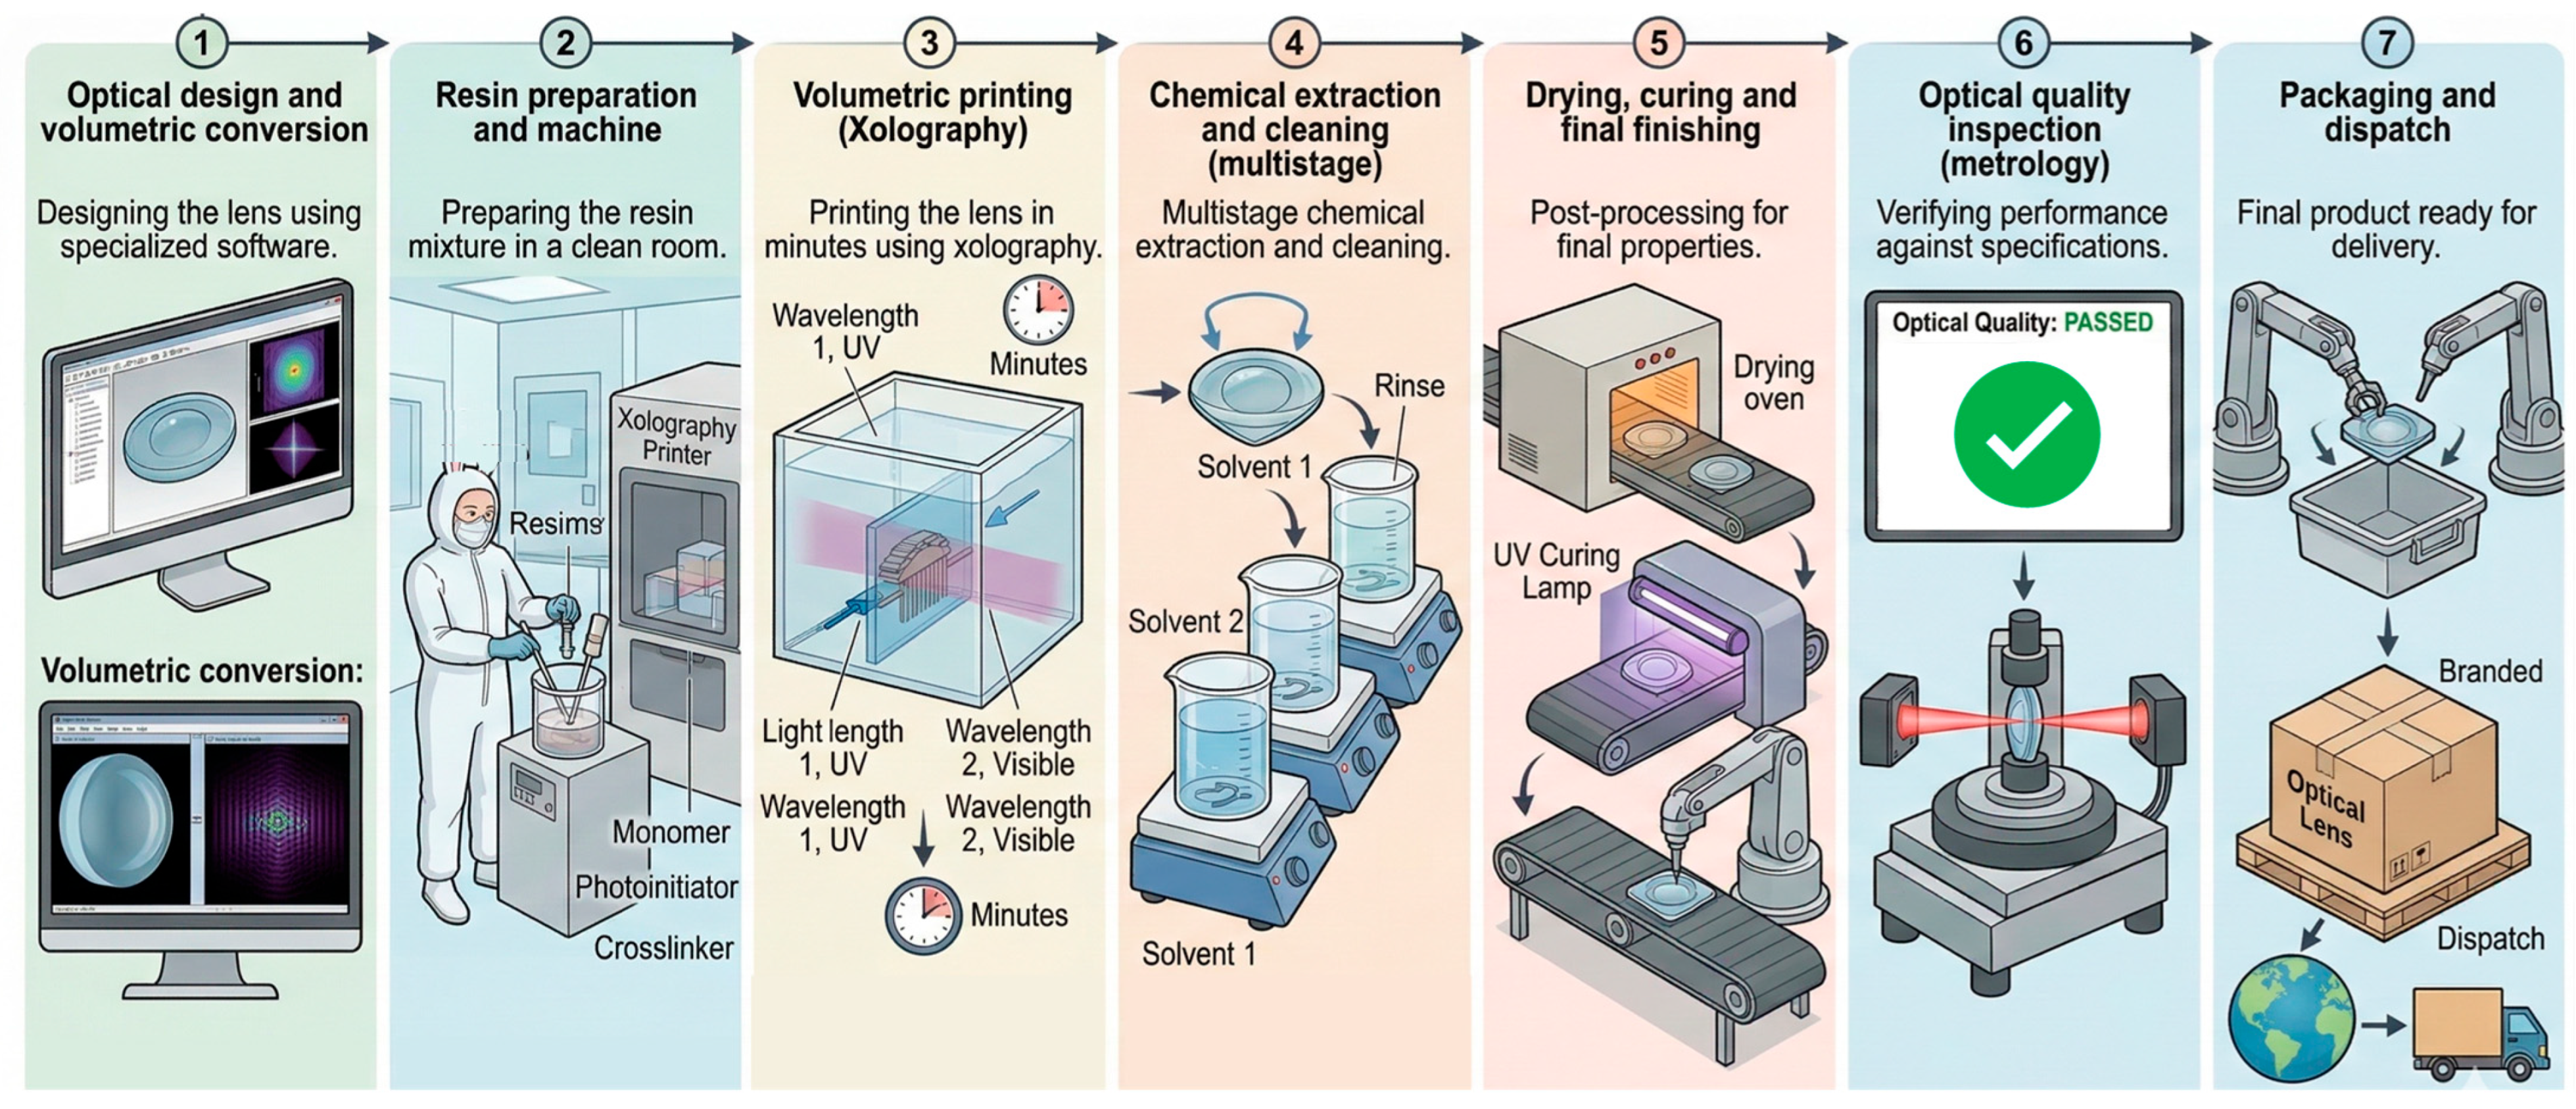
VAM, particularly the “blurred tomography” technique, can directly manufacture high-quality optical surfaces with performance comparable to that of commercial glass lenses, eliminating the need for complex polishing steps [34]. A singlet lens was selected as a product, because it offers a case with clear industrial quality metrics (geometry, MTF, and roughness), allowing the decoupling between the high-speed VAM printing and the bottlenecks generated in the post-processing and metrology stages to be studied.
A plano-convex lens with a diameter of 3 mm, a central thickness of 1.5 mm, and a radius of curvature of 3.1 mm. This design was successfully fabricated and validated in a landmark study by Webber et al. [34]. The primary surface quality criterion is extremely low roughness. The literature reports values in the sub-nanometer range (RMS < 1 nm) for fuzzy tomography systems [34] and in the range of 20–23 nm (Ra) for xolography systems, a value comparable to that of polished commercial lenses [35]. The production of the optical lens is framed in a manufacturing plant for customized optical devices operating as a high-tech job shop. The production flow is designed to handle a high variety of small orders (high-mix, low-volume), with a strong emphasis on metrology and quality control stations to verify compliance with tight optical tolerances [34]. The demand for a custom optics manufacturer is mixed, combining stability and uncertainty. It is modeled as a hybrid demand with a deterministic component, such as a base contract for an industrial customer that requires delivery of 40 lenses per month (10 per week), and a stochastic component with random orders of lower volume from research laboratories or for prototyping, modeled with an arrival of 1 to 5 additional orders per week. The production pattern is batch production, where the goal is to group different orders to optimize machine setup times and maximize equipment utilization. The system operates on an 8 h shift, five days a week.

3.2. Process Mapping and Characterization (Methods Engineering)

For each case study, a sequential process flow diagram was defined, detailing the manufacturing stages from order receipt to final product dispatch. These process flows, justified in the literature, form the logical basis for the simulation model and subsequent capability analysis.
The biofabrication process in a hospital point-of-care environment integrates the clinical workflow with aseptic production. A detailed flow diagram is shown in Figure 2. Moreover, the process for optical lens spotlighting requires high precision, cleanliness, and rigorous metrology. The detailed flow is shown in Figure 3.

3.3. Collection and Estimation of Operating Parameters of the VAM System (Fixed)

A configuration of the base equipment was assumed for each case study, which defines the technological capabilities of the system. For both cases, the use of a Xolo Xube2 commercial VAM printer was modeled. This system operates with a UV light sheet (375 or 405 nm) and a 4 K LED projector for visible light. It offers a resolution of up to 5 μm, print speed of up to 6 mm/min, and flexible build volume of up to 80 mm in height, with ambient temperature control (15–40 °C) [35,36].
The post-processing equipment is case-specific. For Case 1 (atrium), the post-processing line included aseptic washing stations, a UV curing chamber, and a perfusion bioreactor for in vitro cell maturation, an essential piece of equipment for the development of functional tissue that imposes long process times [30]. For Case 2 (Lens), the post-processing line consists of a chemical cleaning station with three sequential baths (TPM, Ethanol, Ethanol+TPO-L), a convection oven, a UV–LED curing chamber with an inert atmosphere, an LED bleaching system, and an advanced metrology station (AFM, interferometer) [35].
Table 2 details the operational parameters (time, resources, and costs/quality) used to build the base simulation model (“As-Is”). Each value is justified in the literature or based on an informed estimate consistent with the defined processes.
The parameters of the organization of work are human resources and competencies (shifts, availability, and level of training of the staff), maintenance policies (frequency of stops, reserve machines) and sustainability policies (percentage of material recirculation and recovered resin). Nevertheless, given the difficulty of varying or quantifying their influence on the overall system behavior, these variables were not considered.

3.4. Analysis of the Base System (“As-Is” Diagnosis)

The Base Simulation Model was developed using Flexsim v25 2.0 discrete event simulation software and Simpy, as described in Section 3. The primary entities moving through the model are “production orders” (one for each auricle or lens), which are assigned attributes such as priority type (“scheduled” or “urgent”). The fixed objects in the model include sources, which act as order generators following a defined demand model (for example, Poisson arrivals), and processes/servers, which represent each stage of the process flow as a block. These blocks are assigned the necessary resources (for example, Printer_Xube2, bioreactor) and their corresponding processing times. Queues are automatically created before each process to hold waiting orders. The model logic connects these blocks in the correct flowchart order and defines the resource requirements (for example, lab technician for setup and inspection).
The analysis involves two main stages: capacity analysis and line balance, followed by obtaining base KPIs via simulation. The first step is the calculation of the required rate, or Takt Time, which dictates the necessary production rate to meet demand. This is calculated by dividing the available production time by the demand. For example, if the demand for lenses is 10 per week, and the available time is 2400 min (40 h), the Takt Time is 240 min per lens. Next, bottleneck identification is performed by comparing the Takt Time to the cycle time of each process station. The station with the longest cycle time is the bottleneck and limits the system’s overall capacity. For instance, in the Atrium example, the maturation process in the bioreactor takes 10,080 min, making it a severe bottleneck, as other steps, such as printing (7.5 min) and washing (10 min), are significantly faster, highlighting a large imbalance.
The second stage involves running the discrete event simulation for an extended period to monitor the system’s behavior and automatically record the KPIs:
  • Throughput: The actual number of parts produced per week, which is expected to be lower than the theoretical capacity of the non-bottleneck stations (e.g., the printer).
  • Cycle time: The average total time from an order’s arrival to product completion. For the atrium, this is predicted to be longer than seven days because of the lengthy bottleneck process.
  • Work-in-progress (WIP): This is a crucial visual KPI that tracks the number of parts waiting in the queue before the bottleneck (e.g., bioreactor or metrology station). The prediction is that this queue will grow steadily, irrefutably demonstrating the capacity problem.
  • Resource utilization: The percentage of time each resource is occupied. It is anticipated that the bottleneck resource (bioreactor) will show 100% utilization, whereas resources upstream (such as the VAM printer) will exhibit very low utilization because they will be locked, waiting for the bottleneck to clear.
Once the base system diagnosis is complete, the simulation provides a mechanism to systematically evaluate the impact of various operational strategies on these KPIs to analyze decision effects and their interactions.

4. Results and Discussion

4.1. Case 1: Atrium

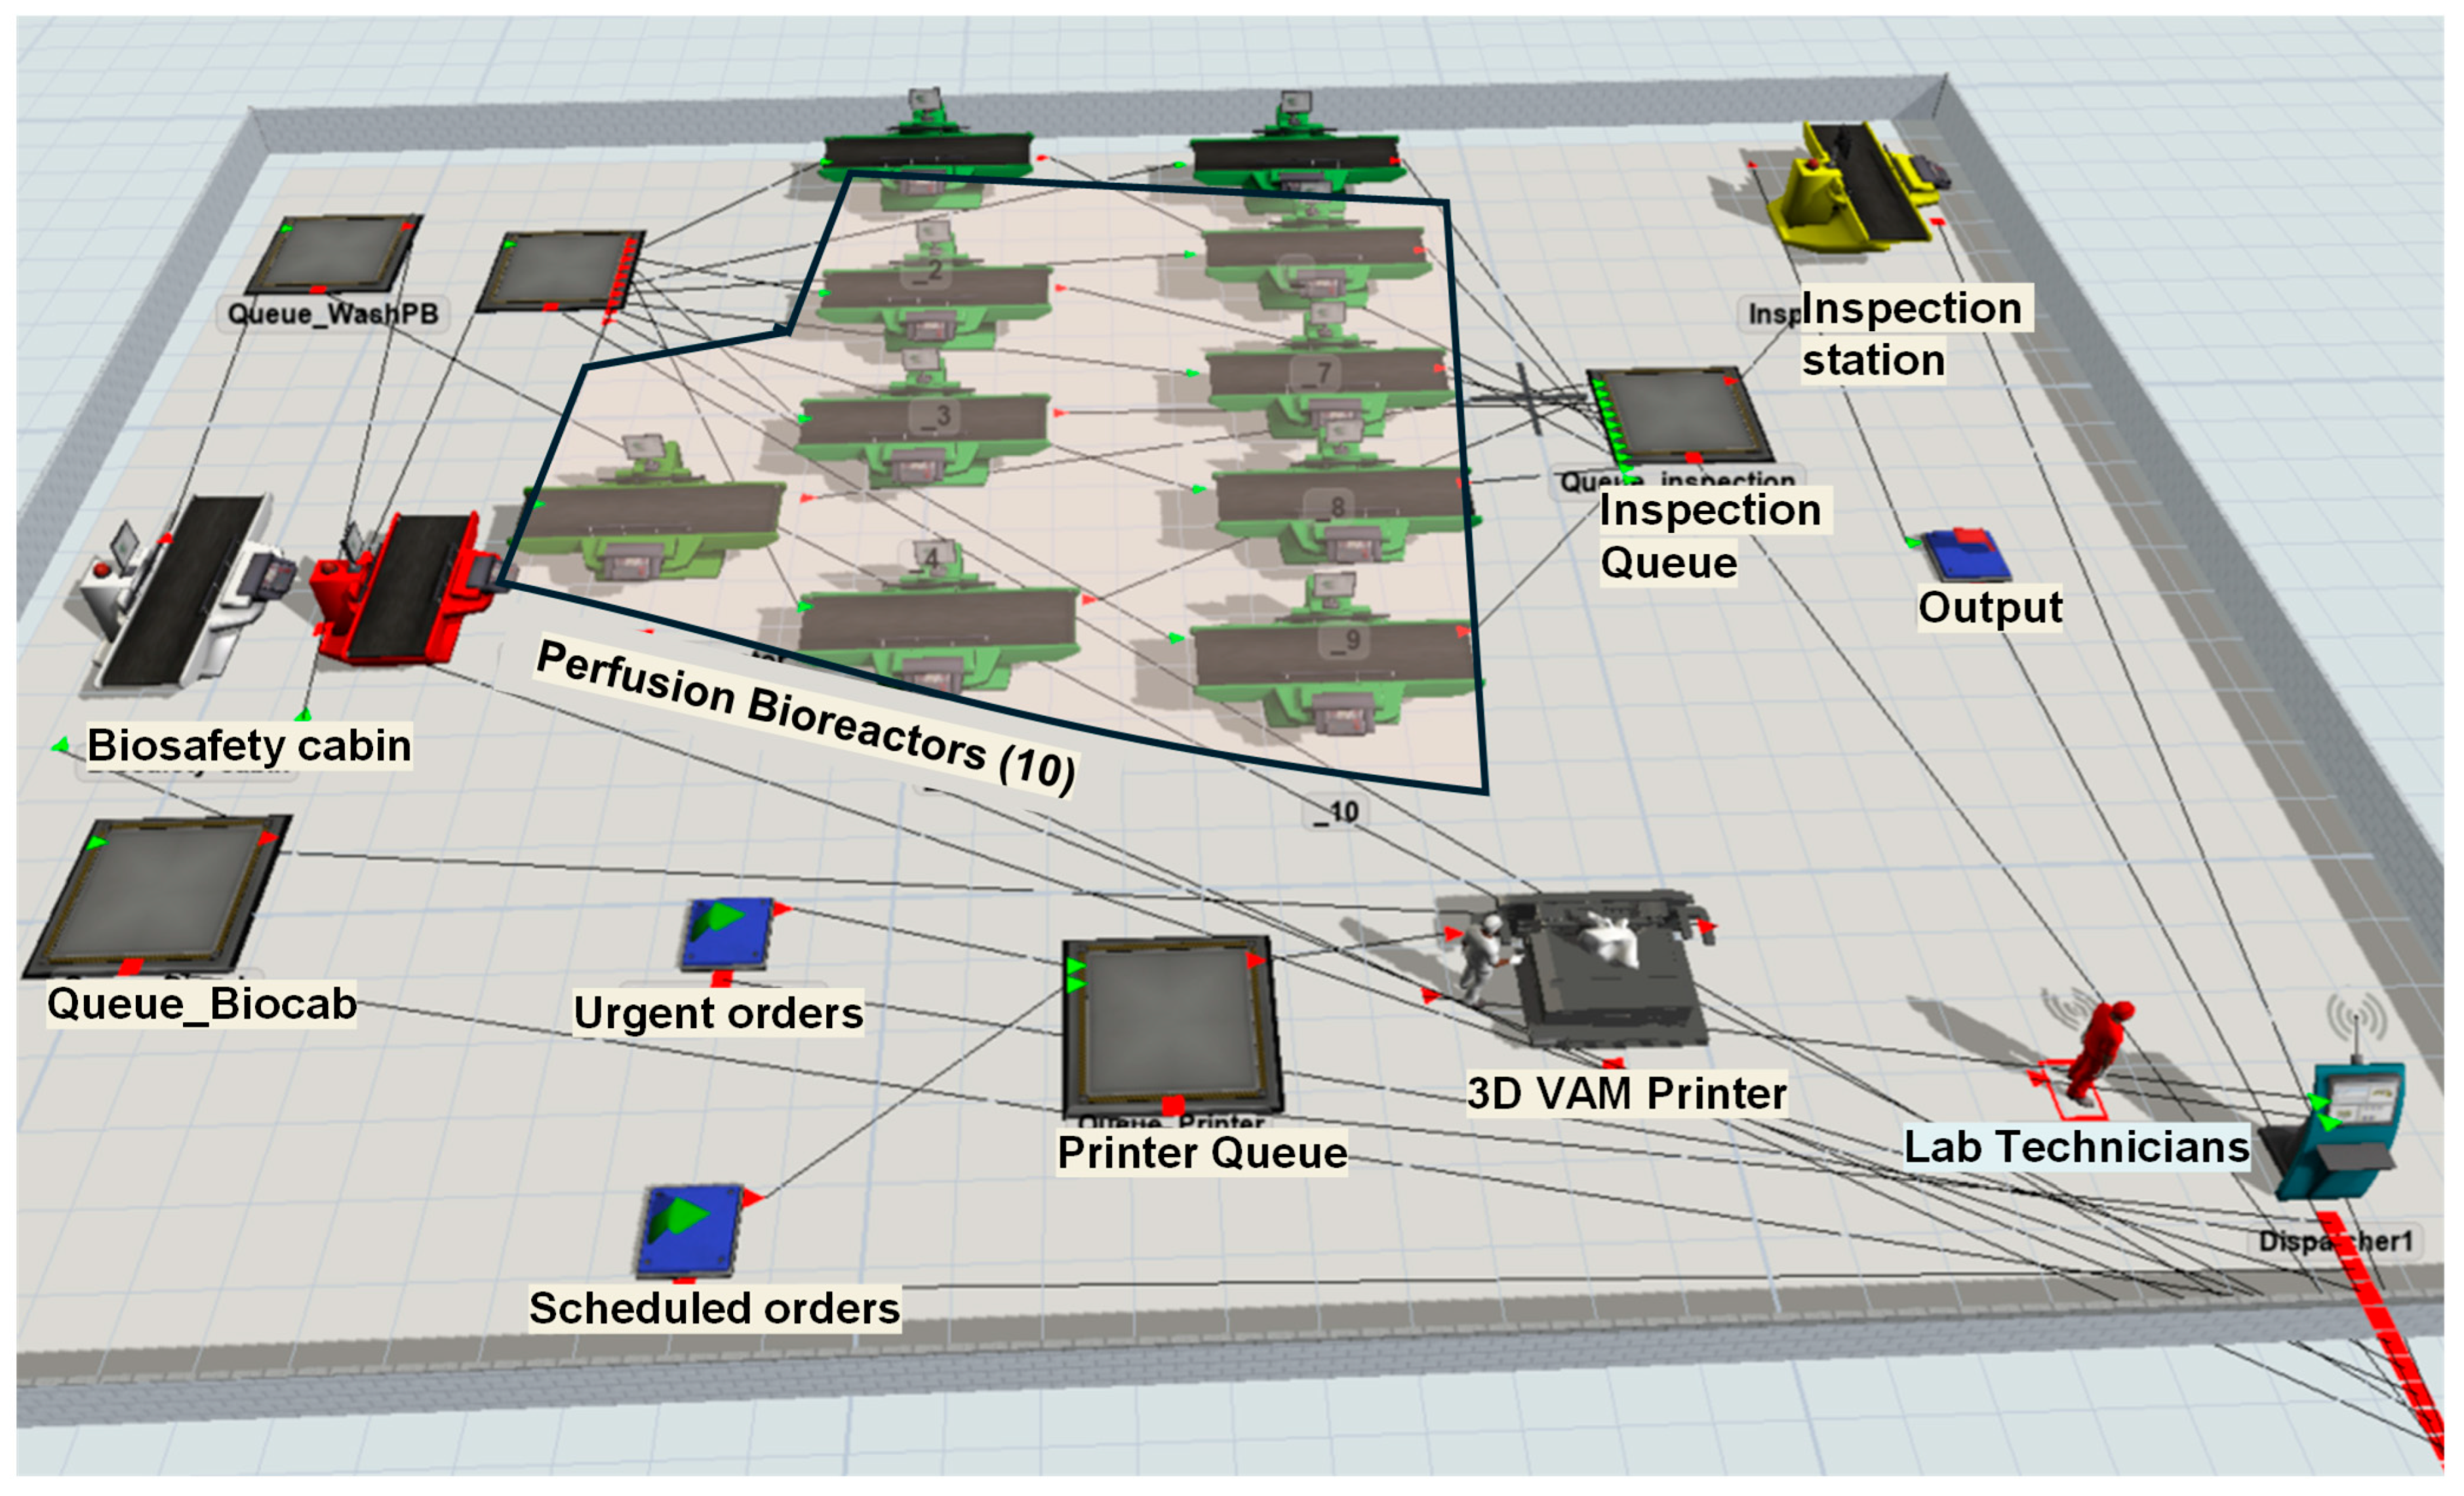
The simulation of the system was performed using FlexSim software version 25 2.0, following the parameters established in Table 2. To facilitate the visualization of the workflow and the identification of potential bottlenecks, queues were incorporated before each process. These queues do not affect the operating logic of the model but were added for exclusively visual and analytical purposes, allowing the accumulation of entities and evaluation of the efficiency of each stage of the system to be observed. The base simulation comprised 10 perfusion bioreactors and one printer, as shown in Figure 4.
After simulating the system over a period of 10 weeks, it was confirmed that the perfusion bioreactor phase is the main bottleneck, given its high utilization rate. However, with the current input conditions, the resource reached a maximum of six units in simultaneous use, which indicates that there is still room for available capacity.
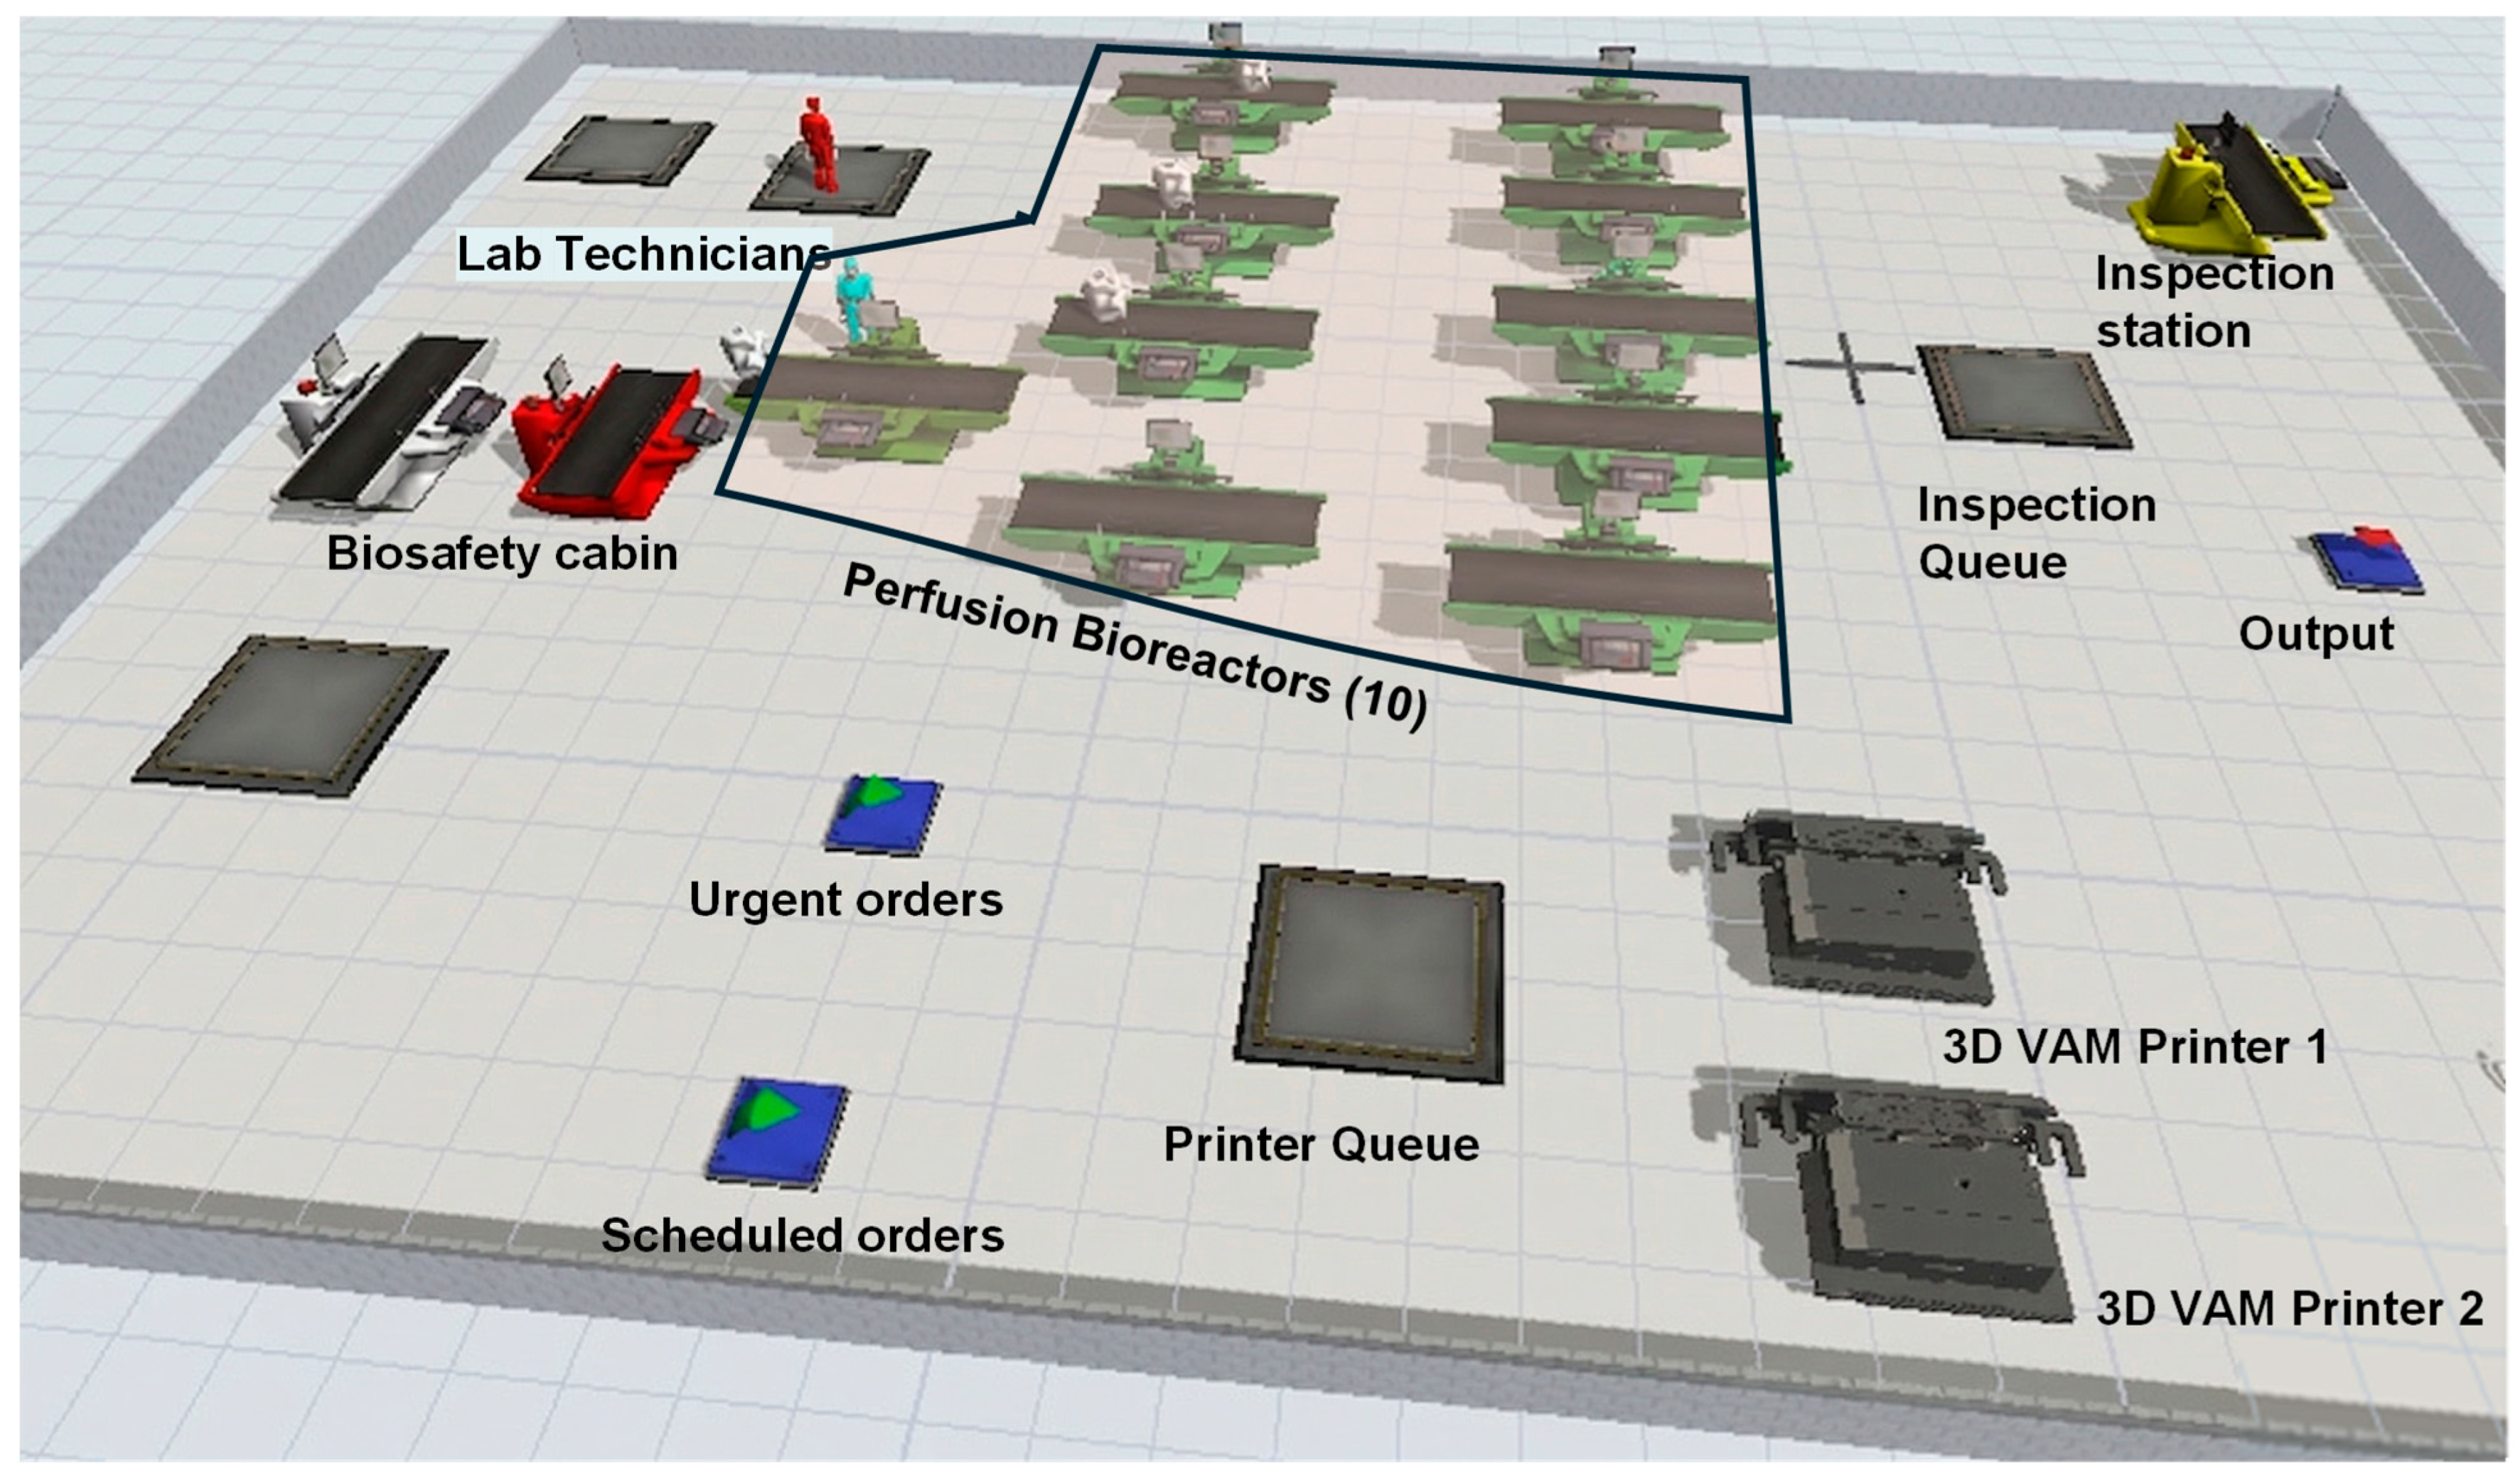
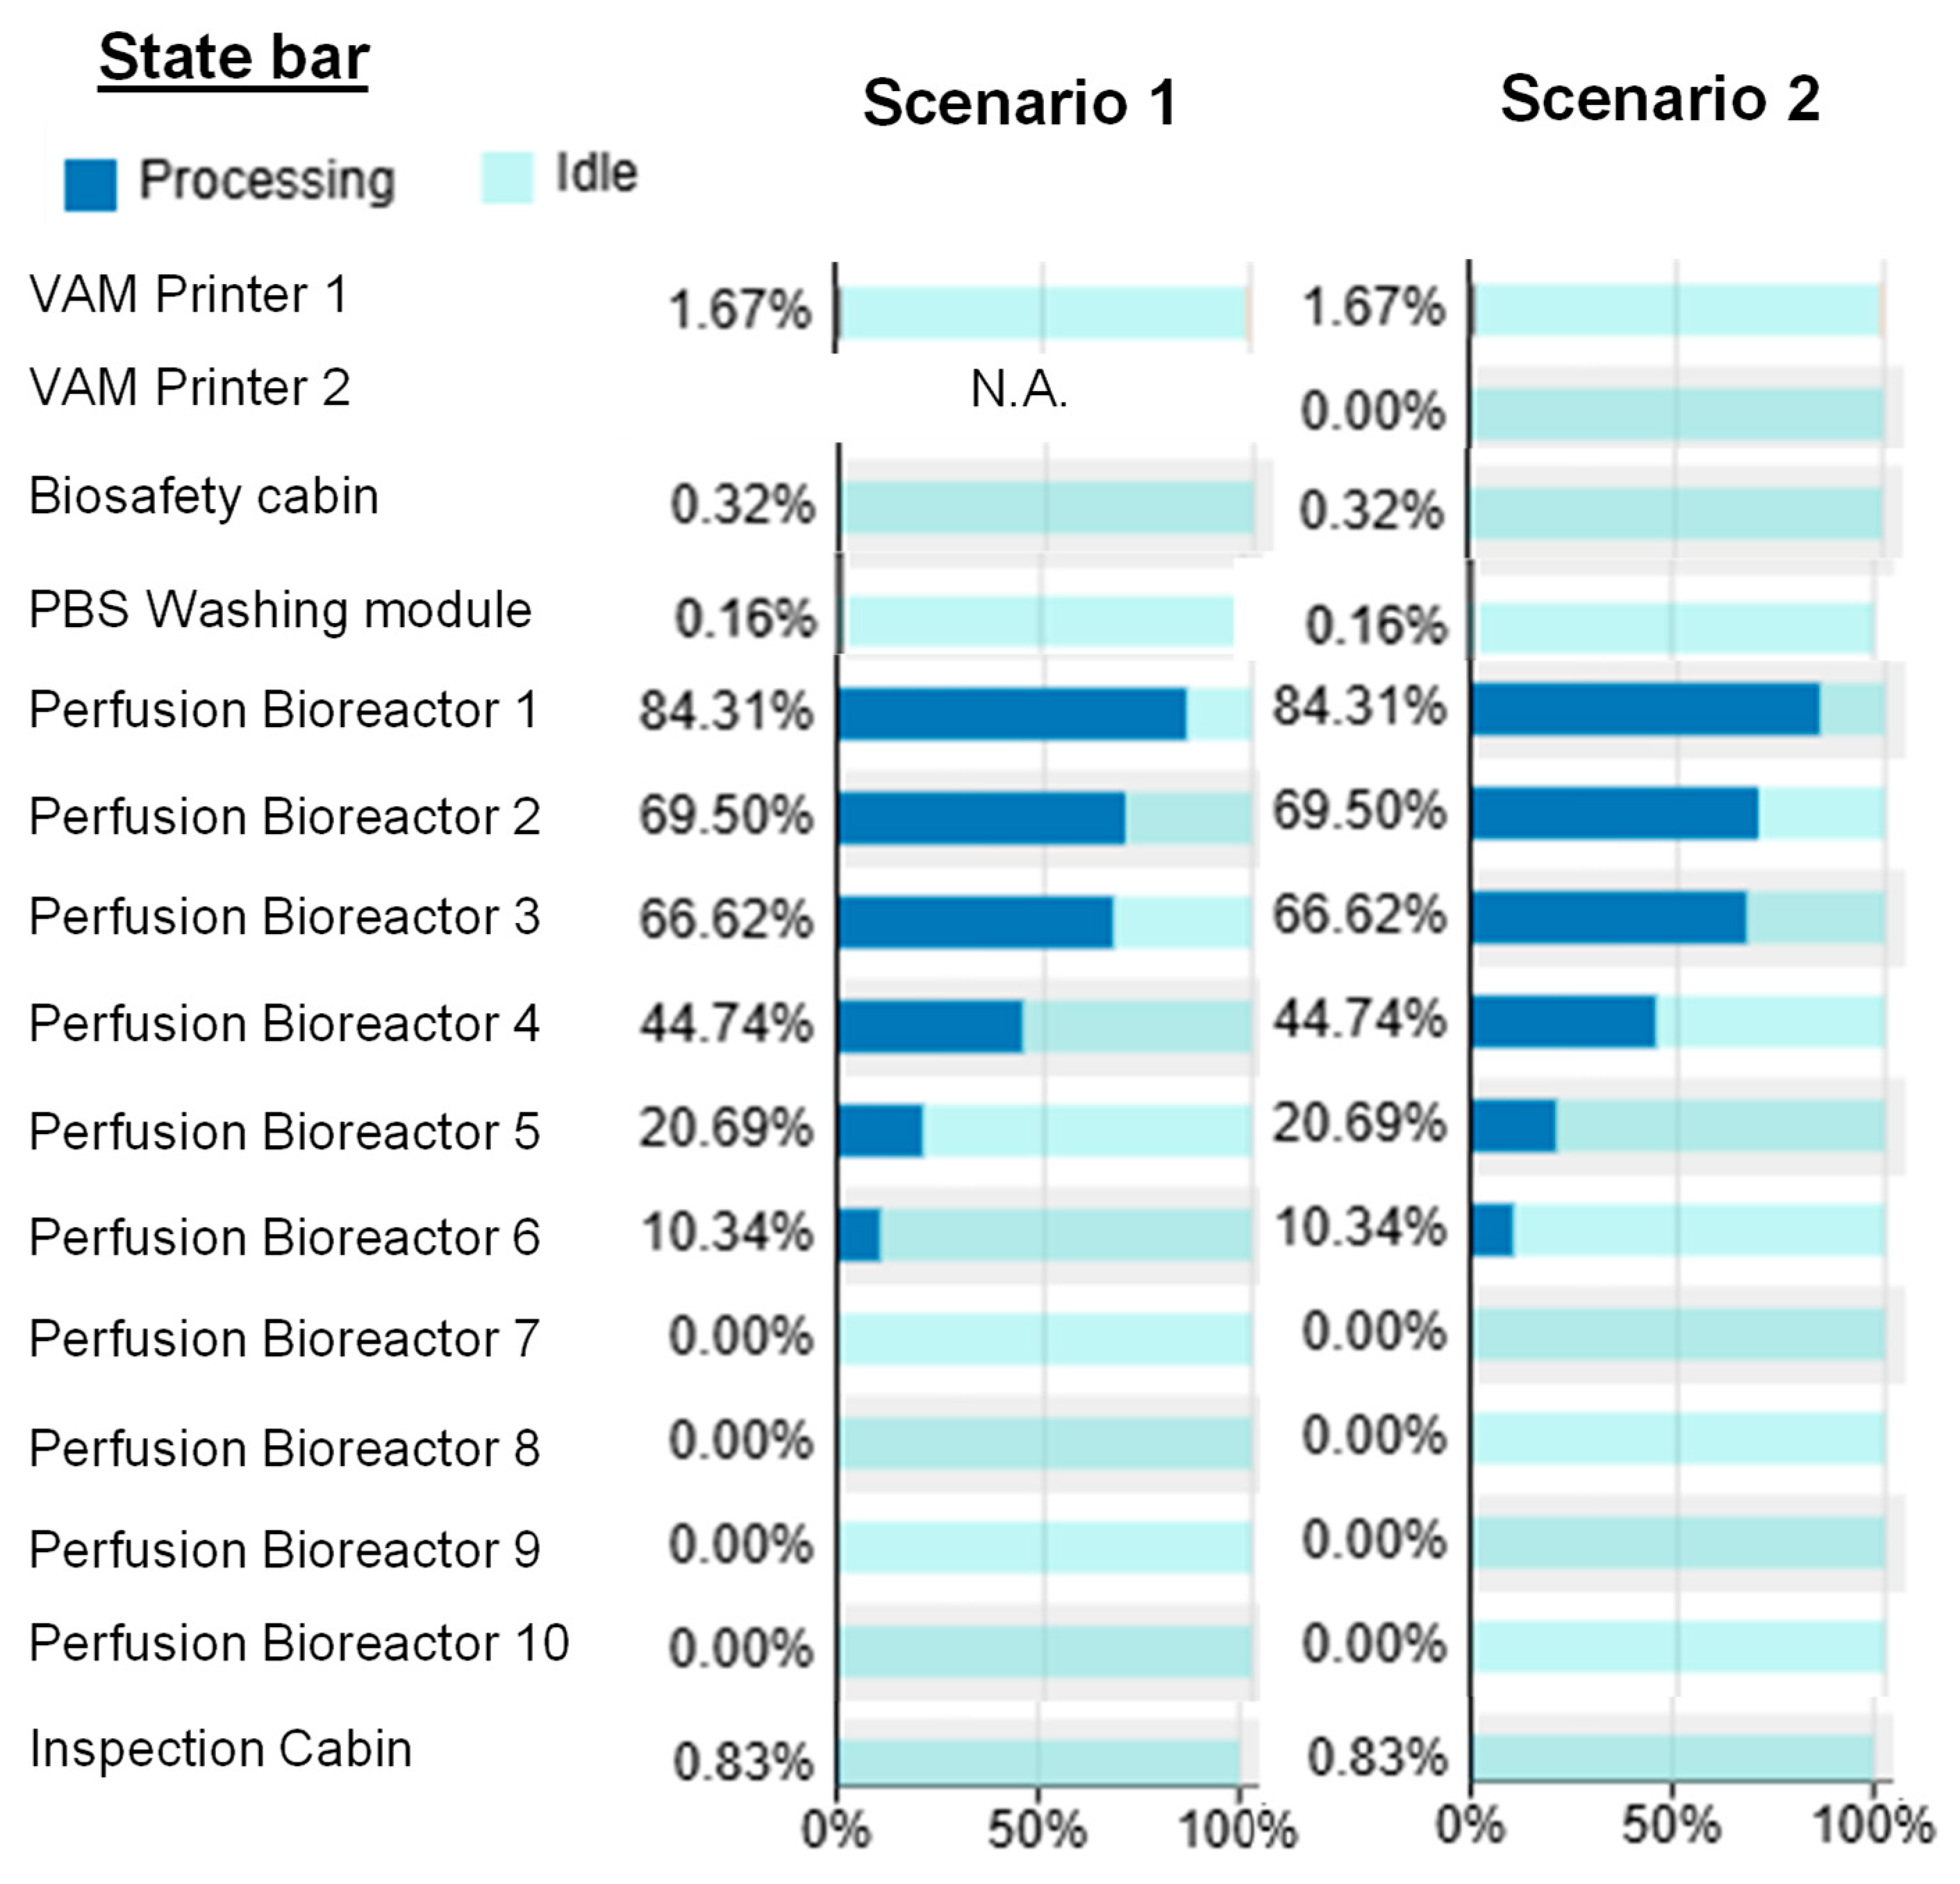
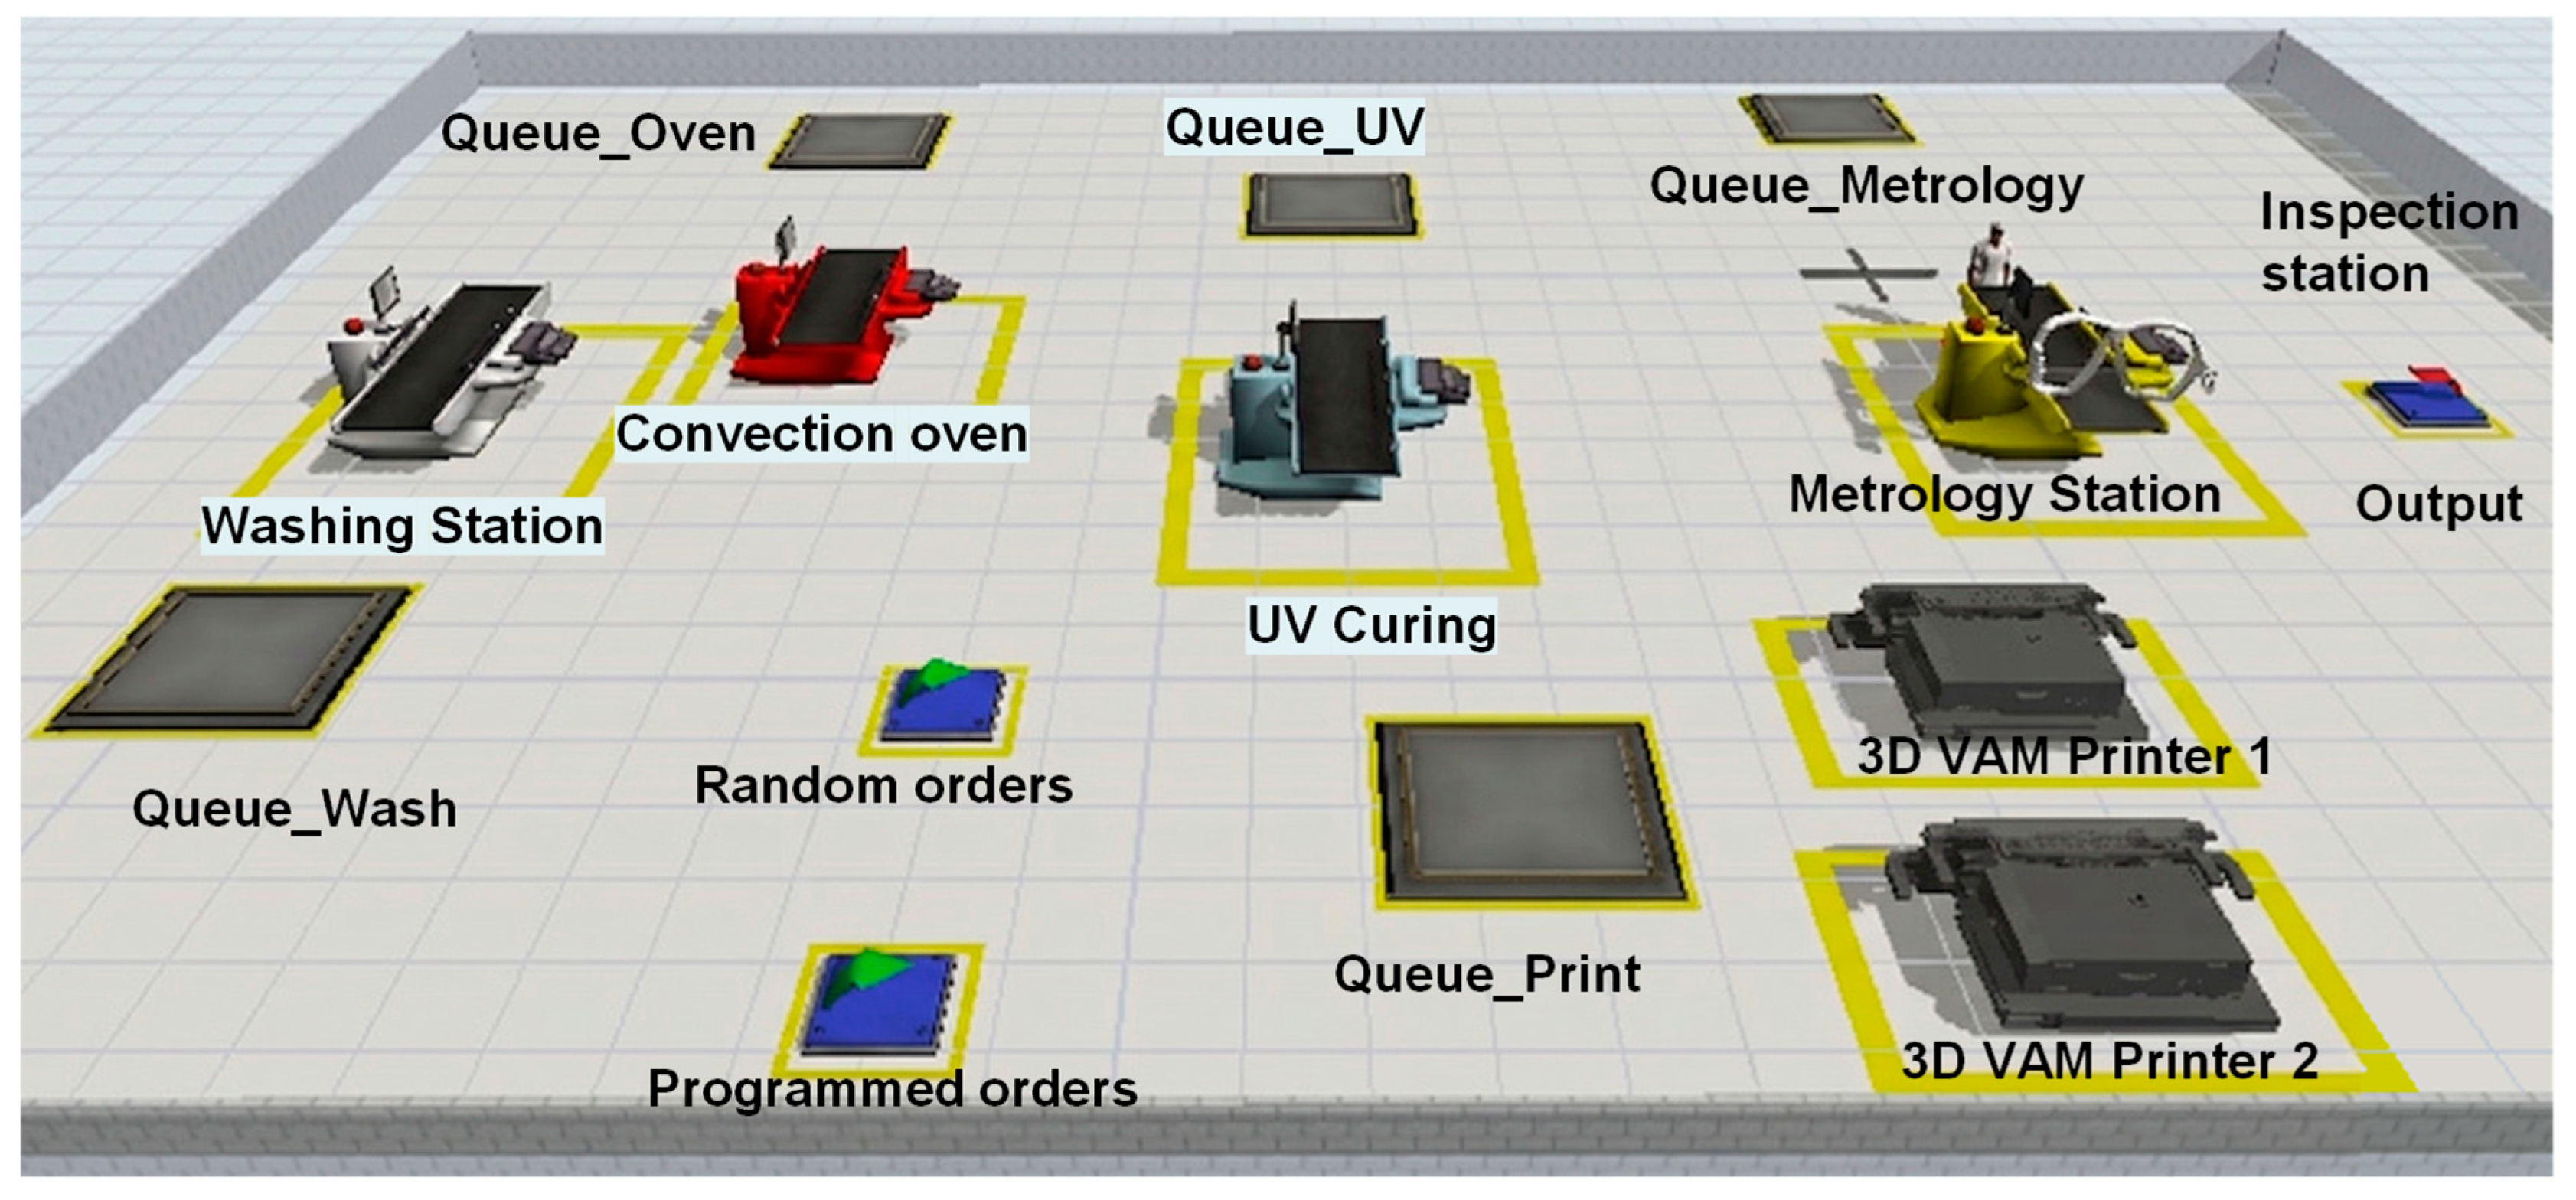
The second bottleneck persists in the Xube2 printer, with usage levels at a minimum (1.67%), reflecting low synchronization with the subsequent stages of the process. A variant of the first model was created in Flexsim, by adding a second printer, as shown in Figure 5. In this scenario, the configuration of 10 cavities in the perfusion bioreactor was maintained, and a second Xube2 printer was incorporated. However, the second bottleneck persisted at the print stage, as the original printer continued to operate with a minimum utilization of 1.67%, and the new printer did not register activity during the simulated period. This behavior indicates a lack of synchronization between order generation and installed capacity, suggesting that the system continues to operate under flow constraints. The low frequency of order entry prevents both printers from being used; therefore, the improvement over the second case is nil in terms of performance. All queues remained empty.
The provided state bar chart, Figure 6, illustrates the resource utilization percentages for the atrial bioprinting system across two modeled scenarios. Scenario 1 operates with a single VAM printer and a capacity of ten perfusion bioreactors. Scenario 2 introduces a second VAM printer to the system.
The data reveals a stark contrast in equipment utilization across the production line: The perfusion bioreactors exhibit the highest utilization rates. The allocation logic routes orders sequentially, resulting in bioreactor 1 reaching 84.31% utilization, as shown in Figure 6, with usage cascading downward to bioreactor 6 at 10.34%. Bioreactors 7–10 remained entirely unused (0.00% utilization) in both scenarios, which is consistent with the 7-day maturation time. All other work centers, including the VAM printers, biosafety cabinets, PBS washing modules, and inspection cabins, operated at less than 2% utilization. Specifically, VAM printer 1 maintained a deeply underutilized state of 1.67%. The introduction of a second VAM printer in scenario 2 yielded no systemic changes.
The simulation results clearly demonstrate the operational imbalances inherent in integrating high-speed VAM with prolonged biological post-processing stages.

4.2. Case 2: Lenses

The simulation of the system was performed using FlexSim software, following the parameters established in Table 2. In the first scenario, two VAM printers were used, as shown in Figure 7. During the simulation of the lens production system, a mixed demand composed of two input sources was modeled: The deterministic source generates 10 orders per week on a regular basis, and the stochastic source generates between 1 and 5 orders per week randomly, simulating requests from laboratories. In this week, a maximum of five random orders was reached. The system was simulated under a standard work shift of 8 h a day for 5 days. At the end of the week, 14 of the 15 units that entered the system were processed. The remaining unit was retained at the metrology station, indicating that the system was close to its maximum operational capacity. Effective use of both printers was observed, although with slight variations. The operational structure of the system remained largely the same, suggesting that the addition of a second printer did not lead to significant improvements in overall performance. Although the proposed workflow meets the required demands at its maximum capacity, there is room for potential improvement.
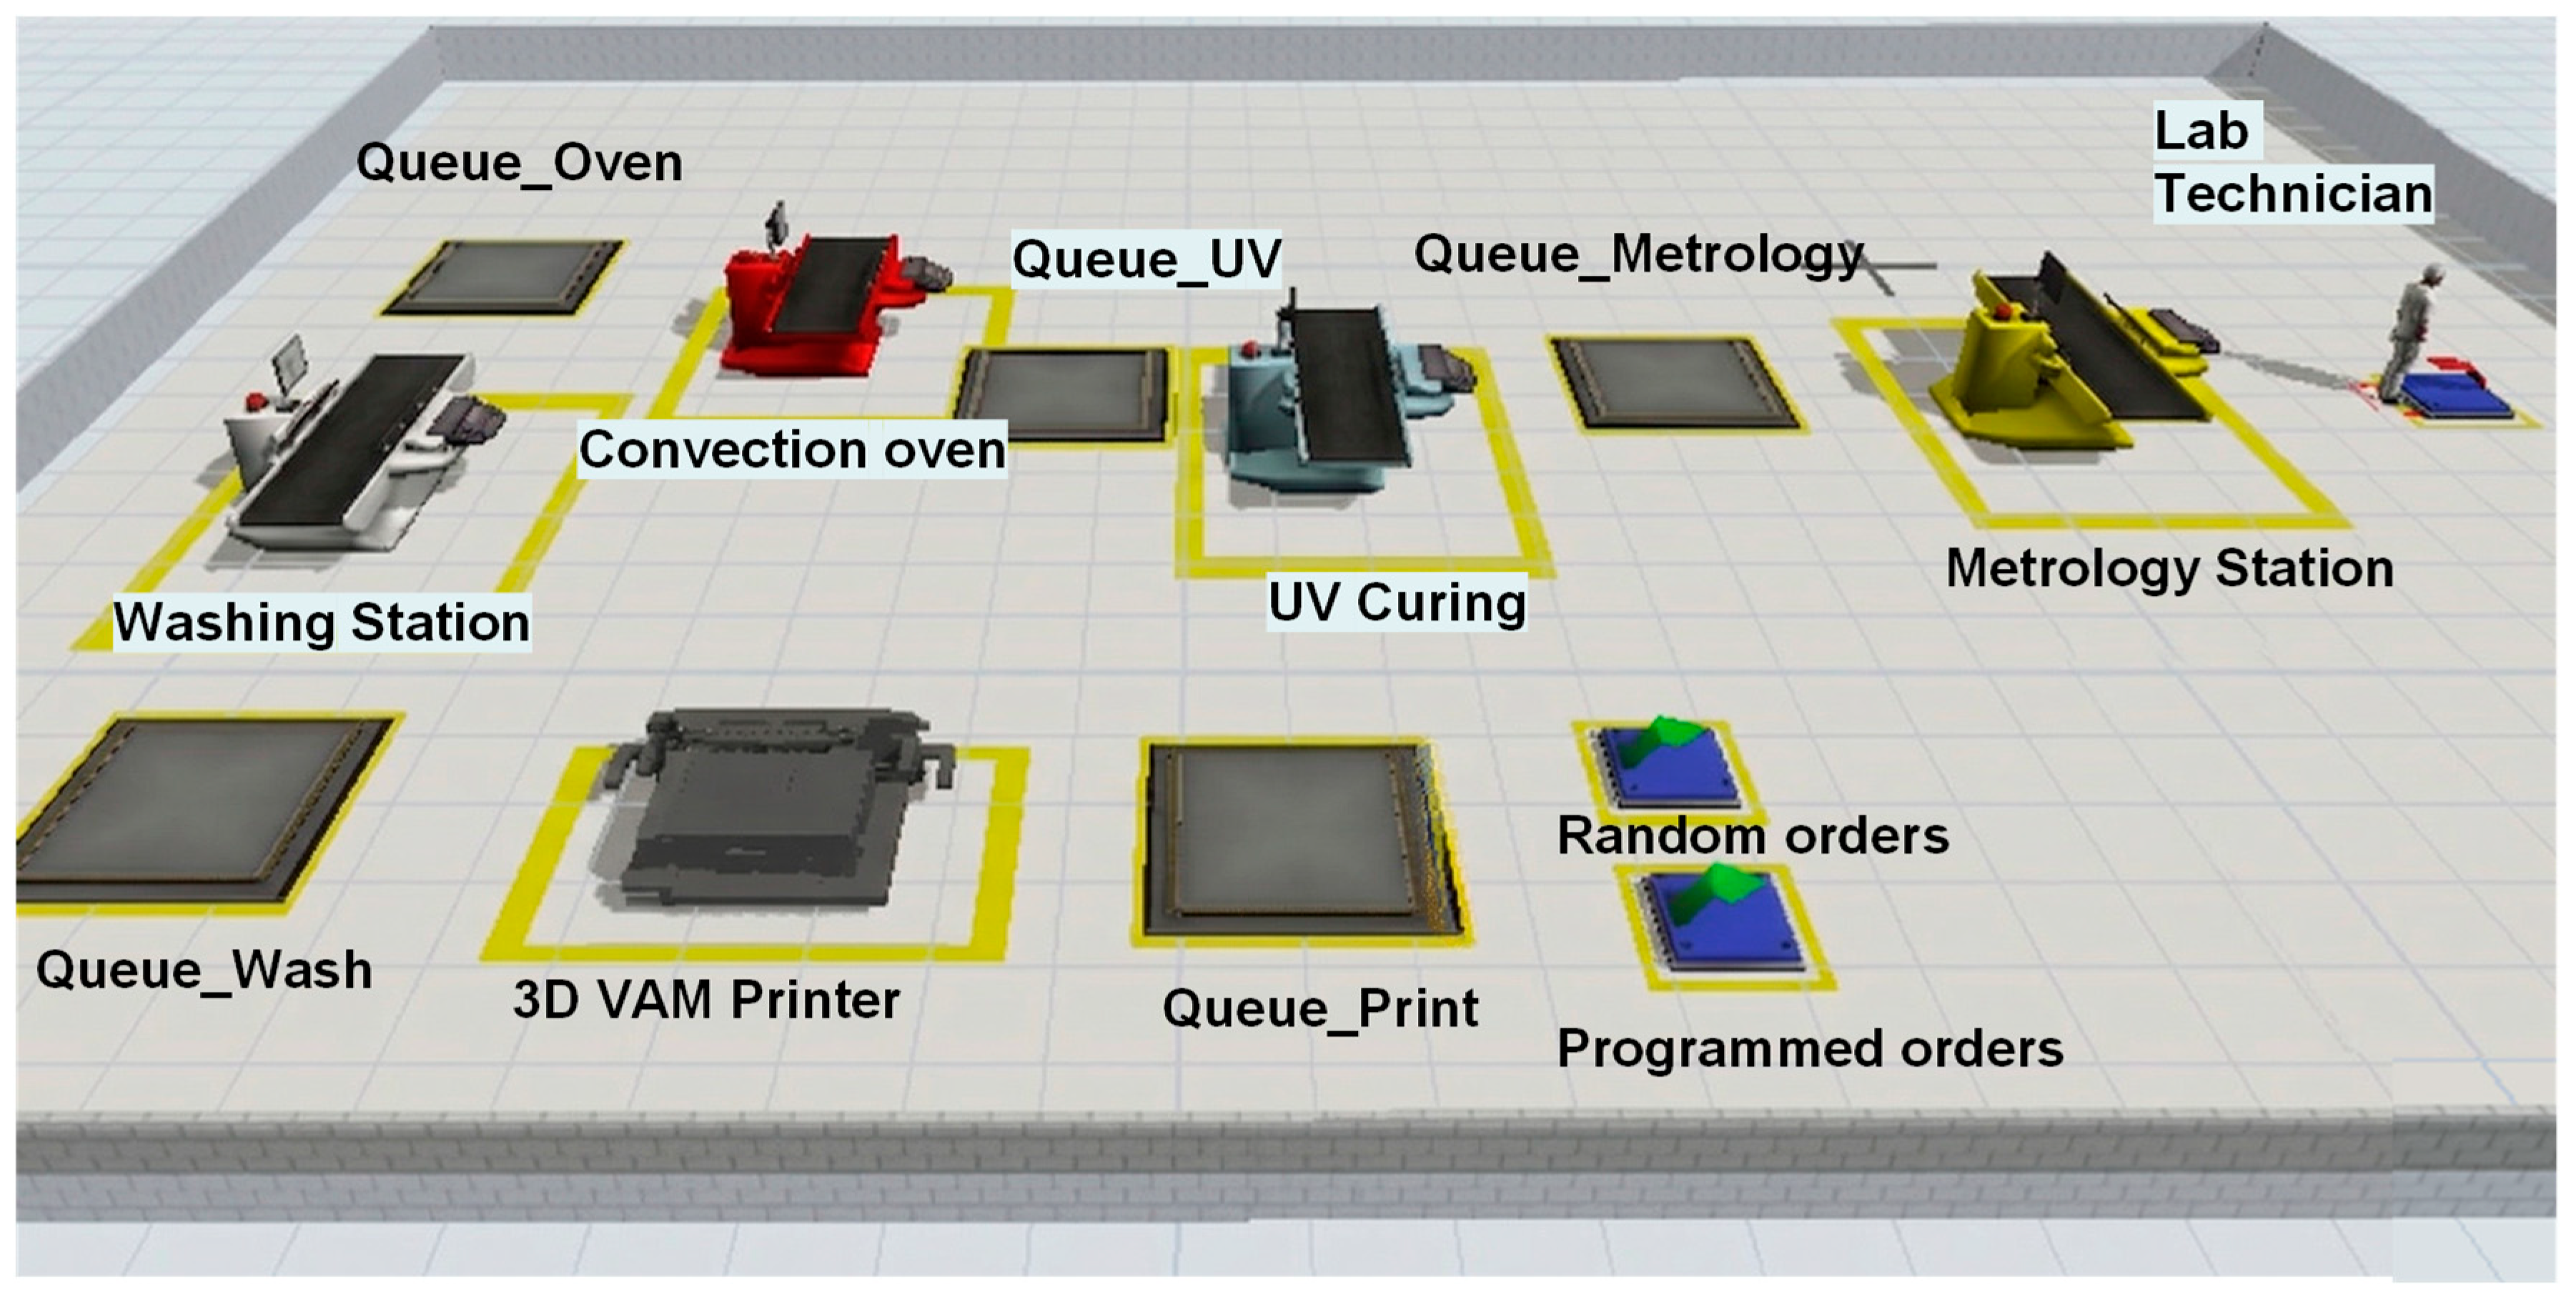
In scenario 2 of lens manufacturing, a reorganization of jobs was made in a more optimal way and with less unnecessary travel, as well as by eliminating one printer, as shown in Figure 8.
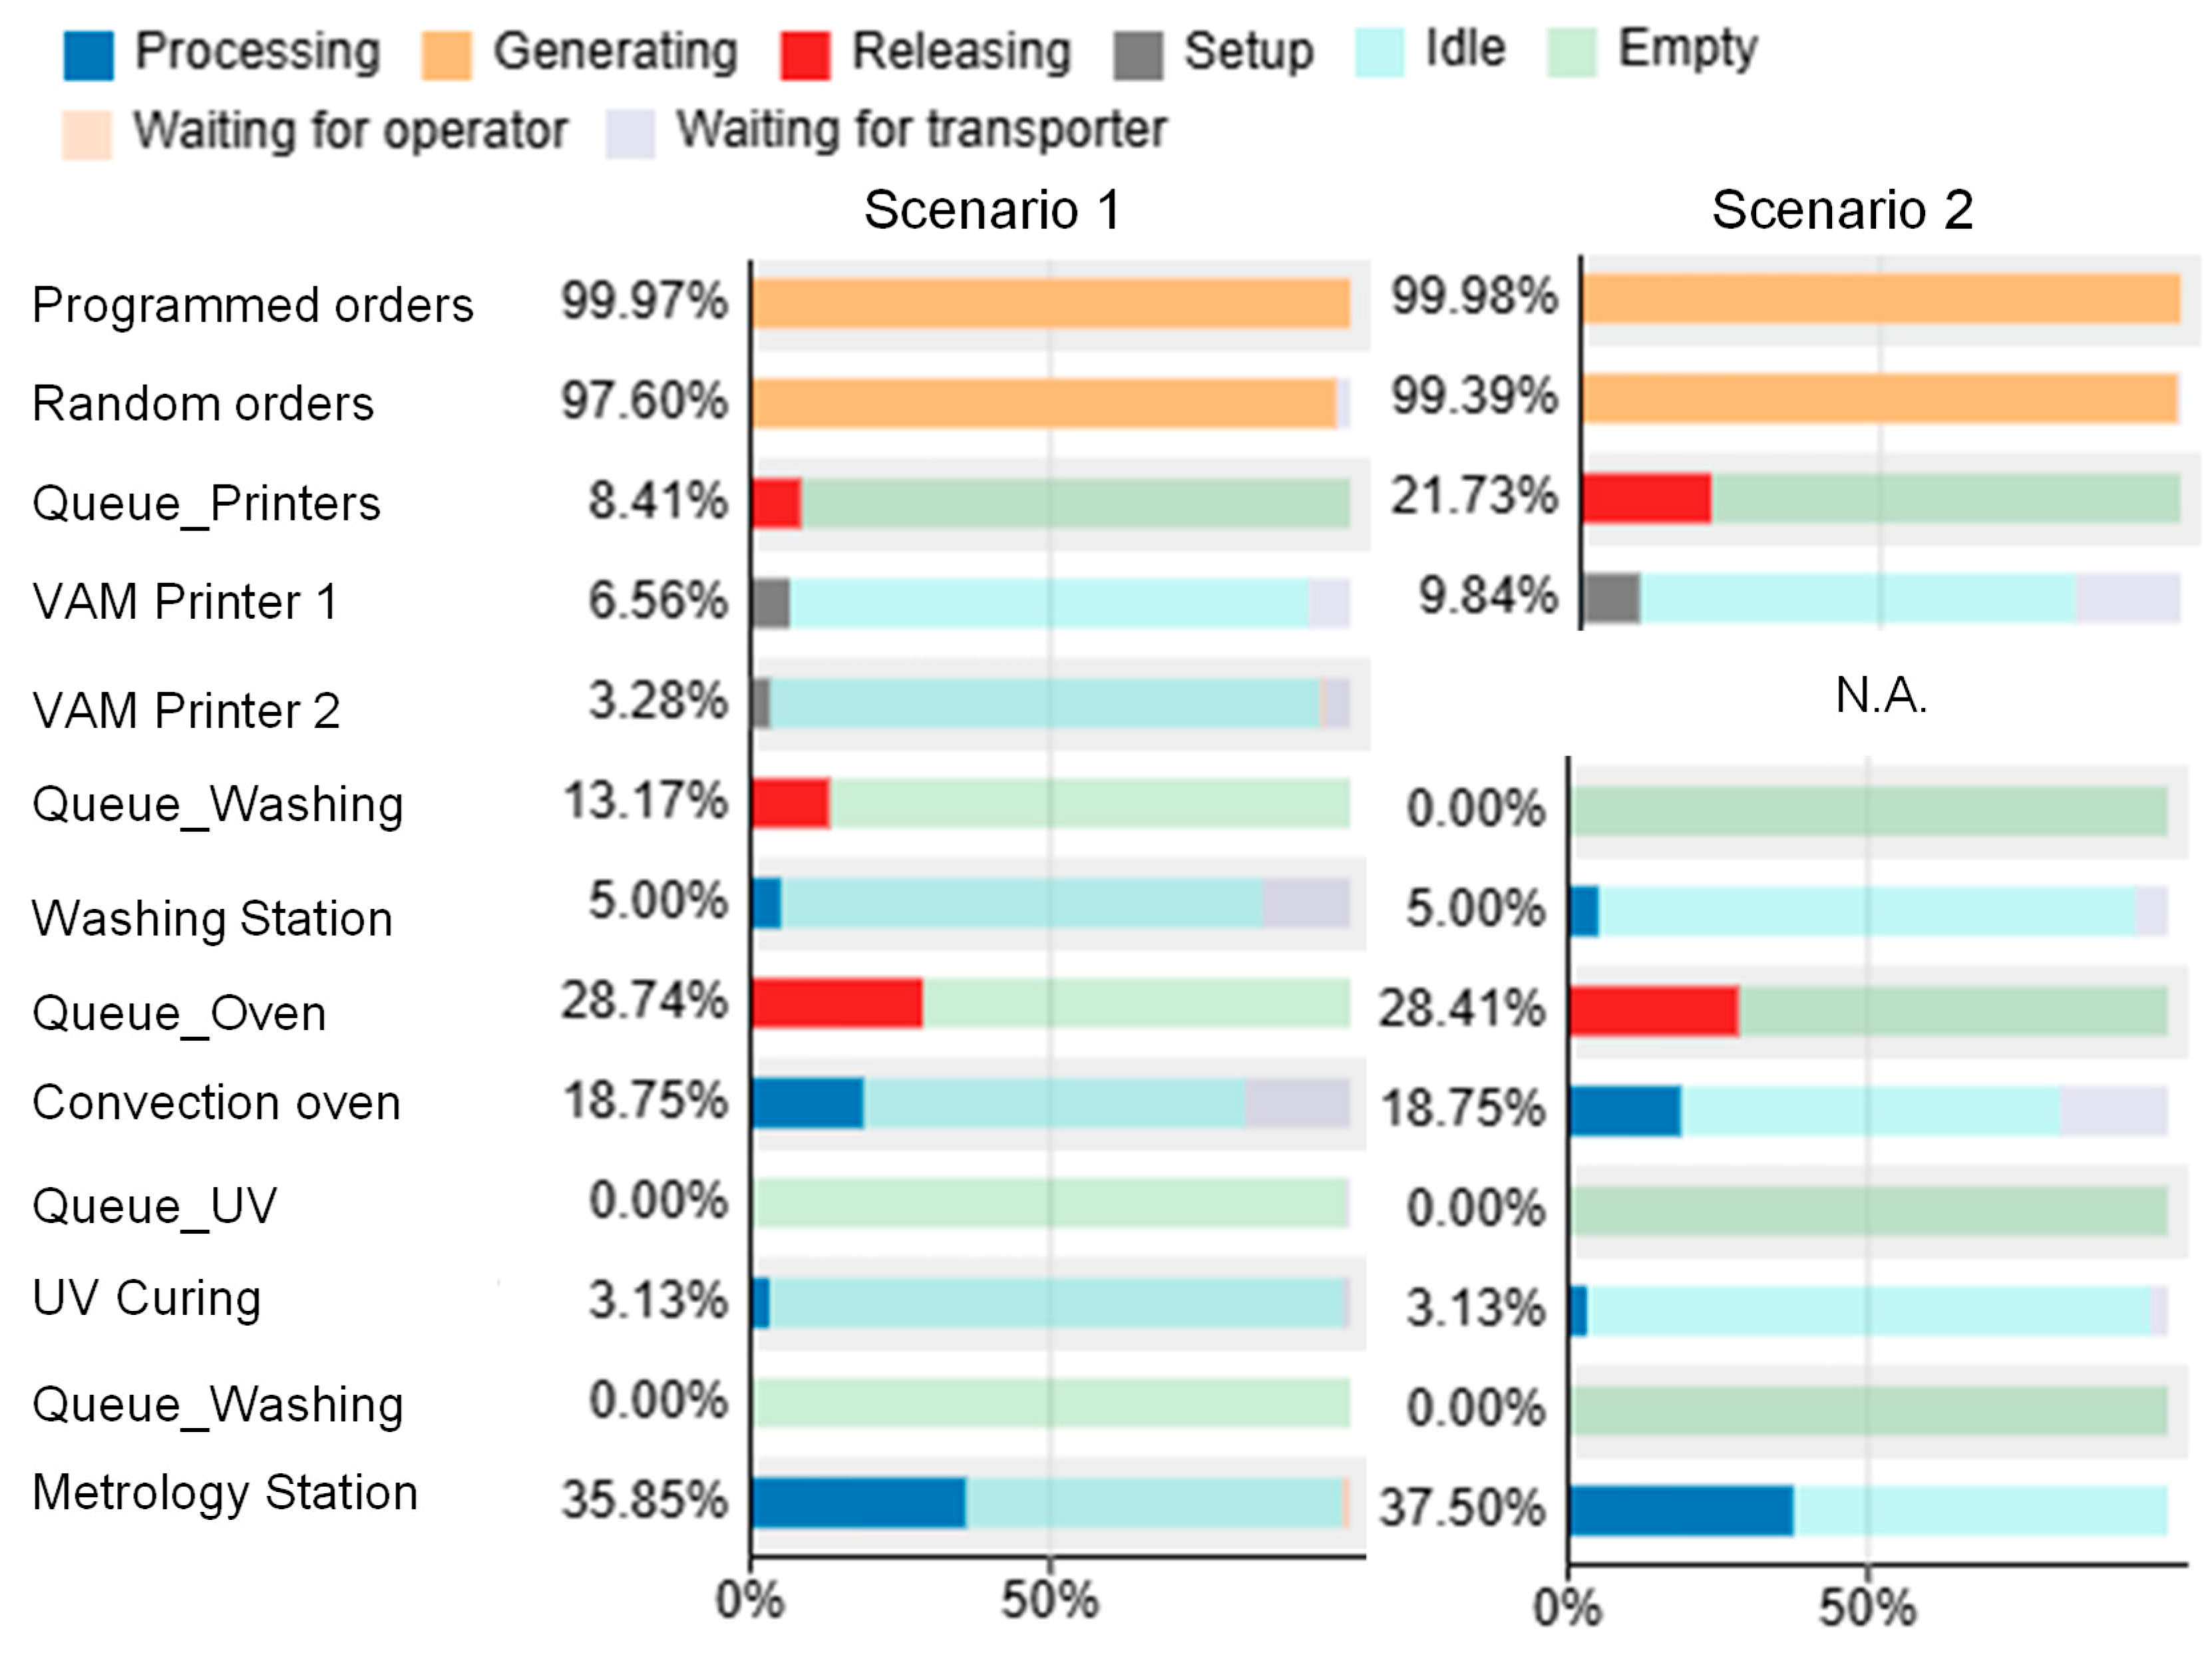
In this scenario, the main change implemented in the model was the reorganization of the workstations and the elimination of one printer, which allowed 15 of the 15 units to be entered into the system and processed at the end of the week, in contrast to the base model, which only managed to process 14 units in the same period. The metrology station showed a significantly higher utilization (37.50%; see Figure 9). Owing to its longest processing time (60 min), it was identified as the bottleneck of the system. The waiting queues show moderate accumulation, which implies that the workflow is not completely continuous and may be conditioned by time availability or the sequence of processes.
While the entire system meets production demand when at maximum, metrology still has bottlenecks and can improve. Even with the bottlenecks, the system as a whole works efficiently and handles the demand, as well as extra demand, with its current installed production, which shows that the system is underutilized and can still improve its production efficiency and output.
The simulation results for the optical lens production line reinforce the paradigm that integrating the VAM shifts operational constraints significantly toward downstream processes. The data clearly identify the metrology station as the primary bottleneck in the system. This is a direct consequence of the stark disparity in processing times; while the VAM printer requires only 0.75 min to produce a lens, rigorous optical inspection (AFM, interferometry) demands 60 min per part. Consequently, the system is fundamentally paced by its quality control capabilities rather than its manufacturing speed.
A key insight is illustrated by comparing scenarios 1 and 2; it shows that investing capital upstream is worthless if a bottleneck exists downstream. The addition of a second VAM printer in scenario 1 had negligible effects on overall performance, because a single VAM printer operates well below 10% utilization and can easily handle the total demand (deterministic plus stochastic). So, the second printer represents unnecessary capital investment.
The notable accumulation in Queue_Oven (approximately 28%) reflects the inherent waiting times associated with batch production policies. Parts must wait in the queue until a full batch of five is formed before proceeding to the convection oven, thereby causing deliberate intermittent flow interruptions.
Overall, despite the bottleneck at the metrology stage and moderate queue accumulations, the system proved to be highly efficient, successfully meeting the required mixed demand while maintaining substantially underutilized capacity. Table 3 summarizes the main KPIs found in both cases and scenarios. Future optimization efforts for this high-mix low-volume environment should focus strictly on parallelizing the metrology stations or automating the optical inspection processes to unlock the true throughput potential of the VAM equipment.

4.3. Sensitivity Analysis: Impact on Cycle Time

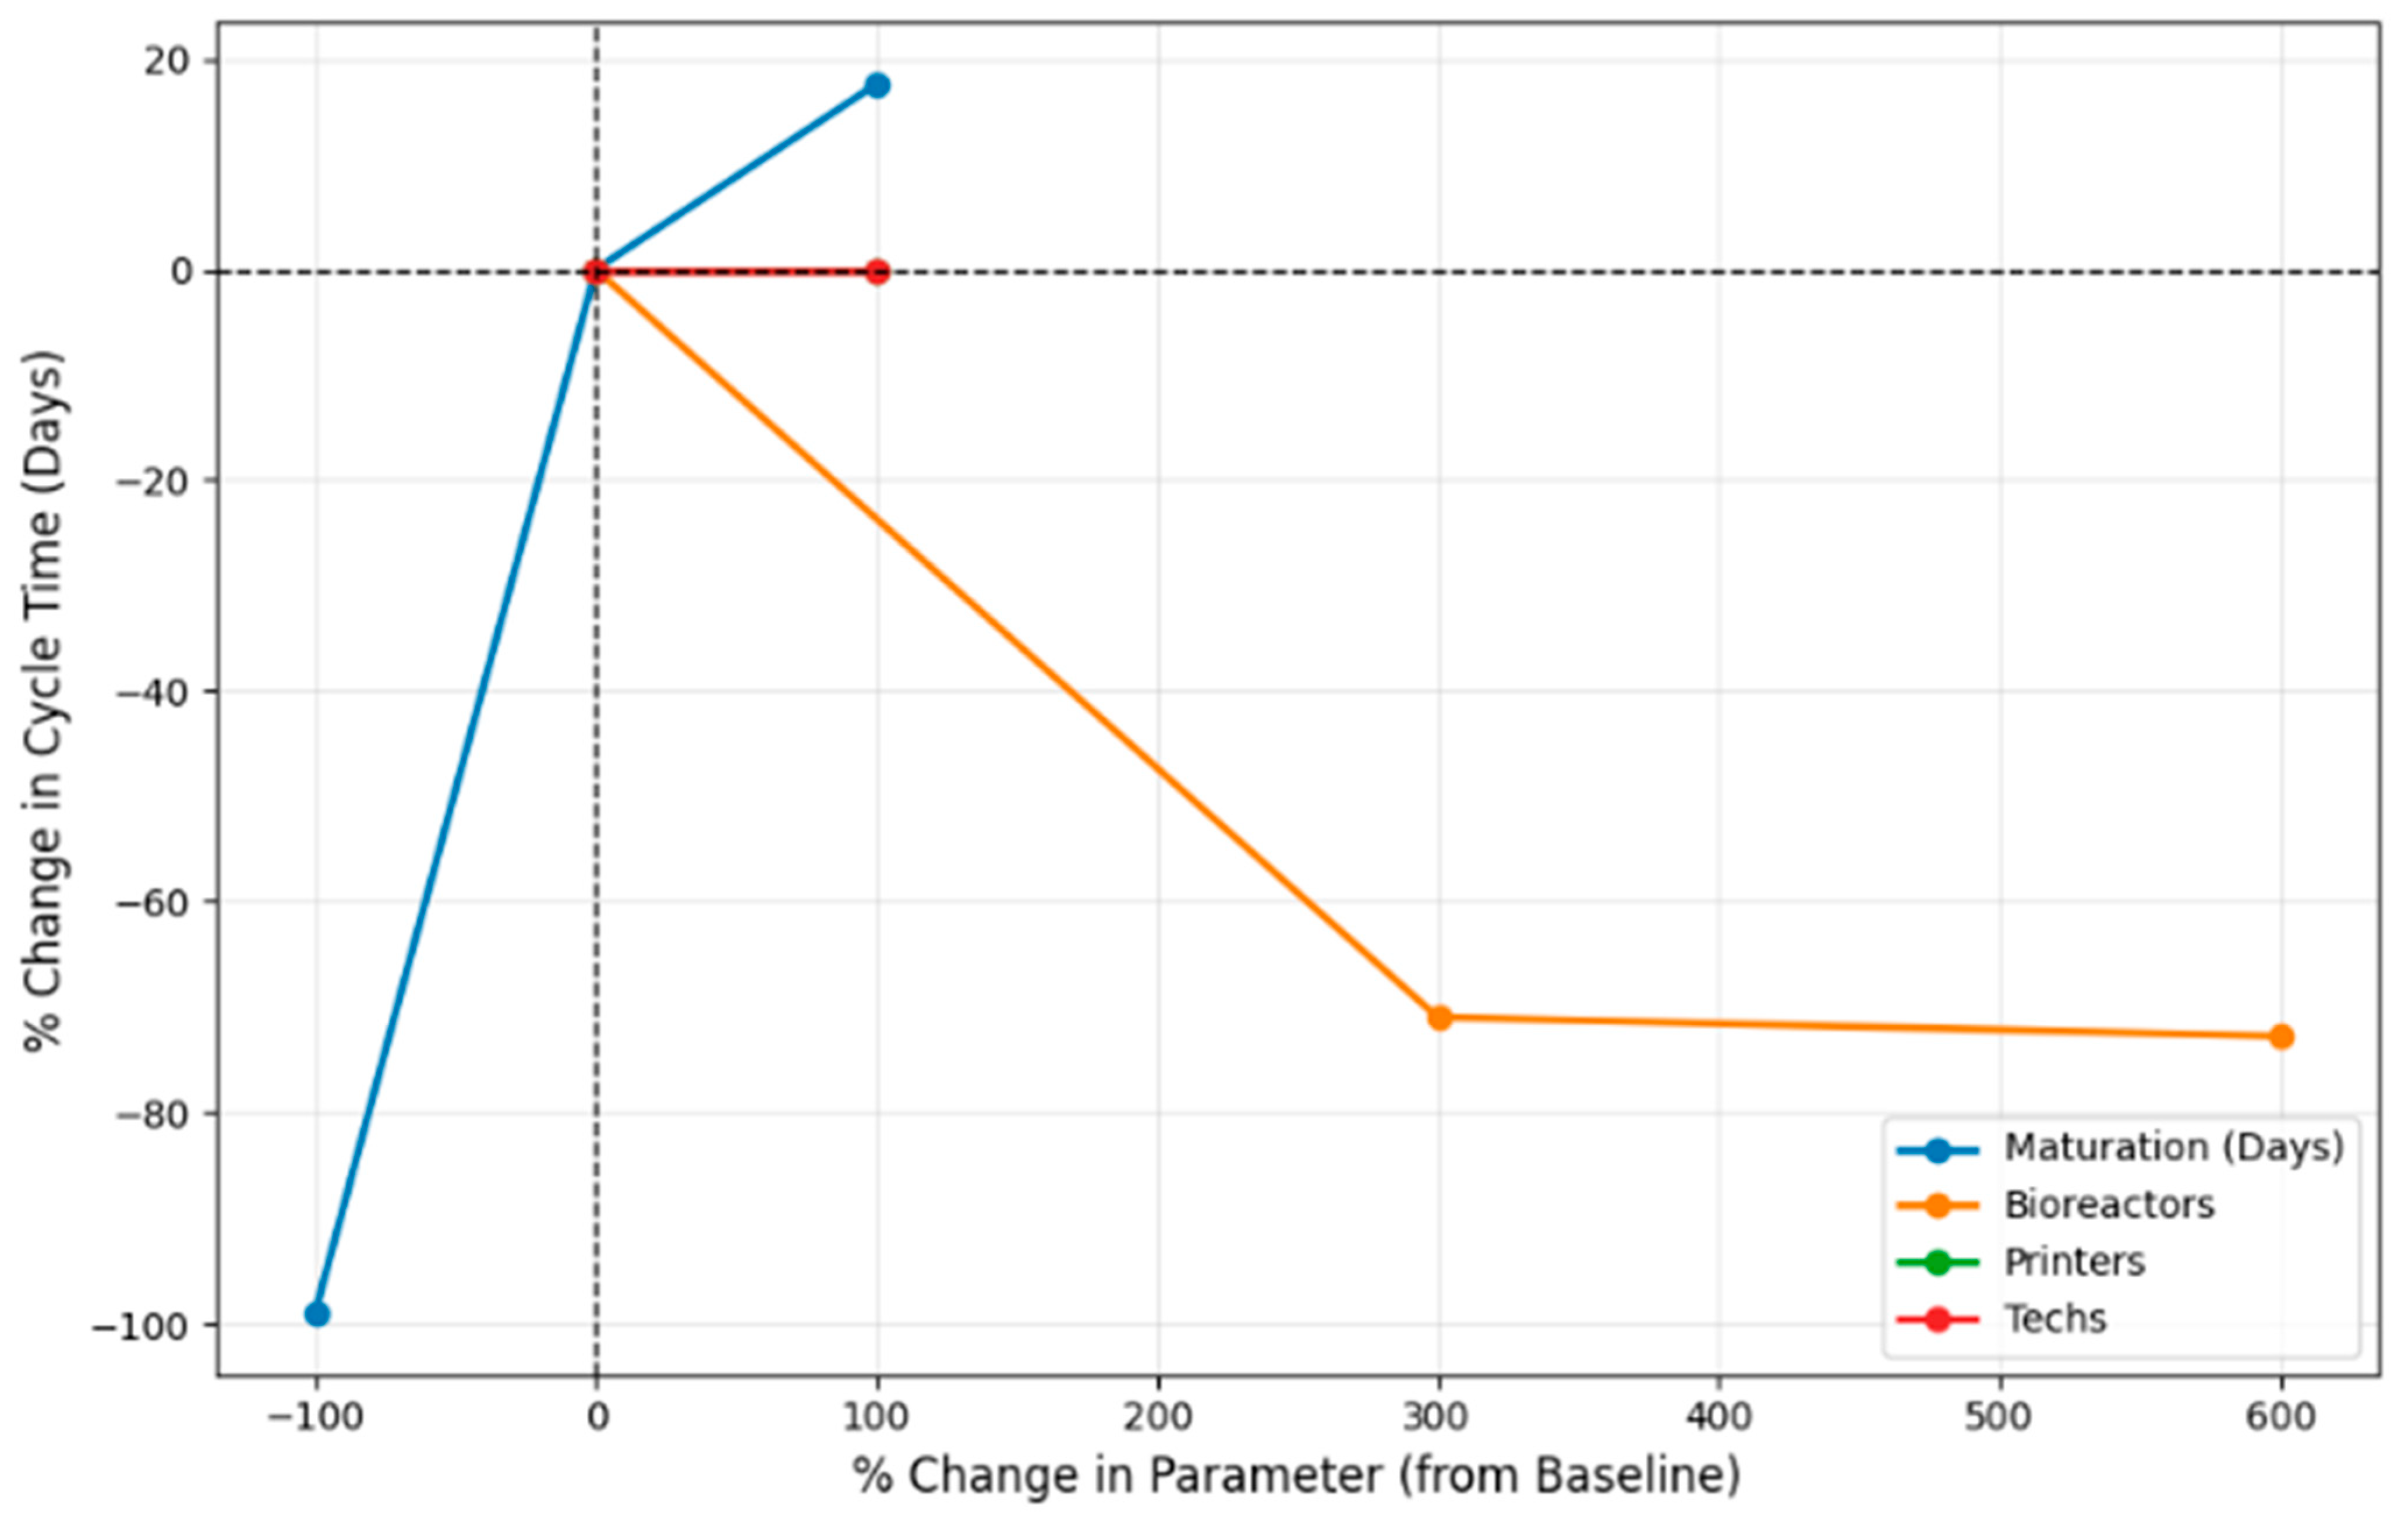
The sensitivity analysis for the atrial bioprinting system quantitatively evaluates the elasticity of the average cycle time in response to isolated variations in key operational parameters. The resulting spider chart maps these percentage changes relative to the baseline scenario (one printer, one technician, one bioreactor, and a 7-day maturation time) as shown in Figure 10. One word of caution for Figure 10. The results for “Printers” (green line) and “Techs” (red line) overlap, so they seem be only one.
The most striking feature of the chart is the perfectly flat overlapping horizontal lines for both “Printers” and “Techs”. Increasing the availability of VAM printers or laboratory technicians by 100% (from one to two units) results in a 0% change in cycle time. This mathematically confirms that upstream hardware and human resources are entirely decoupled from the system’s throughput limitations. It reinforces the finding that the VAM printer operates under severe flow restrictions and low synchronization with subsequent stages.
The “Bioreactors” parameter (orange line) demonstrates a strong negative correlation with cycle time; however, it is subject to severe diminishing returns. Increasing the bioreactor capacity by 300% (from 1 to 4 units) drastically reduces the cycle time by approximately 70% by clearing the massive work-in-progress (WIP) queue. However, expanding the capacity further to 600% (7 units) yields only a marginal additional reduction in cycle time (settling near −75%). This curve proves that once the queuing bottleneck is resolved, adding more hardware cannot accelerate the fundamental biological constraints of the process.
The “Maturation (days)” parameter (blue line) dictates the absolute floor of the system. A hypothetical 100% reduction in maturation time (bypassing in vitro maturation, perhaps via immediate in vivo implantation) would drop the cycle time by nearly 100%, reducing the entire process from weeks to the mere minutes required for VAM printing and aseptic washing. Conversely, a 100% increase in the maturation requirement (to 14 days) predictably increases the cycle time. Because the perfusion bioreactor imposes long process times, it is the undisputed anchor of the entire production flow.
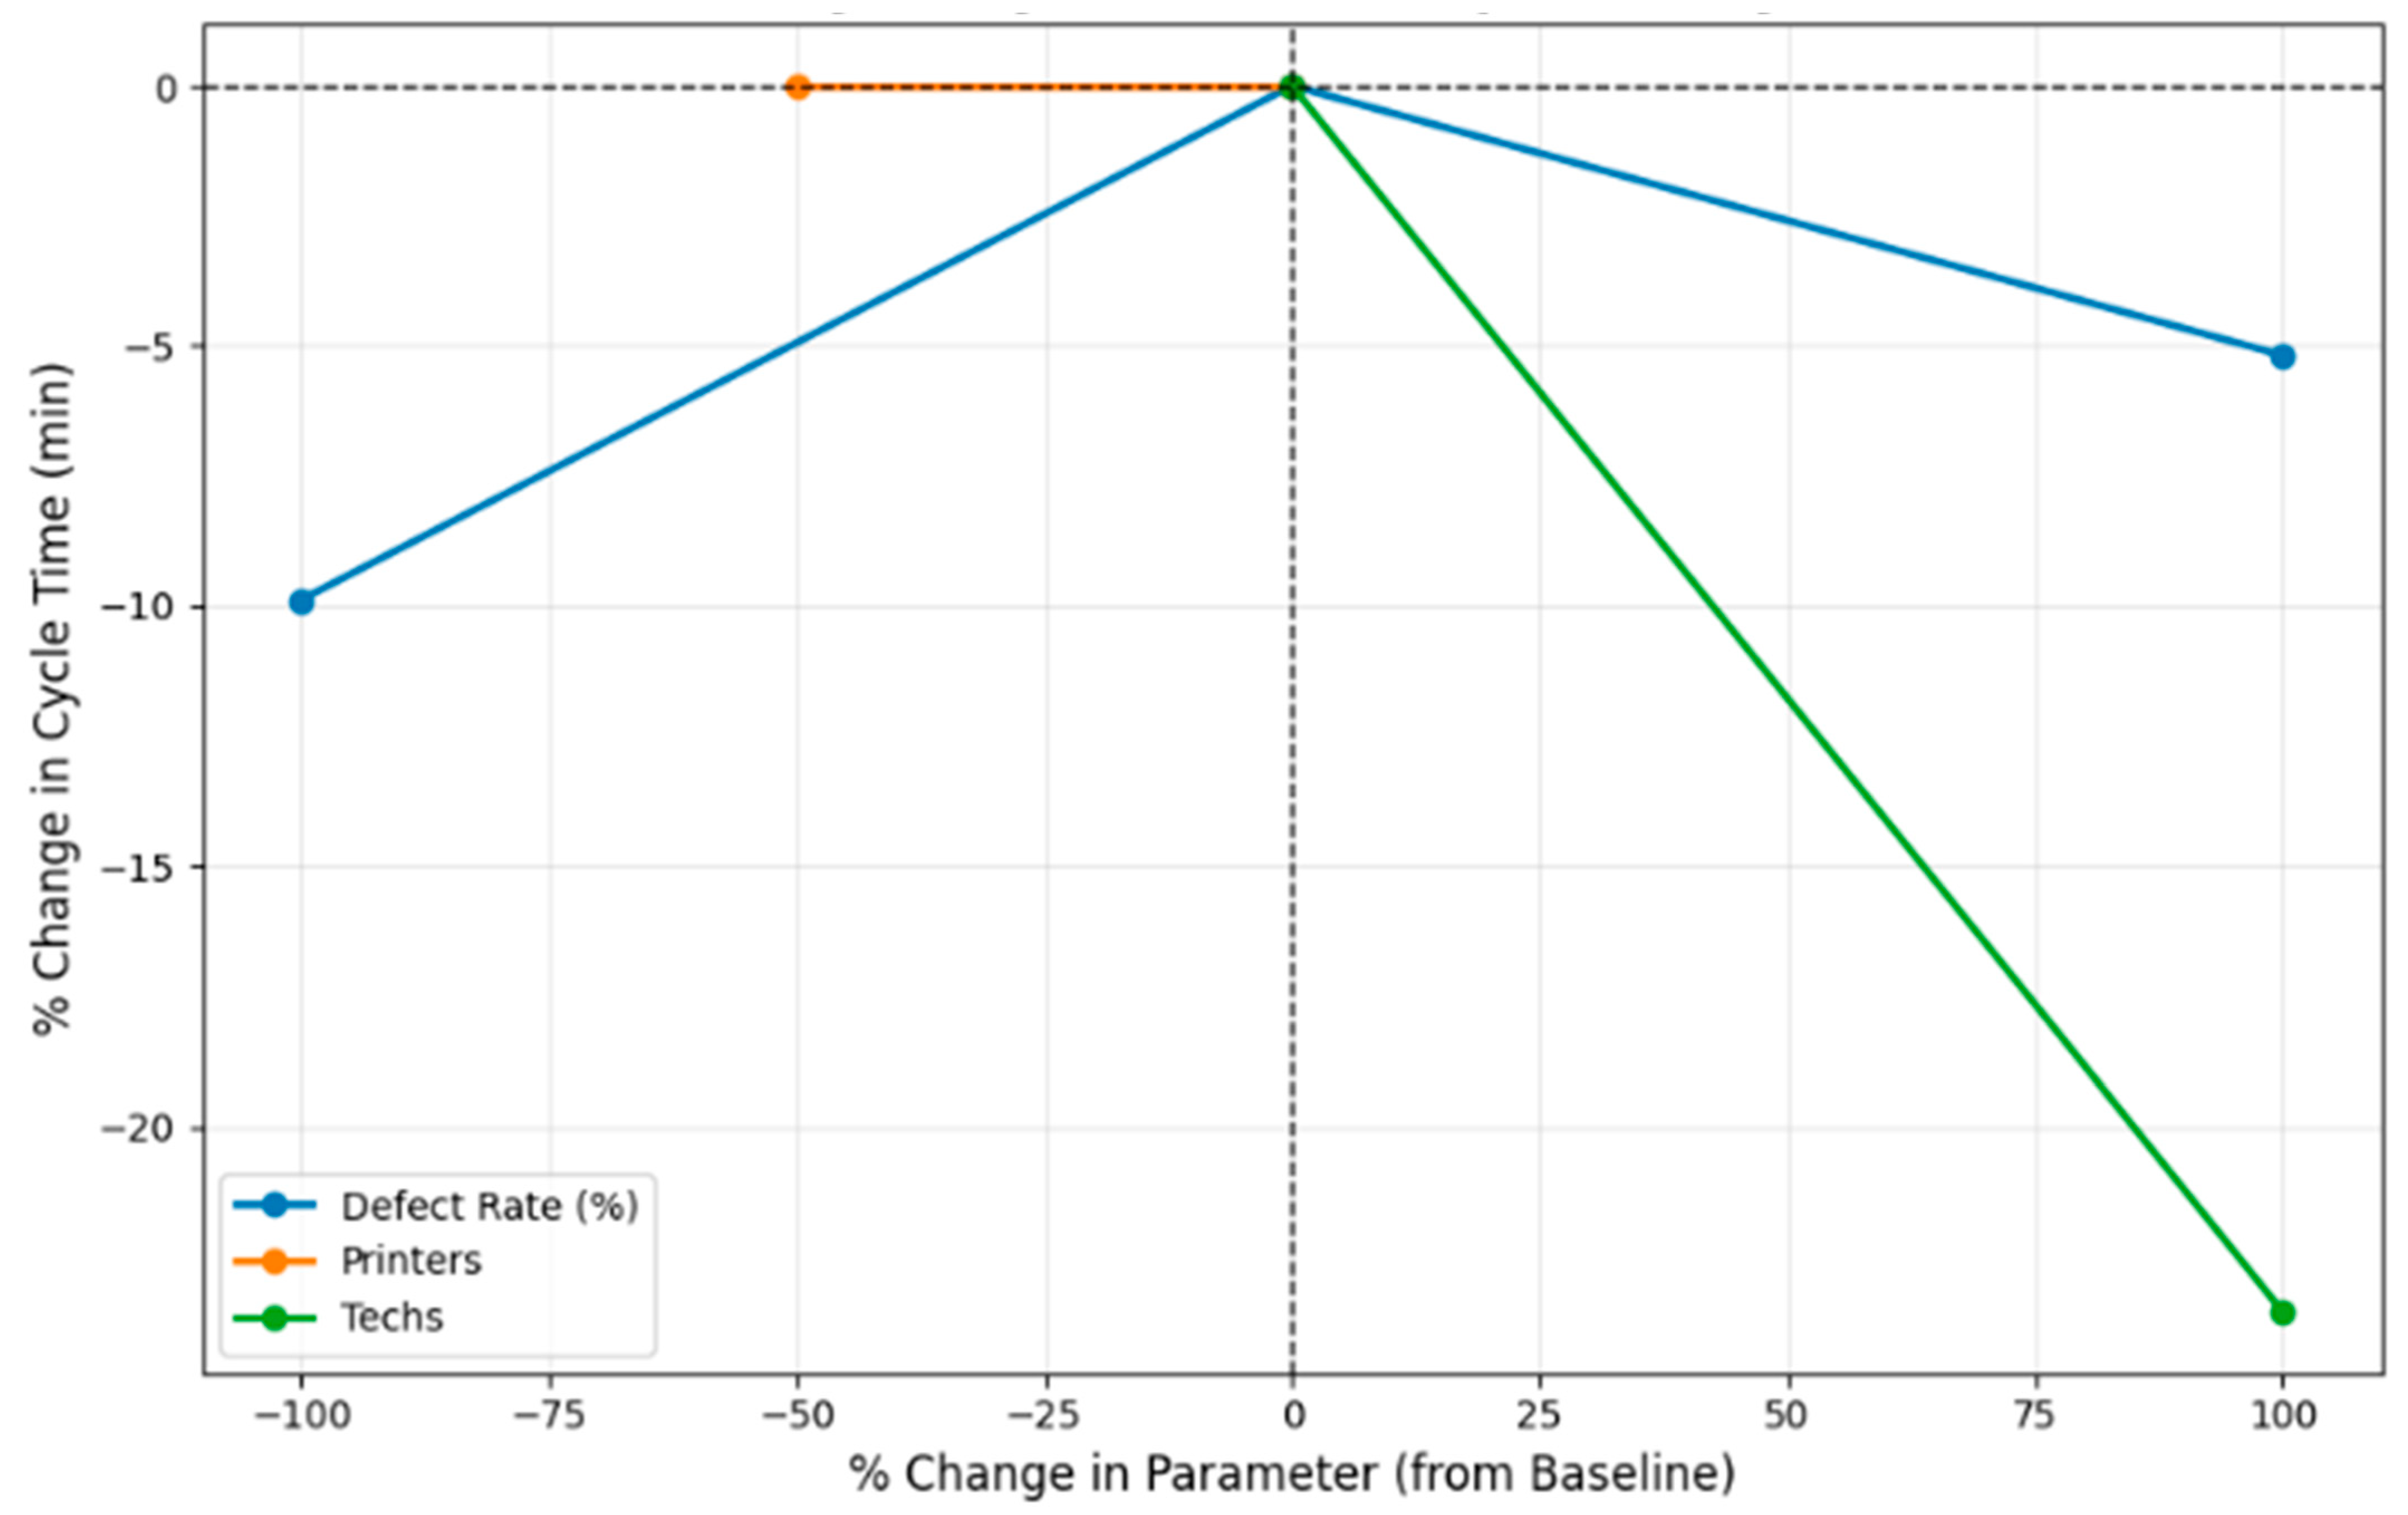
For the second scenario, the lens manufacturer, Figure 11 shows the percentage change. The sensitivity graph shows that decreasing the printers from two to one has no effect in the cycle time, because the demand can be supplied by only one printer.
Both cases offer conclusions to VAM process planning based on technology. For higher speeds, the bounds of what is possible lie primarily within photocuring kinetics, fluid regime and equipment constraints. First, to realize higher speeds via VAM, the development of fast-curing polymers and photoinitiators with the required resolution is essential. In this type of high-speed continuous printing process, a high power output is necessary (to cure the materials quickly with small voxels of curing light). The material requirements mean that the variety of usable materials is currently small. The printing time will also heavily depend on the printing process and its fluid regime, requiring laminar rather than turbulent flow for accurate printing. If a printing process is too fast, turbulence can arise that may cause eddy currents leading to the introduction of unexpected material mixture and printing inaccuracies. A stationary fluid regime is required in which the separation of the particles must be constant at each time interval. In terms of the setup, the projector speed or frame rate is unlikely to be a significant issue given the other aspects to consider. Furthermore, the dynamic behavior of the system, particularly the rotational cylinder, is technologically mature and generally does not require extensive tuning, ensuring only low vibration, stiffness, and reliable behavior. Nonetheless, within an industrial setting, it has been shown that speed is not a critical parameter to optimize.
Increasing the size could be beneficial by expanding the capabilities of the process; actual barriers to big area volumetric additive manufacturing (BAVAM) or big volume VAM (BVVAM) necessitate consideration of several scaling-up aspects. For example, photocurable light depth: If the depth or absorbable light range of the resin is not sufficiently high, the achievable cylinder diameter cannot increase, thereby limiting the maximum part size [37]. light emitting source size: This limitation is less stringent, as relatively large light sources are available. Fluid kinematics: The Reynolds number must be maintained to ensure laminar flow (Re = ρUD/μ, where ρ is the density, U is the velocity, D is the diameter, and μ is the viscosity). The larger the diameter D of the pipe, the smaller U must become if the flow regime must remain laminar, thus limiting the overall throughput; however, experiments using a rotative projector might make it possible to remove that barrier [38]. Viscosity and Self-Supporting Large Pieces: as the size and the weight of the part increase, the stresses the fluid experiences will increase, which can put at risk the mechanical characteristics and coherence of the printed piece while process time progresses. On top of that, there are well-established technologies (solution casting and molding) capable of printing pieces up to 3 m in length reliably; despite being costly in terms of money and time because of the creation of the molds, their maturity and robustness make them tough competition. The authors acknowledge this limitation, noting how events not accounted for (e. g., preventative maintenance, breakdowns, re-work loops, resource calendars not tied to shifts, preemption) might lead to considerable changes in either utilization or WIP, especially if metrology and bioreactors were the only resource types [39,40,41].

5. Conclusions

This study employs quantitative analyses for the precise measurement of process variables and performance metrics and qualitative analyses to interpret the broader implications for process planning and production control within volumetric additive manufacturing (VAM). The study relies on experimental data reported from VAM processes in the scientific literature, supplemented by theoretical models to validate the findings. The methodology employs discrete event simulation to analyze various aspects of VAM, such as model material flow, production scenarios, cycle times, and setup times.
Two case studies featuring a representative VAM process or system were included to provide practical insights and validate the methodology. This serves as a benchmark for analyzing the metrics, process efficiency, and production control strategies.
Capacity planning for VAM implies the determination of the number of 3D printers given the demand requirements; for these calculations, the following hypothesis are made: a request of n_i different parts is established with a number of m_i pieces per part, with each one containing a volume v_i. Each part has a constant setup time given by t_s and a printing time given, which is a linear function of the volume v_i. Post-processing time is always required, as the mechanical properties are strongly improved, and a lack of post-processing could result in a defective and uncured part. Post-processing includes washing the resin and curing, which can be achieved in a single part manner or in batch; both methods are established by proposing the post-processing time t_pp and the part limit post-processing.
Instead of employing a complete factorial design, which would generate an unmanageable experimental space of over 100 scenarios for the bioprinting case and 300 for the optical case, a one-factor-at-a-time (OFAT), a sensitivity analysis was performed. This deliberate screening selected a subset of scenarios representing extreme operational strategies, realistic balance points, and key management policies. Utilizing this selective approach is standard practice in complex simulation studies to maximize learning with a feasible number of experiments.
The selection of factors for the sensitivity analysis aligns with the findings in the literature: because VAM printing is extremely fast (seconds to minutes), the systemic bottleneck inevitably shifts to post-processing operations such as washing, curing, maturation, and metrology. Therefore, the analysis focused on assessing the impact of capacity investments (printers, post-processing stations), human resource allocation, and flow policies on these highly restrictive stages of the process. Ultimately, the results highlight the critical need to develop rapid post-processing methods; without significant advancements in downstream operations, the inherent speed and high-throughput advantages of VAM are largely negated.
The implementation of innovative models based on parameters informed by the existing literature is one of the contributions of this study. Even though there was no experimental validation due to the novel nature of the technique, this work represents an important initial step towards its development. To strengthen confidence in the results, a sensitivity analysis was performed that demonstrated the robustness of the proposed approach. In addition, this study opens the door to future experimental research that, as more empirical data become available, will allow to further validate and refine the models developed, contributing to the advancement of this emerging field.
Furthermore, the findings point to VAM’s enhancement to reduce the need for post-processing, so that a component can be used as-is. This observation is not particular to VAM, as other AM techniques require surface finishing or heat treatments to level performance against traditional manufacturing processes. In this case, the post-processing is driven by lowering production time, whereas in other cases, it is driven by the material’s performance.

Supplementary Materials

The following supporting information can be downloaded at: https://www.mdpi.com/article/10.3390/pr14111689/s1.

Author Contributions

J.L.-B.: Concept, writing, methodology, and formal analysis; N.O.-O.: Concept, writing, methodology, and software; S.P.-T.: Writing, concept, visualization, and formal analysis; F.D.-G.: Investigation, writing, data collection, and formal analysis; J.G.D.-R.: Writing, funding, project administration, and formal analysis. All authors have read and agreed to the published version of the manuscript.

Funding

This research received no external funding.

Data Availability Statement

The original data presented in the study are openly available at https://doi.org/10.6084/m9.figshare.32136613, accessed on 11 May 2026.

Acknowledgments

The authors thank A. Joya for his assistance in Flexsim usage.

Conflicts of Interest

The authors declare no conflicts of interest.

References

  1. Groover, M.P. Fundamentals of Modern Manufacturing; Wiley: Hoboken, NJ, USA, 2015; ISBN 978-1-118-98764-3. [Google Scholar]
  2. Correia, A.D.J.C.; Silva, L.S.; De Araújo, J.L.; Contador, J.C.; Contador, J.L.; Magalhães, G.H.D.; Prado, R.G.; Satyro, W.C.; Spinola, M.D.M. Implementation of Integrated Control Systems Projects in Companies Focused on Industry 4.0: Opportunities and Challenges in Brazil. Technologies 2026, 14, 78. [Google Scholar] [CrossRef]
  3. Felice, F.D.; Luca, C.D.; Petrillo, A.; Forcina, A.; Barrios, M.A.O.; Baffo, I. The Role of Digital Transformation in Manufacturing: Discrete Event Simulation to Reshape Industrial Landscapes. Appl. Sci. 2025, 15, 6140. [Google Scholar] [CrossRef]
  4. Lanzini, M.; Ferretti, I.; Zanoni, S. Towards the Implementation and Integration of a Digital Twin in a Discrete Manufacturing Context. Processes 2024, 12, 2384. [Google Scholar] [CrossRef]
  5. Al-zqebah, R.; Guertler, M.; Clemon, L. Powder Bed Fusion Factory Productivity Increases Using Discrete Event Simulation and Genetic Algorithm. Prod. Eng. 2025, 19, 29–45. [Google Scholar] [CrossRef]
  6. Kamali, A.H.; Moradi, M.; Goodarzian, F.; Ghasemi, P. A Discrete Event Simulation Method for Performance Analysis of an Additive Manufacturing in the Dental Clinic. Int. J. Adv. Manuf. Technol. 2022, 118, 2949–2979. [Google Scholar] [CrossRef]
  7. Al-zqebah, R.; Guertler, M.R.; Clemon, L.M. Productivity Improvements in Additive Manufacturing Using Discrete Event Simulation with a Genetic Algorithm. 2023. Available online: https://ssrn.com/abstract=4423013 (accessed on 22 March 2026).
  8. ISO/ASTM 52900; Additive Manufacturing—General Principles—Fundamentals and Vocabulary. ISO: Geneva, Switzerland, 2021.
  9. Um, J.; Rauch, M.; Hascoët, J.-Y.; Stroud, I. STEP-NC Compliant Process Planning of Additive Manufacturing: Remanufacturing. Int. J. Adv. Manuf. Technol. 2017, 88, 1215–1230. [Google Scholar] [CrossRef]
  10. Ahsan, N.; Habib, A.; Khoda, B. Geometric Analysis for Concurrent Process Optimization of AM. Procedia Manuf. 2016, 5, 974–988. [Google Scholar] [CrossRef]
  11. Isania, Z.; Casalino, G. Discrete Event Simulation of a Stereolithography Production Line. Oper. Res. Forum 2025, 6, 182. [Google Scholar] [CrossRef]
  12. Kelly, B.E.; Bhattacharya, I.; Heidari, H.; Shusteff, M.; Spadaccini, C.M.; Taylor, H.K. Volumetric Additive Manufacturing via Tomographic Reconstruction. Science 2019, 363, 1075–1079. [Google Scholar] [CrossRef]
  13. Bernal, P.N.; Delrot, P.; Loterie, D.; Li, Y.; Malda, J.; Moser, C.; Levato, R. Volumetric Bioprinting of Complex Living-Tissue Constructs within Seconds. Adv. Mater. 2019, 31, 1904209. [Google Scholar] [CrossRef]
  14. Bhattacharya, I.; Toombs, J.; Taylor, H. High Fidelity Volumetric Additive Manufacturing. Addit. Manuf. 2021, 47, 102299. [Google Scholar] [CrossRef]
  15. Toombs, J.T.; Luitz, M.; Cook, C.C.; Jenne, S.; Li, C.C.; Rapp, B.E.; Kotz-Helmer, F.; Taylor, H.K. Volumetric Additive Manufacturing of Silica Glass with Microscale Computed Axial Lithography. Science 2022, 376, 308–312. [Google Scholar] [CrossRef]
  16. Kollep, M.; Konstantinou, G.; Madrid-Wolff, J.; Boniface, A.; Hagelüken, L.; Sasikumar, P.V.W.; Blugan, G.; Delrot, P.; Loterie, D.; Brugger, J.; et al. Tomographic Volumetric Additive Manufacturing of Silicon Oxycarbide Ceramics. Adv. Eng. Mater. 2022, 24, 2101345. [Google Scholar] [CrossRef]
  17. Rodríguez-Pombo, L.; Xu, X.; Seijo-Rabina, A.; Ong, J.J.; Alvarez-Lorenzo, C.; Rial, C.; Nieto, D.; Gaisford, S.; Basit, A.W.; Goyanes, A. Volumetric 3D Printing for Rapid Production of Medicines. Addit. Manuf. 2022, 52, 102673. [Google Scholar] [CrossRef]
  18. Orth, A.; Webber, D.; Zhang, Y.; Sampson, K.L.; De Haan, H.W.; Lacelle, T.; Lam, R.; Solis, D.; Dayanandan, S.; Waddell, T.; et al. Deconvolution Volumetric Additive Manufacturing. Nat. Commun. 2023, 14, 4412. [Google Scholar] [CrossRef] [PubMed]
  19. Agrawal, P.; Zhuang, S.; Dreher, S.; Mitter, S.; Ahmed, D. SonoPrint: Acoustically Assisted Volumetric 3D Printing for Composites. Adv. Mater. 2024, 36, 2408374. [Google Scholar] [CrossRef] [PubMed]
  20. Cook, C.C.; Fong, E.J.; Schwartz, J.J.; Porcincula, D.H.; Kaczmarek, A.C.; Oakdale, J.S.; Moran, B.D.; Champley, K.M.; Rackson, C.M.; Muralidharan, A.; et al. Highly Tunable Thiol-Ene Photoresins for Volumetric Additive Manufacturing. Adv. Mater. 2020, 32, 2003376. [Google Scholar] [CrossRef]
  21. Whyte, D.J.; Doeven, E.H.; Sutti, A.; Kouzani, A.Z.; Adams, S.D. Volumetric Additive Manufacturing: A New Frontier in Layer-Less 3D Printing. Addit. Manuf. 2024, 84, 104094. [Google Scholar] [CrossRef]
  22. Weisgraber, T.H.; de Beer, M.P.; Huang, S.; Karnes, J.J.; Cook, C.C.; Shusteff, M. Virtual Volumetric Additive Manufacturing (VirtualVAM). Adv. Mater. Technol. 2023, 8, 2301054. [Google Scholar] [CrossRef]
  23. Somers, P.; Koch, S.; Kiefer, P.; Meretska, M.L.; Wegener, M. Holographic Multi-Photon 3D Laser Nanoprinting—At the Speed of Light: Opinion. Opt. Mater. Express 2024, 14, 2370. [Google Scholar] [CrossRef]
  24. Salajeghe, R.; Šeta, B.; Pellizzon, N.; Kruse, C.G.S.; Marla, D.; Islam, A.; Spangenberg, J. Numerical Modeling of Tomographic Volumetric Additive Manufacturing Based on Energy Threshold Method. Addit. Manuf. 2024, 96, 104552. [Google Scholar] [CrossRef]
  25. Hausladen, M.M.; Baca, E.; Nogales, K.A.; Appelhans, L.N.; Kaehr, B.; Hamel, C.M.; Leguizamon, S.C. Volumetric Additive Manufacturing of Dicyclopentadiene by Solid-State Photopolymerization. Adv. Sci. 2024, 11, 2402385. [Google Scholar] [CrossRef] [PubMed]
  26. Schwartz, J.J.; Porcincula, D.H.; Cook, C.C.; Fong, E.J.; Shusteff, M. Volumetric Additive Manufacturing of Shape Memory Polymers. Polym. Chem. 2022, 13, 1813–1817. [Google Scholar] [CrossRef]
  27. Skliutas, E.; Kasetaite, S.; Jonušauskas, L.; Ostrauskaite, J.; Malinauskas, M. Photosensitive Naturally Derived Resins toward Optical 3-D Printing. Opt. Eng. 2018, 57, 041412. [Google Scholar] [CrossRef]
  28. Voet, V.S.D.; Guit, J.; Loos, K. Sustainable Photopolymers in 3D Printing: A Review on Biobased, Biodegradable, and Recyclable Alternatives. Macromol. Rapid Commun. 2021, 42, 2000475. [Google Scholar] [CrossRef]
  29. Machado, T.O.; Stubbs, C.J.; Chiaradia, V.; Alraddadi, M.A.; Brandolese, A.; Worch, J.C.; Dove, A.P. A Renewably Sourced, Circular Photopolymer Resin for Additive Manufacturing. Nature 2024, 629, 1069–1074. [Google Scholar] [CrossRef]
  30. Onderková, A.; M. Kalaskar, D. 3D Bioprinting for Auricular Reconstruction: A Review and Future Perspectives. Int. J. Bioprinting 2023, 9, 0898. [Google Scholar] [CrossRef]
  31. Kade, J.C. 3D Printed Structures with Biomimicry Mechanical Characteristics for Auricular Cartilage Growth. Ph.D. Thesis, University of Wollongong, Wollongong, Australia, 2024. [Google Scholar]
  32. Levato, R.; Webb, W.R.; Otto, I.A.; Mensinga, A.; Zhang, Y.; van Rijen, M.; van Weeren, R.; Khan, I.M.; Malda, J. The Bio in the Ink: Cartilage Regeneration with Bioprintable Hydrogels and Articular Cartilage-Derived Progenitor Cells. Acta Biomater. 2017, 61, 41–53. [Google Scholar] [CrossRef] [PubMed]
  33. Wolfel, A.; Johnbosco, C.; Anspach, A.; Meteling, M.; Olijve, J.; König, N.F.; Leijten, J. Bioxolography Using Diphenyliodonium Chloride and N-Vinylpyrrolidone Enables Rapid High-Resolution Volumetric 3D Printing of Spatially Encoded Living Matter. Adv. Mater. 2025, 37, 2501052. [Google Scholar] [CrossRef]
  34. Webber, D.; Zhang, Y.; Sampson, K.L.; Picard, M.; Lacelle, T.; Paquet, C.; Boisvert, J.; Orth, A. Micro-Optics Fabrication Using Blurred Tomography. Optica 2024, 11, 665–672. [Google Scholar] [CrossRef]
  35. Herder, M.; Garmshausen, Y.; Tauber, M.-P.C.; Arzhangnia, Y.; Reuter, M. Direct 3D Printing of Optical Elements with Xolography. In Proceedings of the Advanced Fabrication Technologies for Micro/Nano Optics and Photonics XVIII; SPIE: Bellingham, WA, USA, 2025; Volume 13381, pp. 68–76. [Google Scholar]
  36. Xolo Xube2—Xolo 2025. Available online: https://xolo3d.com/xube/ (accessed on 22 March 2026).
  37. Toombs, J.T.; Li, C.C.; Taylor, H. Roll-to-Roll Tomographic Volumetric Additive Manufacturing for Continuous Production of Microstructures on Long Flexible Substrates. In Proceedings of the Advanced Fabrication Technologies for Micro/Nano Optics and Photonics XVII; SPIE: Bellingham, WA, USA, 2024; Volume PC12898, p. PC128980Q. [Google Scholar]
  38. Wang, X.; Ma, Y.; Niu, Y.; Xiong, B.; Zhang, A.; Zhang, G.; Chen, Y.; Wei, W.; Fang, L.; Wu, J.; et al. Sub-Second Volumetric 3D Printing by Synthesis of Holographic Light Fields. Nature 2026, 650, 882–890. [Google Scholar] [CrossRef] [PubMed]
  39. Hopp, W.J.; Spearman, M.L. Factory Physics: 3rd Edition; Waveland Press: Long Grove, IL, USA, 2011; ISBN 978-1-4786-0904-9. [Google Scholar]
  40. Obaton, A.-F.; Lê, M.-Q.; Prezza, V.; Marlot, D.; Delvart, P.; Huskic, A.; Senck, S.; Mahé, E.; Cayron, C. Investigation of New Volumetric Non-Destructive Techniques to Characterise Additive Manufacturing Parts. Weld. World 2018, 62, 1049–1057. [Google Scholar] [CrossRef]
  41. Myers, L.A.; Schwartz, J.J.; De Beer, M.P.; Walton, R.L.; Porcincula, D.H. Development of Transparent, Particle-Loaded Photoresins for Volumetric Additive Manufacturing of Silica Glass. J. Polym. Sci. 2024, 62, 2683–2691. [Google Scholar] [CrossRef]
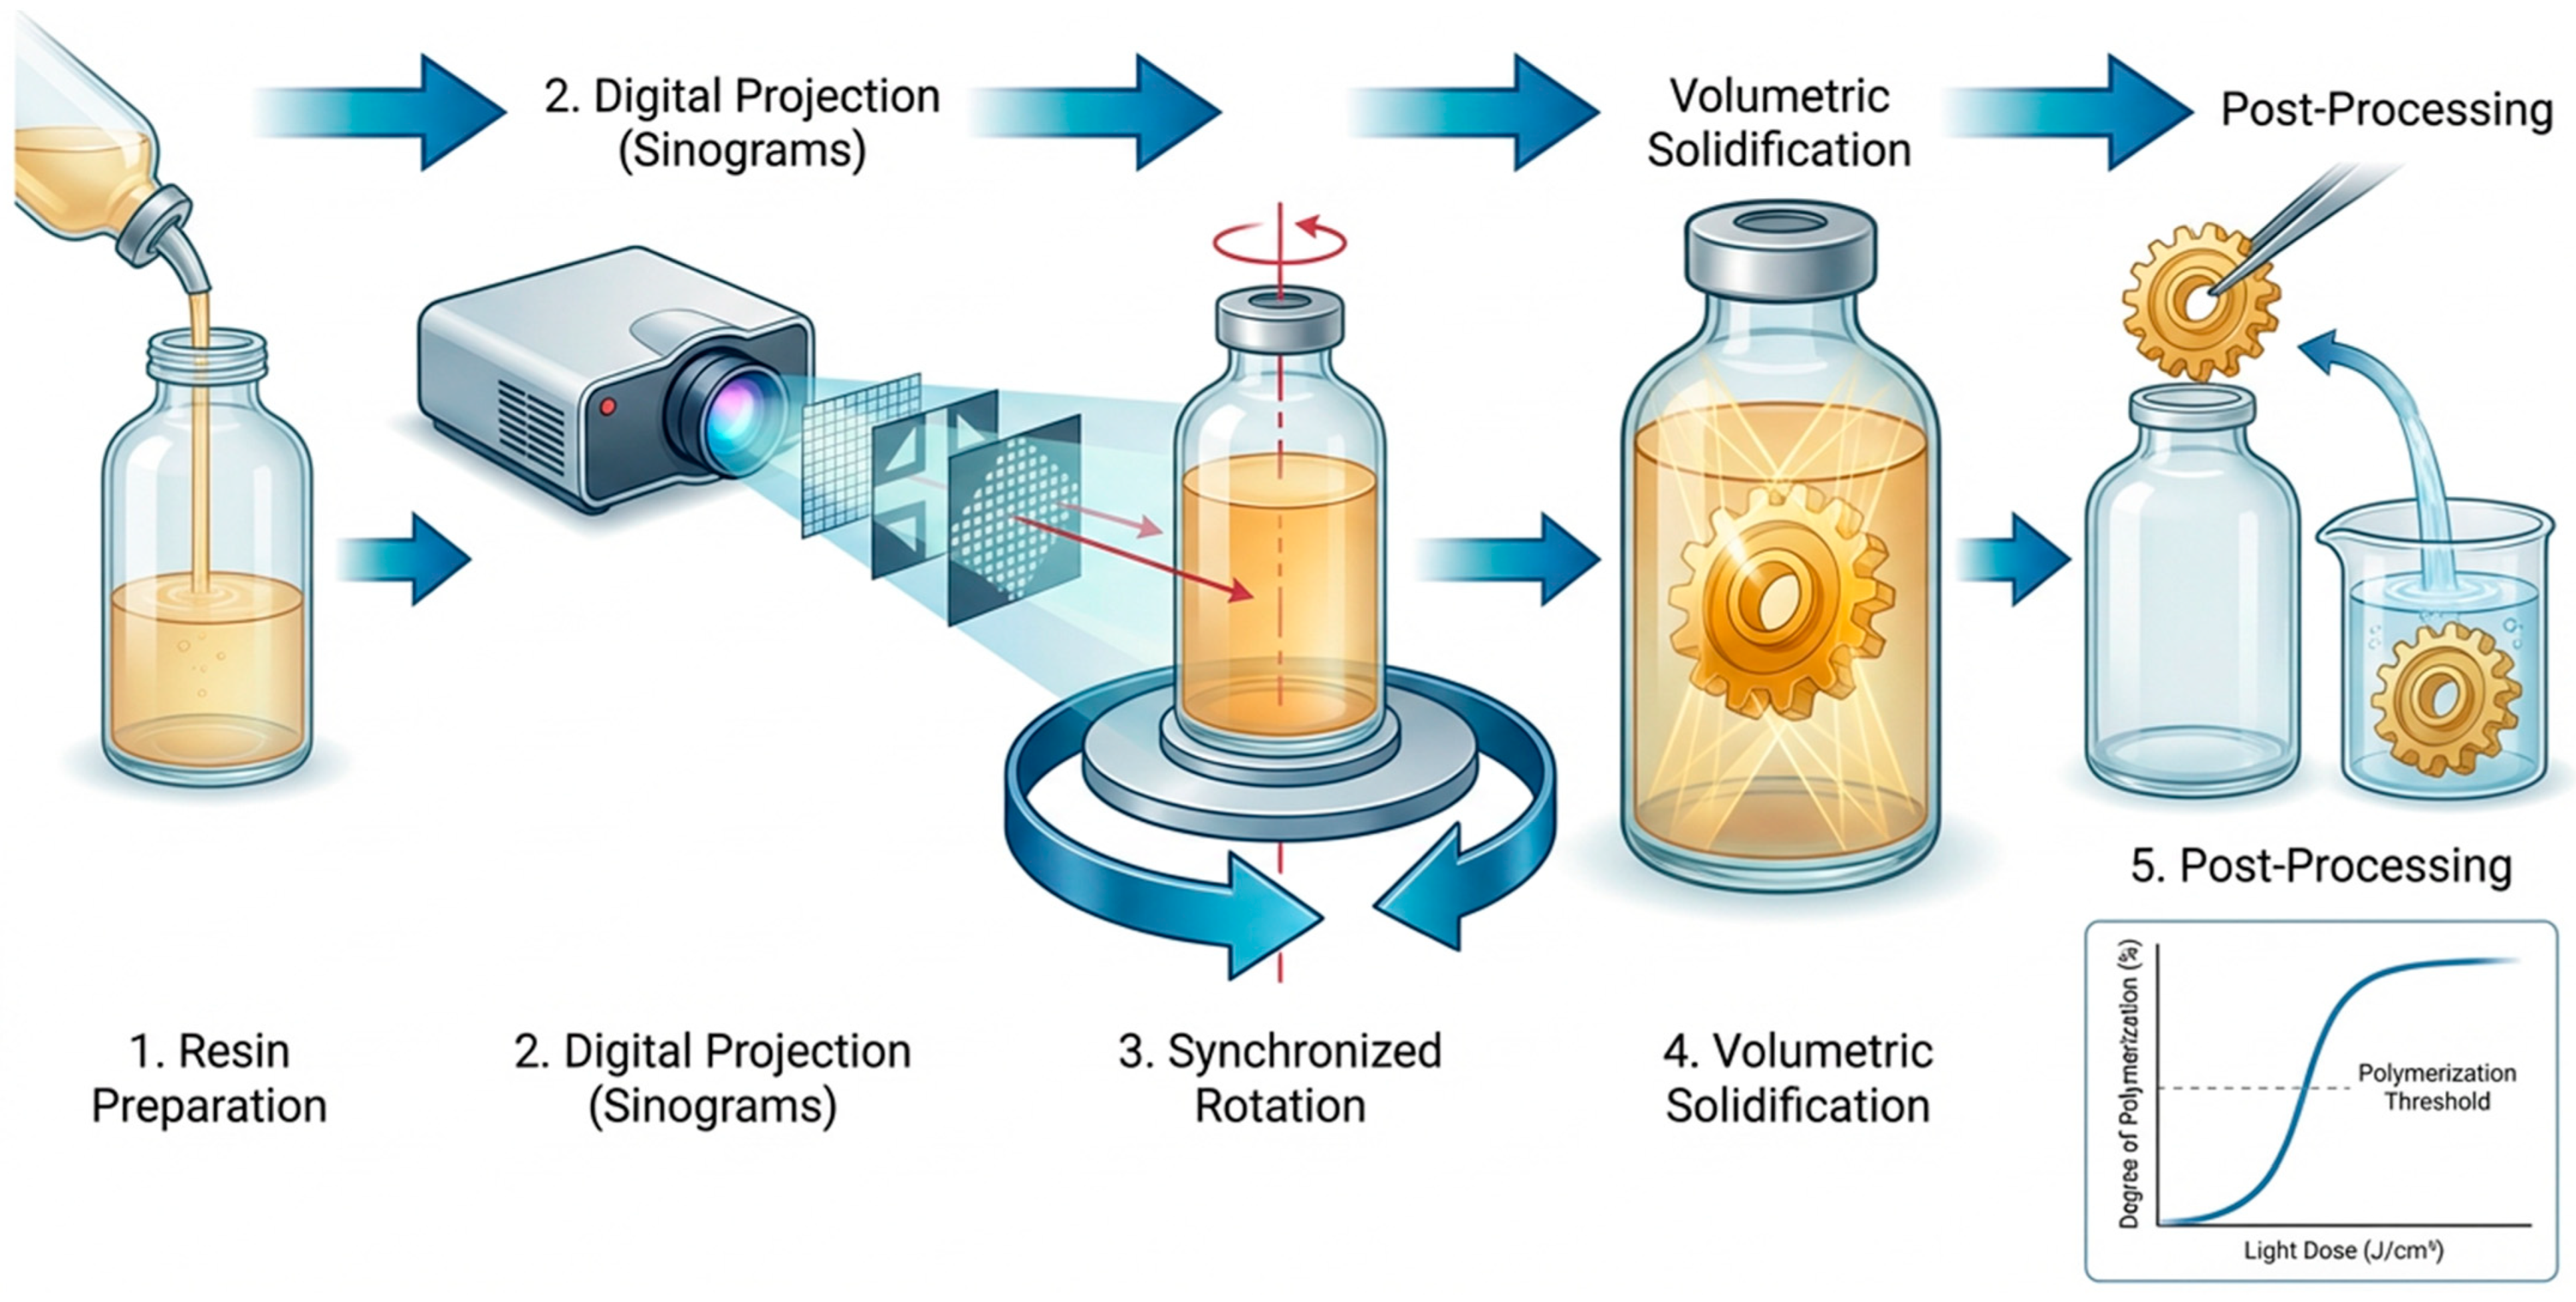
Figure 1. Schematics of the CAL 3D printing process.
Processes 14 01689 g001
Figure 2. Biofabrication process at a hospital point-of-care.
Processes 14 01689 g002
Figure 3. Optical lens fabrication: volumetric additive manufacturing (xolography) process.
Processes 14 01689 g003
Figure 4. Atrium location week 10.
Processes 14 01689 g004
Figure 5. Location atriums week 10, scenario 2.
Processes 14 01689 g005
Figure 6. Resource usage week 10, atrium bioprinting.
Processes 14 01689 g006
Figure 7. Scenario 1 for lens manufacturing.
Processes 14 01689 g007
Figure 8. Scenario 2: lens manufacturing.
Processes 14 01689 g008
Figure 9. Resource usage and lens manufacturing.
Processes 14 01689 g009
Figure 10. Percentage changes relative to the baseline scenario 1.
Processes 14 01689 g010
Figure 11. Percentage changes relative to the baseline scenario 2.
Processes 14 01689 g011
Table 1. Printing parameters of experimental studies.
Part DescriptionSizeMaterial and Experimental SetupRef
The Rodin sculpture, The ThinkerHeight: 40 mmGelatin methacrylate (GeIMA) hydrogel material. Printing time (min): 0.85.[12]
Nefertiti bustHeight: 13 mm
With: 13 mm
di-pentaerythritol pentaacrylate resin (PETA).
A rotating glass vial. A light source (Si cube’s SM9 with 405 nm wavelength). An acoustic chamber. Intensity of ≈0.1–2.0 mW cm−2. Printing time: 2 min.
[19]
Stanford BunnyHeight: 12 mm With: 20 mmOptical Scattering Tomography: The print vial is illuminated from above with an approximately collimated red LED source[18]
BenchyHeight:13 mm Width: 15 mmA mixture of diurethane dimethacrylate (DUDMA) with poly(ethylene glycol) diacrylate (Mn = 700 g/mol, PEGDA 700) in an 8:2 (wt) ratio. Viscosity: 1100 cp. The photoinitiator system comprised camphorquinone (CQ) and ethyl 4-dimethylaminobenzoate (EDAB). The print was soaked in isopropyl alcohol (IPA) for 10–20 min. After drying at room temperature, it was post-cured using 405 nm light for 120 min at 60 °C in a Formlabs Form Cure. 20°/s. Printing time (min): 5.1, with 17 rotations.[18]
Human auricle modelHeight: 12 mm
Scaled 1×:
0.15 cm3
Scaled 2×: 1.23 cm3
Scaled 3×: 4.14 cm3
volume variation of 5.71 ± 2.31%
Hydrogel gel MA (80% DoF) used as a 10% w/v solution in PBS. As photoinitiator, lithium phenyl(2,4,6-trimethylbenzoyl) phosphinate (LAP, Tokyo Chemical Industry, Tokyo, Japan) was dissolved in PBS at 0.037% (w/v) in the hydrogel to induce a photocrosslinking reaction. Volumetric Bioprinting (VBP): Six 405 nm laser diodes D with a 6.4 W combined power (HL40033G, Ushio, Tokyo, Japan) were collimated and coupled by lenses in a square fiber F. The output of the fiber was then magnified and projected onto a digital micromirror device (DMD) via an aspheric lens and a set of orthogonal cylindrical lenses. The surface of the DMD was imaged via a 4f-system (L5: f = 150 mm lens and L6: f = 250 mm lens) into a Ø16.75 mm cylindrical glass vial (V) containing the photopolymer (PR). Printing time (min): 0.38.[13]
A ballet dancer. A complex cube and ring structureDancer:
height: 20 mm
Width: 10 mm
Cube: 15 × 15 × 15 mm
Ring: height: 20 mm
Width: 15 mm
Poly(ethylene glycol) diacrylate (Mn 250) (TEG-DA),
Tris [2-(acryloyloxy)ethyl] isocyanurate (TAE-ICN), 1,3,5-triallyl-1,3,5-triazine-2,4,6(1H,3H,5H)-trione (TA-ICN), 2-methyl-4′-(methylthio)-2-morpholinopropiophenone or Irgacure 907, and TEMPO
Sigma-Aldrich, and Tris [2-(3-mercaptopropionyloxy)
ethyl] isocyanurate (TME-ICN). A 405 nm LED light engine with a maximum intensity of 55 mW cm−2 was used.
[20]
Table 2. Operating parameters of the VAM system.
ParameterCase 1 (Atrium-Bioprinting)Case 2 (Lens Fabrication)Source/Justification
Process times
Setup Time (per job)45 min15 minInformed estimation: includes sterile bio-ink preparation, cell management, and calibration (case 1) versus filtered/degassed resin loading and projection selection (case 2).
Print Time7.5 min0.75 min (45 s)Calculation: Part height (~15 mm)/Conservative speed of 2 mm/min [35]. Commercial speed is used instead of Bernal et al.’s [13] experimental time for congruence with the selected hardware.
Cleaning Time (per piece)10 min8 minReported Estimation (Sterile PBS Lavage) [35]; (Multi-stage protocol: 5 min TPM + 0.5 min ethanol + 2.5 min ethanol +TPO-L).
Post-Curing and Finishing Time5 min35 minReported estimation (final UV): [35] (5 min UV + 15 min oven + 15 min bleaching). This could be a technical bottleneck of the system.
Maturation Time10,080 min (7 days)N/AIt is modeled as a biological inventory buffer and is the main bottleneck of the system [13,33]. However, in vivo maturation may be possible instead of in vitro.
Inspection Time (per part)30 min60 minInformed Guess: Feasibility/sterility sampling vs. full optical metrology (AFM, interferometry, and MTF), which is the final stage bottleneck.
Resources (Initial Status)
Resins/
Bioinks
xoloGelMA with the DCPI 5002 photoinitiator (activation: 375 nm, t½ = 4.1 s), both from Xolo3d GmbH, Berlin, Germany.xoloClear with photoinitiator DCPI 2001, (375 nm, t½ = 2.3 s), both from Xolo3d GmbH, Berlin, Germany.[37]
Printers1 Xube22 Xube2Starting point for the “as-is” diagnosis. This will vary as a factor in the sensitivity analysis.
Number of Post-Processing Stations1 biosafety cabin;
1 PBS washing module;
1 infusion bioreactor;
answer: 1 cleaning station (3 bathrooms);
1 convection oven;
1 UV curing chamber (inert);
1 metrology station (AFM/interferometer)
Starting point for the “as-is” diagnosis. It will be varied as a factor in sensitivity analysis
Number of Operators1 lab technician1 production technicianStarting point for the “as-is” diagnosis. This will vary as a factor in Step 5.
Costs and quality
Quality CriteriaFidelity vol. ≤ 5.71%; Viability > 85%Roughness RMS < 1 nmAcceptance metrics derived from the literature [13,33].
Defect Rate (per stage)2% (Washing) + 1% (Post-curing) + 2% (Sterility)1% (Cleaning) + 1% (Post-curing) + 1.5% (Metrology)Initial conservative assumption for the base model. A higher rate is assumed in the biological process because of its variability. Can be used as a variable in a sensitivity analysis.
Resin Cost (€/mL)~7.20 €~5.00 €Calculations were based on listed prices [36], assuming 500 mL per kit. The cost includes that of the base resin and the corresponding photoinitiator.
Table 3. Summary of KPIs for both printing scenarios.
MeanStdCI 95% (Low–High)
Atrium Case1—Throughput25.804.94(23.95–27.64)
Atrium Case1—Average Cycle time (days) 7.3040.097(7.267–7.340)
Atrium Case2—Throughput25.804.94(23.95–27.64)
Atrium Case2—Average Cycle time (days)7.3040.097(7.267–7.340)
Lens Case 1—Throughput15.00015.00
Lens Case 1—Average Cycle time (min)704.2292.01(669.86–738.57)
Lens Case 2—Throughput15.00015.00
Lens Case 2—Average Cycle time (min)704.2292.01(669.86–738.57)
Disclaimer/Publisher’s Note: The statements, opinions and data contained in all publications are solely those of the individual author(s) and contributor(s) and not of MDPI and/or the editor(s). MDPI and/or the editor(s) disclaim responsibility for any injury to people or property resulting from any ideas, methods, instructions or products referred to in the content.