


Abstract
Xylitol is a leading low-calorie sugar alcohol worldwide. Industrial production efficiency has become crucial given the increasing global demand. The catalytic hydrogenation of xylose to produce xylitol is a leading method. In this study, xylitol production using a Raney nickel catalyst was optimized in a pressurized batch reactor. The catalyst amount, xylose concentration, hydrogen pressure, and temperature were used as the process variables, and the maximum yield (%) was determined. The experimental design, created using a central composite design (CCD), was optimized using Response Surface Methodology (RSM), and the obtained values were evaluated using ANOVA. The linear regression model was found to be statistically significant. The linear model indicated that temperature had no effect on the model. The optimal conditions determined by the RSM were 40 g of catalyst, 25% xylose, and 60 bar at 400 rpm stirring. The yield was 86.61%, which is quite close to the predicted value of 87.2557%, demonstrating the accuracy of the model. The product was analyzed using HPLC, XRD, DSC, TGA, and ICP-MS to confirm product quality. Under these optimized chemical conditions, increasing the stirring speed to 800 rpm as a post-optimization step led to a further increase in yield up to 98.01%, indicating the presence of mass transfer limitations at lower mixing intensities.
1. Introduction
Food technology continues to develop constantly to meet the growing needs of humanity, and new technologies are needed in the field of food [1]. One of the areas where technological advancements are most noticeable is the sugar industry, which has been used by humanity since ancient times and is a highly traded commodity [2]. The sugar industry and technology have advanced to such a level that low-calorie sugars have become increasingly popular, owing to their anti-cariogenic properties and low-calorie content. Low-calorie sweetener selection is influenced not only by the sweetness profile but also by multiple criteria, including health impact, caloric value, and technological functionality [3]. Xylitol is a high-value polyol widely used in food, pharmaceutical, and oral health applications because of its low glycemic index, non-cariogenic properties, and sweetness comparable to sucrose [4]. In recent years, xylitol has gained considerable attention as a low-calorie sugar alternative because of its approximately 40% lower caloric value than sucrose, its glycemic index, and beneficial applications in food, pharmaceutical, and oral care formulations [5,6]. In addition to its role as a sugar substitute, xylitol has attracted increasing industrial interest owing to its physiological compatibility and broad applicability in functional product formulations [7]. Industrial xylitol production is mainly based on the catalytic hydrogenation of xylose, in which the aldehyde group of xylose is reduced to a sugar alcohol under hydrogen pressure in the presence of metal catalysts [7,8]. Nickel-based catalysts are widely used because of their high activity, commercial availability, and economic feasibility. The production of xylitol via catalytic hydrogenation is highly sensitive to process parameters such as catalyst load, substrate concentration, hydrogen pressure, and reaction temperature [4,9]. Small changes in the parameters can affect both xylose conversion and xylitol selectivity, as well as the formation of secondary products such as arabitol. However, excessive substrate concentrations can lead to diffusion limitations. High temperatures can accelerate side reactions and reduce the product’s purity [10].
Previous studies have demonstrated that catalyst load directly influences the accessible active surface area and reaction kinetics. Hydrogen pressure dictates the dissolved hydrogen concentration and affects the catalytic reduction efficiency. The temperature also affects the transfer of hydrogen and the creation of competing byproducts. Many studies have looked at the effects of individual parameters, but there are few studies that look at how to optimize reactor-scale catalytic hydrogenation simultaneously while keeping batch conditions under control. This is particularly true for systems that combine statistical optimization with product validation after the reaction [11,12].
The Response Surface Methodology has become one of the most effective approaches for the analysis of multivariate process systems. It allows the evaluation of both individual and combined factor effects, while minimizing the experimental burden [13,14]. In catalytic sugar hydrogenation, response surface modeling provides not only the optimum operating conditions but also a quantitative understanding of the dominant process variables. Statistical optimization alone may be insufficient unless the predicted optimum is experimentally validated [15,16].
Despite the extensive literature on the catalytic hydrogenation of xylose to xylitol, most studies have primarily focused on catalyst development or isolated kinetic investigations, often lacking an integrated approach that combines process optimization with comprehensive product validation. In this context, this study introduces a unified framework that integrates statistical optimization (RSM), multi-technique product characterization (HPLC, DSC, XRD, TGA, and ICP-MS), and post-optimization hydrodynamic evaluation. In particular, the effect of stirring speed was systematically examined beyond the optimization stage, revealing the mass transfer limitations and their influence on the process performance.
Although statistical optimization has been reported in previous studies, such approaches are often limited to specific catalytic systems or alternative hydrogenation pathways, and are rarely combined with detailed product verification. In contrast, this study coupled response surface-based optimization under realistic batch reactor conditions with experimental validation and secondary multivariate analysis (PCA). This integrated strategy not only enables reliable estimation of the optimum yield but also provides deeper insight into the interactions between process variables, contributing to a more comprehensive understanding of process behavior and its potential for scale-up [17,18].
This study aimed to optimize the production of xylitol from xylose using catalytic hydrogenation in a 1 L high-pressure batch reactor under controlled operating conditions. Four key variables (catalyst amount, xylose concentration, hydrogen pressure, and reaction temperature) were investigated via a central complex experimental design (CCD), and RSM optimization and model evaluation were performed using ANOVA-based regression analysis. In addition to numerical optimization, chromatographic, thermal, crystallographic, and elemental analyses were performed to validate product quality under optimized conditions. Furthermore, a secondary multivariate evaluation was conducted to provide a deeper interpretation of the relationships between process variables. This integrated approach offers a viable framework for increasing the xylitol production efficiency under scalable catalytic hydrogenation conditions.
2. Materials and Methods
2.1. Materials
Xylose (white crystalline powder) was obtained from Polifar Group Limited, Nanjing, China, and was used as the main substrate for catalytic hydrogenation. Activated nickel catalyst KALCAT™ 6104 (92% Ni, molybdenum-promoted) was supplied by Evonik Operations GmbH, Essen, Germany, and used as the hydrogenation catalyst. The catalyst was used as received from the supplier, without further particle size modification. Hydrogen gas with 99.999% purity was used in all reduction experiments. Ultrapure water produced in the laboratory purification system was used for solution preparation, dilution, and resin washing, whereas all analytical-grade chemicals were used without further purification. The strong-base anion exchange resin Dowex 22 (AmberLite™ FPA22 Cl) and the cation exchange resin Dowex 88 were obtained from DuPont, Wilmington, DE, USA, for post-reaction purification. The quantitative determination of xylose and xylitol was performed using external analytical standards and analyzed using a Shimadzu Nexera HPLC (Shimadzu Corporation, Kyoto, Japan) equipped with a CarboSep Coregel-87C Ca column (Concise Separations, San Jose, CA, USA). Certified xylose and xylitol analytical standards (≥99%) were used for calibration curve preparation.
2.2. Catalytic Hydrogenation Procedure
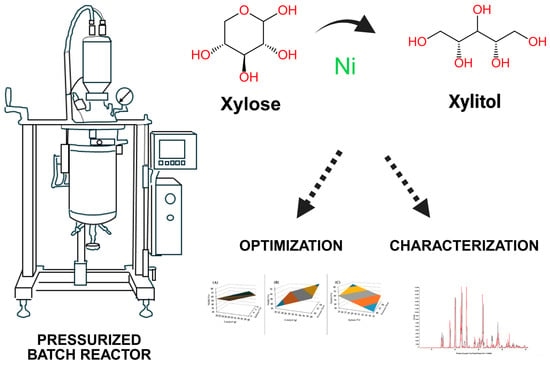
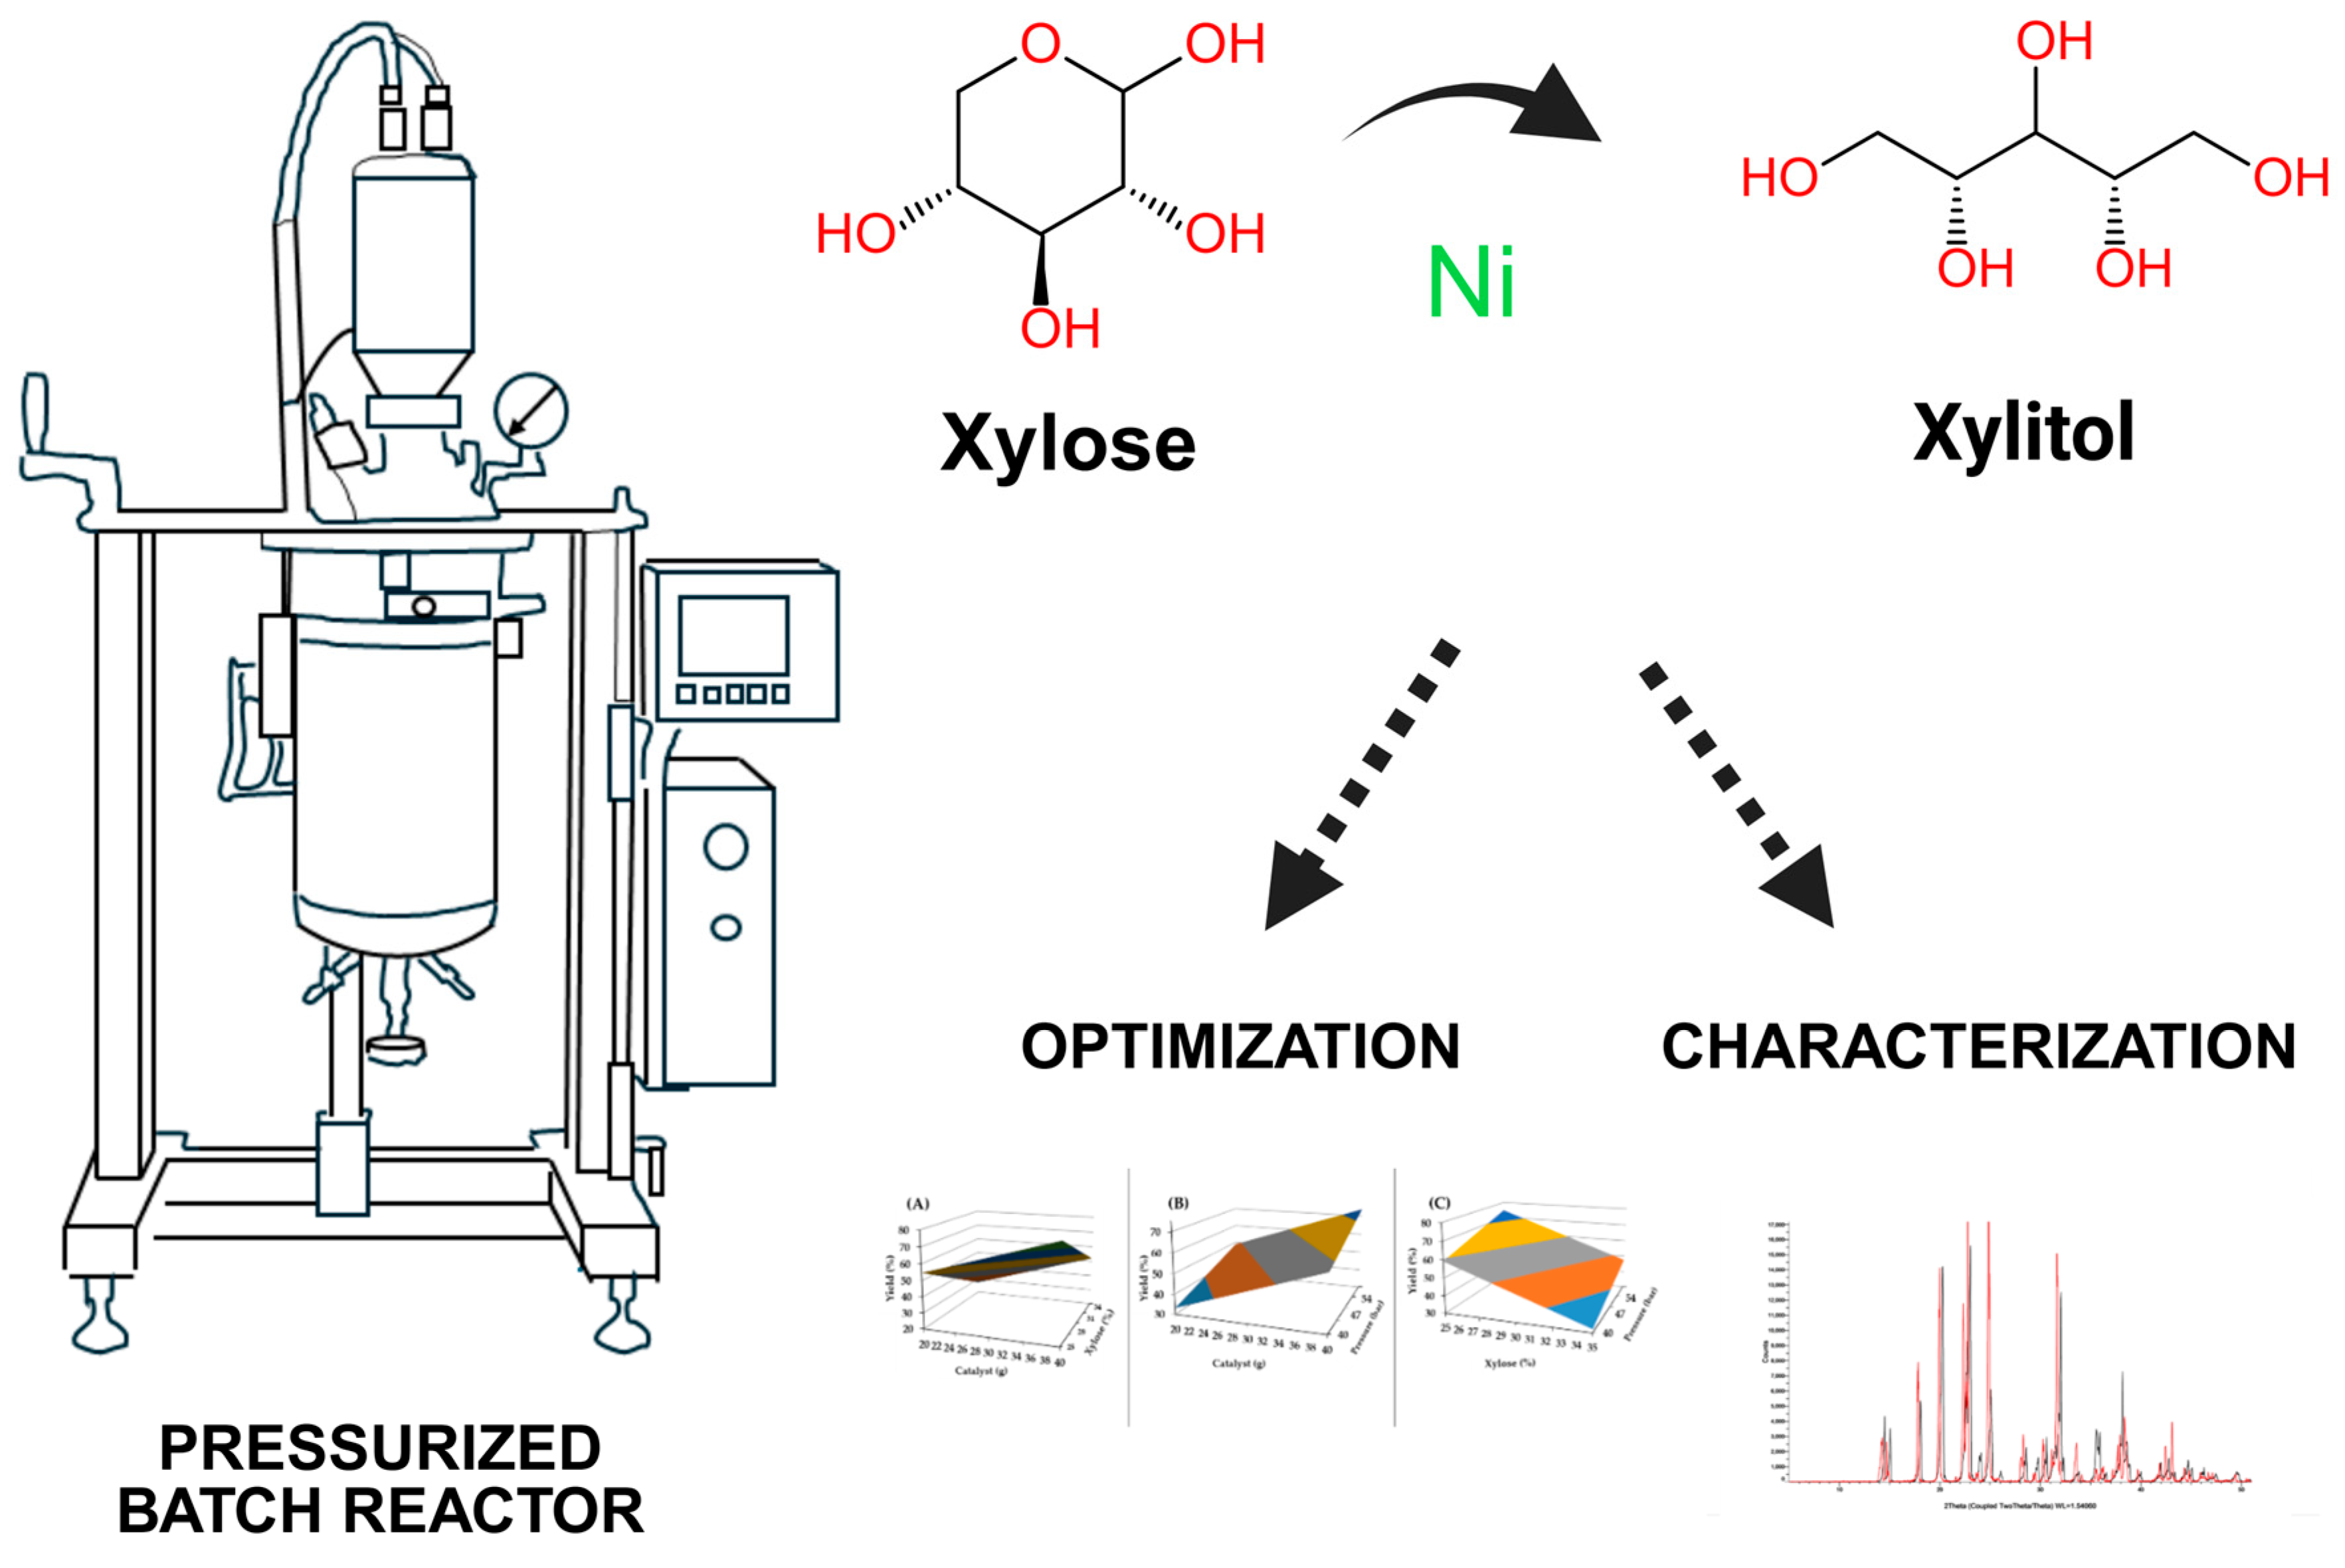
The production of xylitol from xylose was carried out in a 1 L high-pressure batch reactor (Büchi Versoclave Type 3, Büchi Labortechnik AG, Flawil, Switzerland) equipped with a marine-type impeller using catalytic hydrogenation under controlled temperature and pressure conditions (Figure 1). Xylose solutions were adjusted to pH 7.5 at concentrations of 25–35% (w/w). In each experiment, 500 g of reaction mixture containing xylose solution and Raney nickel catalyst (20–40 g) was loaded into the reactor, corresponding to approximately 50% of the reactor’s working volume. After inertification with nitrogen, hydrogen gas was introduced into the reactor until a pressure of 40–60 bar was achieved. Hydrogen was introduced in batch mode. The hydrogenation reaction was performed in batch mode at a constant stirring speed of 400 rpm. The reaction time for xylose conversion and xylitol formation was fixed at 60 min in all experiments. The stirring speed was increased to 800 rpm to investigate the effects of stirring. The product was filtered through 11 µm filter paper to remove catalyst particles. Ion exchange purification was performed using strong cationic and anionic resins to remove impurities. The purified solution was concentrated to approximately 65 °Brix under vacuum at 70 °C before crystallization. Crystallization was carried out without seed addition, with gentle stirring (50 rpm) and controlled cooling at a rate of 5 °C/h between 70 and 20 °C. The resulting crystals were separated by centrifugation and dried at 63 °C in a laboratory-type oven (Memmert GmbH, Schwabach, Germany) until the moisture content reached ~ 1.3%. The samples were withdrawn at the end of the reaction for analysis. All experiments were performed in triplicate.
Figure 1.
Schematic representation of the experimental design, including a hand-drawn illustration of the laboratory-scale high-pressure batch reactor used in this study, catalytic conversion of xylose to xylitol, optimization, and characterization steps. The reactor illustration was author-generated, whereas the remaining graphical elements were prepared using BioRender.com under publishing license.
2.3. Experimental Design and Process Variables
A response surface experimental design was used to evaluate the effects of key catalytic hydrogenation variables on xylitol production. Four independent process variables were selected: catalyst loading (20–40 g), xylose concentration (25–35% w/w), reaction pressure (40–60 bar), and reaction temperature (100–140 °C). A central composite design (CCD) was employed to investigate the effects of these variables on production. Xylitol yield was used as the response variable. During all experiments, the pH, catalyst type, stirring speed (400 rpm), and reaction time (60 min) were maintained constant to isolate the effects of the selected independent factors.
2.4. Response Surface Methodology (RSM)
The experimental data were analyzed using SigmaXL software trial version 11.03 (SigmaXL Inc., Toronto, ON, Canada). Model fitting and statistical evaluation were performed using analysis of variance (ANOVA). Different regression structures were examined. The linear model was selected as the most appropriate model based on model significance and residual behavior. The statistical significance of model terms was evaluated at a confidence level of 95%, and terms with p < 0.05 were considered significant. The experimental matrix generated for the CCD model is listed in Table 1.
Table 1.
The experimental matrix generated for the CCD model. The statistical significance of model terms was evaluated at a confidence level of 95%, and terms with p < 0.05 were considered significant.
2.5. Numerical Optimization Strategy
Numerical optimization was performed based on a regression model by maximizing the xylitol yield within the experimental factor limits. The optimum operating point corresponded to the upper catalyst level, lower xylose concentration, and upper pressure level, according to the coefficient’s direction and predicted response.
2.6. Product Characterization
2.6.1. HPLC Analysis
Xylitol, residual xylose, and arabitol concentrations were quantified using high-performance liquid chromatography (HPLC) on a Shimadzu Nexera HPLC (Shimadzu Corporation, Kyoto, Japan) equipped with a refractive index detector (RID). A CHO-99-9860 CarboSep Coregel-87C Ca column (7.8 × 300 mm; Concise Separations, San Jose, CA, USA) was used. Ultrapure water was used as the mobile phase at a flow rate of 0.5 mL/min under isocratic conditions. The column’s temperature was maintained at 80 °C. The RID temperature was maintained constant. Samples were filtered through 0.45 µm syringe filters, and 20 µL aliquots were injected into the system. Quantification was performed using external calibration curves prepared from analytical standards of xylose, xylitol, and arabitol. Each sample was analyzed in triplicate. Chromatographic peak areas were processed using the instrument’s software. The retention times and peak identification were confirmed using standard solutions [19].
2.6.2. DSC Analysis
The thermal properties of xylitol powder were evaluated using differential scanning calorimetry (DSC, Mettler Toledo DSC 1 Star System, Mettler-Toledo AG, Greifensee, Switzerland). A 5.0 mg sample was placed in an aluminum pan. Thermal measurements were carried out over a temperature range of 20–200 °C at a heating rate of 8 °C/min. The melting temperature and other thermal transitions were determined using the instrument’s software. Each sample was analyzed in triplicate. Mean values were used to evaluate thermal stability. Analyses were performed under a nitrogen atmosphere to prevent oxidative effects [20].
2.6.3. Thermogravimetric Analysis (TGA)
Thermogravimetric analysis (TGA) was performed using a Mettler Toledo TGA STAR System thermal analyzer (Mettler-Toledo AG, Greifensee, Switzerland) under a nitrogen atmosphere. Approximately 5.5 mg of xylitol sample was placed in the sample pan and heated from 25 to 600 °C at a heating rate of 20 °C min−1 under a nitrogen flow of 50 mL min−1. The mass loss behavior and thermal decomposition characteristics were recorded continuously as a function of the temperature. A derivative thermogravimetric (DTG) curve was obtained from the first derivative of the TG curve to determine the maximum decomposition rate and stages. Thermal analysis was used to evaluate the thermal stability of the obtained xylitol sample and investigate whether the volatile species contributed to the DSC melting transition [21].
2.6.4. XRD Analysis
The crystalline structure, phase composition, and purity of powdered xylitol were evaluated using X-ray diffraction (XRD, Bruker D2 Phaser, Bruker AXS GmbH, Karlsruhe, Germany). The samples were evenly distributed on a glass plate for analysis. Diffraction measurements were performed over a 2θ range of 5–50° using Cu Kα radiation (λ = 1.5484 Å), with an operating voltage of 30 kV and current of 10 mA. The scan was conducted in 2268 steps with a counting time of 0.5 s per step. Diffraction patterns were analyzed using the instrument’s software. Characteristic peaks were compared with the literature data to identify the crystalline phases. Each sample was measured in triplicate. The average diffraction profiles were used for interpretation [22].
2.6.5. Determination of Residual Nickel by ICP-MS
The residual nickel content in xylitol samples obtained after purification was determined using a Shimadzu ICPMS-2030 instrument (Shimadzu Corporation, Kyoto, Japan). Prior to analysis, samples were dried at 60 °C for 24 h in a laboratory-type oven. Approximately 0.5 g of dried sample was weighed and transferred into digestion vessels, followed by the addition of 4.0 mL HNO3 and 1.0 mL H2O2. Microwave digestion was performed using an ETHOS EASY system (Milestone Srl, Sorisole, Italy) under stepwise temperature conditions up to 200 °C according to the digestion program. After digestion, the solutions were transferred to polypropylene tubes and diluted to 25 mL with ultrapure water. Serial dilution was applied four times prior to instrumental measurements. ICP-MS analysis was performed under the operating conditions of 1.2 kW RF power, 0.7 L/min Ar carrier gas flow, 8.0 L/min plasma gas flow, and 6.0 mm sampling depth. Ni concentrations were determined based on instrument calibration under the specified analytical conditions. Ni quantification was performed by external calibration with certified standard solutions [23].
2.7. Secondary Data Evaluation
Principal component analysis (PCA) was conducted to evaluate the relationships among the process variables and secondary multivariate data analysis. The amount of catalyst, xylose concentration, pressure, and xylitol yield were included in the analysis. All variables were standardized to eliminate scale differences. Principal components were extracted based on the variance structure and score/loading distributions. The PCA results were used to evaluate the interpretation of the experimental trends obtained from the RSM. All PCA calculations were performed using XLSTAT trial version (Addinsoft, New York, NY, USA) [24].
3. Results
3.1. RSM Regression Model
A hierarchical stepwise multiple regression model with forward and backward variable selection was applied within the scope of the response surface optimization. The analysis revealed that the model exhibited linear characteristics. The analysis of variance showed that the model was statistically significant (F = 16.33, p < 0.0001). The highest statistical effect on xylitol yield was found for xylose concentration (p = 0.0001). Catalyst loading (p = 0.0002) and hydrogen pressure (p = 0.0108) were the most influential factors. The regression coefficients showed that catalyst loading and pressure positively affected the reaction yield. The xylose concentration showed a negative effect in the model formula. The study revealed that an increase in substrate concentration under reactor conditions negatively affected xylitol yield, owing to the negative coefficient of xylose concentration (−2.7283). Mass transfer limitations due to increased viscosity and reduced hydrogen access to active sites on the catalyst surface may be related to the negative effect of substrate increase. The insignificant lack-of-fit value (p = 0.1628) is another important factor that indicates that the selected regression model is significant. The lack-of-fit value (p = 0.1628) showed an acceptable level of agreement between the model predictions and experimental results. The Durbin–Watson statistic (2.20) revealed no significant autocorrelation in the residual values. The Breusch–Pagan test showed that error variance was constant (p = 0.4829). A variance inflation factor of 1.00 confirmed the absence of a multicollinearity problem among the independent variables. The Adequate Precision value of 5.25 indicated that the model has a sufficient signal-to-noise ratio. The actual xylitol yields obtained under each experimental condition, within the scope of the RSM experimental matrix, are listed in Table 2. The closeness between the experimental results and predictions reveals that the regression model explains the process behavior with sufficient accuracy. The regression model describing the effects of the independent variables on xylitol yield is as follows:
where A represents the catalyst amount, B represents the xylose concentration, and C represents the hydrogen pressure. In this study, only linear terms yielded significant results in the model after ANOVA. In the literature, there are various studies reporting linear or quadratic models. Demirel and Kayan (2012) applied a CCD to textile dye degradation, and, despite exhibiting nearly linear curvilinear behavior between temperature, time, and pressure variables, gave a quadratic model [25]. Ahmadi et al. (2018) found the quadratic model to be significant for the degradation of Reactive Blue 19 [26]. A similar approach was observed in xylose studies. Bhavsar et al. (2025) established a quadratic response surface model for temperature and pressure using the Box–Behnken design [15]. In some CCD studies, only linear terms have been reported to be dominant. In Urréjola-Madriñán et al.’s (2022) study on Cr(VI) adsorption with Spirulina, only the linear model was found to be sufficient for CCD application [27]. The final model was simplified because the quadratic terms were not significant. In their xylitol optimization study, De Faveri et al. (2004) used a linear model for xylitol crystallization yield, which was similar to the results of this study [28]. Keeping the reaction time constant and selecting a working range close to the active region of the process may have prevented second-order behavior from becoming statistically dominant. Chen and Chen (2025) stated in their study that not all quadratic terms should be automatically included in the model in RSM applications [29]. They emphasized that preserving statistically significant terms is a more accurate approach.
Y = 58.7307 + 1.2358A − 2.7283B + 0.7883C
Table 2.
Response surface experimental results.
3.2. Effect of Individual Process Variables on Xylitol Yield
3.2.1. Catalyst Effect
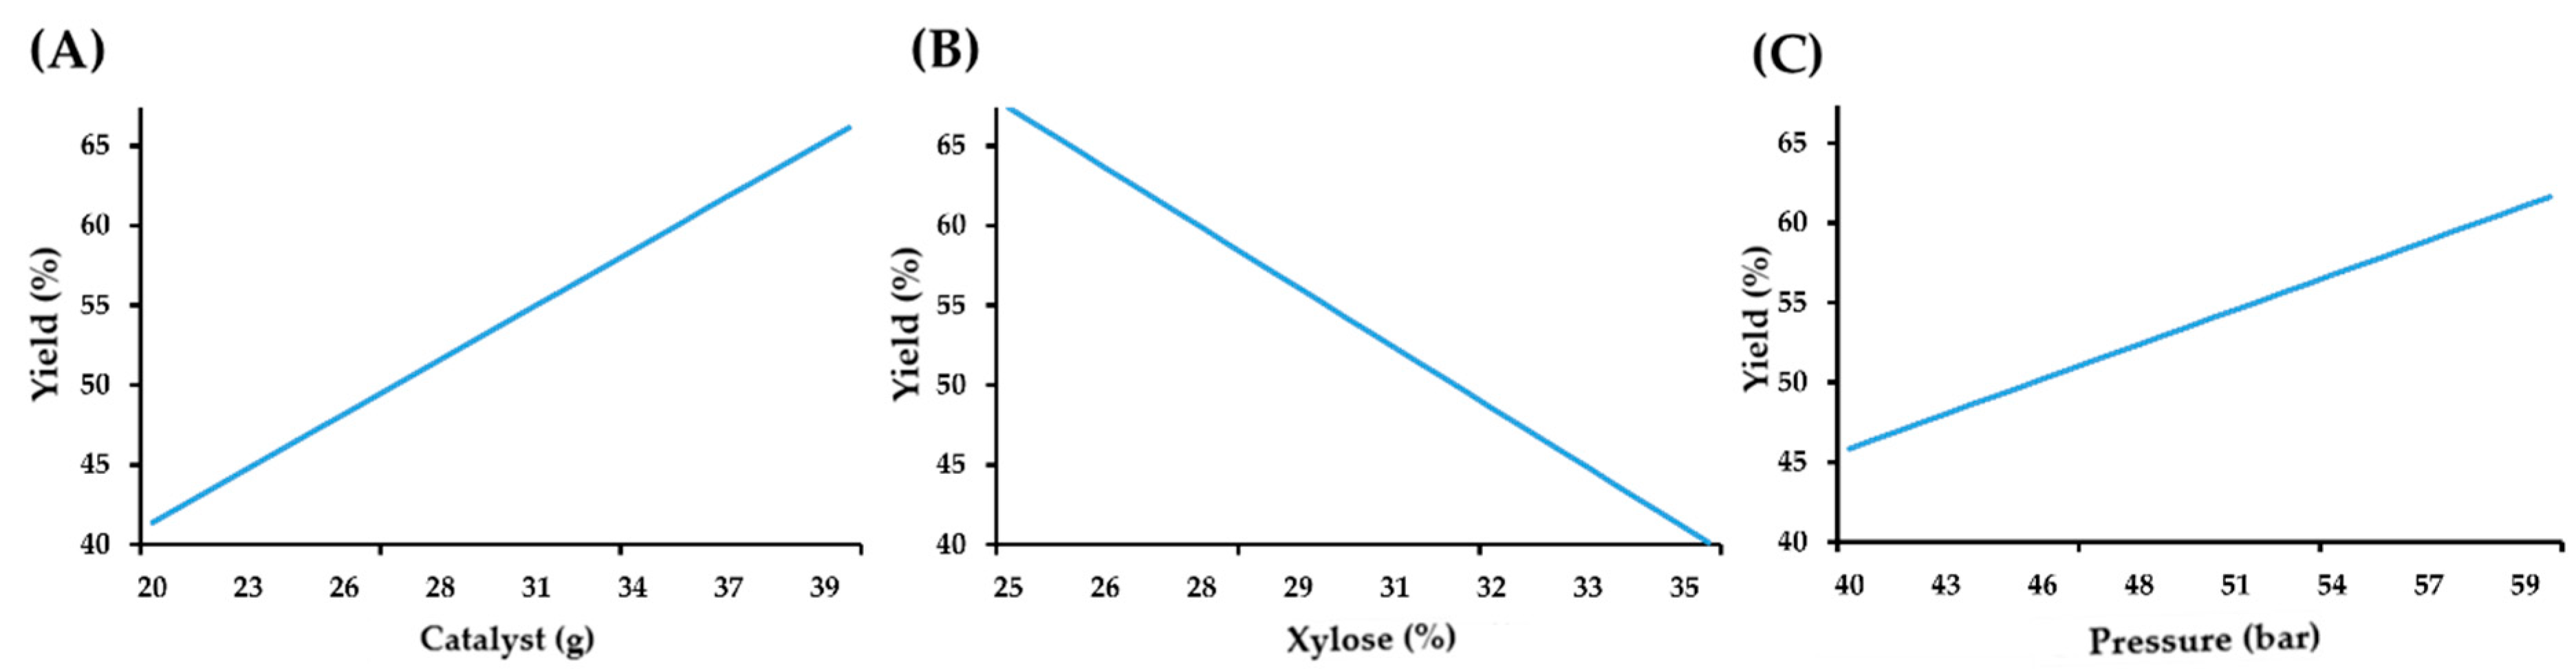
According to the RSM model, the catalyst amount was found to have a significant contribution among the variables that had a statistically significant effect on xylitol yield. The positive regression coefficient for the amount of catalyst shows that increasing the catalyst load supports xylitol formation. This can be explained by an increase in the surface area of the accessible active metal in the reaction medium and an increase in the number of active centers that can participate in the hydrogenation reaction. In heterogeneous catalytic hydrogenation systems, increasing the amount of catalyst can increase the reaction rate by increasing the probability of the adsorption of substrate molecules to the catalyst surface [30]. However, the model results showed that xylose concentration exerted a stronger limiting effect on the process. The negative regression coefficient for xylose concentration indicates that an increase in the substrate amount above a certain level can negatively impact xylitol formation. It has been reported that high sugar concentrations increase viscosity, thereby increasing the external diffusion resistance and hindering the transfer of hydrogen to the catalyst surface [31]. Increasing the catalyst quantity has a positive effect, but despite this, the process efficiency may be lower, owing to mass transfer limitations. The positive effect of the hydrogen pressure may stem from an increase in the amount of available hydrogen on the catalyst surface. Increased pressure increases the dissolved hydrogen concentration and the hydrogenation reaction in catalytically active sites [32]. Therefore, evaluating the catalyst quantity and hydrogen pressure is critical for optimizing xylitol production yield.
3.2.2. Xylose Concentration
Xylose concentration was observed to have the strongest statistical effect among the process variables. A negative regression coefficient (−2.7283) occurred because increasing the xylose concentration reduced the xylitol yield. Higher xylitol yields were obtained at lower xylose concentrations. A decreasing trend in the yield was observed as the concentration increased. This may be due to the limitations of mass transfer in the reaction medium caused by the high substrate load. The viscosity of the solution increased with an increase in xylose concentration. This hinders the transfer of hydrogen in the liquid phase and its access to the catalyst surface. Limiting the diffusion of the substrate to the catalyst active sites can reduce the hydrogenation rate [33,34]. It has been observed that lower initial xylose concentrations are more advantageous in the catalytic hydrogenation process, and substrate load has been identified as one of the key limiting factors determining process performance. The selected xylose concentration range (25–35%) was determined based on preliminary experiments and industrially relevant operating conditions. Although lower substrate concentrations may improve xylitol yield by reducing diffusion limitations and improving hydrogen accessibility, excessively diluted systems may decrease volumetric productivity and increase the downstream processing requirements. Therefore, the selected range was considered a practical compromise between the reaction performance and process feasibility.
3.2.3. Pressure Effect
Hydrogen pressure is a process variable that has a statistically significant effect on xylitol production. The fact that the positive coefficient for hydrogen pressure (+0.7883) in the RSM model equation is lower than the other coefficients indicates that hydrogen pressure supports xylitol formation, but is not the dominant factor determining process performance alone. Despite its low impact rate, it highlights that it is a factor to be considered in the process analysis. The amount of hydrogen dissolved in the liquid phase increased with increasing pressure. An increased hydrogen concentration increases hydrogen adsorption on the catalyst surface. This resulted in an increase in the reaction rate. High hydrogen availability supports the reduction reaction and positively influences xylitol formation. However, the lower statistical contribution of hydrogen pressure compared to other variables indicates that hydrogen availability is not a fundamental factor limiting the process performance [8,34]. These findings reveal that hydrogen pressure is an important process parameter that supports xylitol formation. This suggests that it should be considered in conjunction with substrate concentration and catalyst amount for process optimization.
3.2.4. Temperature Effect
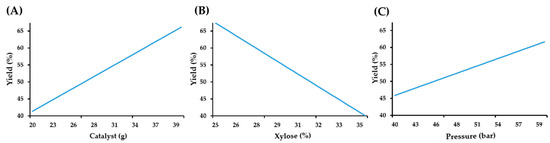
Although the reaction temperature was one of the process variables investigated in the catalytic hydrogenation process, it did not show statistical significance in the model. The exclusion of the temperature variable from the stepwise selection process indicates that it does not independently contribute to xylitol yield. In the experimental results, the yield values varied at different temperatures, but a linear trend was not observed with increasing temperature. This shows that the effect of temperature should not be considered a significant factor on its own. Xylose concentration, catalyst amount, and hydrogen pressure play a dominant role in process performance. However, the effect of temperature on reaction kinetics should not be completely ignored. Increasing the temperature can increase the hydrogenation rate but can also affect the occurrence of side reactions and changes in product selectivity [10]. Although temperature was included within the investigated operational range, its statistical contribution to xylitol yield remained secondary compared to the catalyst amount, xylose concentration, and hydrogen pressure. The individual effects of the process variables on the xylitol yield are shown in Figure 2. Similar observations have been reported for Raney Ni-catalyzed xylose hydrogenation systems, where the gas–liquid mass transfer phenomenon significantly influences the apparent reaction behavior. Mikkola et al. (2000) reported that external mass transfer limitations affect xylose hydrogenation performance, and emphasized the importance of sufficiently high stirring rates to minimize transport limitations [35]. Under such conditions, the apparent influence of intrinsic kinetic parameters such as temperature may become less pronounced. Therefore, the reliable determination of intrinsic kinetic parameters, such as activation energy, would require additional experiments performed under kinetically controlled conditions with minimal external mass transfer limitations. This aspect remains a limitation of the present study and should be addressed in future kinetic studies.
Figure 2.
Individual effects of catalyst amount (A), xylose concentration (B), and hydrogen pressure (C) on xylitol yield according to the developed RSM model.
3.3. RSM Model Fitting and Statistical Evaluation
Experimental data obtained using the Response Surface Methodology (RSM) were evaluated using a multiple linear regression model, and the results of the analysis of variance are presented in Table 1. The established model was statistically significant (F = 16.33, p < 0.0001). This result indicated that the variation in the selected independent variables on xylitol yield was significant. When the factors in the model were examined, the catalyst amount, xylose concentration, and hydrogen pressure had statistically significant effects on the xylitol yield. The positive coefficient for the catalyst amount (+1.236) revealed that increasing the catalyst load had a positive effect on xylitol yield. The positive coefficient for the pressure factor (+0.788) indicated that increased hydrogen availability in the reaction medium supported xylitol formation. The negative coefficient for xylose concentration (−2.728) indicated that a significant decrease in yield occurred as the initial substrate load increased. This may be due to the increased viscosity of the solution, decreased hydrogen solubility, and limited mass transfer to the active sites of the catalyst at high substrate concentrations. The statistical indicators of the model are listed in Table 3.
Table 3.
Statistical performance indicators of the multiple linear regression model developed for xylitol yield prediction. The table shows model significance, goodness-of-fit criteria, residual diagnostics, and predictive adequacy parameters.
The p-values of all the variables were below 0.05, indicating that they made a statistically significant contribution to the model. Detailed regression statistics including coefficient estimates, t-values, and effect directions are presented in Table 4.
Table 4.
Regression coefficients, t-values, p-values, and effect directions of the significant variables included in the multiple linear regression model for xylitol yield prediction.
Residual-based diagnostic evaluations of the model also supported the reliability of the established regression structure. The calculation of the Durbin–Watson statistic (2.20) showed no significant autocorrelation between the error terms. The p-value of 0.4829 for the Breusch–Pagan test revealed that the residual variance remained constant and that there was no heteroscedasticity problem. In addition to this study, the Response Surface Methodology has been applied in xylitol optimization studies using biotechnological production approaches, and similarly, the models have been shown to be consistent with experimental data. In a study conducted by Rodrigues et al. using Candida guilliermondii, the model F-value was calculated as 24.30. Although the lack-of-fit value was 6.75, it was found to be statistically insignificant (p = 0.0701), thus demonstrating that the model represented the experimental system at an acceptable level [36]. Similarly, in biotechnological xylitol production studies conducted with different yeast strains, substrate concentration, incubation time, and medium composition have been reported as key determining factors in identifying optimum conditions, and the developed regression models were found to be in agreement with the experimental validation results. This, along with the fact that the model obtained in the present study was found to be significant (F = 16.33, p < 0.0001), the lack-of-fit result was insignificant (F = 1.86, p = 0.1628), and the residual diagnostic tests were at an acceptable level, despite the fundamentally different production methods, reveals that the fit of the model is parallel to similar RSM applications reported in the literature. The RMSE value, representing the prediction error, was 9.91, and the Adequate Precision value was determined to be 5.25, indicating that the model has an acceptable signal-to-noise ratio and is suitable for statistical evaluation.
3.4. Response Surface Analysis of Variable Interactions
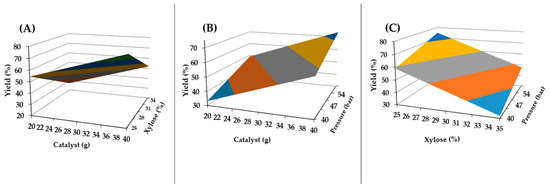
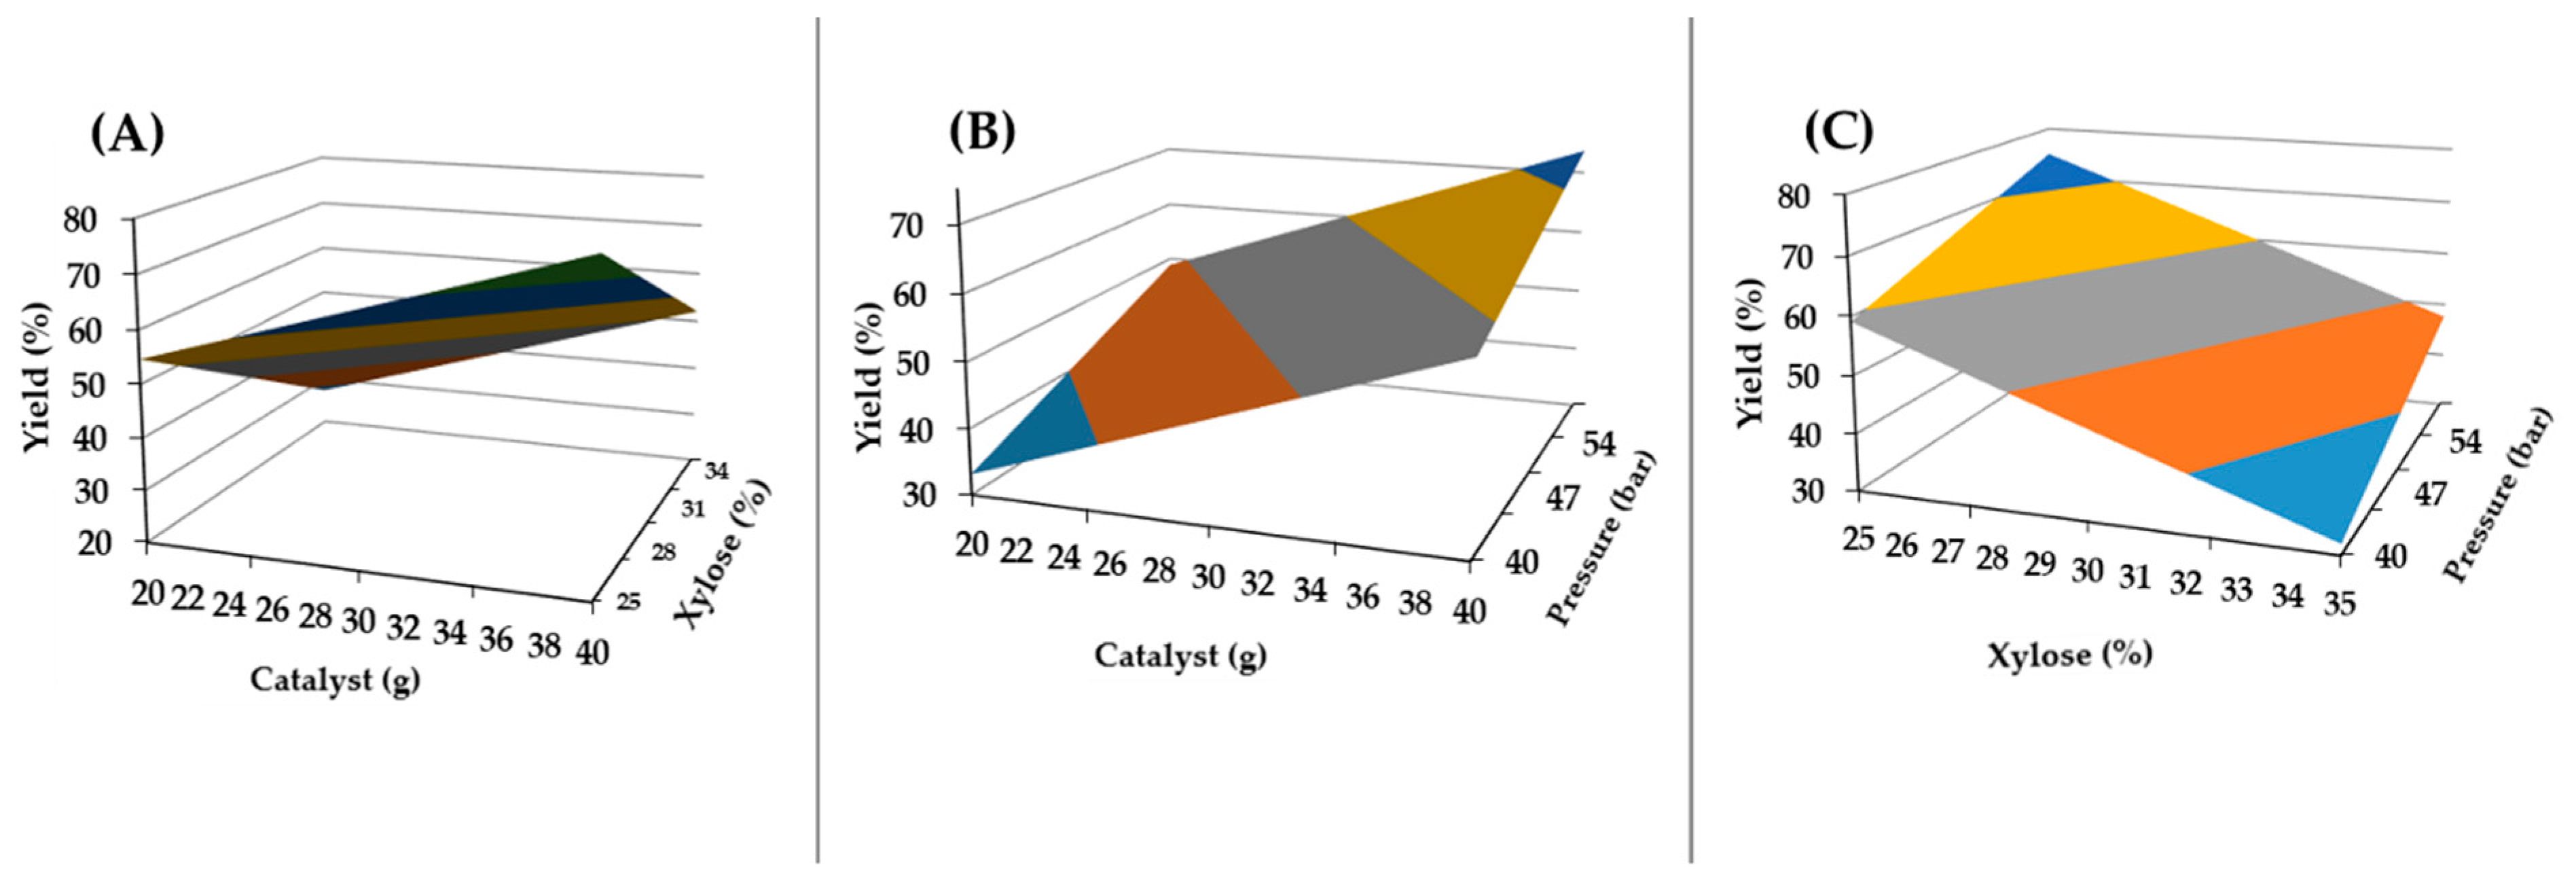
Three-dimensional response surface graphs were created to visually evaluate the combined effects of the main process variables on xylitol yield, which were found to be statistically significant in the multiple linear regression model. The three-dimensional response surface graphs are shown in Figure 3. The generally linear trend of the surface structures in the graphs reveals that the main effects are dominant in the model, and that the interactions between variables remain at a limited level. When the combined effect of the catalyst amount and xylose concentration is examined in Figure 3A, it is seen that increasing the catalyst amount increases the xylitol yield, while increasing the xylose concentration decreases the yield. This trend is consistent with the regression coefficients; a positive coefficient (+1.236) was obtained for the catalyst and a negative coefficient (−2.728) was obtained for xylose concentration. The region with the highest yield on the surface was formed in the region where both a high catalyst amount and low xylose concentration were present. As shown in Figure 3B, an increase in xylitol yield was observed with increasing catalyst loading and hydrogen pressure. The effect of the catalyst amount was more pronounced. However, pressure showed a limited positive contribution. This is consistent with the magnitudes of the coefficients. A coefficient of +1.236 was obtained for the catalyst and +0.788 for pressure. The highest yield values were observed for a high catalyst amount and high-pressure region. As shown in Figure 3C, xylitol yield reached higher values under low xylose concentrations and high-pressure conditions. The increase in xylose concentration had a significant negative effect on yield, and the increase in pressure partially offset this decrease. The graphs show a predominance of linear slopes and an absence of curvilinear deformations. The graph reveals that the main effects were decisive in the model structure. The prominence of xylose concentration, catalyst amount, and pressure variables showed parallelism with the characteristics of the graph. RSM graphs indicate that combinations of a high catalyst amount, low xylose concentration, and high pressure create the most suitable region in terms of xylitol yield.
Figure 3.
Three-dimensional response surface plots illustrating the effects of statistically significant process variables on xylitol yield within the multiple linear regression model: (A) catalyst amount versus xylose concentration, (B) catalyst amount versus hydrogen pressure, and (C) xylose concentration versus hydrogen pressure.
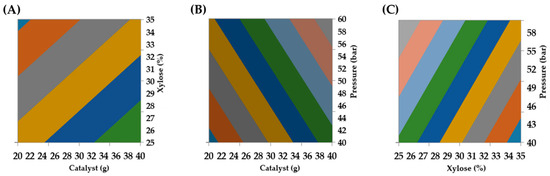
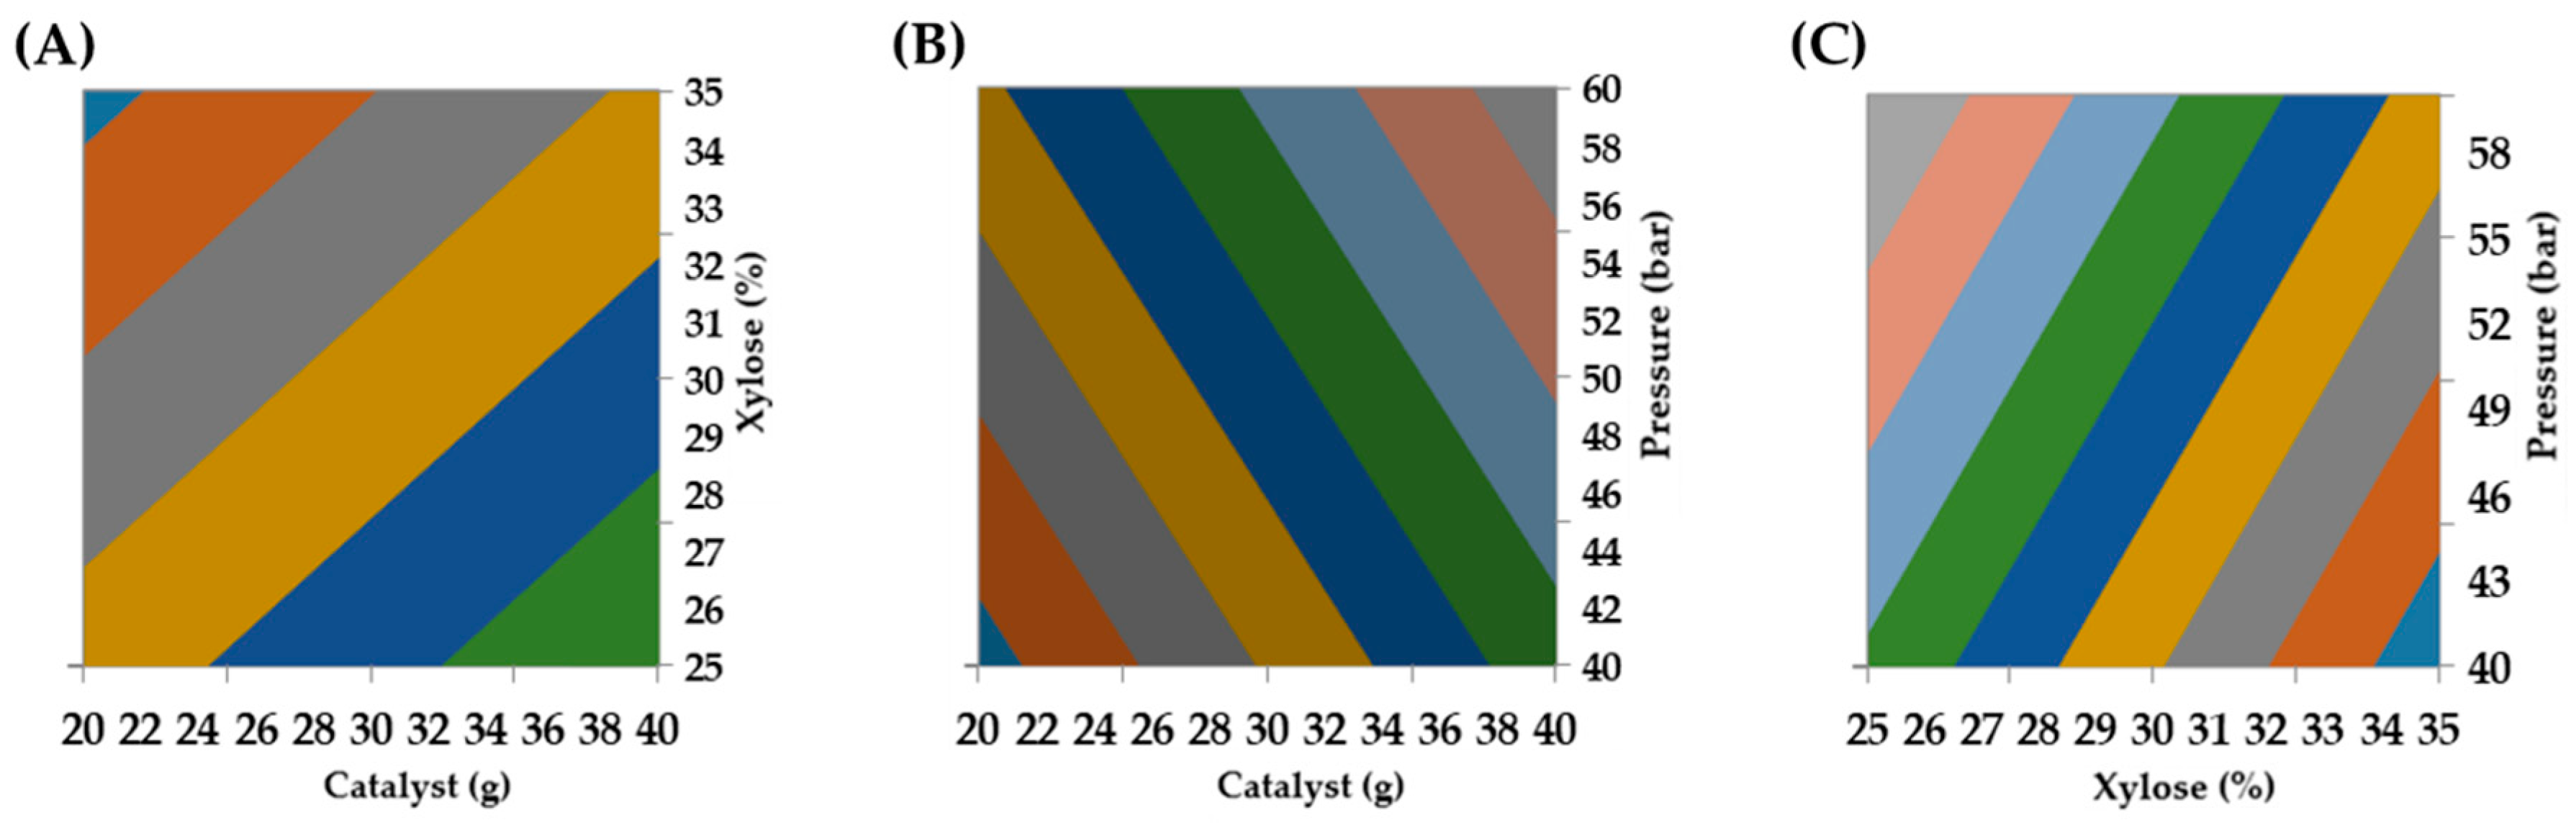
Contour plots, created to evaluate the combined effects of independent variables on xylitol yield in two dimensions, are shown in Figure 4. These contour plots revealed the yield regions formed by the variables at constant levels, allowing for a clearer observation of process trends. Figure 4A shows that, by examining the relationship between the catalyst amount and xylose concentration, higher xylitol yield regions were formed under conditions of high catalyst amount and low xylose concentration. The smooth and parallel progression of the contour lines indicates that the change in the surface was largely linear. The shift to lower yield regions with increasing xylose concentration was consistent with the negative effect of this variable on the model. Figure 4B shows that when the catalyst amount and pressure are considered together, a regular upward trend in the yield regions is observed with increasing amounts of both variables. The linear and parallel progression of the contour lines indicates that the contribution of the variables largely occurs at the main effect level. Higher yield areas were particularly evident in the high catalyst loading and high-pressure regions. Figure 4C shows that when the relationship between xylose concentration and pressure was examined, regions with higher xylitol yields were formed under low xylose concentrations and high-pressure conditions. It is noteworthy that as the xylose concentration increased, the contour areas shifted towards lower yield regions, and the increase in pressure partially compensated for this change. This trend was consistent with xylose concentration being the variable with the highest statistical contribution. The generally linear character of the contour lines revealed that the effect of the variables on xylitol yield was largely determined by the main factors. When the three-dimensional surface and contour plots were evaluated together, it was observed that combinations of a high catalyst amount, low xylose concentration, and high pressure were associated with higher xylitol yield.
Figure 4.
Contour plots illustrating the interaction effects of process variables on xylitol yield under fixed levels of the remaining variables: (A) catalyst and xylose concentration, (B) catalyst and pressure, and (C) xylose concentration and pressure. Color gradients represent predicted yield values, with warmer colors indicating higher xylitol yield.
3.5. Numerical Optimization of Catalytic Hydrogenation Conditions
Numerical optimization based on a regression model revealed that the conditions providing maximum xylitol yield within the experimental range were 40 g of catalyst, 25% xylose concentration, and 60 bar hydrogen pressure. When the target response value was defined as maximum yield in the SigmaXL optimization module, the model calculated the estimated xylitol yield under these conditions as 87.2557%. The determined optimum point is consistent with the direction of the model coefficients, reflecting the positive effect of the catalyst amount and pressure and the negative effect of xylose concentration. Furthermore, this optimum region parallels the high-yield areas observed in the response surface and contour graphs. The high-yield areas observed in the RSM and contour plots were parallel to the optimum region. Xylitol yield was obtained as 86.6 ± 0.2%, and the difference between the model prediction and the experimental result remained at approximately 0.75%. In the literature, a difference of even 1–3% between the prediction and the actual result is considered acceptable, but the fact that the difference was very small in our study is an important indicator of the model’s accuracy [37].
3.6. Model Validation Against Experimental Data
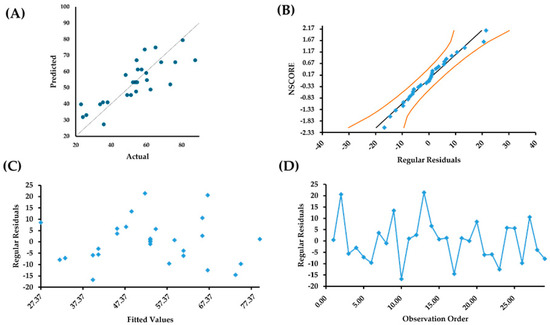
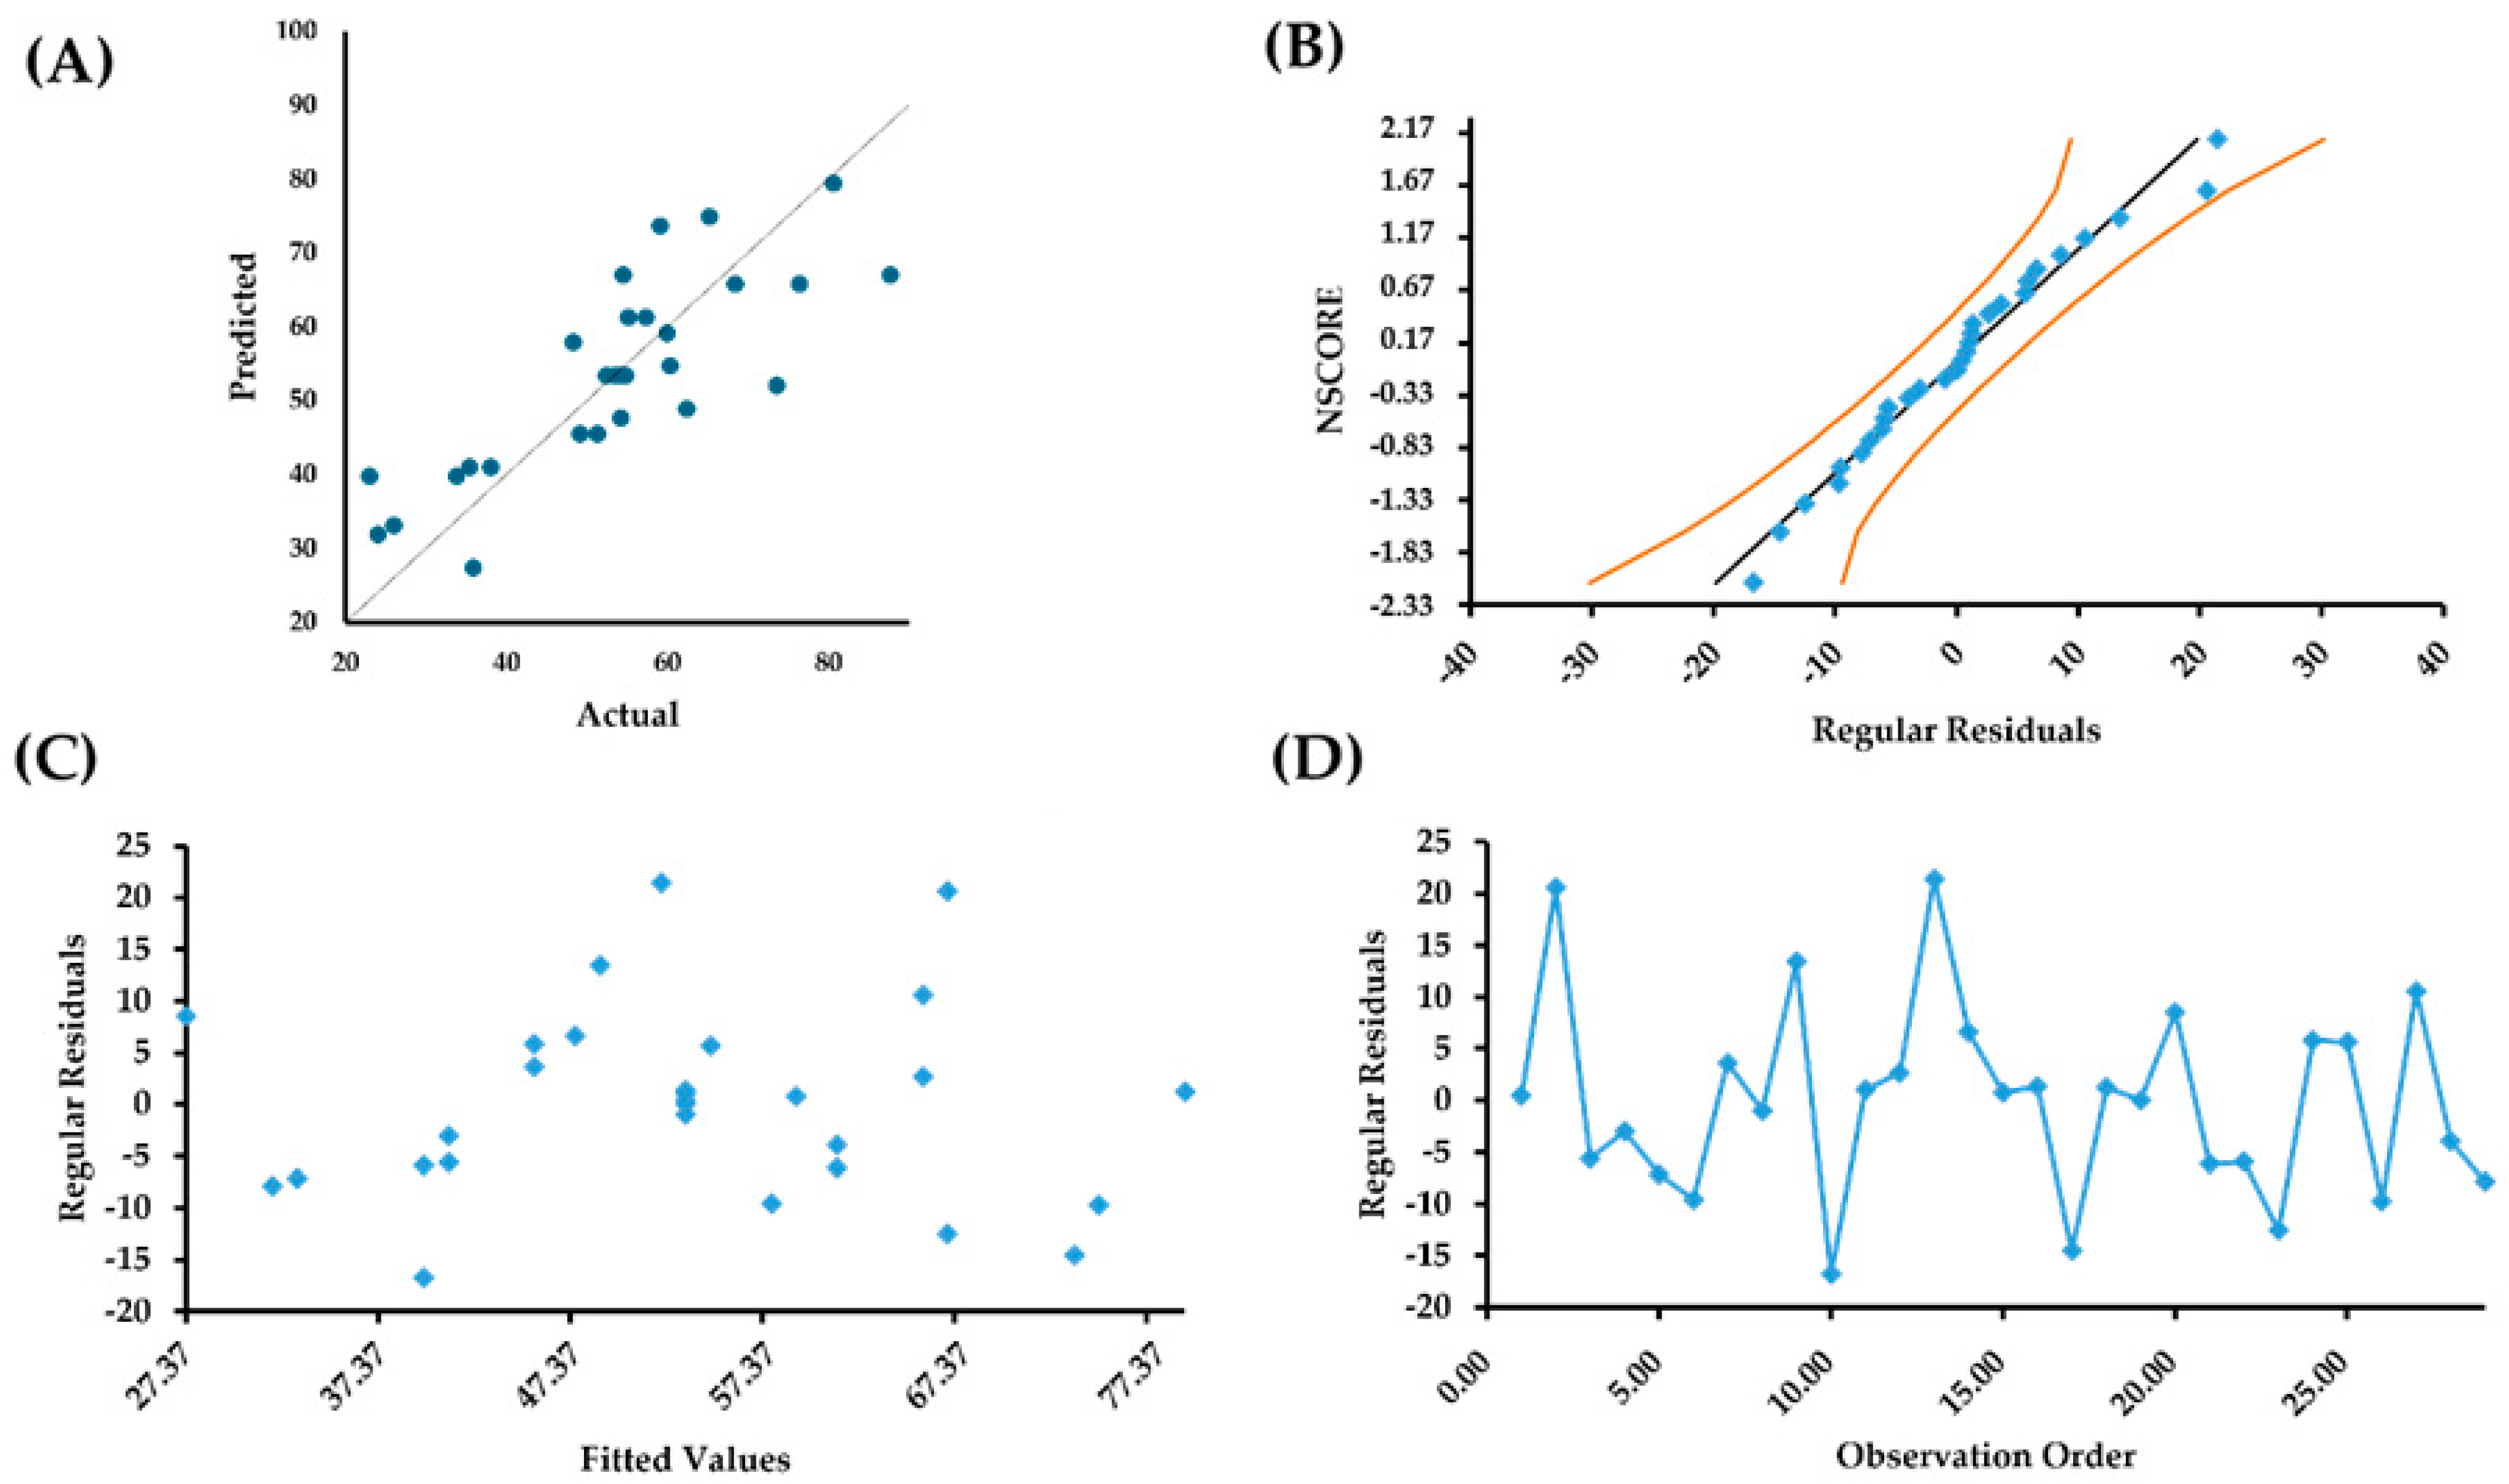
The fit of the model to the residual graphs is shown in Figure 5. Figure 5A shows the distinct linear trend between the experimental and model results. The regression model successfully represents the overall trend of the experimental results. The model demonstrated that it could predict the xylitol yield with acceptable accuracy. Deviations occurred only to a limited extent between the points. This behavior indicates that the model predictions are in good agreement with the experimental results. The reason for the small deviations may be local mass transfer differences that can occur in batch reactor systems, micro-level variations in hydrogen solubility, and heterogeneous active center distribution on the catalyst surface. The distribution of the process behavior of the regression model was concentrated around the diagonal reference line. The externally studentized residual values were largely located along the linear line (Figure 5B). The absence of significant deviations in the end regions indicated that there was no serious normality disruption in the residual structure.
Figure 5.
Diagnostic plots used to evaluate the adequacy of the regression model for xylitol yield: (A) predicted versus actual responses, (B) normal probability plot of externally studentized residuals, (C) externally studentized residuals versus predicted responses, and (D) externally studentized residuals versus run order.
The fit of the model was evaluated using predicted versus actual response graphs and residual diagnostic analysis. The distribution of the residual values against the predicted response was randomly distributed around the zero line of the points. The model error variance was determined to be largely constant and the prediction errors did not exhibit a systematic character. The absence of a funnel or curvilinear structure in the residual distribution supports the view that it forms a homogeneous variance. In the run-order graph, the residual values varied irregularly throughout the experimental sequence. This indicates that the experiments were conducted in accordance with the principle of randomness and that no systematic temporal deviation occurred. The absence of a clear increase–decrease trend supports the independence of the residuals. The diagnostic graphs adequately represented the experimental data in the regression model.
The theoretical maximum response value obtained from the regression equation was compared with the experimental validation. Considering the direction of the regression coefficients, the boundary condition evaluation showed that the maximum xylitol yield was obtained under high catalyst amounts, low xylose concentrations, and high hydrogen pressures. Under these conditions (40 g catalyst, 25% xylose, and 60 bar pressure), the theoretical maximum yield calculated by the model was obtained as 87.2557%. Experiments conducted under the same conditions resulted in a xylitol yield of 86.6 ± 0.2%. The difference between the predicted and experimentally obtained yields was small. This demonstrates that the regression model successfully represents the system’s behavior. In particular, it highlights the model’s accurate capture of the key factor effects and its reliable use in determining the optimum operating region in the catalytic hydrogenation process. The experimental results were very close to the theoretical maximum value. The data obtained support the validity of the model not only statistically but also in terms of practical process optimization. Figure 5C,D present the residual diagnostic plots used to evaluate model adequacy. In Figure 5C, the externally studentized residuals are randomly distributed around zero without a discernible pattern, suggesting homoscedastic behavior and the absence of significant systematic model bias. Figure 5D shows the residual versus run order, where no clear sequential trend or clustering was observed, suggesting that the experiments were conducted randomly and were not significantly affected by time-dependent effects.
3.7. Product Verification Under Optimized Conditions
3.7.1. High-Performance Liquid Chromatography (HPLC) Analysis
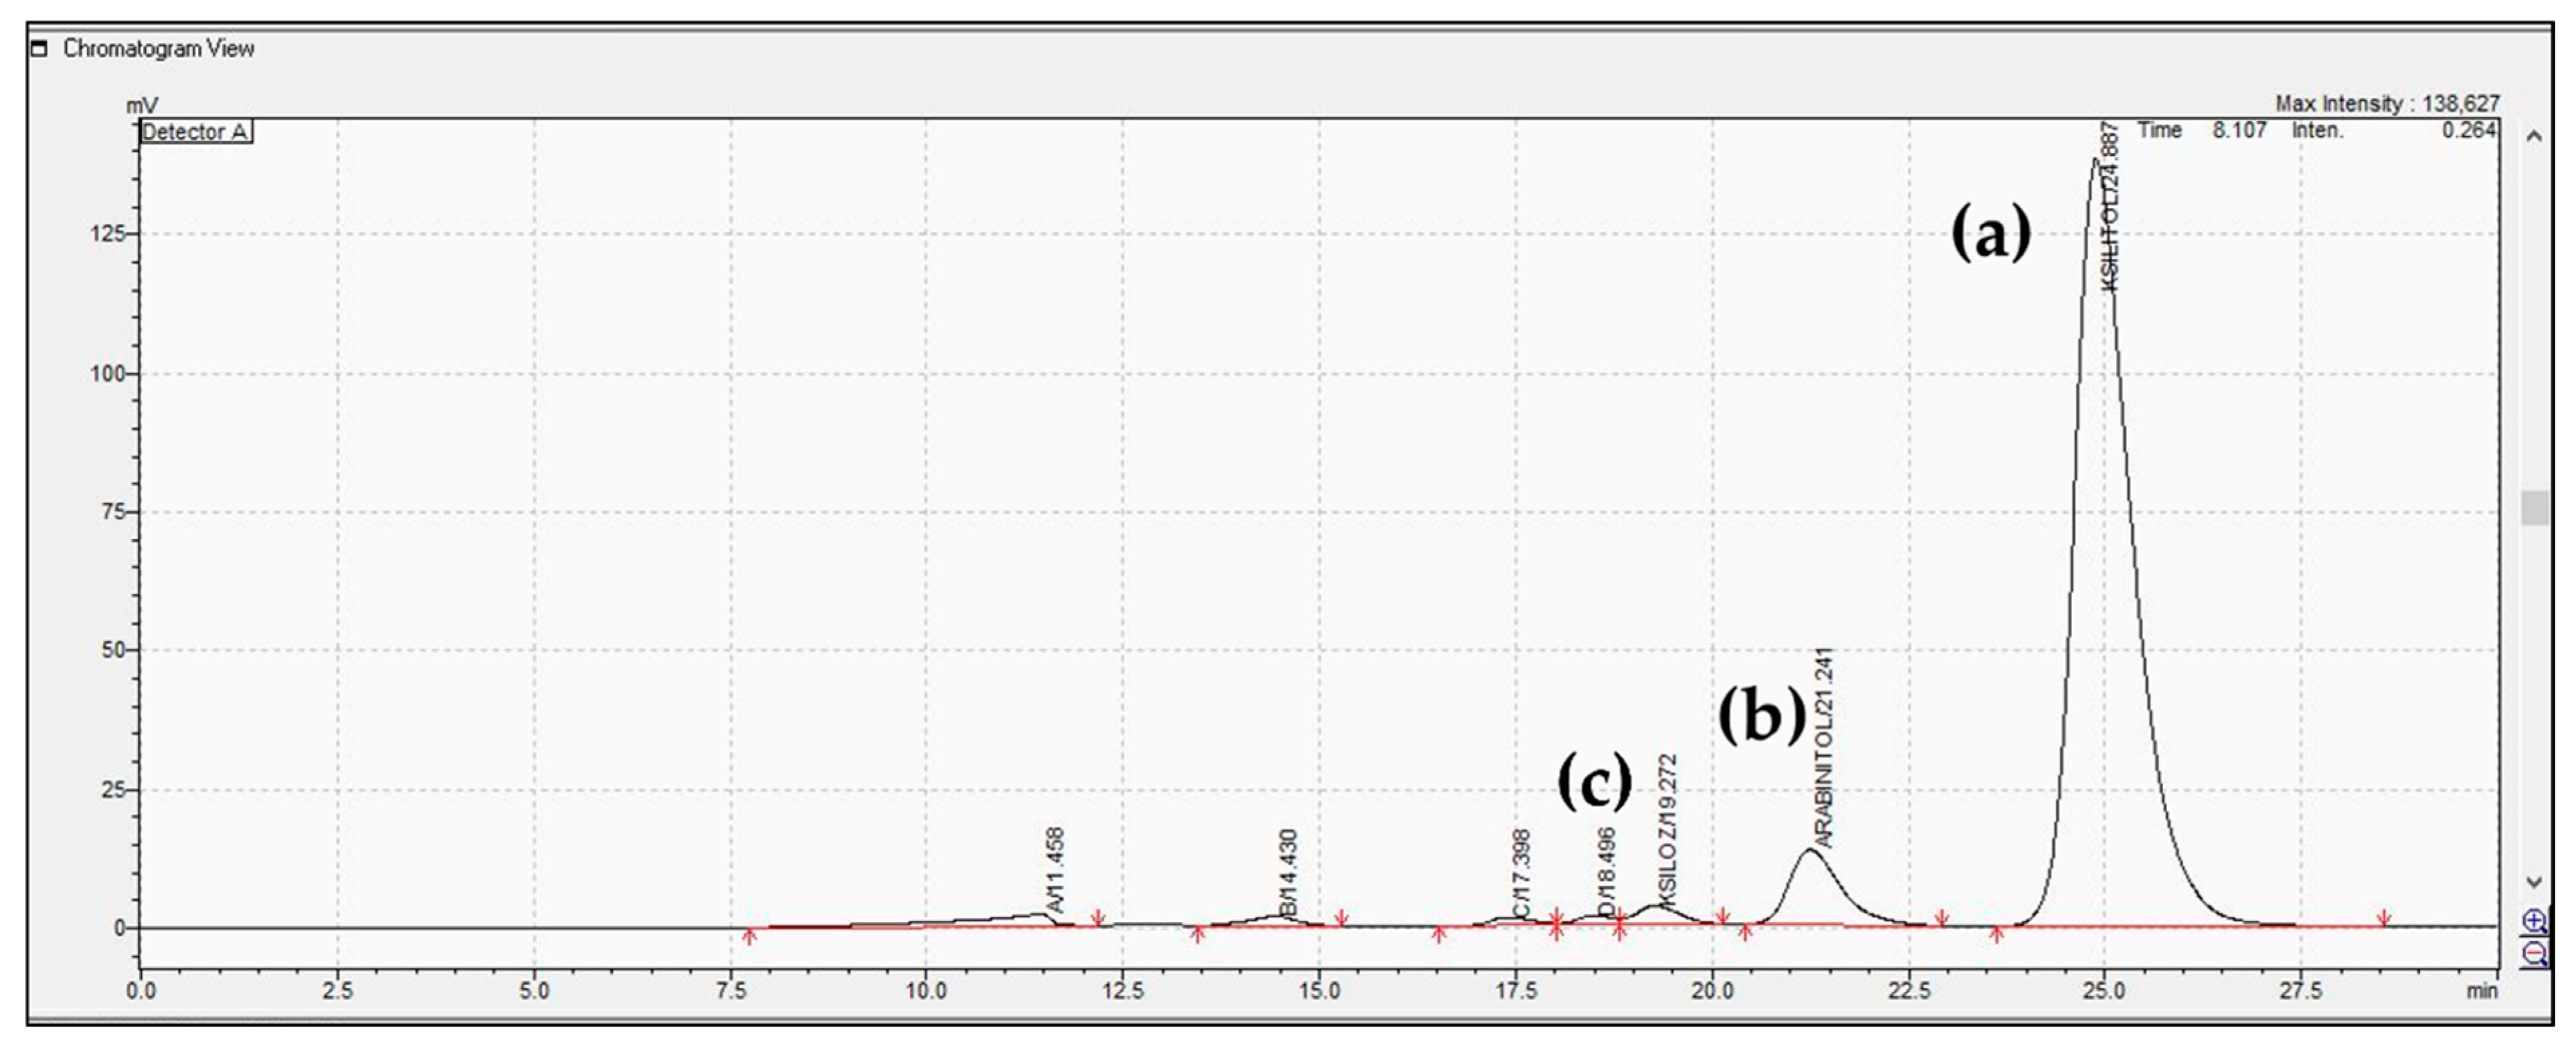
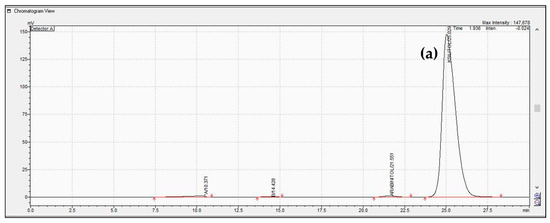
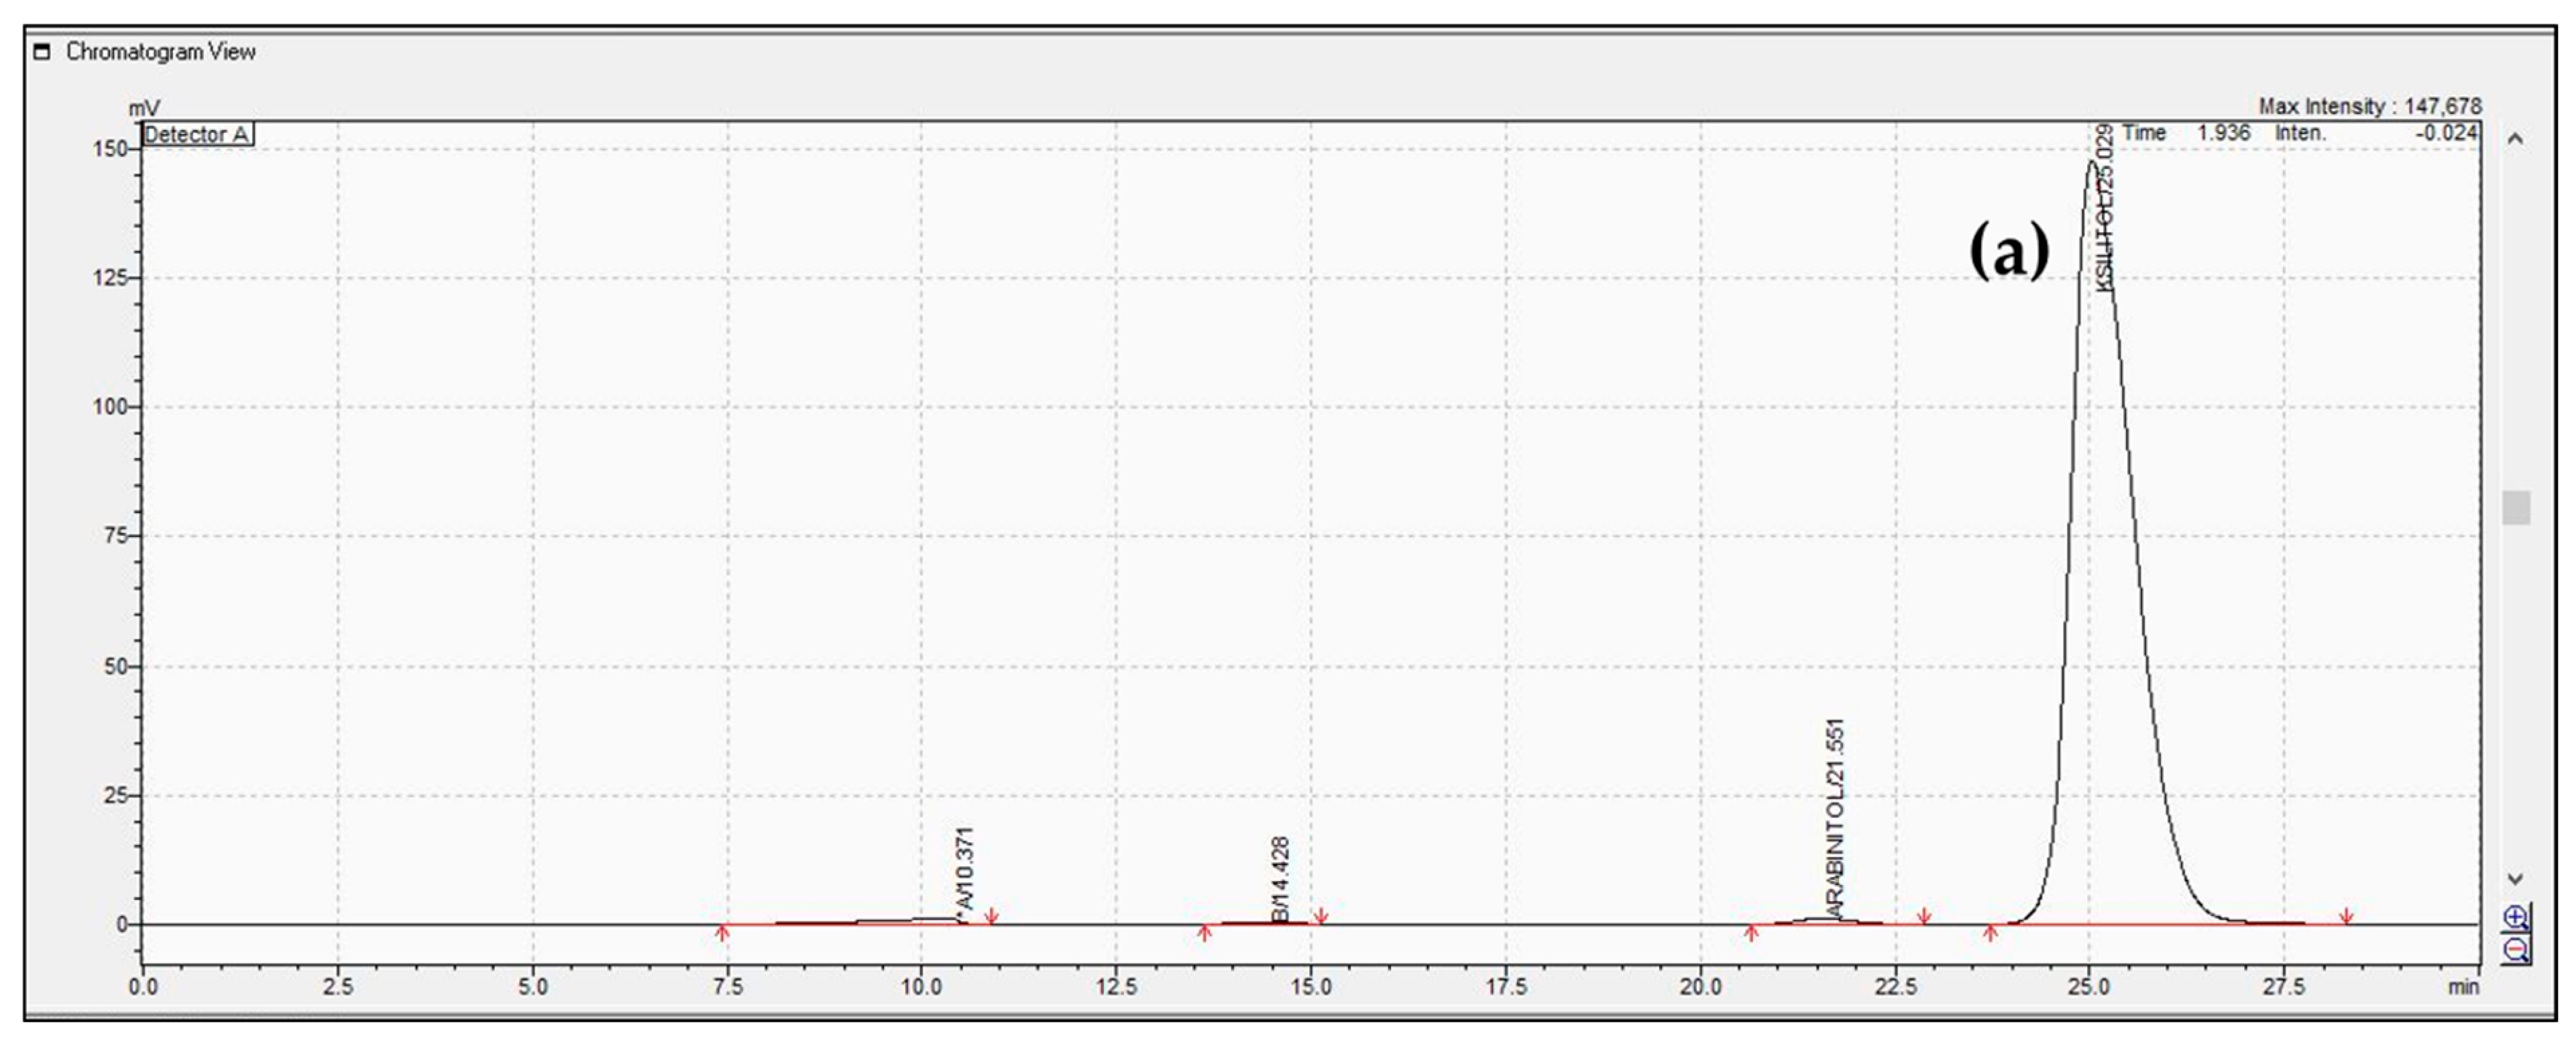
The reaction products obtained after the optimization studies were analyzed by HPLC (Figure 6). The xylose conversion rate was determined as 98.35 ± 0.2%, while the xylitol yield was obtained as 86.61 ± 0.2%. These results showed that the regression model reliably determined the optimum operating region for xylitol production. Arabinitol was detected as a byproduct at a rate of 7.3% on a dry matter basis. The remaining xylose amount was determined as 1.5 ± 0.1%. Small peaks corresponding to additional byproducts were observed in the reaction medium. These small peaks, except for A, B, and C, may correspond to the secondary byproducts formed during catalytic hydrogenation. In a study by Mikkola et al. (1999) [32], byproducts such as ribitol, furfural, xylulose, and xylonic acid were formed during xylose hydrogenation. Thus, the results were consistent with those in the literature [38].
Figure 6.
HPLC Chromatogram of xylitol and other components obtained according to xylitol production conditions determined by RSM (at 400 rpm). In the figure (a) represents xylitol, (b) arabitol and (c) xylose.
The product composition and purity distribution were confirmed by HPLC analysis, which allowed the separation of xylitol from the remaining xylose and byproducts [39]. In the production of xylitol from xylose, the stirring speed has been determined to be an important process parameter for reducing byproduct formation and increasing xylitol yield. Increasing the stirring speed improves the gas–liquid phase transfer by increasing the solubility of hydrogen gas in the reaction medium, thus positively affecting the reaction rate. This contributed to the shorter reaction time and increased xylitol yield. For this purpose, experiments were carried out in a 1 L reactor under optimum conditions using a marine-type propeller stirrer at 400 rpm for 3600 s. Additional experiments were conducted at 800 rpm under the same conditions to demonstrate the effect of the stirring speed. According to the results obtained, xylitol with 86.6% purity was obtained at a stirring speed of 400 rpm, whereas increasing the stirring speed to 800 rpm resulted in xylitol purity reaching 96–98% at the same reaction time (Figure 7). In addition, it was observed that the amount of xylose remaining unconverted at the end of the reaction decreased to a range of 0.1–1.0%. Arabitol formation similarly varied between 0.1 and 1.0%. These results demonstrate that in addition to fundamental process parameters, such as catalyst amount, xylose concentration, and hydrogen pressure, the stirring speed also has a significant effect on the reaction yield and product purity. The formation of arabitol during xylose hydrogenation is associated with parallel isomerization and nonselective hydrogenation pathways [34]. In the present study, lower arabitol formation was observed at higher stirring speeds, likely due to improved gas–liquid–solid mass transfer and enhanced hydrogen availability at the catalyst surface. Improved hydrogen transport may suppress competing side reactions and favor the selective hydrogenation toward xylitol.
Figure 7.
HPLC chromatogram of xylitol and other components obtained according to xylitol production conditions determined by RSM (at 800 rpm). In the figure, (a) represents xylitol.
3.7.2. Thermal Confirmation by DSC and TGA
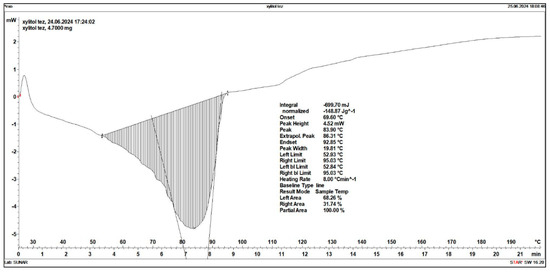
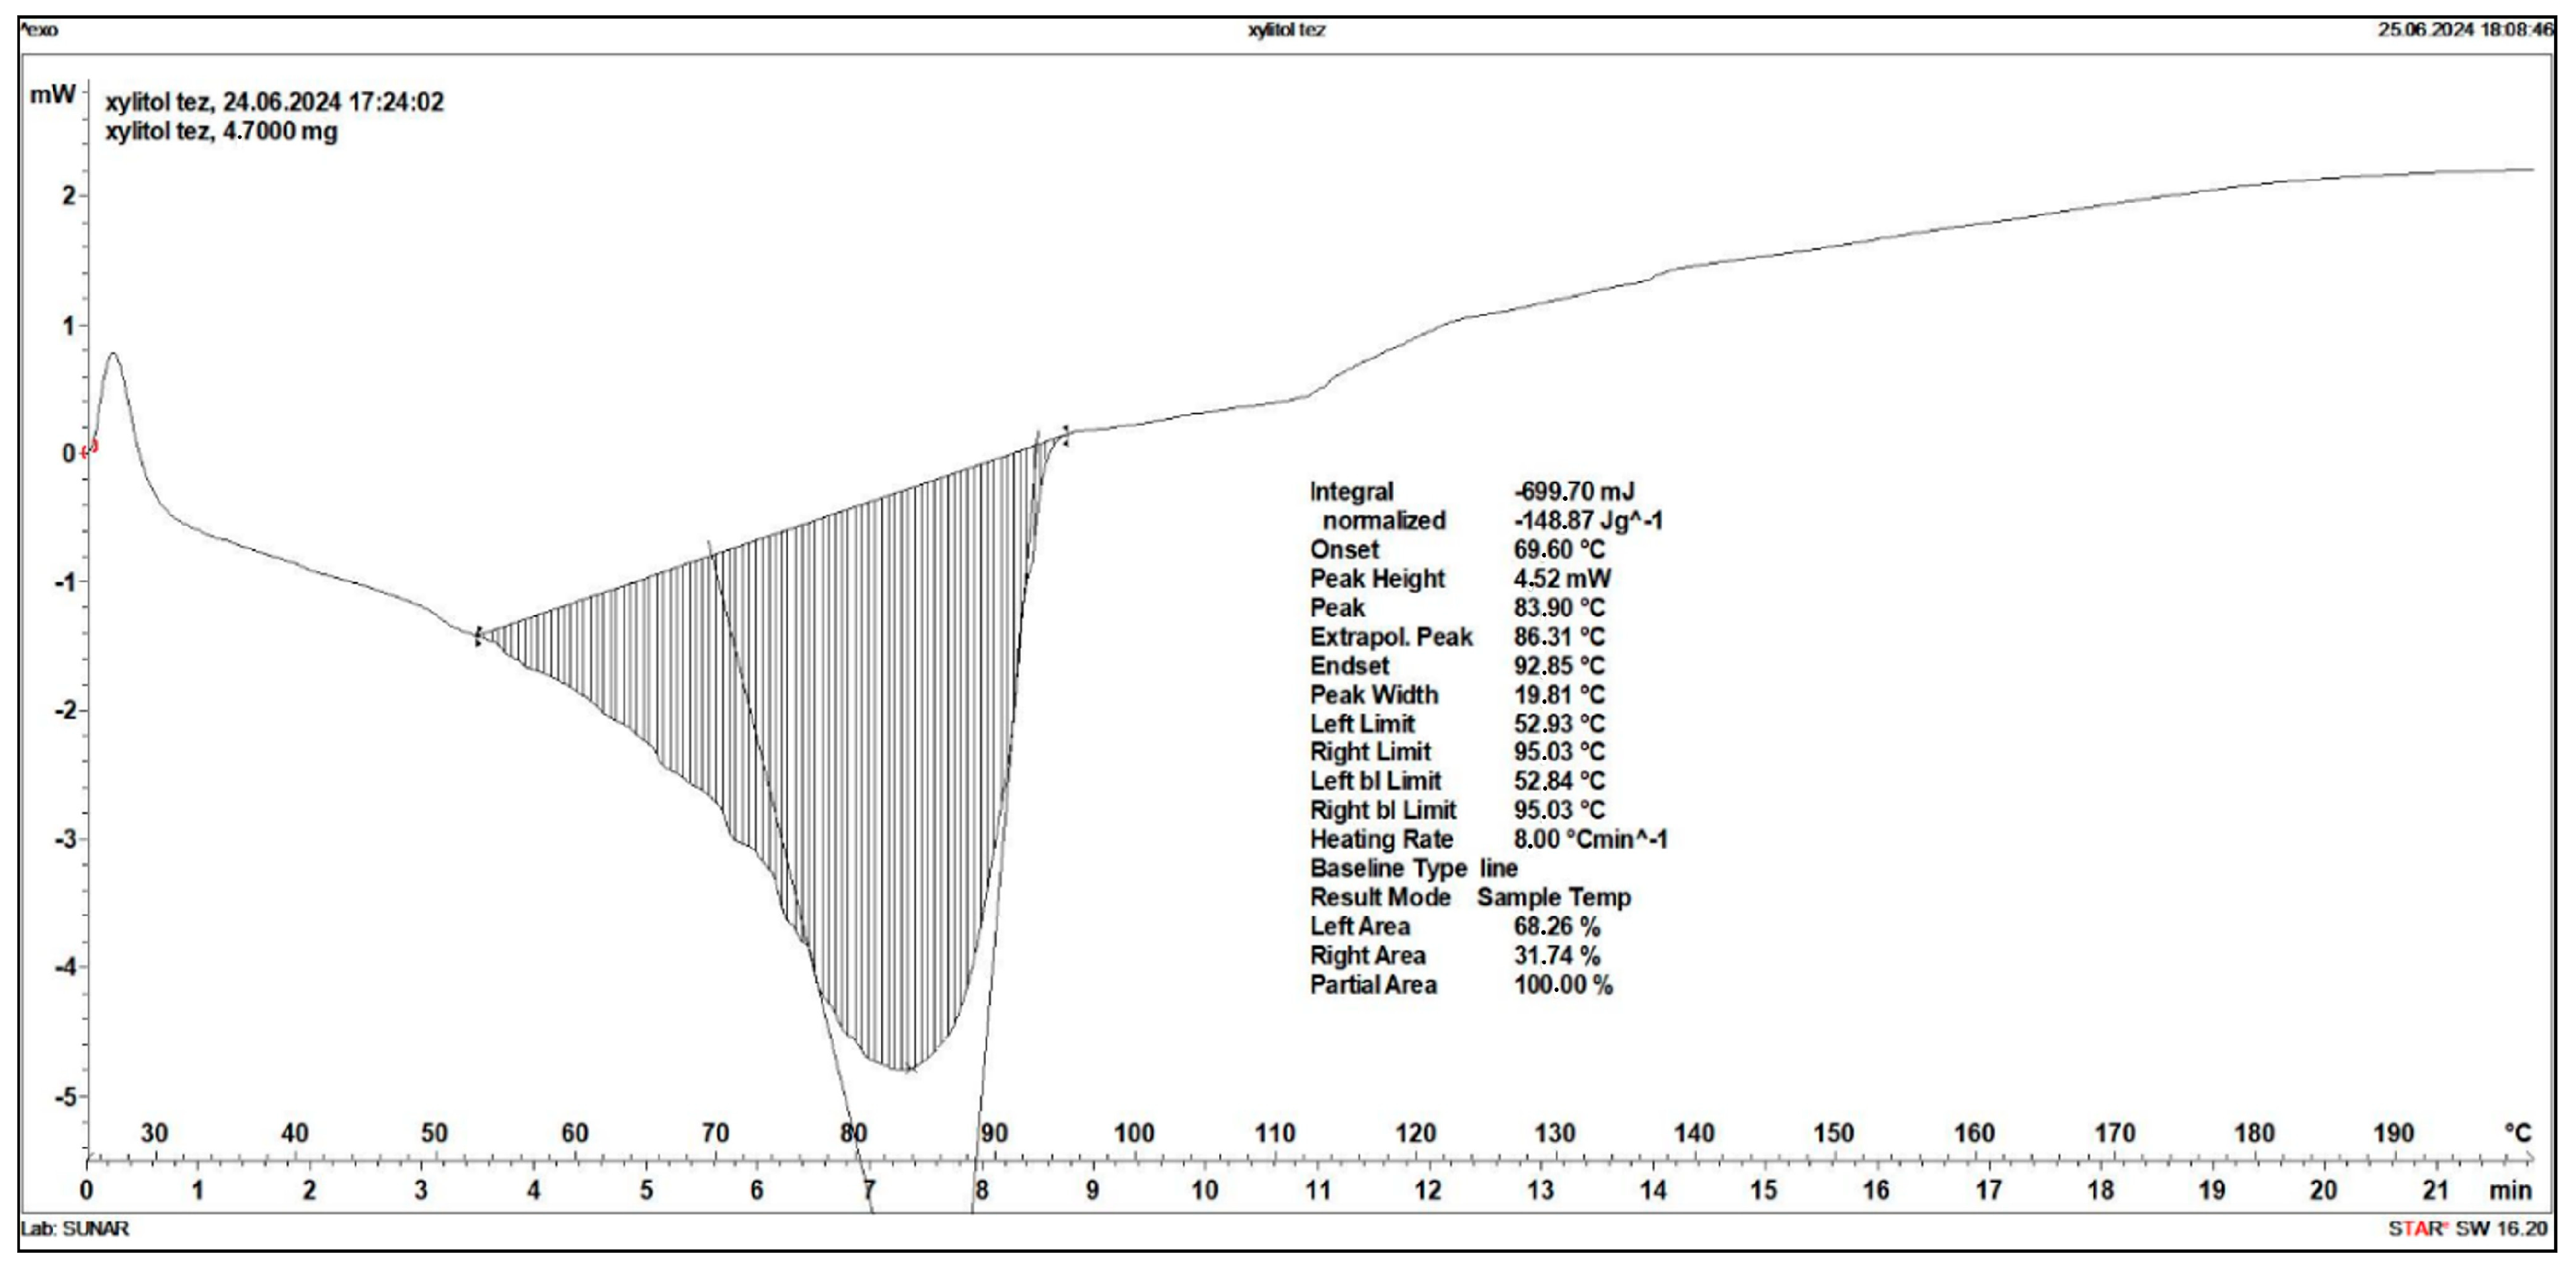
Differential scanning calorimetry (DSC) was performed to determine the thermal behavior of xylitol obtained by catalytic hydrogenation, and the results are presented in Figure 8. The DSC thermogram revealed that xylitol exhibited a distinct endothermic melting peak. The onset temperature of melting was determined as 69.60 °C, while the peak temperature was recorded at 83.90 °C, indicating the temperature at which maximum heat absorption occurred during the melting process. The theoretically calculated extrapolated peak temperature was determined to be 86.31 °C. The endset temperature at which the melting process was completed was measured as 92.85 °C, indicating that the xylitol crystals had completely melted. The maximum heat flow observed during melting was recorded as 4.52 mW. The peak width was calculated as 19.83 °C, indicating that the melting process occurred within a specific temperature range. The total energy absorbed during the melting process was determined to be −699.70 mJ, and the normalized enthalpy was calculated as 148.87 J/g. These findings revealed the characteristic melting behavior and thermal properties of the obtained xylitol in detail. The final melting temperature of 92.85 °C is quite consistent with the 93.0 °C value reported Piquard et al. (2022) [40]. These results support the fact that the thermal characterization of the obtained xylitol is consistent with the literature data and that the crystal structure of the product was successfully formed.
Figure 8.
Differential scanning calorimetry (DSC) analysis to determine the thermal behavior of xylitol obtained by catalytic hydrogenation.
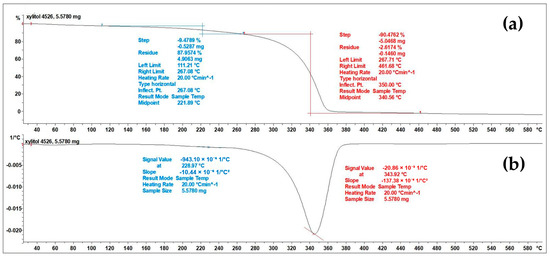
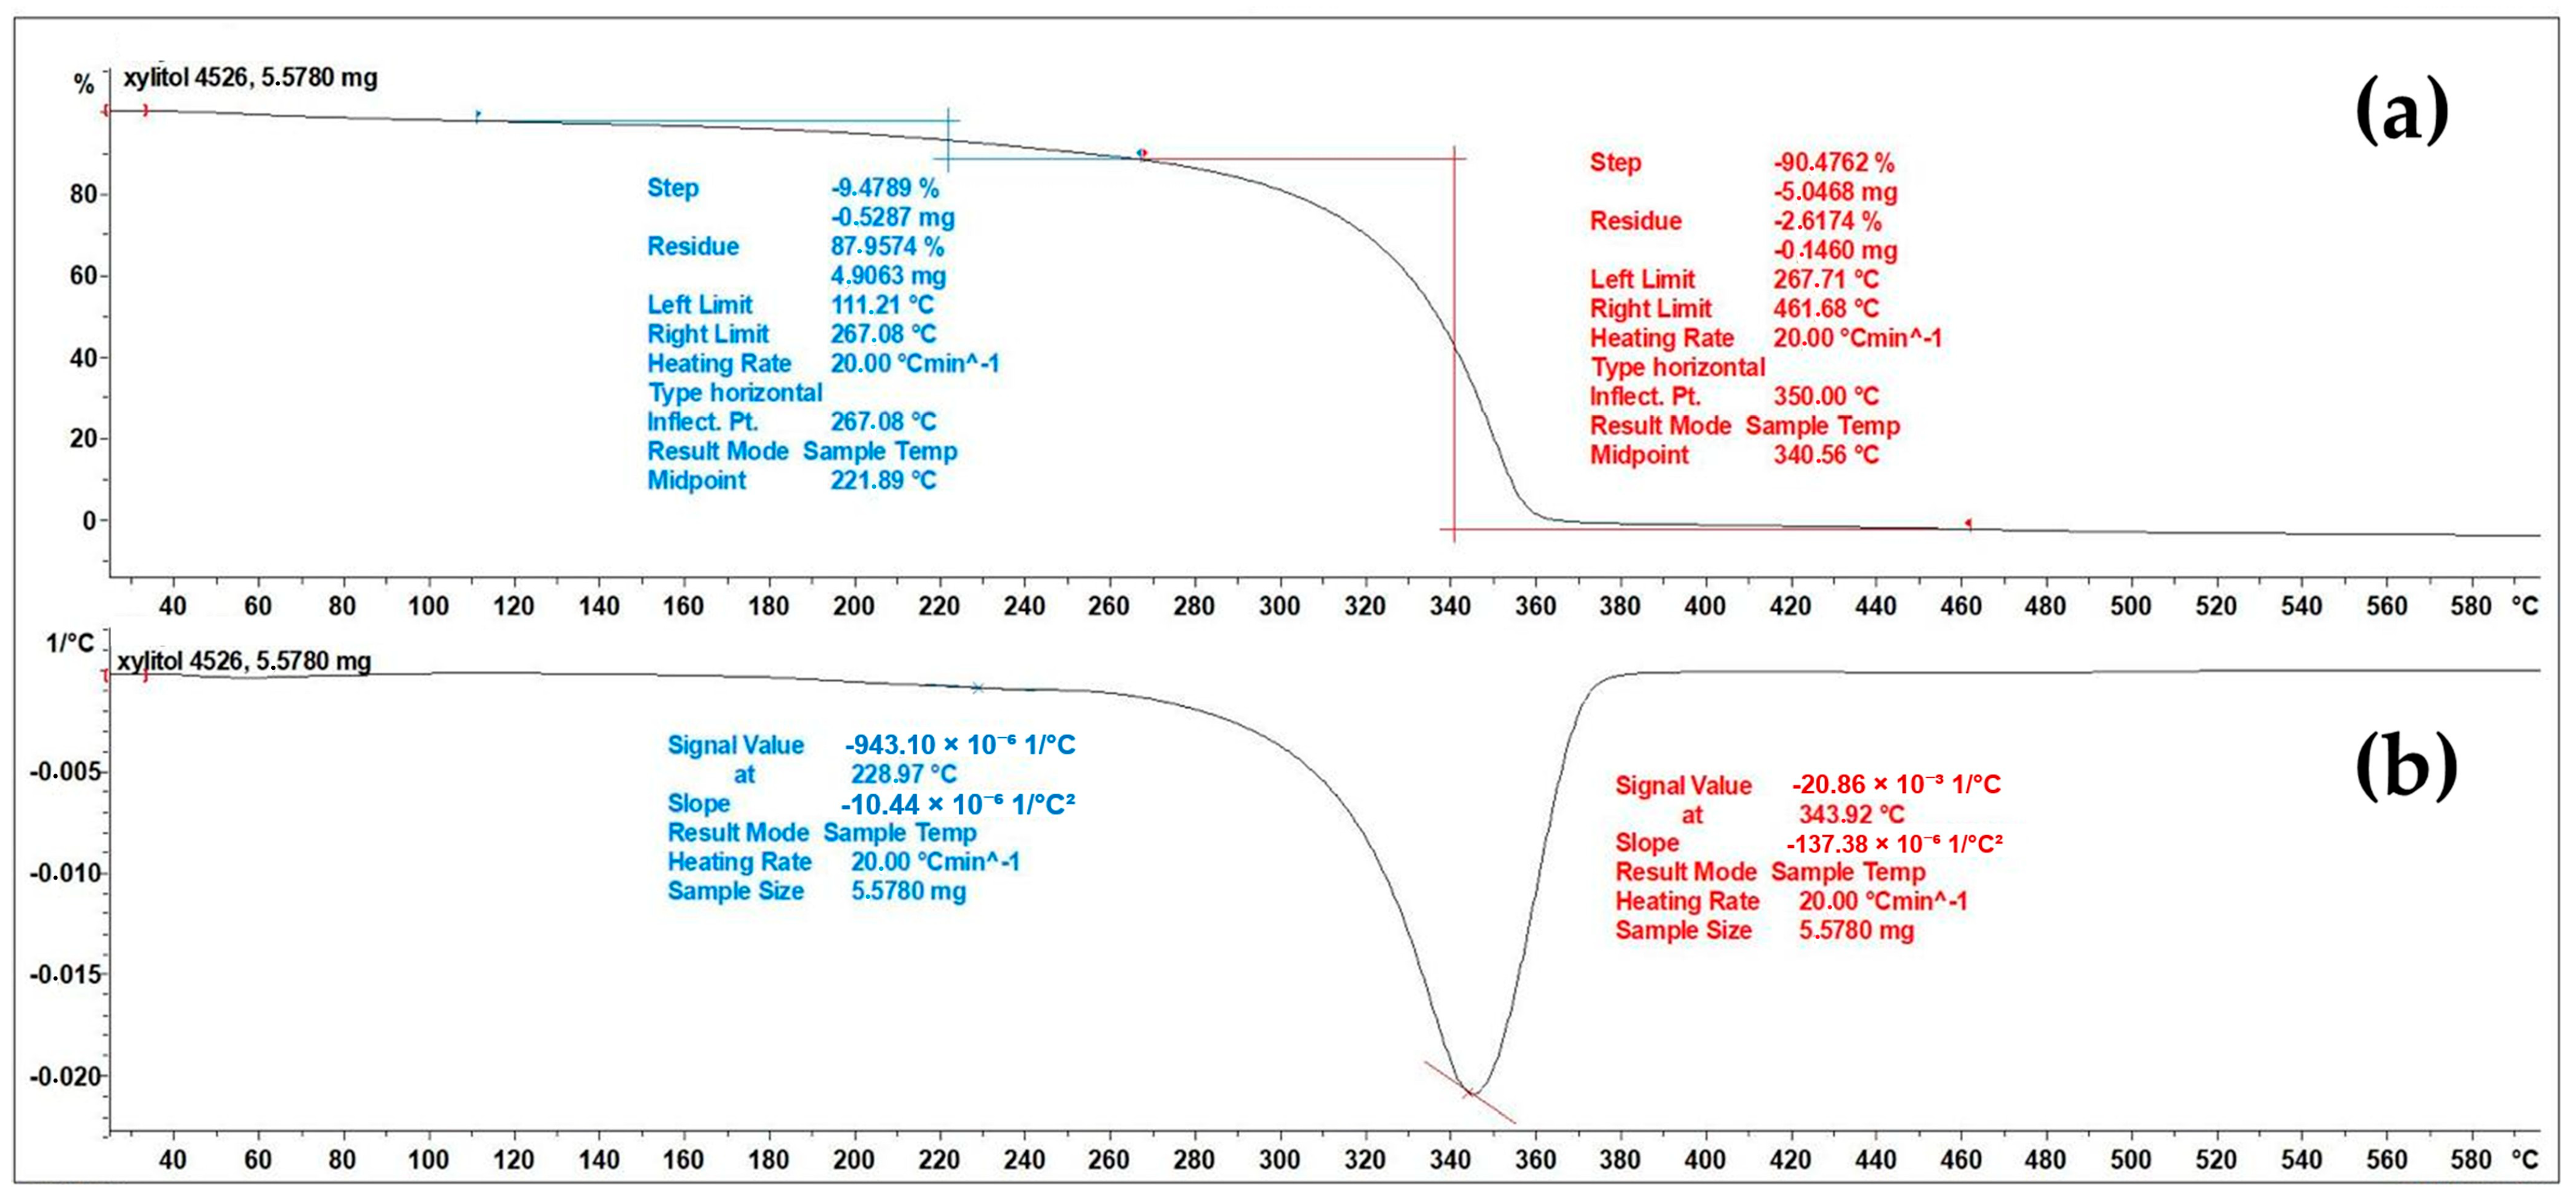
The melting temperature of the obtained xylitol sample (83.9 °C) was lower than the reported value for pure xylitol (94–95 °C) [41]. Thermogravimetric analysis (TGA) was performed to clarify this discrepancy. As shown in Figure 9, no mass loss was detected within the melting region (70–100 °C), indicating that volatile components did not influence the melting transition. A minor mass loss (~9.47%) occurred only above ~111 °C, which could be attributed to the release of bound moisture or weakly retained species. These results indicated that the sample remained thermally stable during melting. Therefore, the observed melting point depression is unlikely to be associated with volatile impurities. Instead, this behavior is consistent with the structural and compositional effects commonly reported for polyol systems [42]. Reduced crystal size, lattice imperfections, and partial amorphous content are known to broaden and shift melting transitions. In addition, the presence of structurally similar polyols such as arabitol may lead to solid-solution formation within the crystal lattice, resulting in melting point depression without associated mass loss. This interpretation is further supported by the XRD results, which show a crystalline structure with slight peak broadening, indicating reduced crystallinity.
Figure 9.
TGA of the obtained xylitol sample. (a) TG curve showing mass loss behavior as a function of temperature. No measurable mass loss was observed within the DSC melting region (70–100 °C), indicating that volatile species do not significantly influence the melting transition. A minor mass loss (~9.47%) occurred above ~111 °C, while the major decomposition step was observed at ~300–350 °C. (b) Derivative thermogravimetry (DTG) curve showing the rate of mass loss and the maximum decomposition rate near 340–350 °C.
3.7.3. Crystallinity Assessment by XRD
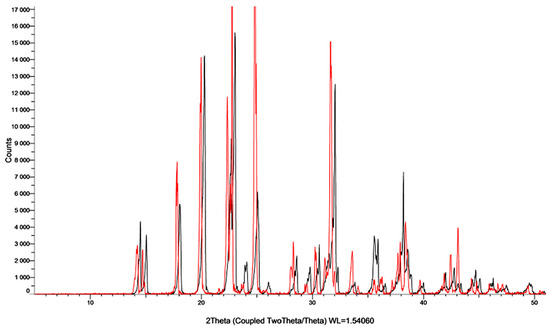
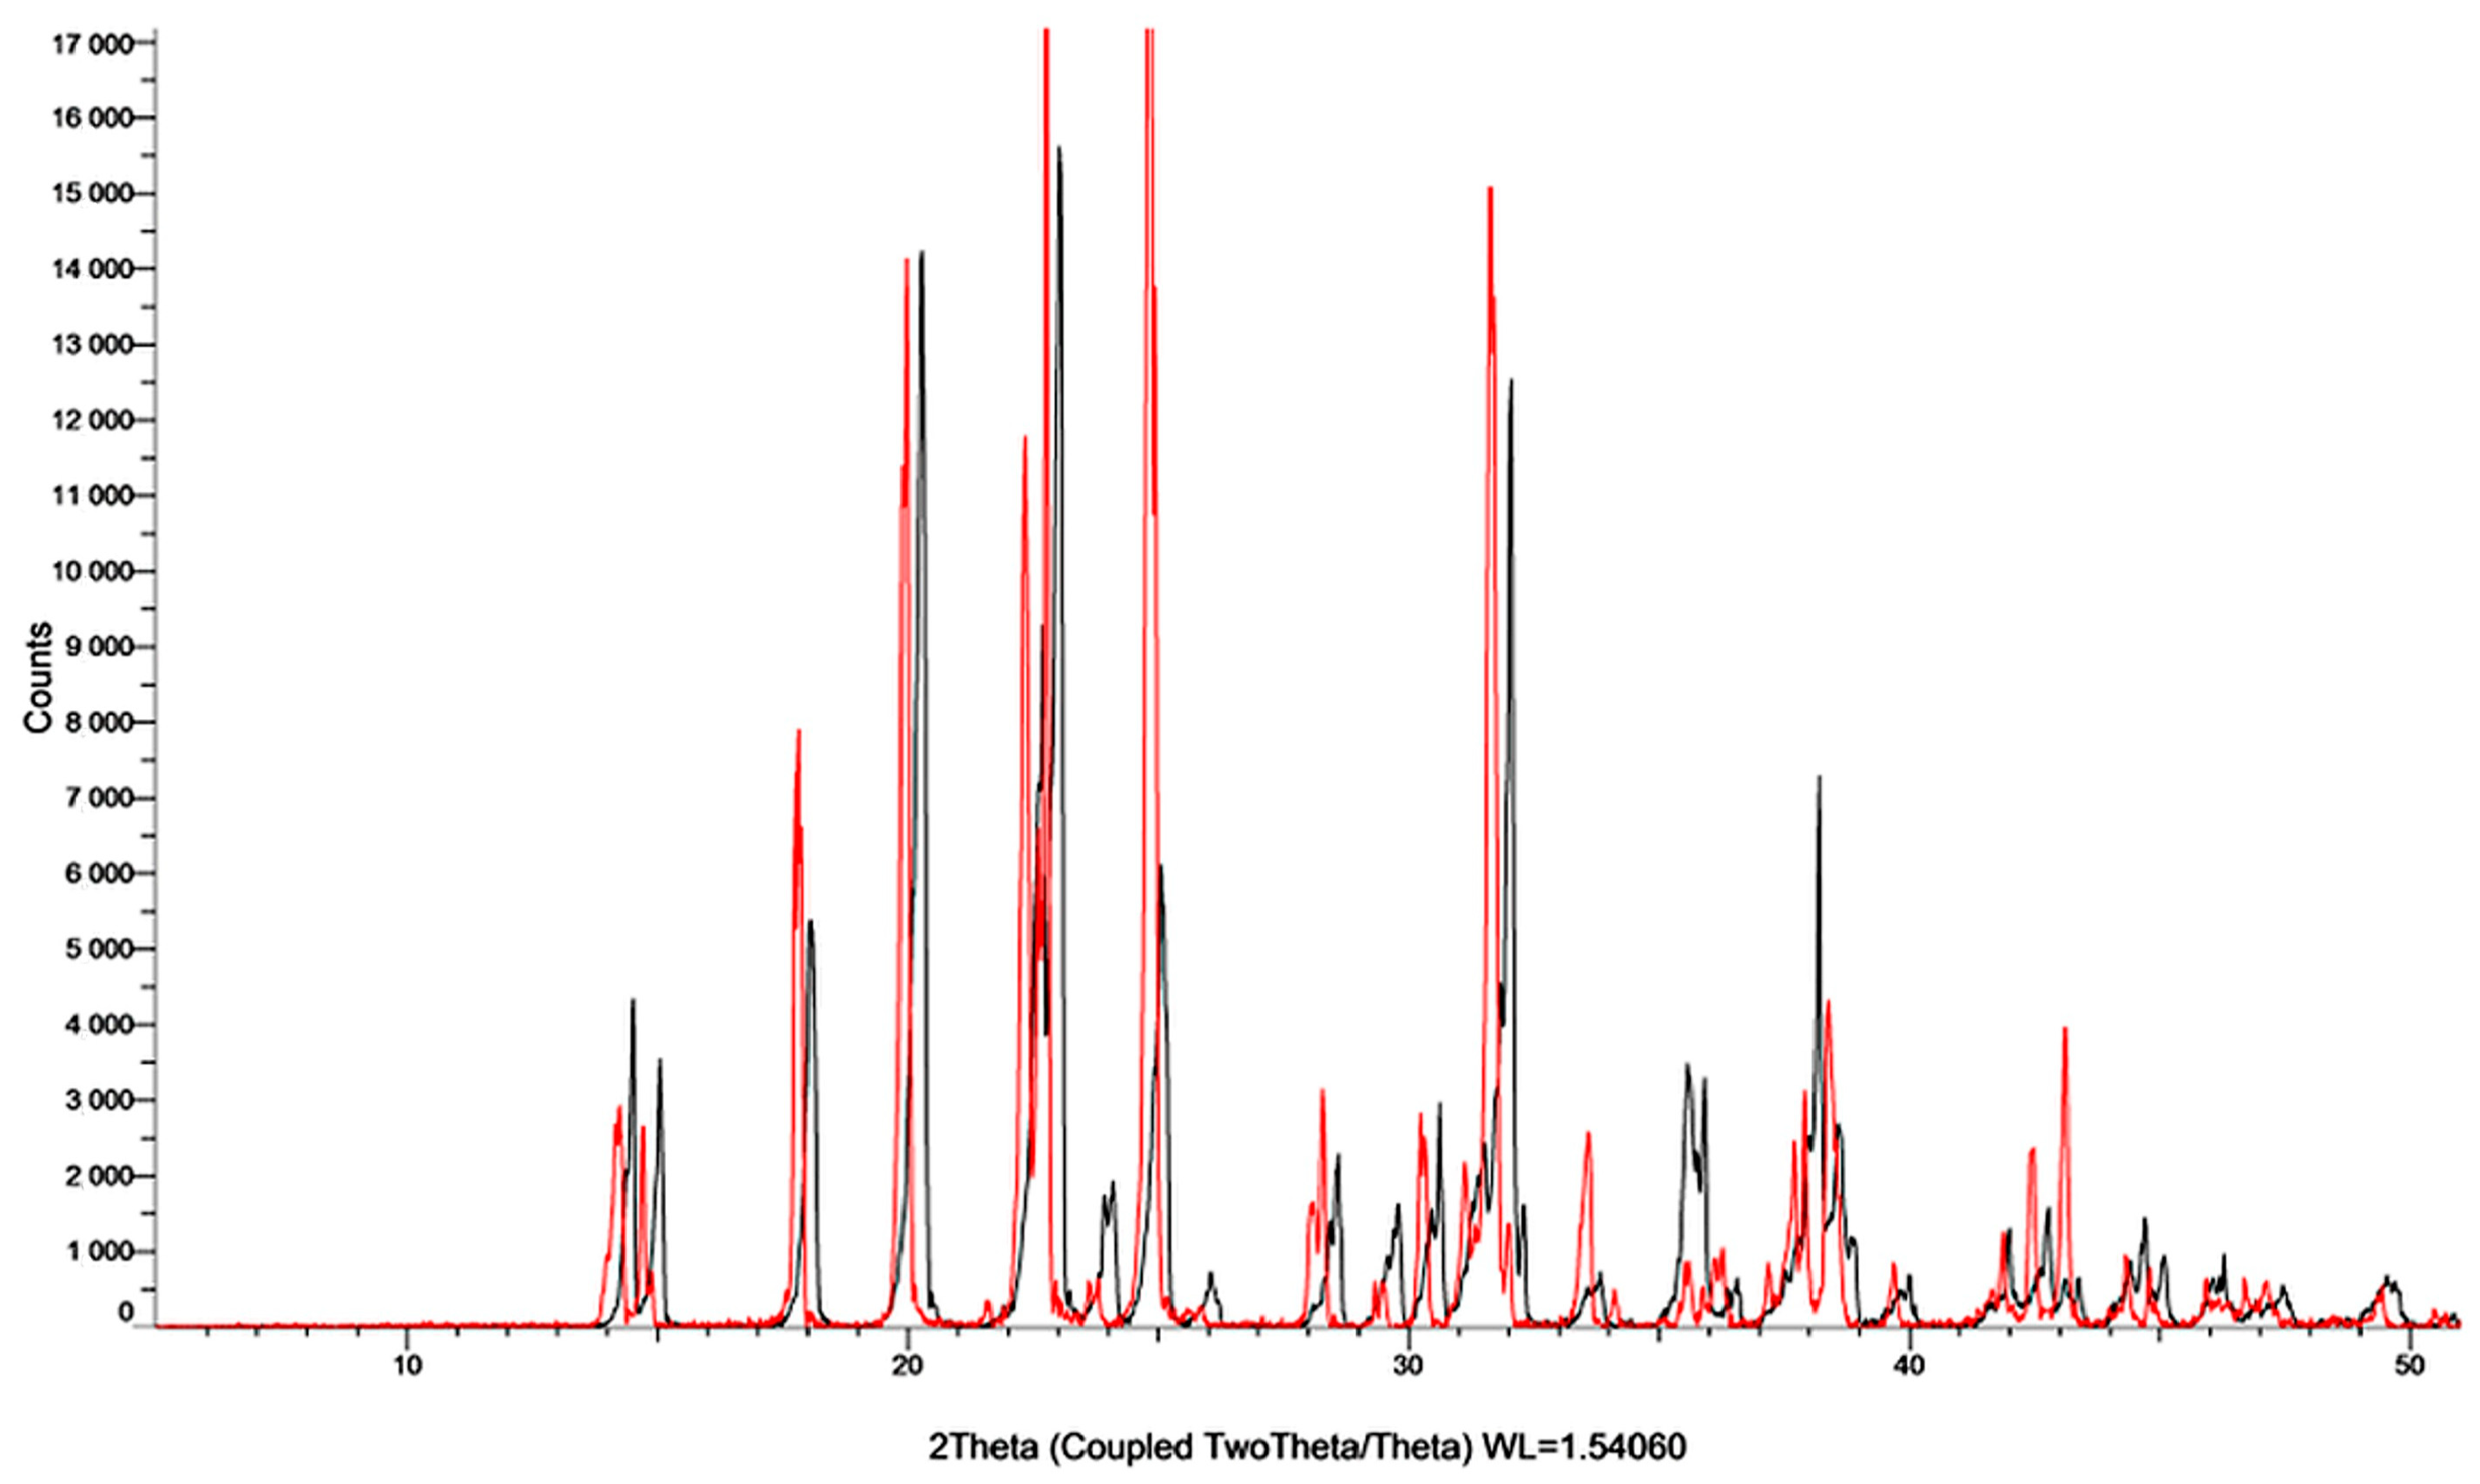
X-ray diffraction (XRD) analysis was performed on the xylitol sample obtained by catalytic hydrogenation, and the results are presented in Figure 10. XRD patterns were examined in the 2θ region in the 5–50° range, and the crystallographic properties and crystallinity levels of the obtained crystals were evaluated. In Figure 10, the red curve represents the commercial xylitol standard and the black curve represents the experimentally obtained xylitol sample.
Figure 10.
X-ray diffraction (XRD) analysis of the xylitol sample obtained by catalytic hydrogenation (black) and the commercial xylitol (red).
Examination of the diffractogram showed that the characteristic peaks in the commercial xylitol sample were sharper, more intense, and more regular. In contrast, while similar peak regions were preserved in the experimentally obtained xylitol sample, it is noteworthy that the peak intensities were lower and peak broadening was present in some regions. It is believed that impurities, especially those forming amorphous or semi-crystalline structures, reduce the crystallinity level by decreasing the intensity of the characteristic xylitol peaks. Similarly, Palomäki et al. (2016) reported that crystalline xylitol produced sharper and more intense diffraction peaks than amorphous xylitol, confirming that the peak intensity is directly associated with the crystal order [22]. The results obtained in this study indicate that the experimental product formed a crystalline structure comparable to that of commercial xylitol, although minor differences in the diffraction intensity were observed.
3.8. Apparent Kinetic Evaluation Under Different Stirring Conditions
To further evaluate hydrogenation performance under optimized conditions, apparent reaction rates were estimated using HPLC-derived xylitol yields obtained at different stirring speeds, and the apparent average formation rate was estimated from the final yield divided by the reaction time [43].
For 400 rpm, the value is as follows:
For 800 rpm, the value is as follows:
At 400 rpm, xylitol formation reached 86.61% after 60 min, corresponding to an apparent formation rate of 1.44% min−1. Under the same reaction duration, increasing the stirring speed to 800 rpm increased xylitol yield to 98.01%, corresponding to an apparent formation rate of 1.63% min−1. This represents an approximately 13.2% increase in the apparent reaction rate, indicating that external mass transfer may influence hydrogen availability at the catalyst surface. In addition, arabitol concentration decreased markedly from 7.37% at 400 rpm to 0.70% at 800 rpm, suggesting that improved hydrogen transfer suppressed competing side reactions and enhanced selectivity toward xylitol formation. The nearly complete disappearance of residual xylose at 800 rpm further confirmed the improved substrate conversion efficiency. Hydrogen transport and reaction rate increases may have occurred, as reported in the literature [44]. A complete comparison of the rates is presented in Table 5.
Table 5.
Product distribution and apparent formation rate under different stirring speeds after 60 min catalytic hydrogenation.
The effect of stirring speed on xylitol yield clearly indicates the presence of mass transfer limitations in the system. Increasing the stirring rate from 400 to 800 rpm resulted in a significant increase in yield (from 86.61% to 98.01%), suggesting that gas–liquid–solid mass transfer plays a critical role. At lower stirring speeds, the external mass transfer resistance limits hydrogen transport from the gas phase to the liquid phase and, subsequently, to the catalyst surface. Increasing the mixing intensity enhances the hydrogen solubility and reduces the boundary layer thickness, thereby improving the hydrogen availability at the active sites.
The apparent reaction rate increased from 1.44 to 1.63% min−1 (13.2% increase), further supporting that the system was partially controlled by mass transfer. These findings are consistent with the literature reports indicating that hydrogen diffusion and mass transfer strongly affect the catalytic hydrogenation performance of Raney Ni systems [35,45]. This suggests that the RSM-derived optimum corresponds to a condition influenced by transport limitations, rather than purely intrinsic kinetics.
A preliminary engineering estimation was performed to evaluate the effect of stirring speed on the process energy demand. According to classical mixing theory, the mixing power scales approximately with the cube of the rotational speed (P ∝ N3) [46]. Therefore, increasing the stirring speed from 400 to 800 rpm may result in an approximately eight-fold increase in power consumption under comparable operating conditions. Based on a representative laboratory-scale estimation, the energy demand for a 1 h reaction may increase from approximately 0.2 kWh at 400 rpm to approximately 1.6 kWh at 800 rpm. In contrast, the corresponding increase in xylitol yield was approximately 10–12%. These findings suggest that the improvement in yield is not directly proportional to the increase in energy consumption, highlighting the importance of balancing hydrodynamic performance and process efficiency. Therefore, intermediate stirring speeds may provide a more favorable compromise between energy consumption and xylitol yield, and should be investigated in future optimization studies.
3.9. Principal Component Analysis (PCA)
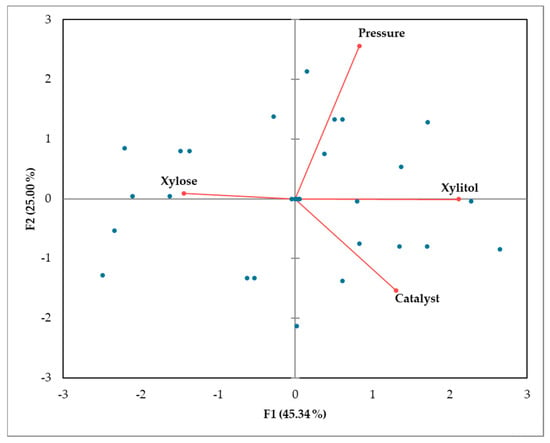
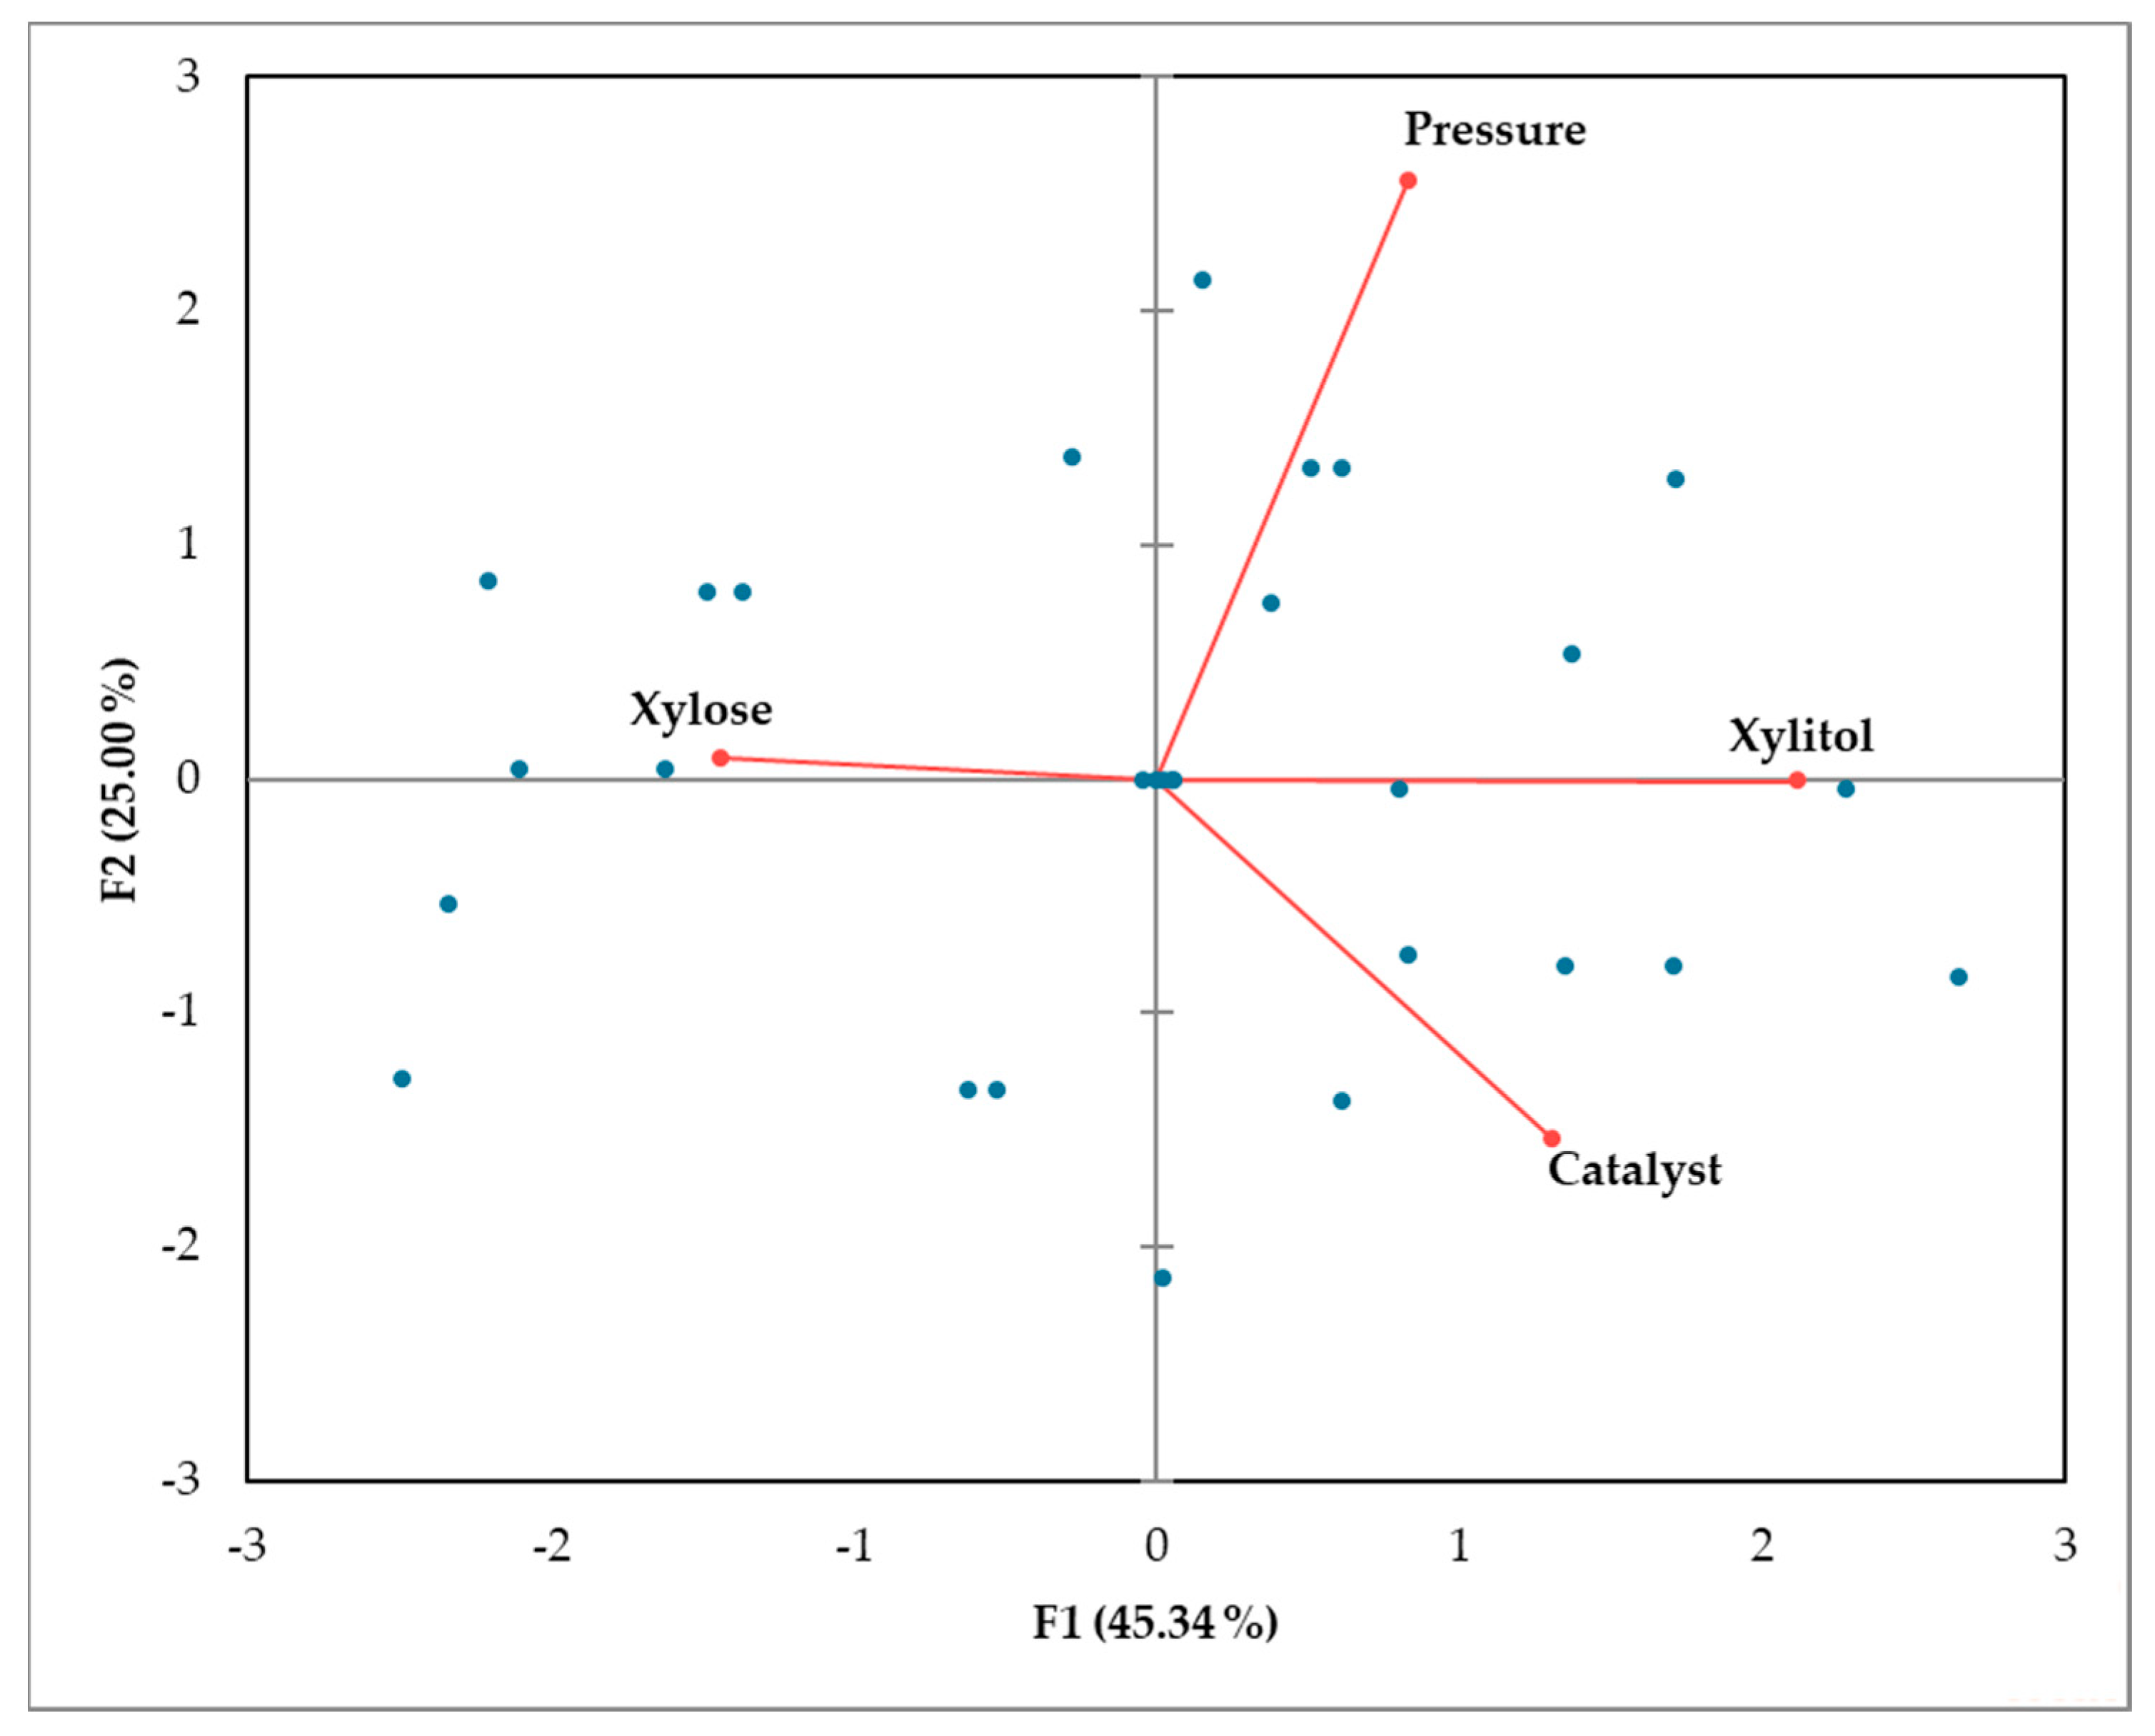
PCA was applied to thoroughly evaluate the relationships between xylitol yield and key process variables in the catalytic hydrogenation process (Figure 11). The first two principal components explained 70.34% of the total variance, with the first principal component (F1) representing 45.34%, and the second principal component (F2) representing 25.00%. This result indicates that the selected variables can explain a large portion of the variation in the experimental system. The biplot graph shows that the xylitol yield and catalyst amount were positioned in the same direction as the first principal component. This indicates a positive relationship between the catalyst amount and xylitol yield. The PCA result is consistent with the regression model, which showed that the catalyst amount is one of the key factors determining xylitol formation. An increase in the amount of catalyst supports the hydrogenation reaction by increasing the active surface area, thus increasing xylitol formation. The xylose concentration in the first base component was positioned opposite to the xylitol yield. This confirmed that an increase in xylose concentration negatively affected xylitol yield within the studied experimental range. The Response Surface Methodology results also showed that a lower xylose concentration was more suitable for the optimum yield. Increasing the substrate concentration can reduce the conversion efficiency by increasing the viscosity of the reaction medium and limiting the hydrogen transfer to the catalyst surface. The hydrogen pressure exhibits a more pronounced trend in the second base component. This indicates that pressure contributes to the system, partially independent of the catalyst amount and xylose concentration. It is thought that an increase in hydrogen pressure improves the gas–liquid phase transfer, increasing the amount of dissolved hydrogen and thus supporting the hydrogenation reaction. The PCA findings were consistent with the optimization results obtained using the Response Surface Methodology. According to the regression model, the optimum operating conditions were determined as 40 g catalyst amount, 25% xylose concentration, and 60 bar hydrogen pressure. Under these conditions, the theoretical maximum xylitol yield was estimated to be 87.26%. Experimental verification under the same conditions resulted in a xylitol yield of 86.61%. The small difference between the predicted and experimentally obtained results indicates that the model successfully represents the system’s behavior. Overall, both the multivariate analysis and regression model results show that the catalyst amount and hydrogen pressure are the main parameters that increase xylitol formation, while an increase in xylose concentration has a limiting effect on process efficiency.
Figure 11.
PCA biplot showing relationships between xylitol yield and significant process variables. Blue points represent active observations; red points represent active variables.
3.10. ICP-MS Analysis of Nickel Residue
The nickel residue was also determined in the obtained crystalline xylitol using ICP-MS. According to these analysis results, the amount of nickel residue in xylitol was determined to be an average of 0.8 ± 0.1 mg/kg. According to the “Turkish Food Codex Regulation on Purity Criteria for Sweeteners Used in Foodstuffs (Regulation No: 2010/59)” published in the Official Gazette, xylitol, which is classified in the sweetener group with code E967, should not have a nickel limit exceeding 2 mg/kg on a dry matter basis [47].
The catalyst was recovered after the reaction, thoroughly washed, and dried in a laboratory oven before reuse under identical operating conditions. A decrease in xylitol yield from 98.0% in the first cycle to 92.5% in the second cycle was observed, corresponding to an apparent loss of catalytic activity of approximately 5.6%. This relatively low loss of activity suggests that the Raney Ni catalyst retained good short-term stability under the applied reaction conditions. The slight decrease in activity may be attributed to surface fouling and/or minor metal leaching, which are commonly reported for heterogeneous Ni-based catalysts. This behavior is consistent with previous studies on Raney Ni-catalyzed xylose hydrogenation, where catalyst deactivation during reuse due to surface fouling and metal leaching has been widely reported [48,49].
In support of this interpretation, ICP-MS analysis of the final product revealed a residual nickel concentration of 0.8 ± 0.1 mg/kg, which is well below the regulatory limit (2 mg/kg), indicating that significant metal leaching is unlikely under the applied conditions. Nevertheless, a more comprehensive evaluation of the catalyst’s stability, including multi-cycle reuse and detailed physicochemical characterization, is warranted and will be addressed in future work.
4. Conclusions
In this study, the production of xylitol by the catalytic hydrogenation of xylose in a pressurized batch reactor using a Raney nickel catalyst was evaluated using multivariate statistical approaches, and the key parameters affecting the process were identified. This study demonstrated that integrating statistical optimization with hydrodynamic evaluation and multi-technique product validation provides a more comprehensive understanding of xylitol production systems than conventional approaches. The combined evaluation of regression analysis and principal component analysis indicated that catalyst loading is one of the most significant factors promoting xylitol formation, while hydrogen pressure contributes positively, and increasing xylose concentration limits the process yield. Model-based optimization was found to be consistent with experimental validation. The regression model reliably represented the catalytic hydrogenation system. Chromatographic, thermal, and crystallographic analyses performed after the optimization studies confirmed that the target product retained its characteristics. Increasing the mixing speed significantly improves the reaction performance. The fact that mixing speed increases the product yield suggests that it may also be closely related to reactor hydrodynamics. This study demonstrated that the simultaneous optimization of process variables is critical for product yield in catalytic xylitol production. Simultaneously controlling the catalyst load, hydrogen transfer, and mixing efficiency enables more efficient product production. This study provides significant data to the literature as a process optimization study applicable from the laboratory to the pilot scale. Future studies should be conducted to investigate the effects of mixing speed on product yield in more detail.
Author Contributions
Conceptualization, O.K. and N.B.D.; methodology, N.B.D.; software, S.L.İ.; validation, O.K., E.P. and N.B.D.; formal analysis, S.L.İ.; investigation, N.B.D., S.L.İ. and E.P.; resources, O.K.; data curation, E.P.; writing—original draft preparation, S.L.İ. and N.B.D.; writing—review and editing, S.L.İ. and O.K.; visualization, E.P.; supervision, O.K.; project administration, O.K.; funding acquisition, O.K. All authors have read and agreed to the published version of the manuscript.
Funding
This research received no external funding.
Data Availability Statement
Data reported in this study are available in this article.
Acknowledgments
The authors gratefully acknowledge Adana Alparslan Türkeş Science and Technology University and Sunar Misir Integrated Facilities Industry and Trade Inc. for their valuable non-financial support during Nur Beliz Döğer’s thesis studies and the additional analyses conducted in this study. Figure 1 was created using the BioRender.com software.
Conflicts of Interest
Author Nur Beliz Döğer was employed by the company Sunar Misir Integrated Facilities Industry and Trade Inc. The remaining authors declare that the research was conducted in the absence of any commercial or financial relationships that could be construed as a potential conflict of interest. The company had no role in the design of the study; in the collection, analyses, or interpretation of data; in the writing of the manuscript, or in the decision to publish the results.
Abbreviations
The following abbreviations are used in this manuscript:
| CCD | Central Composite Design |
| RSM | Response Surface Methodology |
| ANOVA | Analysis of Variance |
| HPLC | High-Performance Liquid Chromatography |
| XRD | X-ray Diffraction |
| DSC | Differential Scanning Calorimetry |
| ICP-MS | Inductively Coupled Plasma Mass Spectrometry |
| PCA | Principal Component Analysis |
| RID | Refractive Index Detector |
| RMSE | Root Mean Square Error |
| AICc | Corrected Akaike Information Criterion |
| BIC | Bayesian Information Criterion |
References
- İpek, S.L.; Göktürk, D. Industry 4.0 Approaches in Food and Bio Industry: Recent Developments and Future Trends. Adv. Artif. Intell. Res. 2021, 1, 29–42. [Google Scholar]
- Mabeta, J.; Smutka, L. Historical and Contemporary Perspectives of the Sugar Industry in Sub-Saharan Africa. Ukr. Food J. 2023, 12, 157–171. [Google Scholar] [CrossRef] [Scilit]
- İpek, S.L.; Göktürk, D. Application of Multi-Criteria Decision Making Methods for Menu Selection. Black Sea J. Eng. Sci. 2024, 7, 21–30. [Google Scholar] [CrossRef] [Scilit]
- Du, H.; Ma, X.; Jiang, M.; Zhao, S.; Fang, Q.; Liu, X.; Zhang, Z.C. Xylitol Production from Xylose by Catalytic Hydrogenation over an Efficient Cu–Ni/SiO2 Bimetallic Catalyst. ACS Sustain. Chem. Eng. 2023, 11, 2115–2126. [Google Scholar] [CrossRef] [Scilit]
- Dragomir, N.; Grigore, D.-M.; Pogurschi, E.N. Beyond Sugar: A Holistic Review of Sweeteners and Their Role in Modern Nutrition. Foods 2025, 14, 3182. [Google Scholar] [CrossRef] [Scilit]
- Msomi, N.Z.; Erukainure, O.L.; Salau, V.F.; Olofinsan, K.A.; Islam, M.S. Comparative Effects of Xylitol and Erythritol on Modulating Blood Glucose; Inducing Insulin Secretion; Reducing Dyslipidemia and Redox Imbalance in a Type 2 Diabetes Rat Model. Food Sci. Hum. Wellness 2023, 12, 2052–2060. [Google Scholar] [CrossRef] [Scilit]
- Pandey, N.; Ahmad, D.; Hasan, M.; Choudhary, D.K.; Kumar, A.; Tripathi, M.K.; Siddiqui, S.A.; Shah, M.A. Current Trends in the Production of Xylitol and Paving the Way for Metabolic Engineering in Microbes. Biotechnol. Biofuels Bioprod. 2025, 18, 106. [Google Scholar] [CrossRef] [Scilit] [PubMed]
- Ullah, N.; Jérôme, F.; De Oliveira Vigier, K. Hydrogenation of Xylose to Xylitol in the Presence of Bimetallic Nanoparticles Ni3Fe Catalyst in the Presence of Choline Chloride. Catalysts 2022, 12, 841. [Google Scholar] [CrossRef] [Scilit]
- Sadier, A.; Shi, D.; Mamede, A.-S.; Paul, S.; Marceau, E.; Wojcieszak, R. Selective Aqueous Phase Hydrogenation of Xylose to Xylitol over SiO2-Supported Ni and Ni-Fe Catalysts: Benefits of Promotion by Fe. Appl. Catal. B Environ. 2021, 298, 120564. [Google Scholar] [CrossRef] [Scilit]
- Vilcocq, L.; Paez, A.; Freitas, V.D.S.; Veyre, L.; Fongarland, P.; Philippe, R. Unexpected Reactivity Related to Support Effects during Xylose Hydrogenation over Ruthenium Catalysts. RSC Adv. 2021, 11, 39387–39398. [Google Scholar] [CrossRef] [Scilit]
- Su, C.; Zou, S.; Li, J.; Wang, L.; Huang, J. Supporting Nano Catalysts for the Selective Hydrogenation of Biomass-Derived Compounds. ChemSusChem 2024, 17, e202400602. [Google Scholar] [CrossRef] [Scilit]
- Delgado Arcaño, Y.; Valmaña García, O.D.; Mandelli, D.; Carvalho, W.A.; Magalhães Pontes, L.A. Xylitol: A Review on the Progress and Challenges of Its Production by Chemical Route. Catal. Today 2020, 344, 2–14. [Google Scholar] [CrossRef] [Scilit]
- Bezerra, M.A.; Santelli, R.E.; Oliveira, E.P.; Villar, L.S.; Escaleira, L.A. Response Surface Methodology (RSM) as a Tool for Optimization in Analytical Chemistry. Talanta 2008, 76, 965–977. [Google Scholar] [CrossRef] [Scilit]
- Myers, R.H.; Montgomery, D.C. Response Surface Methodology. IIE Trans. 1996, 28, 1031–1032. [Google Scholar] [CrossRef] [Scilit]
- Bhavsar, K.; Sundar, S.K.; Parikh, J. Hydrogenation of Xylose to Xylitol: Interactive Parametric, Optimization and Kinetic Study. Chem. Pap. 2025, 79, 4229–4246. [Google Scholar] [CrossRef] [Scilit]
- Salmi, T.; Barahona, G.A.; Najarnezhadmashhadi, A.; Braz, C.; Torres, A.G.; Ciaramella, M.; Ares, E.; Russo, V.; Serna, J.G.; Eränen, K.; et al. Process Intensification via Structured Catalysts: Production of Sugar Alcohols. Chem. Ing. Tech. 2024, 96, 1642–1656. [Google Scholar] [CrossRef] [Scilit]
- Santos, J.R.; Diel Rambo, M.K.; Scapin, E. Recent Advances in Xylitol Production in Biorefineries from Lignocellulosic Biomass: A Review Study. Rev. Bras. Ciênc. Ambient. 2024, 59, e1814. [Google Scholar] [CrossRef] [Scilit]
- Aigner, D.J.; Hinterholzer, L.; Almhofer, L.; Bischof, R.H.; Wrodnigg, T. Conversion of Xylose into D-Xylitol Using Catalytic Transfer Hydrogenation with Formic Acid as H-Donor. BioResources 2023, 18, 8631–8652. [Google Scholar] [CrossRef] [Scilit]
- Araújo, D.; Costa, T.; Freitas, F. Biovalorization of Lignocellulosic Materials for Xylitol Production by the Yeast Komagataella Pastoris. Appl. Sci. 2021, 11, 5516. [Google Scholar] [CrossRef] [Scilit]
- Zhang, H.; Duquesne, M.; Godin, A.; Niedermaier, S.; Palomo del Barrio, E.; Nedea, S.V.; Rindt, C.C.M. Experimental and in Silico Characterization of Xylitol as Seasonal Heat Storage Material. Fluid Phase Equilibria 2017, 436, 55–68. [Google Scholar] [CrossRef] [Scilit]
- Brown, M.E. Thermogravimetry (TG). In Introduction to Thermal Analysis: Techniques and Applications; Brown, M.E., Ed.; Springer: Dordrecht, The Netherlands, 1988; pp. 7–22. [Google Scholar]
- Palomäki, E.; Ahvenainen, P.; Ehlers, H.; Svedström, K.; Huotari, S.; Yliruusi, J. Monitoring the Recrystallisation of Amorphous Xylitol Using Raman Spectroscopy and Wide-Angle X-Ray Scattering. Int. J. Pharm. 2016, 508, 71–82. [Google Scholar] [CrossRef] [Scilit] [PubMed]
- Huang, M.; Li, X. Quantitative Detection of Toxic Elements in Food Samples by Inductively Coupled Plasma Mass Spectrometry (ICP-MS). Processes 2025, 13, 3361. [Google Scholar] [CrossRef] [Scilit]
- Jolliffe, I.T.; Cadima, J. Principal Component Analysis: A Review and Recent Developments. Philos. Trans. A Math. Phys. Eng. Sci. 2016, 374, 20150202. [Google Scholar] [CrossRef] [Scilit]
- Demirel, M.; Kayan, B. Application of Response Surface Methodology and Central Composite Design for the Optimization of Textile Dye Degradation by Wet Air Oxidation. Int. J. Ind. Chem. 2012, 3, 24. [Google Scholar] [CrossRef] [Scilit]
- Ahmadi, S.; Mohammadi, L.; Igwegbe, C.A.; Rahdar, S.; Banach, A.M. Application of Response Surface Methodology in the Degradation of Reactive Blue 19 Using H2O2/MgO Nanoparticles Advanced Oxidation Process. Int. J. Ind. Chem. 2018, 9, 241–253. [Google Scholar] [CrossRef] [Scilit]
- Urréjola-Madriñán, S.; Paz-Armada, I.; Cameselle, C.; Gouveia, S. Application of Central Composite Design for Optimization of Adsorption of Chromium(VI) by Spirulina Platensis Algae Biomass. Water 2022, 14, 2539. [Google Scholar] [CrossRef] [Scilit]
- De Faveri, D.; Torre, P.; Perego, P.; Converti, A. Optimization of Xylitol Recovery by Crystallization from Synthetic Solutions Using Response Surface Methodology. J. Food Eng. 2004, 61, 407–412. [Google Scholar] [CrossRef] [Scilit]
- Chen, H.-Y.; Chen, C. Importance of Using Modern Regression Analysis for Response Surface Models in Science and Technology. Appl. Sci. 2025, 15, 7206. [Google Scholar] [CrossRef] [Scilit]
- Xia, H.; Zhang, L.; Hu, H.; Zuo, S.; Yang, L. Efficient Hydrogenation of Xylose and Hemicellulosic Hydrolysate to Xylitol over Ni-Re Bimetallic Nanoparticle Catalyst. Nanomaterials 2020, 10, 73. [Google Scholar] [CrossRef] [Scilit] [PubMed]
- Sifontes Herrera, V.A.; Rivero Mendoza, D.E.; Leino, A.-R.; Mikkola, J.-P.; Zolotukhin, A.; Eränen, K.; Salmi, T. Sugar Hydrogenation in Continuous Reactors: From Catalyst Particles towards Structured Catalysts. Chem. Eng. Process.-Process Intensif. 2016, 109, 1–10. [Google Scholar] [CrossRef] [Scilit]
- Mikkola, J.-P.; Sjöholm, R.; Salmi, T.; Mäki-Arvela, P. Xylose Hydrogenation: Kinetic and NMR Studies of the Reaction Mechanisms. Catal. Today 1999, 48, 73–81. [Google Scholar] [CrossRef] [Scilit]
- Yang, X.; Li, X.; Zhao, J.; Liang, J.; Zhu, J. Production of Sorbitol via Hydrogenation of Glucose over Ruthenium Coordinated with Amino Styrene-Co-Maleic Anhydride Polymer Encapsulated on Activated Carbon (Ru/ASMA@AC) Catalyst. Molecules 2023, 28, 4830. [Google Scholar] [CrossRef] [Scilit]
- Barone, A.; De Liso, B.A.; Grénman, H.; Eränen, K.; Taddeo, F.; Imparato, C.; Aronne, A.; Russo, V.; Di Serio, M.; Salmi, T. Xylose Hydrogenation Promoted by Ru/SiO2 Sol–Gel Catalyst: From Batch to Continuous Operation. Processes 2024, 12, 27. [Google Scholar] [CrossRef] [Scilit]
- Mikkola, J.-P.; Vainio, H.; Salmi, T.; Sjöholm, R.; Ollonqvist, T.; Väyrynen, J. Deactivation Kinetics of Mo-Supported Raney Ni Catalyst in the Hydrogenation of Xylose to Xylitol. Appl. Catal. A Gen. 2000, 196, 143–155. [Google Scholar] [CrossRef] [Scilit]
- Rodrigues, R.C.L.B.; Felipe, M.d.G.A.; Almeida e Silva, J.B.; Vitolo, M. Response Surface Methodology for Xylitol Production from Sugarcane Bagasse Hemicellulosic Hydrolyzate Using Controlled Vacuum Evaporation Process Variables. Process Biochem. 2003, 38, 1231–1237. [Google Scholar] [CrossRef] [Scilit]
- Ling, H.; Cheng, K.; Ge, J.; Ping, W. Statistical Optimization of Xylitol Production from Corncob Hemicellulose Hydrolysate by Candida Tropicalis HDY-02. New Biotechnol. 2011, 28, 673–678. [Google Scholar] [CrossRef] [Scilit]
- Mikkola, J.-P.; Salmi, T.; Villela, A.; Vainio, H.; Mäki-Arvela, P.; Kalantar, A.; Ollonqvist, T.; Väyrynen, J.; Sjöholm, R. Hydrogenation of Xylose to Xylitol on Sponge Nickel Catalyst: A Study of the Process and Catalyst Deactivation Kinetics. Braz. J. Chem. Eng. 2003, 20, 263–271. [Google Scholar] [CrossRef] [Scilit]
- Keçeli, N.; Parıldı, E.; İpek, S.L.; Kola, O. Vacuum Microwave Drying as an Efficient Alternative to Hot Air Drying: Optimization, Drying Kinetics, and Quality Retention of Washington Navel Orange Slices. Appl. Sci. 2026, 16, 3530. [Google Scholar] [CrossRef] [Scilit]
- Piquard, L.; Gagnière, E.; Largiller, G.; Mangin, D.; Bentivoglio, F. Xylitol Used as Phase Change Material: Nucleation Mechanisms of the Supercooling Rupture by Stirring. J. Energy Storage 2022, 48, 103922. [Google Scholar] [CrossRef] [Scilit]
- Biçer, A.; Sarı, A. Synthesis and Thermal Energy Storage Properties of Xylitol Pentastearate and Xylitol Pentapalmitate as Novel Solid–Liquid PCMs. Sol. Energy Mater. Sol. Cells 2012, 102, 125–130. [Google Scholar] [CrossRef] [Scilit]
- Yu, L. Amorphous Pharmaceutical Solids: Preparation, Characterization and Stabilization. Adv. Drug Deliv. Rev. 2001, 48, 27–42. [Google Scholar] [CrossRef] [Scilit]
- Hilpmann, G.; Kurzhals, P.; Reuter, T.; Ayubi, M.M. Reaction Kinetics of One-Pot Xylan Conversion to Xylitol via Precious Metal Catalyst. Front. Chem. Eng. 2020, 2, 600936. [Google Scholar] [CrossRef] [Scilit]
- Yadav, M.; Mishra, D.K.; Hwang, J.-S. Catalytic Hydrogenation of Xylose to Xylitol Using Ruthenium Catalyst on NiO Modified TiO2 Support. Appl. Catal. A Gen. 2012, 425–426, 110–116. [Google Scholar] [CrossRef] [Scilit]
- Mikkola, J.-P.; Salmi, T.; Sjöholm, R. Kinetic and Mass-Transfer Effects in the Hydrogenation of Xylose to Xylitol. In Studies in Surface Science and Catalysis; Elsevier: Amsterdam, The Netherlands, 1999; Volume 122, pp. 351–358. [Google Scholar]
- Paul, E.L.; Atiemo-Obeng, V.A.; Kresta, S.M. (Eds.) Handbook of Industrial Mixing: Science and Practice, 1st ed.; Wiley: Hoboken, NJ, USA, 2003. [Google Scholar]
- Ministry of Agriculture and Rural Affairs of Turkey. Turkish Food Codex Communiqué on Purity Criteria for Sweeteners Used in Foodstuffs (Communiqué No: 2010/59); No. 27799; Official Gazette: Ankara, Türkiye, 2010. [Google Scholar]
- Ping, H.; Kou, Z.; Xu, G.; Wu, S. Deactivation and Regeneration of Raney-Ni Catalyst during Multiphase Dehydrogenation of Cyclohexane. J. Environ. Chem. Eng. 2016, 4, 3253–3259. [Google Scholar] [CrossRef] [Scilit]
- Hoffer, B.W.; Crezee, E.; Devred, F.; Mooijman, P.R.M.; Sloof, W.G.; Kooyman, P.J.; van Langeveld, A.D.; Kapteijn, F.; Moulijn, J.A. The Role of the Active Phase of Raney-Type Ni Catalysts in the Selective Hydrogenation of d-Glucose to d-Sorbitol. Appl. Catal. A Gen. 2003, 253, 437–452. [Google Scholar] [CrossRef] [Scilit]

Disclaimer/Publisher’s Note: The statements, opinions and data contained in all publications are solely those of the individual author(s) and contributor(s) and not of MDPI and/or the editor(s). MDPI and/or the editor(s) disclaim responsibility for any injury to people or property resulting from any ideas, methods, instructions or products referred to in the content. |
© 2026 by the authors. Licensee MDPI, Basel, Switzerland. This article is an open access article distributed under the terms and conditions of the Creative Commons Attribution (CC BY) license.