Article

RP5 Aviation Fuel Scrubbing Inerting: A CFD Study on Gas–Liquid Mass Transfer Using Mixed Inert Gas

1
School of Mechanical and Electrical Engineering, Jinling Institute of Technology, Nanjing 211169, China
2
School of Aerospace Engineering, Nanjing University of Aeronautics and Astronautics, Nanjing 210016, China
3
School of Chemical Engineering and Technology, Xi’an Jiaotong University, Xi’an 710049, China
*
Author to whom correspondence should be addressed.
Processes 2026, 14(10), 1537; https://doi.org/10.3390/pr14101537
Submission received: 14 April 2026 / Revised: 6 May 2026 / Accepted: 8 May 2026 / Published: 9 May 2026

Abstract

Modern aircraft fuel tank explosion protection relies critically on inerting efficiency. This study presents and investigates a novel scrubbing deoxygenation strategy utilizing mixed inert gas (MIG) generated by oxygen-consuming inerting systems for high-vapor-pressure RP5 aviation fuel. A high-fidelity computational fluid dynamics (CFD) numerical framework was established using the Eulerian–Eulerian two-fluid model coupled with Higbie’s penetration theory, with experimental validation ensuring computational accuracy (maximum errors for ullage oxygen concentration and dissolved oxygen in fuel controlled within 4.11% and 5.23%, respectively). The research systematically elucidates the influence mechanisms of bubble diameter, MIG temperature, and superficial gas velocity on mass transfer characteristics (oxygen mass transfer coefficient and volumetric mass transfer coefficient). Key findings reveal that reducing bubble diameter achieves localized polarization of mass transfer intensity in the central plume region through an “area-velocity” synergistic effect, with the oxygen volumetric mass transfer coefficient at 1.0 mm diameter increasing by 51.3% compared to 2.5 mm. The performance enhancement from superficial gas velocity primarily stems from the “area multiplication effect” triggered by surging gas holdup. Notably, MIG temperature exhibits a unique three-stage reversal characteristic of “kinetically dominated early stage, thermodynamically controlled late stage” on deoxygenation performance. These results provide critical physical foundations for the forward design of next-generation multifunctional onboard inerting systems.

1. Introduction

In recent years, global energy security has faced unprecedented challenges. Geopolitical conflicts and regional tensions have significantly exacerbated the volatility of international oil prices, highlighting the urgent need for advanced, efficient, and safe aviation fuel management technologies to mitigate operational risks and economic costs [1]. In this context, modern commercial and military aircraft flight safety is highly dependent on fuel tank explosion protection technologies. Following multiple aviation disasters caused by ignition of flammable gases in fuel tank ullage spaces, the Federal Aviation Administration and related airworthiness authorities have mandated the installation of fuel tank inerting systems on specific aircraft [2,3]. Conventional onboard inert gas generation systems typically employ hollow fiber membrane technology to separate air into nitrogen-enriched air for injection into fuel tanks [4,5]. However, membrane separation technology faces bottlenecks including high bleed air compensation requirements and performance degradation at high altitudes. In recent years, catalytic reaction-based green onboard inert gas generation systems have emerged as a research focus due to their elimination of engine bleed air penalties [6,7]. These systems consume oxygen and fuel vapor within the tank through catalytic oxidation, producing mixed inert gas (MIG) rich in CO2, N2, and trace O2 as byproducts [8,9].
Aviation fuel naturally contains substantial dissolved oxygen. As aircraft climb and ambient pressure decreases, dissolved oxygen desorbs extensively from the fuel, causing rebound in ullage oxygen concentration that may exceed airworthiness safety limits [10,11]. Forced scrubbing deoxygenation using inert gas has proven effective in suppressing this oxygen evolution effect [12,13]. Existing scrubbing deoxygenation research has focused primarily on conventional nitrogen-enriched air (NEA) [14]. However, CO2, a major component of MIG, exhibits solubility in aviation fuel nearly 20 times that of N2 [15]. This substantial physicochemical difference renders the gas–liquid interphase mass transfer dynamics, gas holdup distribution, and scrubbing efficiency of MIG significantly distinct from conventional NEA scrubbing [16]. Furthermore, fuel type selection critically determines inerting system effectiveness [17]. RP5 aviation fuel, a high-density, high-calorific-value fuel, possesses significantly higher saturated vapor pressure than conventional RP3 or Jet-A fuels [18]. Elevated vapor pressure implies higher fuel vapor concentration in the ullage space under equivalent conditions, limiting oxygen available for catalytic reaction, while also altering liquid-phase viscosity and surface tension characteristics that affect bubble breakup and coalescence behavior [19,20].
Currently, research on scrubbing deoxygenation characteristics for RP5 fuel, particularly mass transfer mechanisms using MIG as the gas source, remains scarce. Gas–liquid two-phase mass transfer represents a core parameter for bubble reactor and scrubbing fuel tank design. Traditional mass transfer models often assume thermodynamic equilibrium between gas and liquid phases, making accurate description of interphase mass diffusion under complex bubble flow conditions challenging [21,22]. Computational fluid dynamics has been extensively applied to multiphase flow mass transfer behavior simulation in recent years [23,24]. By coupling the Eulerian–Eulerian two-fluid model with species transport equations, researchers can precisely capture spatial distribution characteristics of local gas holdup, interfacial area concentration, and volumetric mass transfer coefficients [25,26]. Numerous studies on bubble columns have demonstrated that gas distributor structure, superficial gas velocity, and operating pressure significantly influence bubble dynamics and macroscopic mass transfer rates [27,28]. Meanwhile, temperature—as a core thermodynamic parameter affecting fluid viscosity, gas solubility, and diffusion coefficients—requires thorough quantitative assessment of its intervention mechanism on MIG scrubbing deoxygenation effectiveness under complex flight envelopes (such as diurnal temperature variations and high-altitude extreme cold) [29,30].
In summary, this study aims to utilize CFD simulation technology to investigate gas–liquid two-phase mass transfer characteristics during MIG scrubbing of RP5 aviation fuel generated by oxygen-consuming inerting systems. The research compares dynamic response patterns of ullage oxygen concentration (volume fraction) and dissolved oxygen concentration in fuel (mole concentration) under different MIG bubble diameters, injection temperatures, and superficial gas velocities. Combined with flow field contour analysis, the study further quantifies evolution mechanisms of gas–liquid interphase oxygen mass transfer coefficients and volumetric mass transfer coefficients, providing solid theoretical support for engineering design and pipeline distribution optimization of novel multifunctional oxygen-consuming scrubbing inerting systems [31].

2. Materials and Methods

2.1. Physical Model

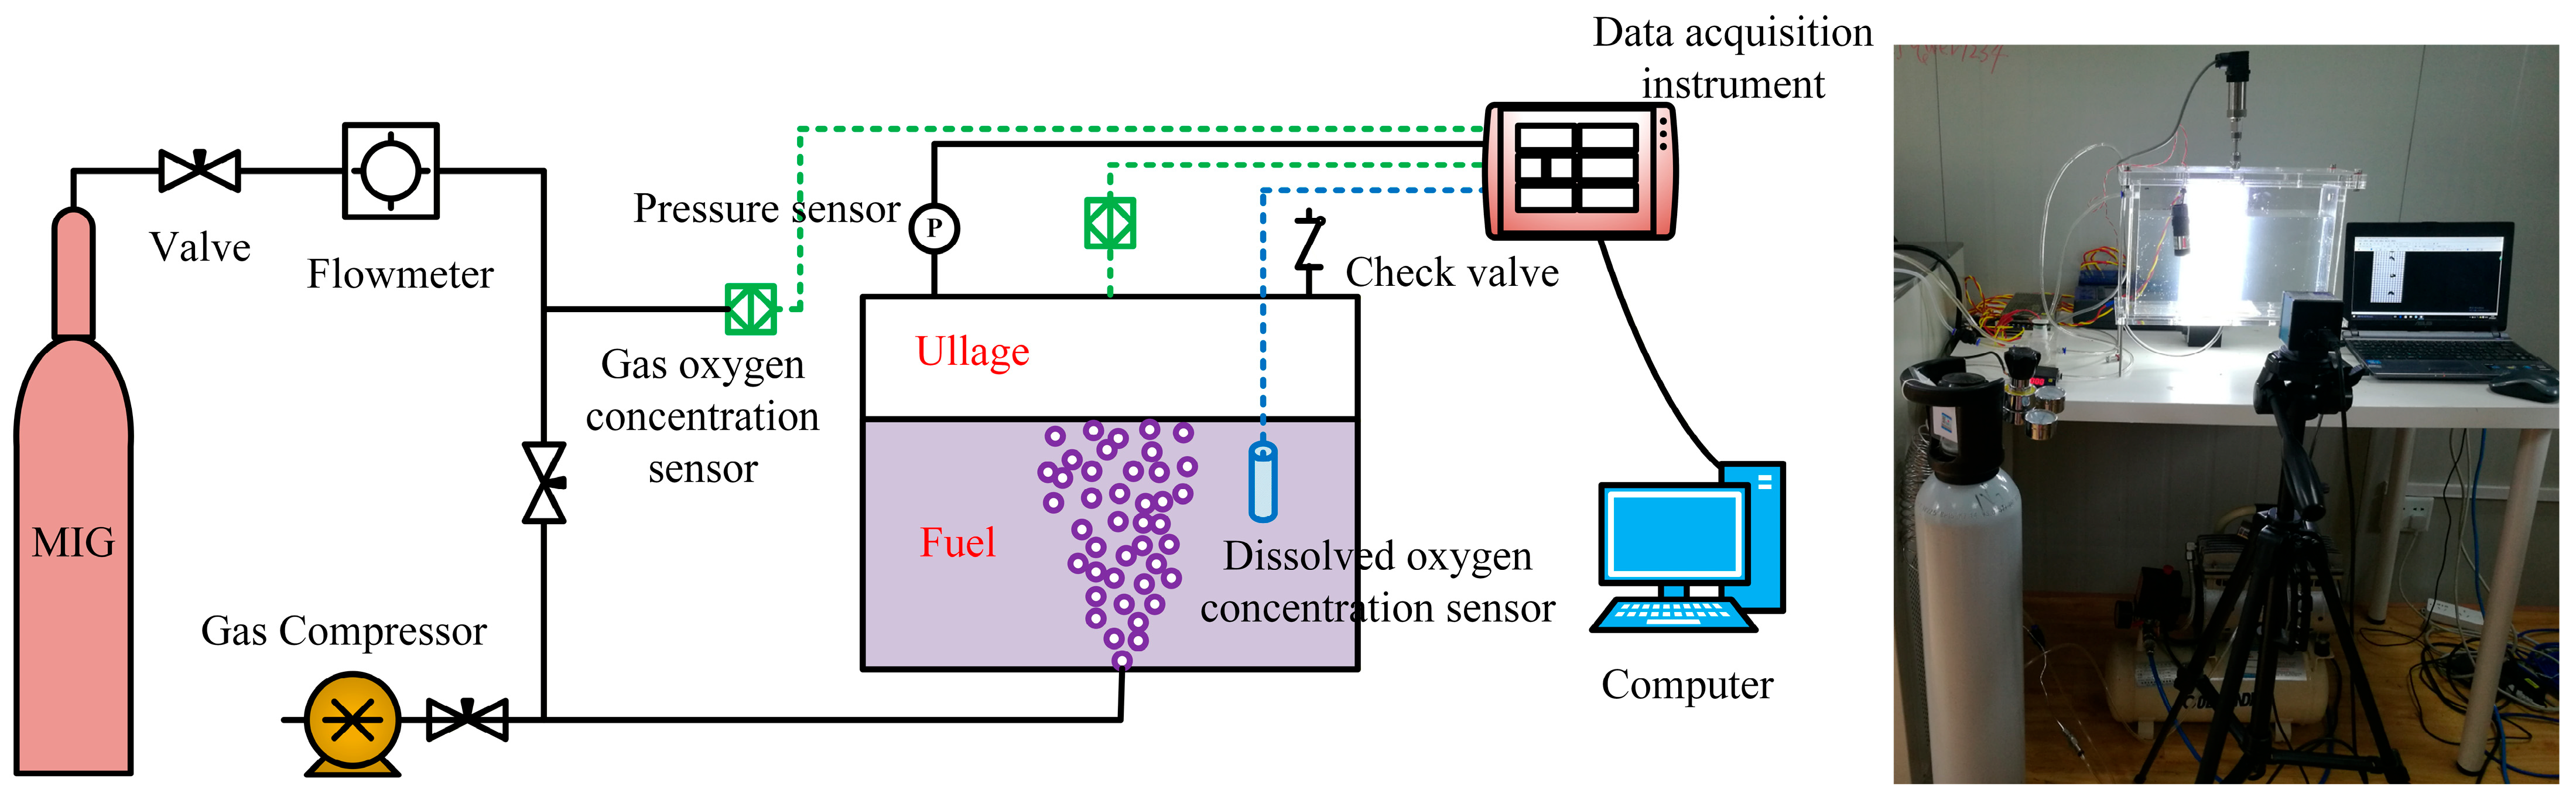
To accurately capture gas–liquid flow and mass transfer phenomena during scrubbing, this study established a three-dimensional rectangular scrubbing fuel tank physical model based on geometric characteristics of actual aircraft center wing scaled fuel tanks and related experimental test rigs, as shown in Figure 1. The overall model dimensions were set at 300 mm length, 200 mm width, and 100 mm height. A 10 mm × 10 mm vent was located at the tank top for discharging the oxygen-enriched mixed gas displaced during scrubbing to the external environment, maintaining pressure balance within the tank. These specific dimensions were chosen to perfectly align with the experimental bench for rigorous model validation. Furthermore, this scaled-down size ensures laboratory safety when handling combustible RP5 fuel, while allowing for a high-resolution computational mesh to accurately resolve localized mass transfer phenomena.
This physical model is a generic rectangular abstraction rather than a strictly geometrically scaled replica of a specific commercial or military aircraft fuel tank. This geometric simplification was designed to eliminate the confounding variables of complex macroscopic flow structures induced by actual irregular tank geometries, thereby allowing for the rigorous isolation and fundamental investigation of the intrinsic multiphase mass transfer mechanisms.
While this generic design effectively isolates fundamental mass transfer mechanisms, it is important to note that reduced geometry models typically must rely on strict similarity principles to accurately scale multiphase flow dynamics [32]. Geometry mismatches or restriction of the tank walls can potentially affect bubble expansion and macroscopic liquid recirculation. In the current setup, the aforementioned tank dimensions are sufficiently large relative to the micro-bubbles to prevent severe wall confinement on the central bubble plume. However, the exact hydrodynamic similarity with a real aircraft fuel tank remains a limitation of this study, which will be systematically addressed in future full-scale structural investigations.
The tank interior was initially loaded with RP5 aviation fuel at an 80% fill level, with gas phase space above the fuel. This specific level was selected primarily to represent a typical high-load condition during the early phases of a flight, a critical stage for fuel tank inerting. However, it should be acknowledged that as an exploratory experimental study, utilizing a constant fill level may not fully capture the dynamic variation in fuel volume throughout an entire actual flight envelope. A gas distributor was positioned at the bottom center of the tank for injecting MIG in bubbling form into the fuel.

2.2. Mathematical Model

This study employed the Eulerian–Eulerian two-fluid model to numerically simulate and analyze gas–liquid interphase mass transfer behavior during MIG scrubbing of fuel [33,34]. Within this multiphase flow framework, both gas and liquid phases are treated as interpenetrating continuous media, with conservation equations established and solved separately for each phase [23,25].
The mass conservation (continuity) equation for each phase is expressed as
t ( ρ i α i ) + ( ρ i α i u i ) = 0
where t is time (s), ρi is the density of phase i (kg/m3), αi is the volume fraction of phase i, and u is the velocity vector (m/s).
The momentum conservation equation is defined as
t ( ρ i α i u i ) + ( ρ i α i u i u i ) = α i p + [ α i μ i ( u i + u i T ) ] + α i ρ i g + R i j
where p is pressure (Pa), μi is the viscosity of phase i (Pa∙s), g is the gravitational acceleration vector (m/s2), and Rij is the interaction force between phases i and j (N/m3).
In two-fluid model solution, accurate calculation of gas–liquid interphase forces is crucial for capturing two-phase flow field characteristics. Interphase interaction forces consist primarily of drag force, lift force, and virtual mass force. Based on action–reaction principles, interphase forces satisfy the following balance relationship:
R l = R g = R l D + R l L + R l VMF
where Rl, Rg, RlD, RlL and RlVMF represent liquid phase force (N), gas phase force (N), liquid phase drag force (N), liquid phase lift force (N), and liquid phase virtual mass force (N), respectively.
Drag force arises from frictional resistance generated by fluid viscosity when bubbles move through the liquid phase, with the following mathematical description [34]:
R l D = 3 4 ρ l α g C D d B ( u g u l ) | u g u l |
where CD is the drag coefficient, dB is the bubble diameter (m), ug and ul are gas and liquid phase velocity vectors (m/s), and ugul is the slip velocity (m/s). The drag coefficient CD depends strongly on Reynolds number and Eotvos number, calculated as follows [34]:
C D = max min 24 R e ( 1 + 0.15 R e 0.687 ) , 72 R e , 8 3 E o E o + 4 )
Re = d B | u g u l | μ g
E o = | ρ g ρ l | g d B 2 8 ω
where g is gravitational acceleration magnitude (9.8 m/s2) and ω is surface tension coefficient. The ρl and ω of RP5 fuel are temperature-dependent and obtained from Liu [35].
In gas–liquid two-phase flow, lateral momentum exchange due to bubbles experiencing asymmetric flow field shear is characterized by lift force [34]:
R l FL = α g ρ l C L ( u g u l ) × × u l
where CL is the lift coefficient, typically assigned a value of 0.5 in general calculations.
Virtual mass force characterizes the inertial resistance effect when bubbles accelerate, driving surrounding liquid to accelerate concurrently [34]:
R l VMF = C VM ρ l α g d u g d t d u l d t
where CVN is the virtual mass coefficient, typically assigned a value of 0.5.
For liquid phase turbulence simulation, considering computational efficiency and model applicability under low superficial gas velocity conditions, this study selected the standard k-ε turbulence model—characterized by algorithmic simplicity and low computational cost—to predict liquid phase flow field structure and gas holdup evolution [34].
t ( ρ k ) + x i ( ρ k u i ) = x j ( P k μ eff k x j ) + G k + G b ρ ε Y M + S k
t ( ρ ε ) + x i ( ρ ε u i ) = x j ( P ε μ eff ε x j ) + C ε 1 ε k ( G k + C ε 3 G b ) C ε 2 ρ ε 2 k R ε + S ε
where k is turbulent kinetic energy (kg/(m∙s3)), ε is turbulent dissipation rate, ui is the velocity vector of phase i (m/s), Pk, Pε are inverse Prandtl numbers, Gk is turbulent kinetic energy from velocity gradients (kg/(m∙s3)), Gb is turbulent kinetic energy from buoyancy (kg/(m∙s3)), YM is turbulent kinetic energy from fluid expansion in compressible turbulence (kg/(m∙s3)), Sk is custom turbulent kinetic energy source term (kg/(m∙s3)), Cε1, Cε2 and Cε3 are constants, Rε is an additional term (kg/(m∙s3)), and Sε is a custom source term (kg/(m∙s3)).
Mass transport equations for gas components within the flow field are
t ( α i ρ i x i , n ) + ( α i ρ i u x i , n α i D x i , n ) = S i , n
where xi,n is the mass fraction of component n in phase i, and Si,n is the mass source term of component n in phase i (kg/m3).
To precisely resolve mass exchange between bubbles and fuel, interphase mass transfer source terms must be introduced at the gas–liquid interface. This mass transfer mechanism coupling can be implemented through user-defined function interfaces in CFD software (Ansys Fluent 2018). Assuming deformed bubbles approximate rigid spheroids, the equivalent spherical diameter is calculated as
d b i = ( h b i l b i 2 ) 1 3
where dbi is the equivalent diameter (m), and hbi, lbi are the major and minor axis lengths of the ith ellipsoid (m), respectively.
Introducing the Sauter mean diameter enables conversion of irregular bubbles to spheres with an equivalent volume-to-surface area ratio:
d bs = n i d b i 3 n i d b i 2
where dbs is the Sauter mean bubble diameter (m), and ni is the number of bubbles with identical diameter.
Based on this, the effective specific surface area of the bubble swarm is defined as
a = 6 d bs α g 1 α g
Contact time for gas–liquid microelements during two-phase flow can be expressed as
t = d bs v r
where vr is the relative velocity magnitude between bubbles and liquid (m/s).
Based on Higbie’s mass transfer theory, interphase mass transfer rate source terms for CO2, O2, and N2 at the MIG–fuel contact interface are calculated as follows:
S C = K C a ( c C * c C ) = 2 D C v r π d bs 6 d bs α g 1 α g ( c C * c C )
S O = K O a ( c O * c O ) = 2 D O v r π d bs 6 d bs α g 1 α g ( c O * c O )
S N = K N a ( c N * c N ) = 2 D N v r π d bs 6 d bs α g 1 α g ( c N * c N )
where SC, SO and SN are mass transfer rate source terms for CO2, O2, and N2 (kg/(m3∙s)), KC, KO, and KN are mass transfer coefficients for CO2, O2, and N2 in fuel (m/s), a is the gas–liquid mass transfer interfacial area (m2/m3), and cC*, cO*, and cN* are equilibrium concentrations of dissolved CO2, O2, and N2 in the liquid phase corresponding to instantaneous gas phase partial pressures (kg/m3).
It should be emphasized that the accuracy of the liquid-side mass transfer coefficient in the above equations fundamentally depends on the species mass diffusion coefficient. To ensure the highest fidelity of the multiphase mass transfer simulation, the mass diffusion coefficients of O2, N2, and CO2 in RP5 aviation fuel were not empirically estimated. Instead, they were directly adopted from our previous experimental measurements using digital holographic interferometry [36,37,38] and can be expressed as
D O = 1.346 × 10 4 exp ( 23115 8.314 T )
D N = 2.0168 × 10 5 exp ( 20011 8.314 T )
D C = 5.6328 × 10 3 exp ( 30752 8.314 T )
These experimental data were fitted into temperature-dependent polynomial functions and compiled into the CFD solver via user-defined functions to dynamically calculate the local mass transfer coefficients during the non-isothermal scrubbing process.

2.3. Simulation Conditions

Numerical simulations were conducted using the ANSYS Fluent (2018) platform with transient calculations. The Eulerian multiphase flow model was selected for gas–liquid two-phase flow, with the species transport model activated. The standard k-ε model was employed for turbulence modeling. Assuming the fuel tank had been grounded for sufficient time before scrubbing, the ullage space was filled with air (volume fraction: 21% O2, 79% N2), and initial concentrations of dissolved gases in RP5 fuel reached thermodynamic equilibrium with the overlying air. In the simulation, the RP5 aviation fuel is treated as an incompressible Newtonian fluid. As the physical properties of RP5 fuel, such as density, dynamic viscosity, surface tension, and gas solubility coefficients, are highly sensitive to thermal variations, they were defined as temperature-dependent functions rather than constants to ensure high-fidelity modeling [35]. Specifically, at a reference temperature of 20 °C, the density and kinematic viscosity of the RP5 fuel utilized in this study are 819.5 kg/m3 and 2.19 mm2/s, respectively. These properties were incorporated into the CFD model to account for their impact on the gas–liquid mass transfer process.
The distributor inlet was set as the Velocity Inlet. Since MIG is generated by oxygen-consuming catalytic inerting systems, inlet gas volume fractions were set according to catalytic oxidation results as follows: CO2 5%, N2 85%, O2 10%. The vent was set as Pressure Outlet with a gauge pressure of 0 Pa. All tank walls employed no-slip boundary conditions with adiabatic wall assumption, neglecting convective heat transfer effects from the external environment. Pressure–velocity coupling used the Phase-Coupled SIMPLE algorithm. Convection terms and volume fraction equations employed QUICK format for high-precision spatial discretization, with first-order implicit format for temporal discretization. To ensure calculation stability and Courant number requirements, the time step size was set to 0.001 s with maximum iterations per step of 20.

2.4. Experimental Validation of CFD Simulation

To validate the reliability and computational accuracy of the aforementioned CFD physical and mathematical models in predicting MIG scrubbing of RP5 fuel interphase mass transfer, this study constructed a corresponding fuel scrubbing deoxygenation experimental test rig for benchmark validation, as shown in Figure 2. The experimental system primarily consisted of gas mixing module, scrubbing test tank, and parameter acquisition control module. The test tank was fabricated from high-transparency acrylic material with geometric dimensions strictly consistent with the aforementioned physical model.
A batch of qualified RP5 aviation fuel was pumped into the scrubbing tank to the predetermined liquid level. Compressed air was introduced for pre-bubbling, followed by 1 h settling at target room temperature to ensure dissolved oxygen concentration in the fuel reached saturated initial state. The individual gas components (CO2, O2, and N2) used for preparing MIG were provided by Nanjing Special Gas Factory Co., Ltd. (Nanjing, China), and each gas achieved a high purity of 99.9%. These high-purity gases were precisely mixed to simulate the specific compositions of the oxygen-consuming washing and inerting system’s exhaust. Using high-precision gas mass flow controllers (MF4003 measurement range: 0–2 L/min; accuracy: 1.5%), high-purity CO2, N2, and O2 were dynamically mixed at specific ratios to simulate MIG generated by oxygen-consuming inerting systems, then delivered to the porous gas distributor at the tank bottom. After scrubbing initiation, the oxygen concentration in the ullage was monitored using a CITY AO2 oxygen sensor (range: 0–100%; accuracy: 0.01%). During the scrubbing process, the dissolved oxygen concentration in the RP5 aviation fuel was continuously monitored using an Anzeel S-DO-A1 dissolved oxygen sensor (range: 0–2 mol/m3; accuracy: 0.5%) with a fixed data sampling time interval of 10 s.
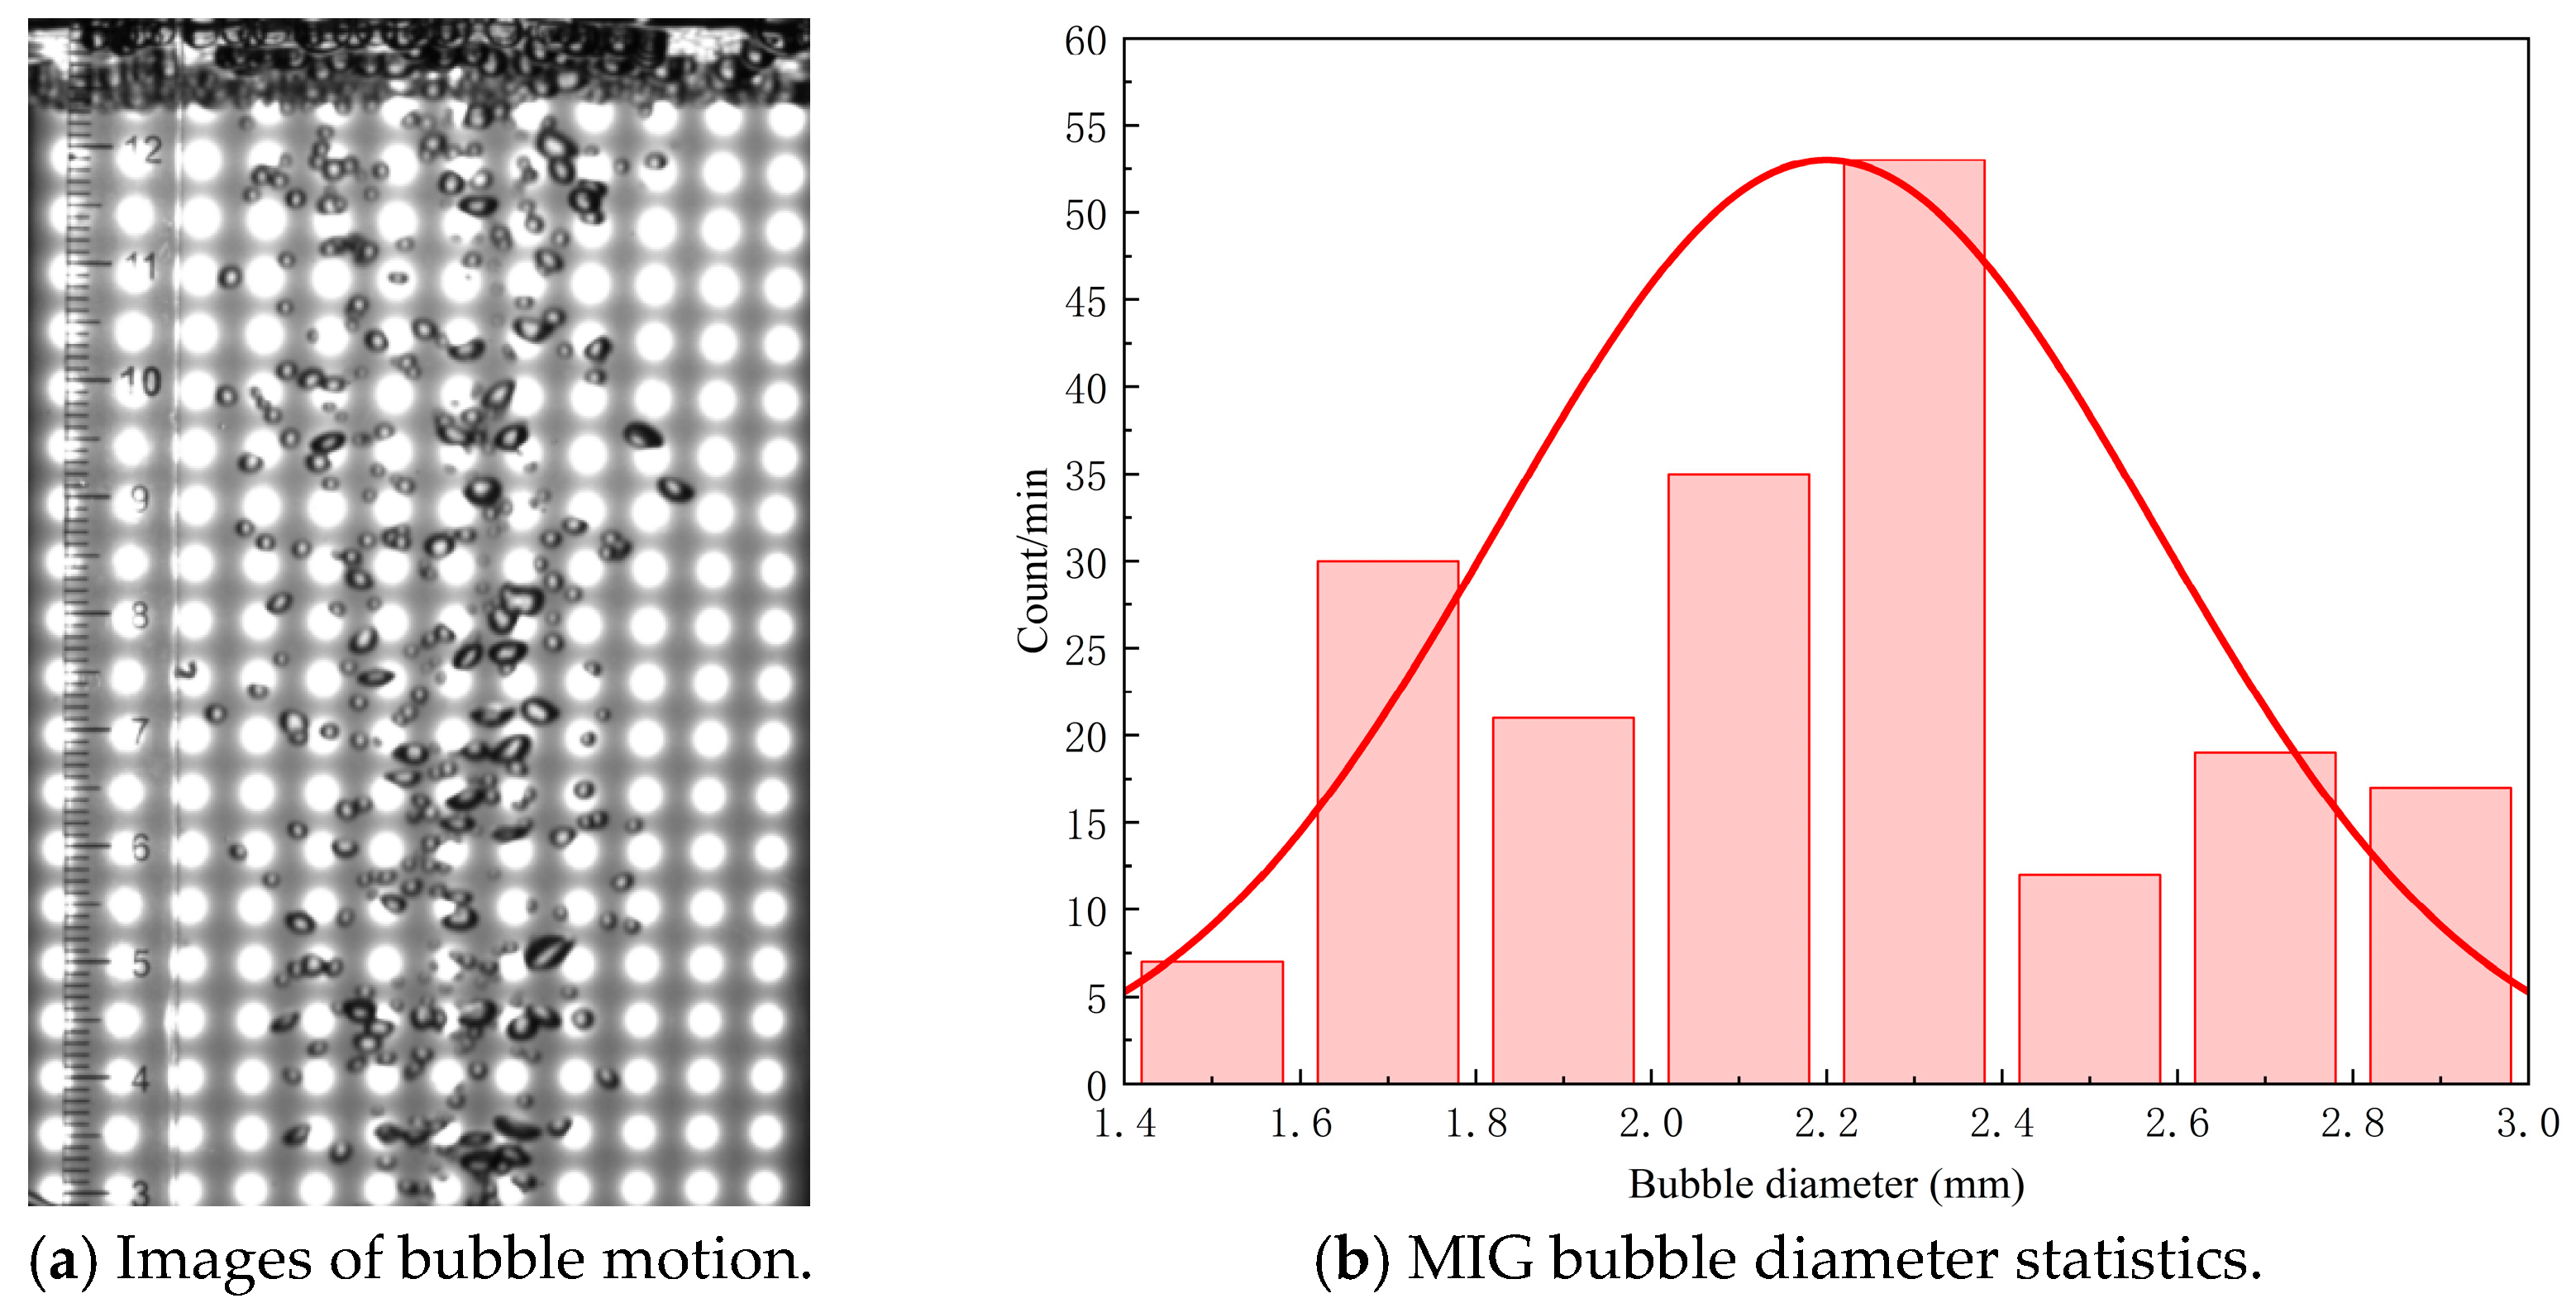
The bubble dynamics were recorded utilizing a DMK-41BU02 industrial CCD camera (The Imaging Source, Bremen, Germany). The camera features a resolution of 1280 × 960 pixels and a precise pixel size of 4.65 μm. During the scrubbing process, the image capturing time interval was strictly set to 1 min to continuously track the bubble plume evolution. Digital image processing techniques and particle size statistical methods were applied to obtain bubble diameter distributions under actual scrubbing conditions, thereby determining the Sauter mean diameter, which was then input as a boundary condition into CFD simulation software (Ansys Fluent 2018) to obtain simulation results under experimental conditions for comparison with experimental results. At an experimental MIG superficial gas velocity of 0.06 m/s, the measured Sauter mean diameter for a specific scrubber during the scrubbing inerting process was 2.2 mm, as shown in Figure 3.
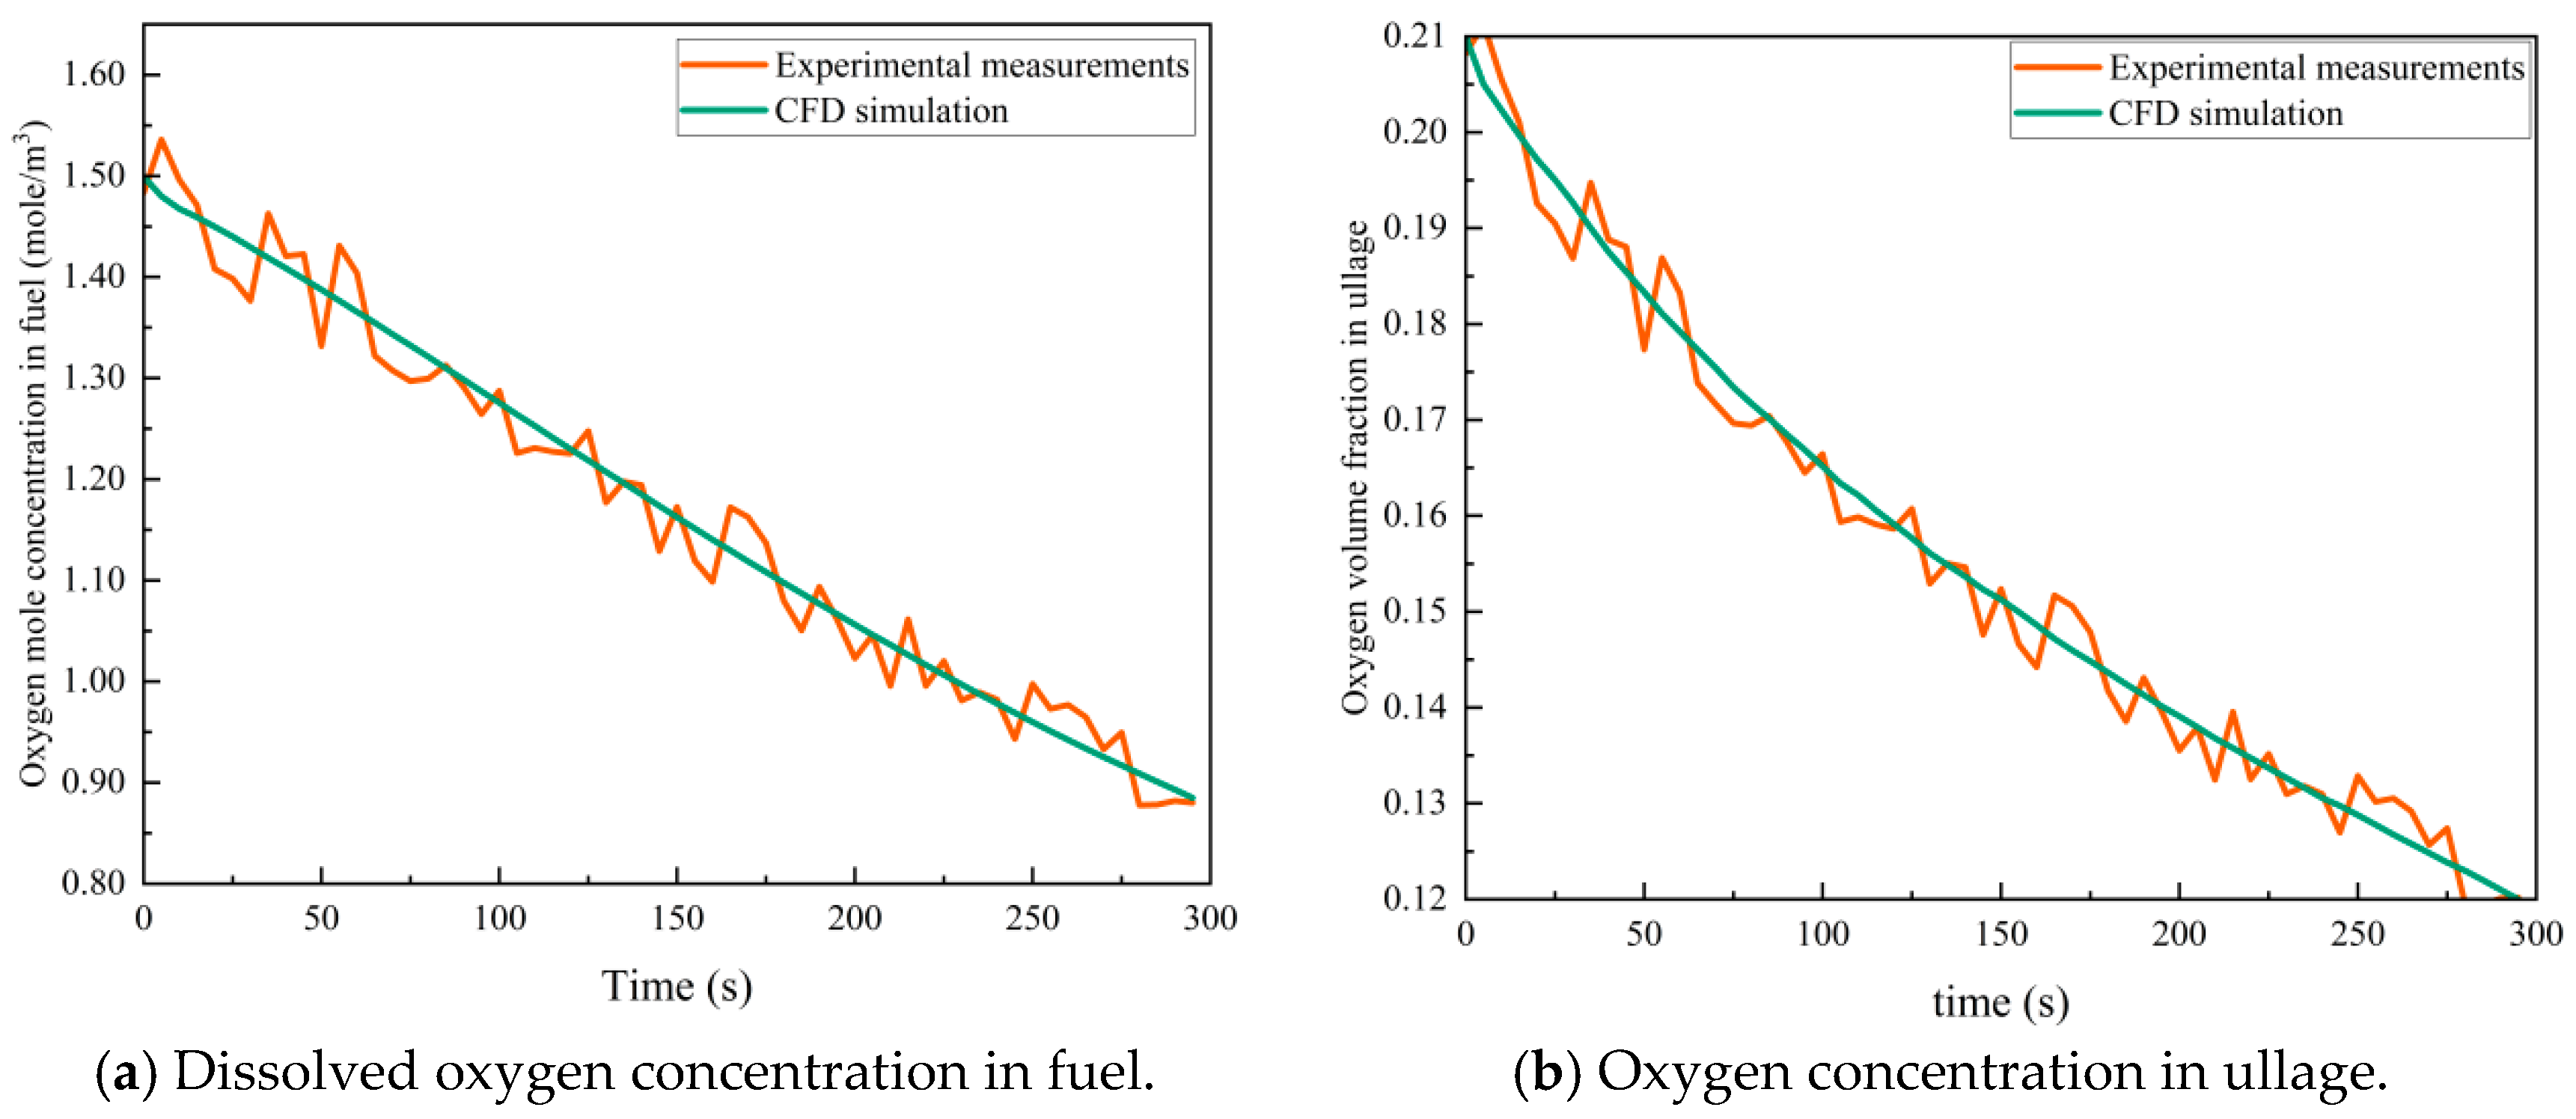
CFD simulation results for fuel dissolved oxygen concentration and ullage oxygen concentration were quantitatively compared with experimental test data, as shown in Figure 4. Results showed that CFD simulation curves accurately tracked the nonlinear decline trends of two-phase oxygen concentration during scrubbing, with good agreement between simulation and experiment. Extracting discrete data points throughout the entire process for calculation, the maximum relative error for dissolved oxygen concentration in fuel was 5.23% and for ullage oxygen concentration was 4.11%. The minor oscillations in the experimental curve for dissolved oxygen concentration in fuel primarily originated from turbulent fluctuations in the probe local flow field, while systematic deviation in ullage oxygen concentration was mainly attributed to simplification of actual complex coalescence and breakup behavior by the rigid bubble equivalent assumption in the CFD model. Overall, maximum prediction errors throughout the entire process were strictly controlled within a reasonable engineering range of 6%. This fully demonstrates that the multiphase flow mathematical model constructed in this study can faithfully reproduce MIG scrubbing RP5 fuel gas–liquid mass transfer dynamics characteristics, with computational accuracy fully meeting requirements for subsequent in-depth parameter analysis.

3. Analysis of Influencing Factors on Gas–Liquid Mass Transfer in Fuel Scrubbing

3.1. Effect of MIG Bubble Diameter

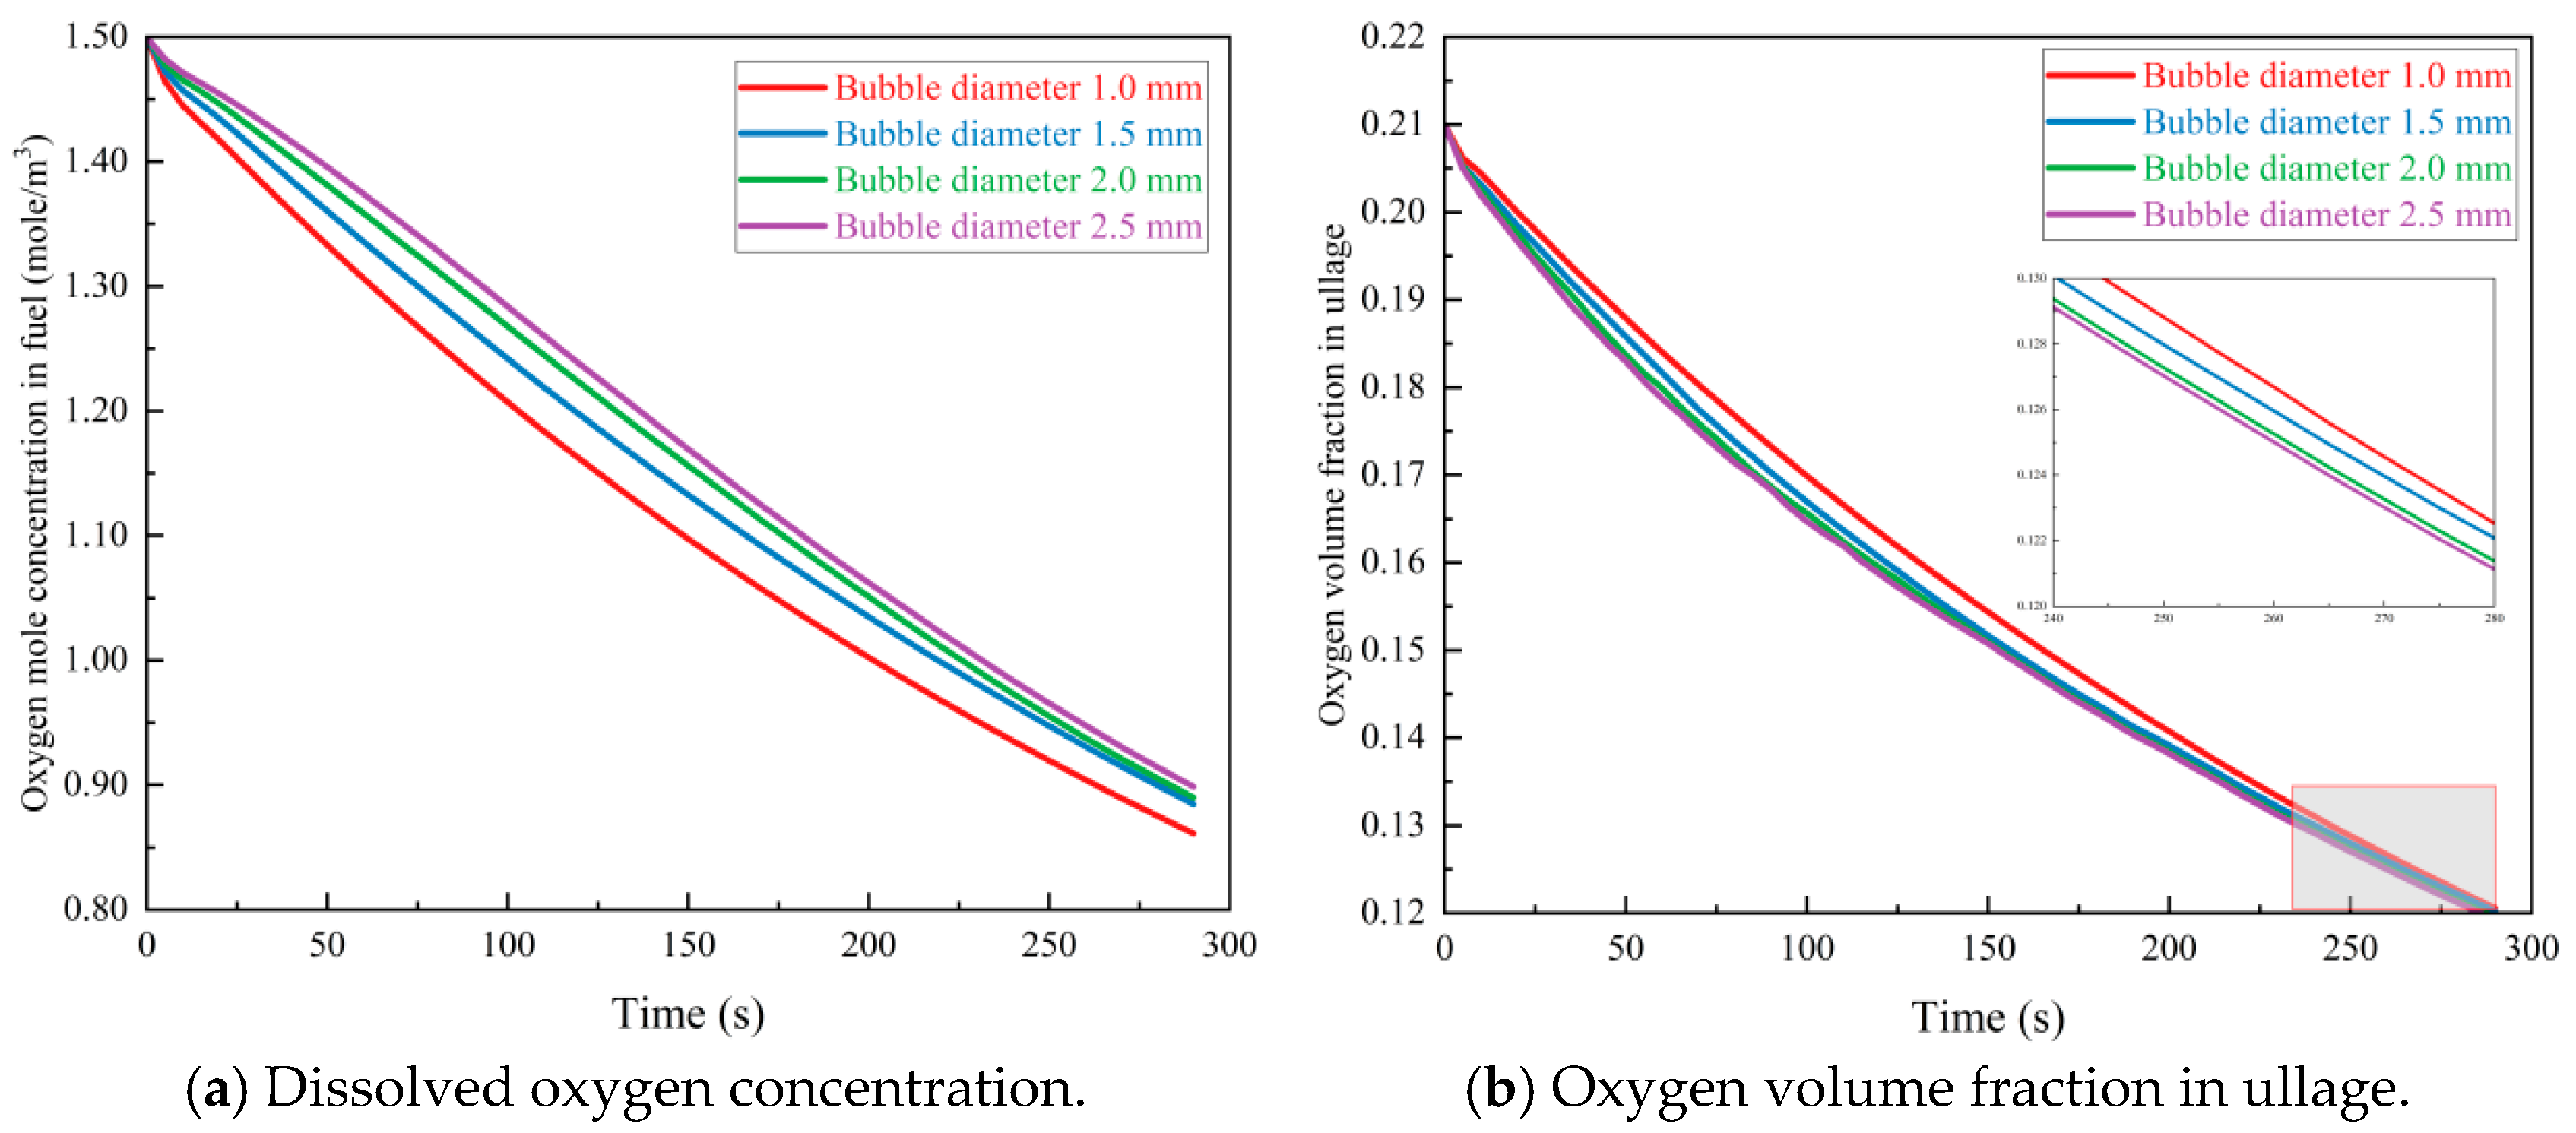
Under conditions of MIG superficial gas velocity of 0.06 m/s, temperature of 300 K, and fuel fill level of 80%, comparative analysis was conducted for dynamic variation patterns of fuel dissolved oxygen concentration and ullage oxygen concentration at MIG bubble diameters of 1.0 mm, 1.5 mm, 2.0 mm, and 2.5 mm, to reveal the influence of bubble scale on RP5 fuel scrubbing deoxygenation mechanisms.
As shown in Figure 5a, fuel dissolved oxygen concentration exhibited a pronounced nonlinear decline trend after scrubbing initiation. When bubble diameters were 1.0 mm and 2.5 mm, the maximum absolute deviation in dissolved oxygen concentration reached 0.0854 mol/m3. This occurs because as the bubble diameter decreases, the effective mass transfer contact area per unit volume increases significantly. Meanwhile, governed by the force balance between buoyancy and fluid drag [39], smaller bubbles possess a lower terminal rise velocity and thus rise more slowly through the fuel. This slower ascent increases the bubble residence time in the liquid phase, thereby further enhancing the efficiency of dissolved oxygen migration from the liquid to the gas phase.
Figure 5b presents the variation curve of ullage oxygen concentration. The decline pattern of ullage oxygen concentration differs slightly from fuel dissolved oxygen concentration changes. During scrubbing, the maximum difference in ullage oxygen concentration between 1.0 mm and 2.5 mm bubble diameters reached 0.47%. Although smaller bubble diameters possess higher mass transfer efficiency, this causes more dissolved oxygen to be “stripped” from the fuel into bubbles, resulting in MIG bubbles entering the ullage space carrying higher oxygen content. This ‘oxygen backflow’ effect due to enhanced liquid-phase deoxygenation somewhat delays the initial dilution rate of ullage oxygen. Physically, in the early stage of scrubbing, the high concentration gradient drives a rapid desorption of dissolved oxygen from the fuel into the bubbles. When these bubbles burst at the fuel surface, they release a gas mixture rich in desorbed oxygen into the ullage. This massive influx of desorbed oxygen acts as an internal oxygen source, temporarily counteracting the purging effect of the inert gas and thereby slowing down the initial decline of the ullage oxygen concentration.
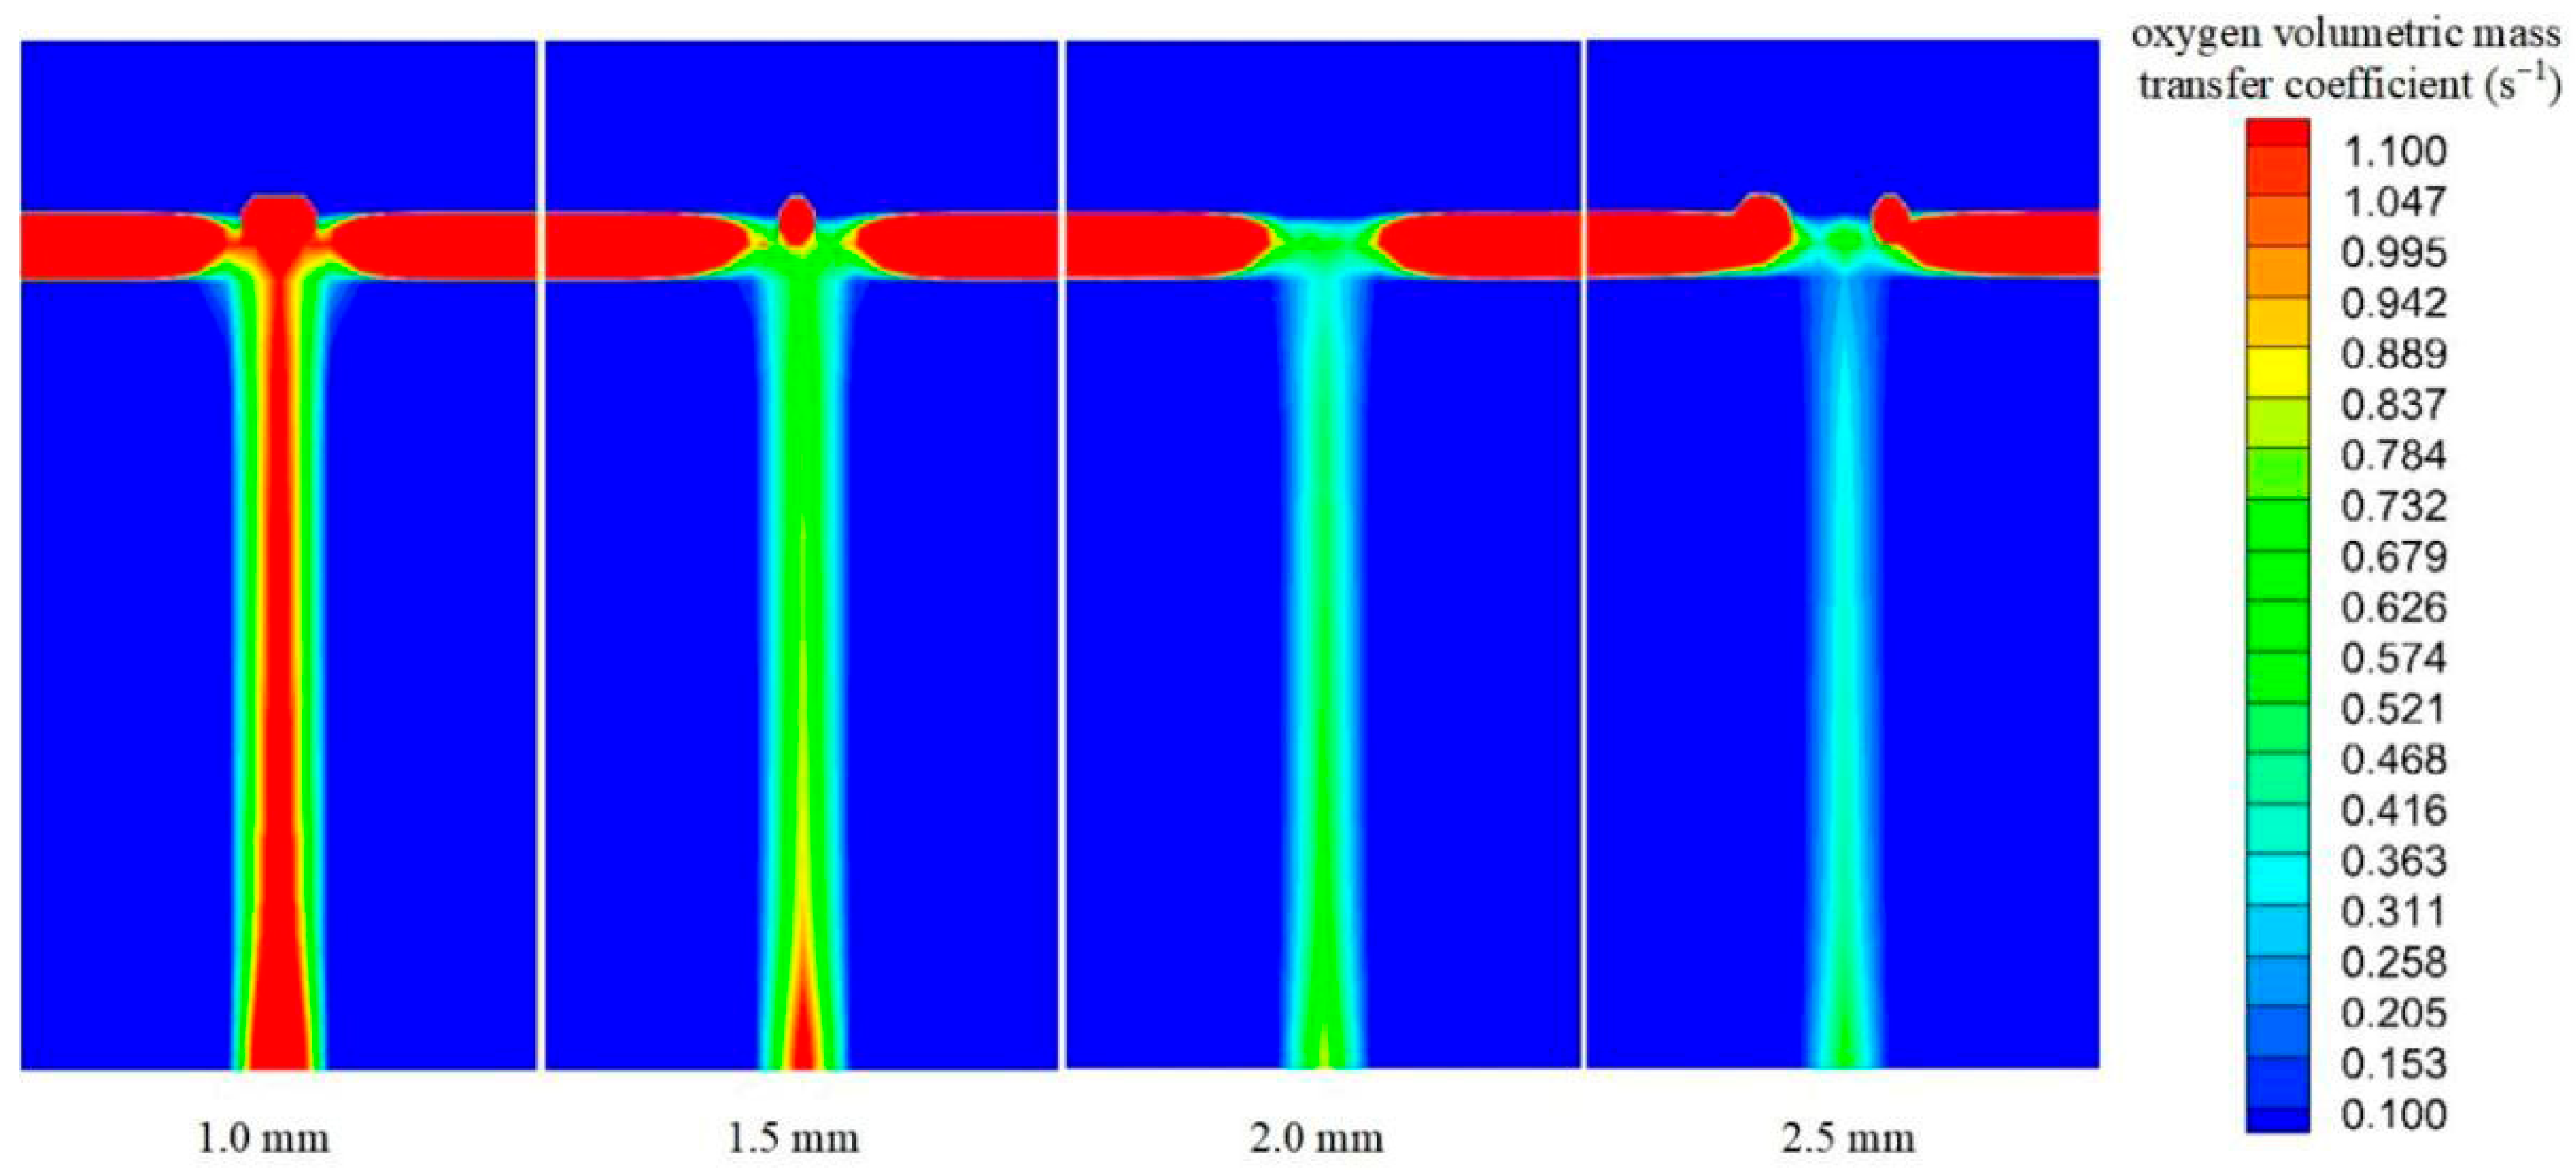
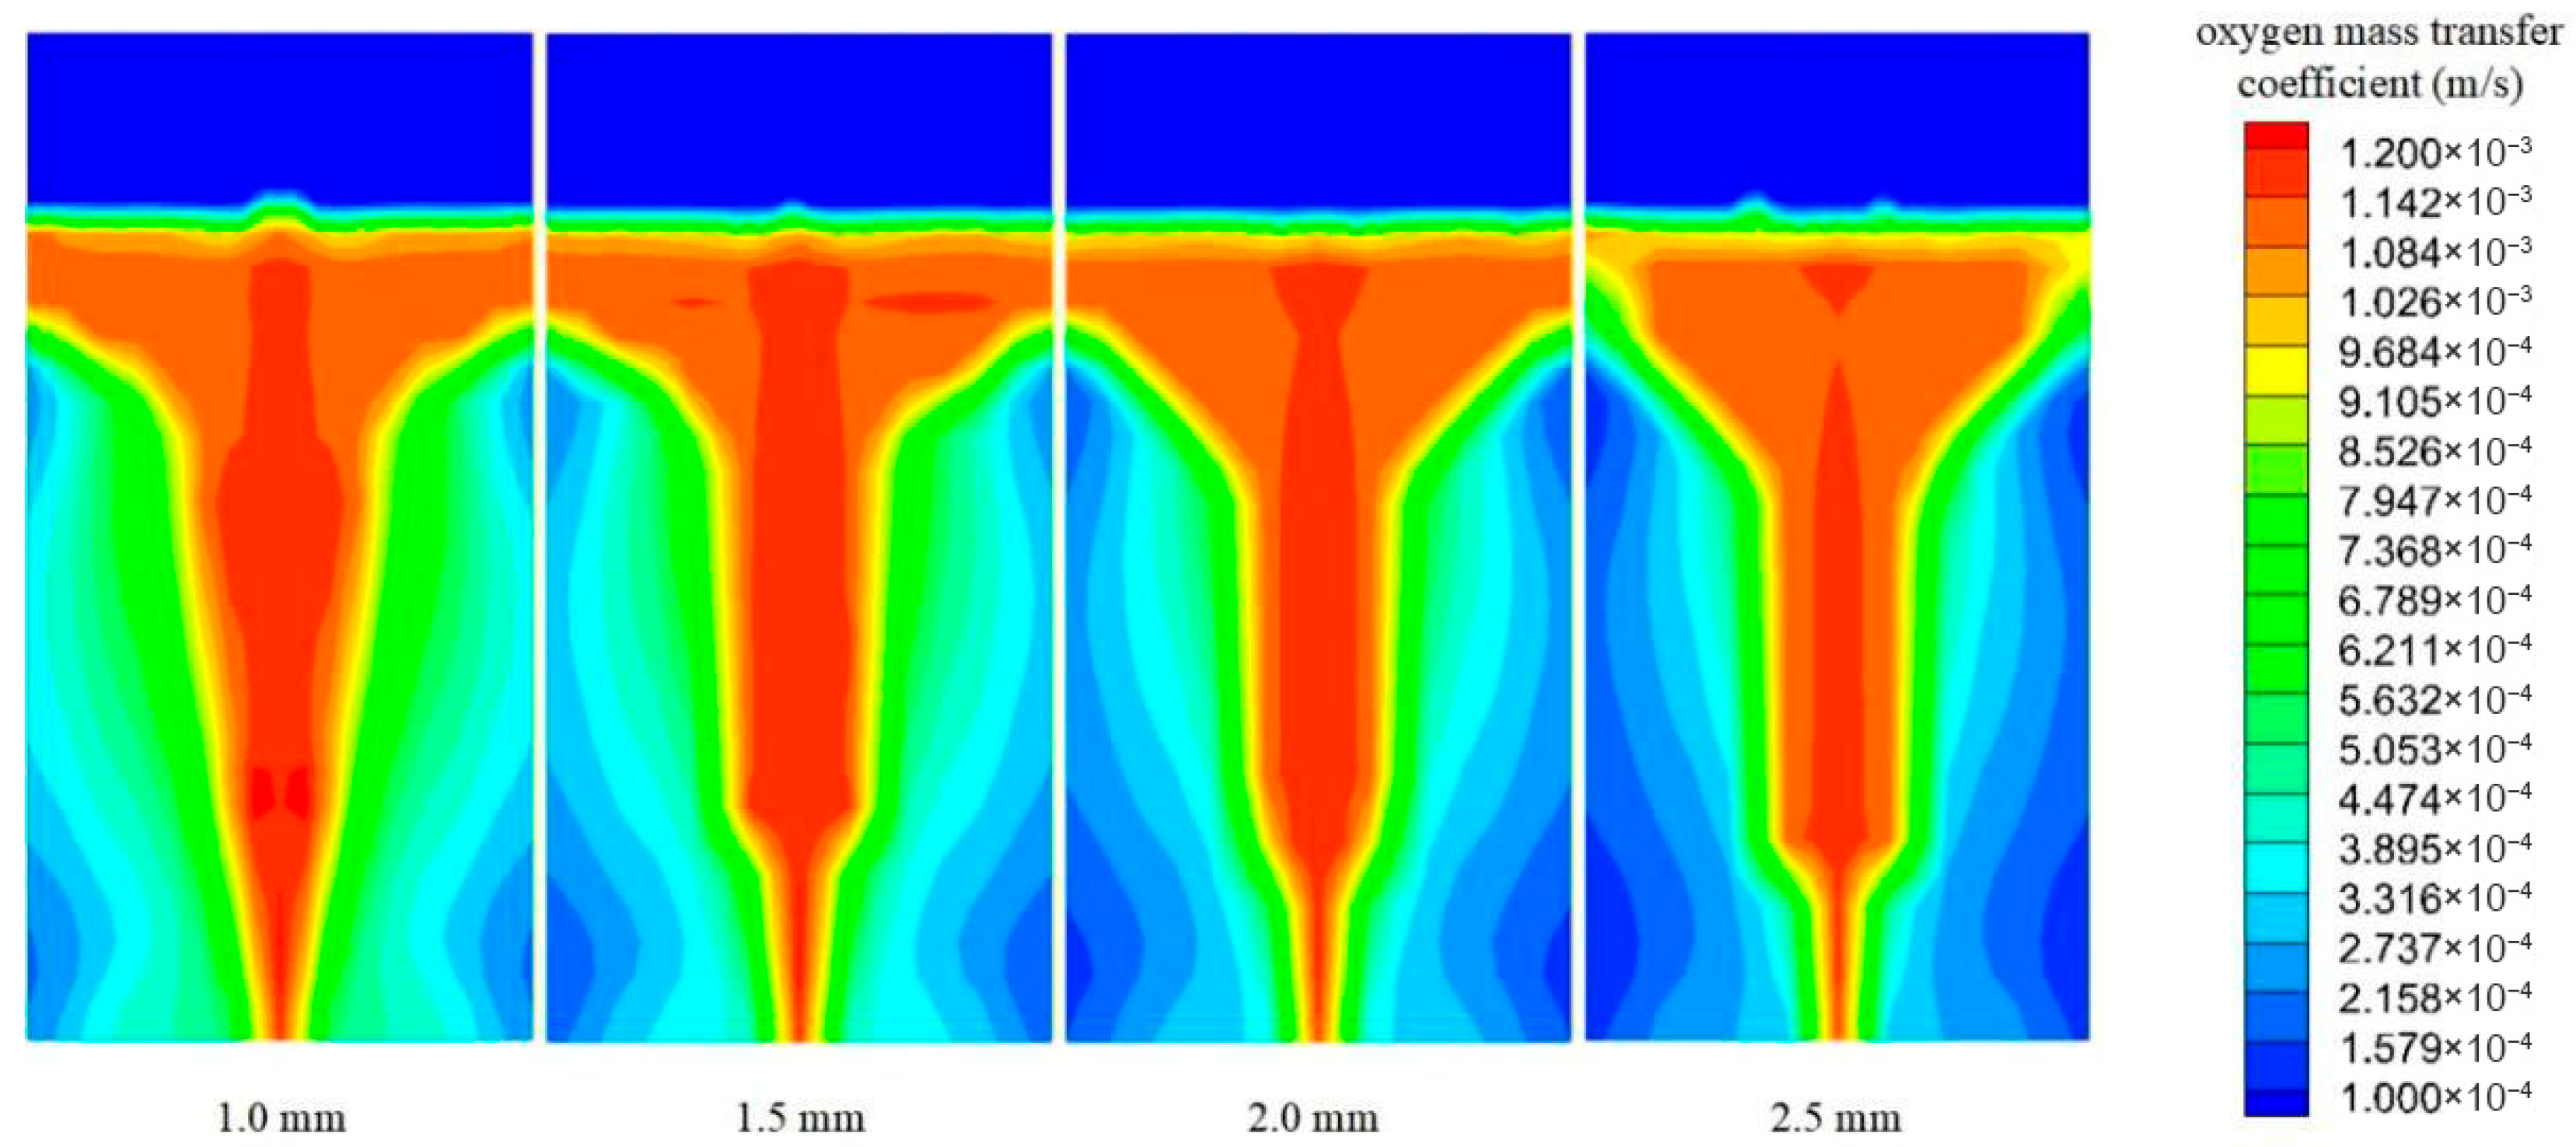
To deeply reveal the microscopic mass transfer mechanism of MIG bubble diameter influence on fuel scrubbing deoxygenation processes, this study extracted distribution contour plots of liquid-side oxygen mass transfer coefficient (KO) and oxygen volumetric mass transfer coefficient (KOa) at the tank central cross-section when scrubbing reached quasi-steady state for analysis.
As shown in Figure 6, MIG bubble diameter exerts significant regulatory effects on local mass exchange rates at the gas–liquid interface. When bubble diameter gradually decreased from 2.5 mm to 1.0 mm, the average liquid-side KO throughout the flow field increased significantly from 5.116 × 10⁻⁴ m/s to 6.682 × 10⁻⁴ m/s, a relative increase of approximately 30.6%. Under large-bubble (2.5 mm) conditions, high mass transfer coefficient regions were concentrated primarily in the narrow mainstream zone directly above the gas distributor. When bubbles refined to 1.0 mm, high KO regions not only strengthened significantly in the central axis zone but also expanded laterally toward surrounding areas and the liquid surface top region. According to Higbie penetration theory [40], interfacial mass transfer renewal rates depend heavily on characteristic length and gas–liquid relative slip. Although large bubbles possess higher interphase absolute slip velocity, in high-viscosity, high-density RP5 fuel, micro-bubbles are more susceptible to entrainment and strong shear effects from large-scale turbulent eddies in the liquid phase. This fluid dynamic characteristic change causes small bubbles to disperse laterally with fluid flow, with fluid microelements on their surfaces being stripped and replaced more frequently, substantially increasing gas–liquid interfacial surface renewal frequency, thereby maintaining higher oxygen mass transfer coefficients across broader flow field space.
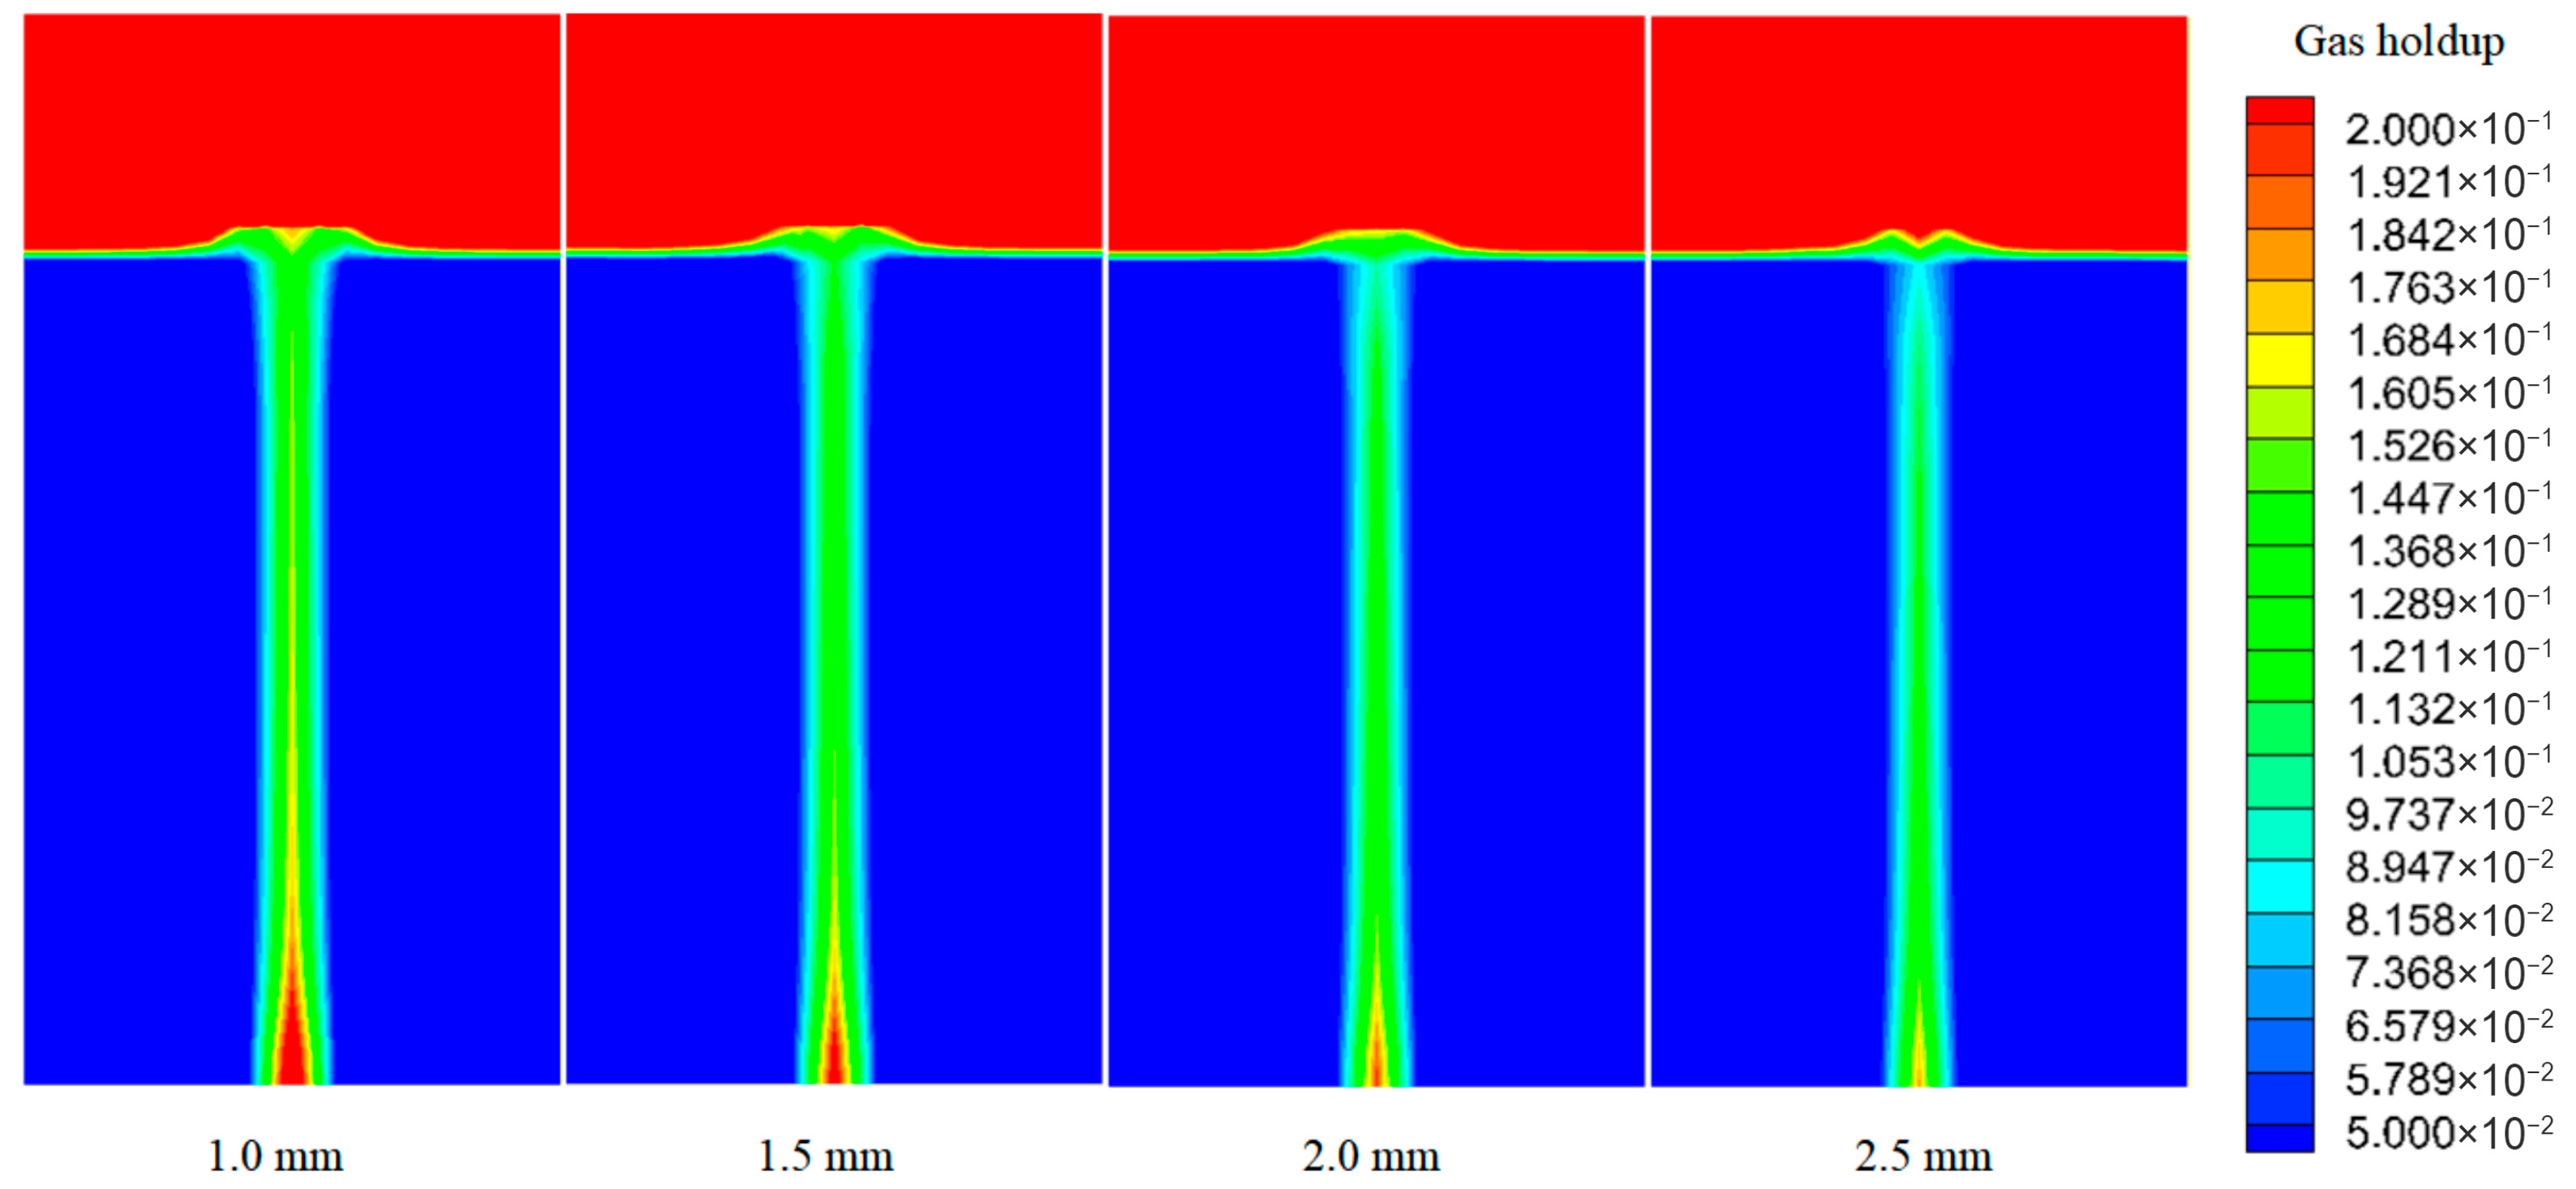
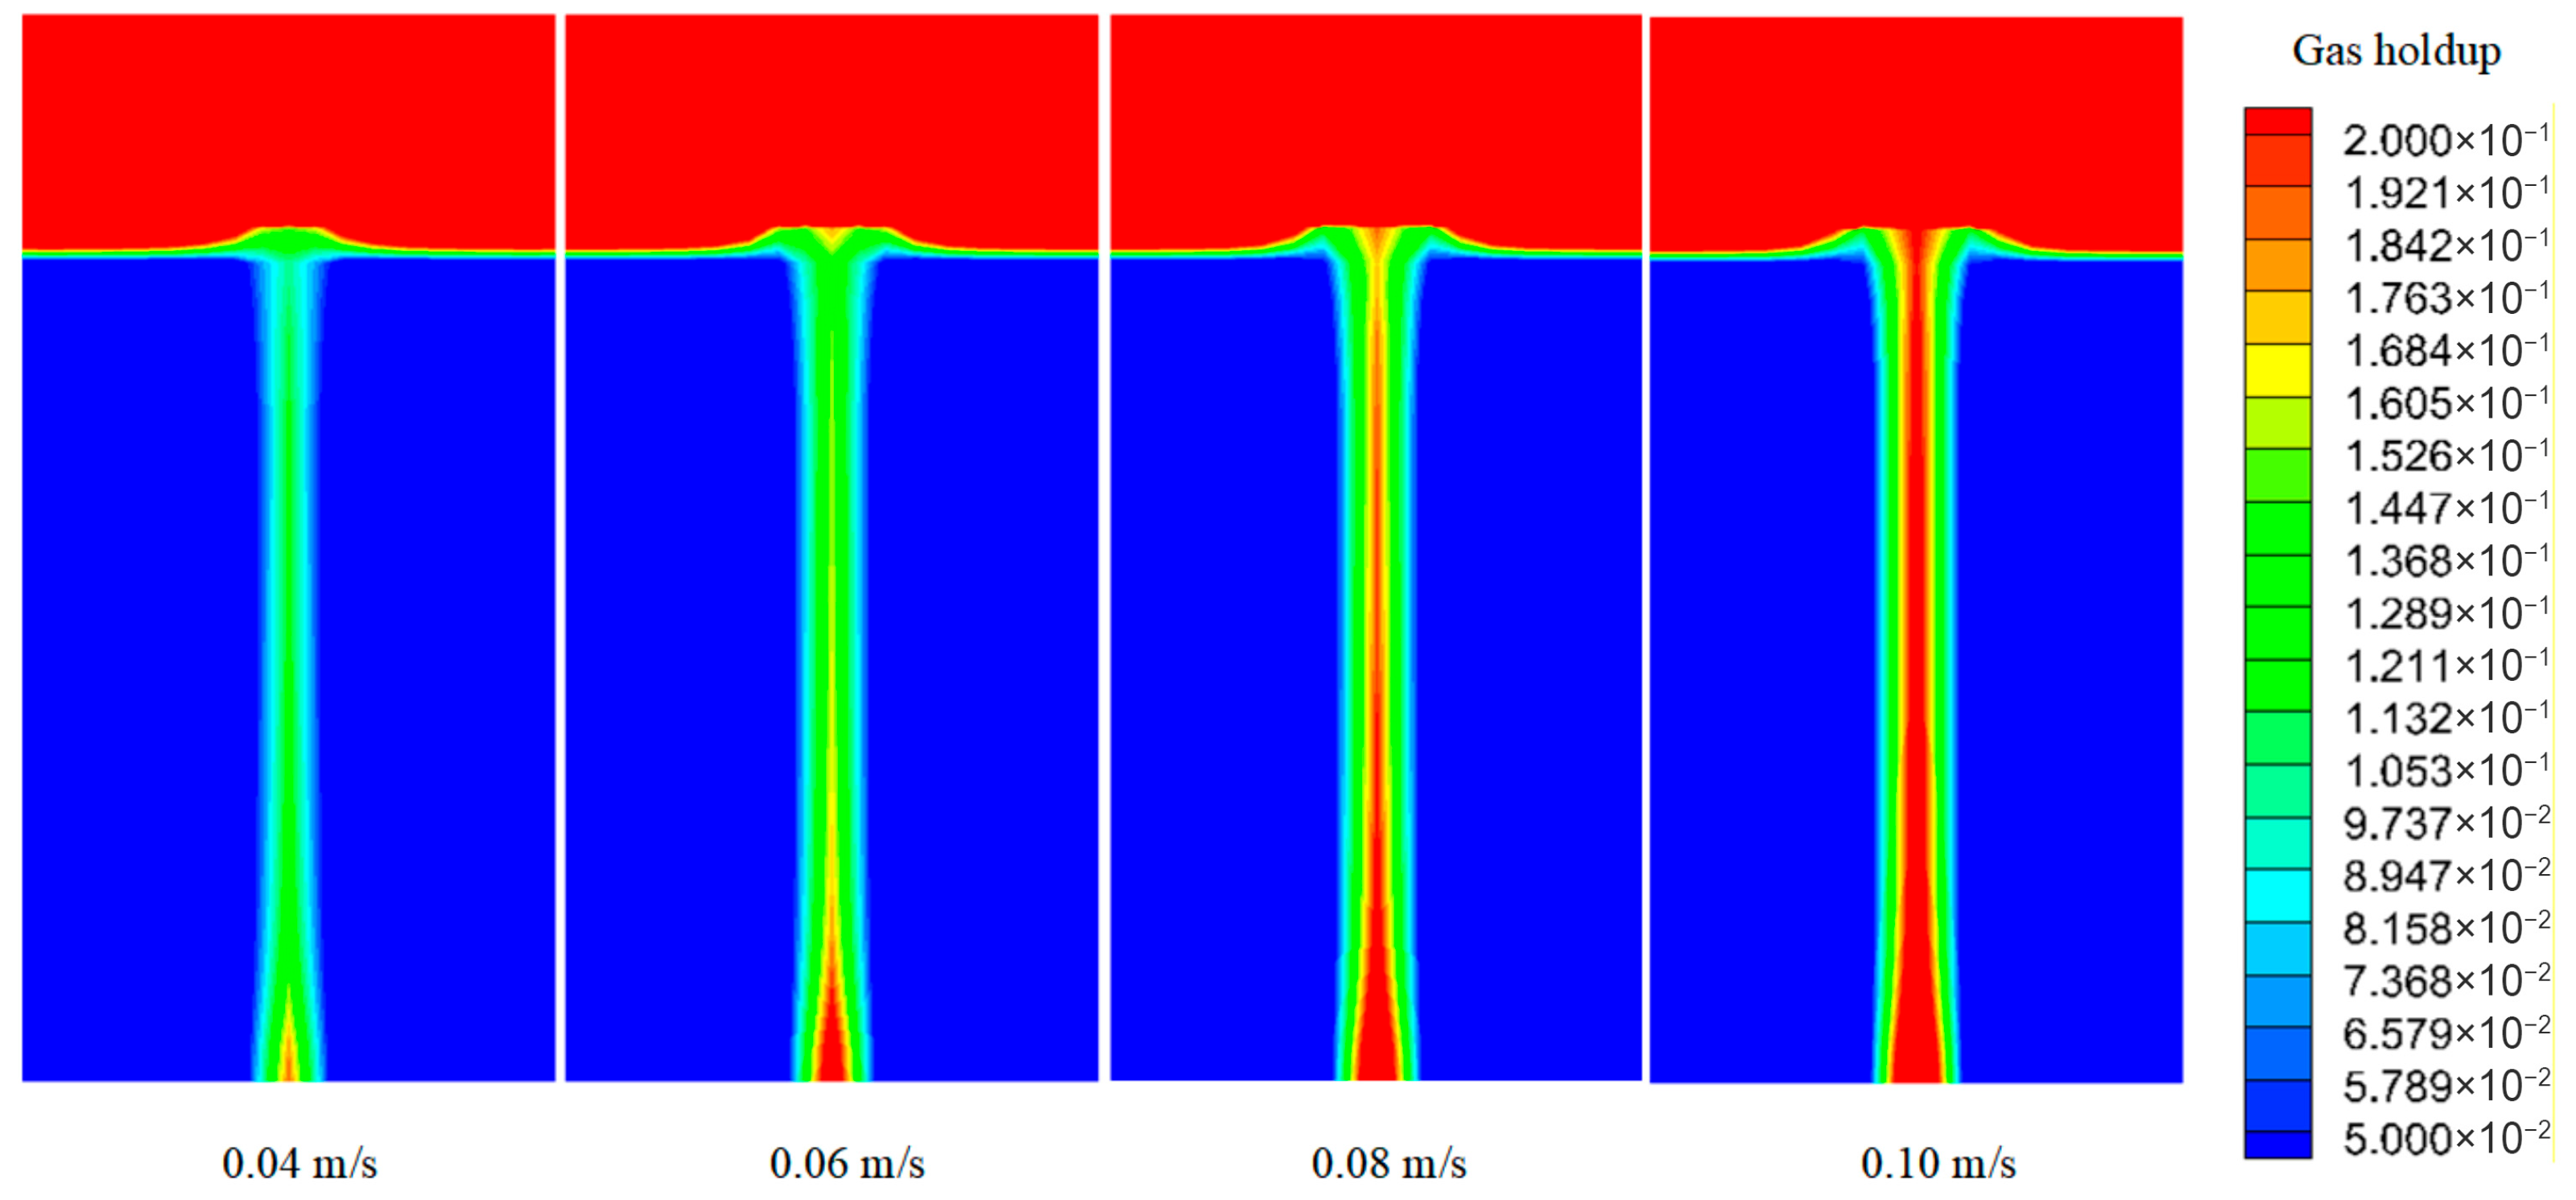
To further elucidate the hydrodynamic origins of mass transfer enhancement, the gas holdup of MIG was investigated. Figure 7 illustrates the spatial distribution of gas holdup across different operational parameters. Quantitatively, the bubble diameter exerts a significant influence on gas retention. The average gas holdup increases from 0.0089 to 0.0128 as the bubble diameter decreases from 2.5 mm to 1.0 mm. This trend is attributed to the reduced buoyancy-driven rise velocity of smaller bubbles, which extends their residence time within the fuel and promotes gas phase accumulation in the central plume region.
The KOa as a comprehensive index coupling interfacial mass transfer rate and effective interfacial area directly maps macroscopic scrubbing deoxygenation efficiency quality. As shown in Figure 8, when bubble diameter decreased from 2.5 mm to 1.0 mm, the average KOa throughout the flow field increased from 0.1697 s−1 to 0.2567 s−1, a substantial jump of 51.3%. The macroscopic spatial morphology of high mass transfer regions did not undergo significant radial broadening with decreasing bubble diameter, but remained highly concentrated at the tank central axis position. This phenomenon indicates that under current scrubbing conditions, macroscopic liquid circulation driven by gas–liquid two-phase density difference generates powerful entrainment effects, constraining MIG bubbles of various sizes within the central rising “plume zone”, resulting in consistently extremely low KOa value mass transfer “dead zones” in surrounding near-wall regions of the tank. Under 2.5 mm large-bubble conditions, KOa values within the central plume zone were relatively low and unevenly distributed. When bubbles were refined to 1.0 mm, contour plots show KOa peak values in the central axis region increased significantly. This occurs because micro-bubble rise velocity is far lower than large bubbles, substantially extending MIG residence time within the central plume zone, causing significant accumulation and elevation of local gas holdup. Simultaneously, smaller bubble diameter combined with higher degree of local gas retention significantly multiplies the effective gas–liquid contact area within the central plume zone. Therefore, reducing bubble diameter, while failing to break macroscopic flow field central constraints, achieves localized intensification and efficient superposition of mass transfer intensity within the central mainstream zone, ultimately driving substantial leaps in overall flow field deoxygenation performance.

3.2. Effect of MIG Temperature

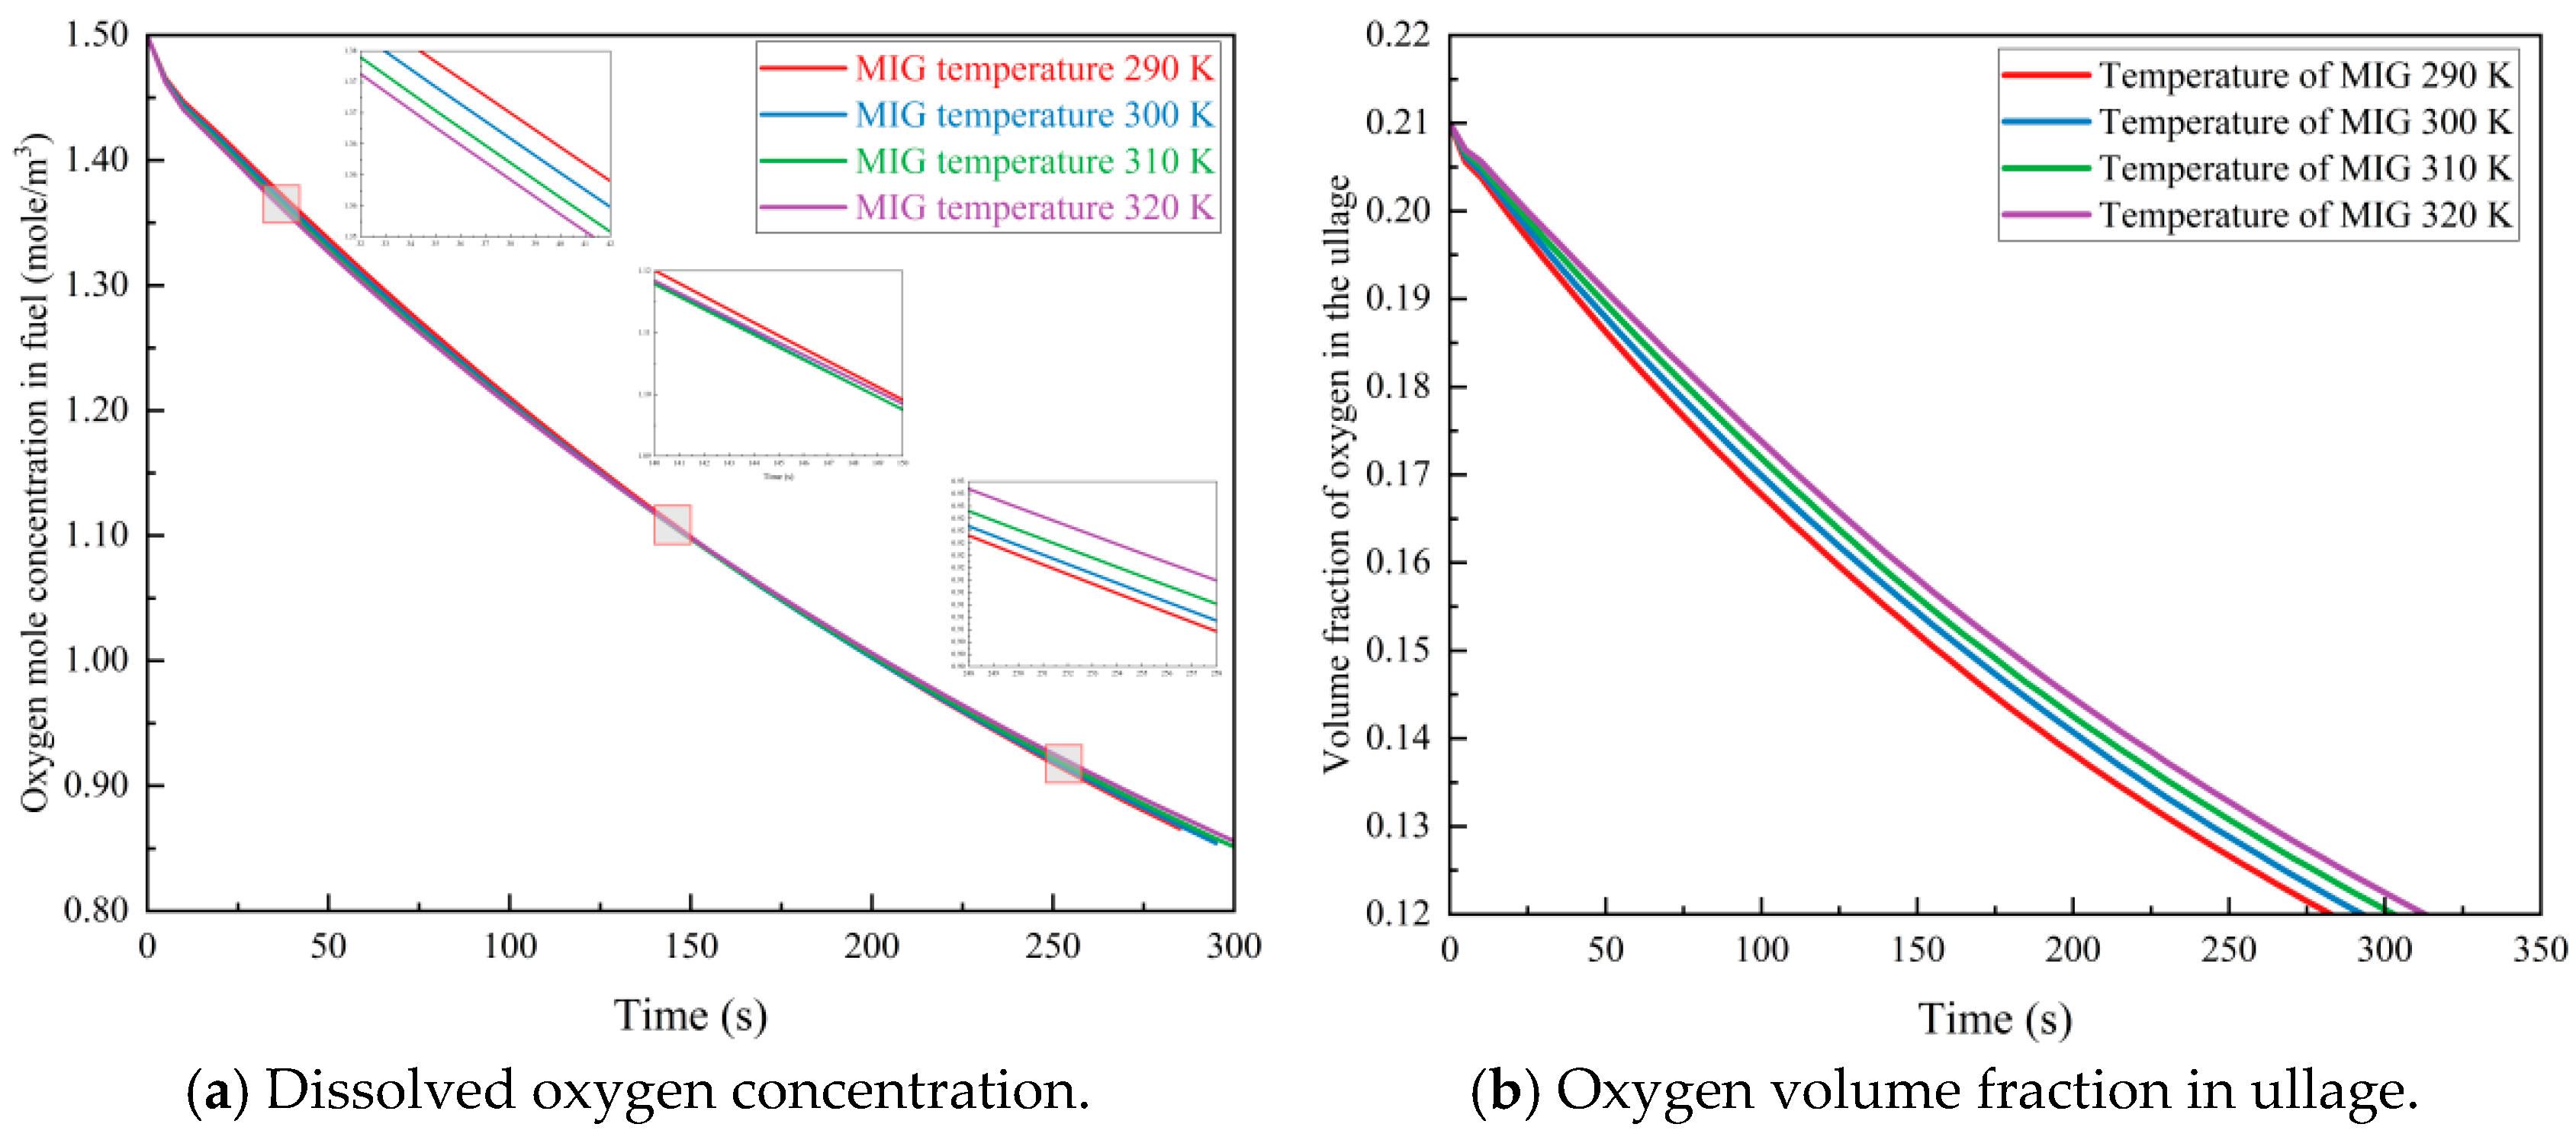
Under conditions of MIG superficial gas velocity of 0.06 m/s, bubble diameter of 1.0 mm, and fuel fill level of 80%, comparative analysis was conducted for deoxygenation performance evolution patterns during RP5 fuel scrubbing at MIG temperatures of 290 K, 300 K, 310 K, and 320 K.
As shown in Figure 9a, the RP5 fuel deoxygenation process exhibits significant temperature dependence, displaying pronounced “three-stage” evolution characteristics at different time scales. This phenomenon reflects dynamic competition between kinetic rates and thermodynamic equilibrium during scrubbing. In the early scrubbing stage, lower temperatures correspond to higher fuel dissolved oxygen concentrations. At this stage, the 320 K condition exhibited the fastest deoxygenation rate. This is primarily determined by kinetic factors: when temperature increases, oxygen molecular diffusion coefficients increase, thereby enhancing liquid-side KO. At this point, fuel is in an oxygen-rich state, with higher KOa enabling oxygen molecules to cross the gas–liquid interface into MIG bubbles more rapidly under high-temperature conditions. As scrubbing progresses, dissolved oxygen concentration curves at different temperatures gradually converge and cross. Around 120 s, dissolved oxygen concentration values under various temperature conditions were essentially identical (all near 1.160 mol/m3). This stage represents the transition point where the scrubbing mechanism shifts from “kinetic control” to “thermodynamic equilibrium control.” The rate advantage brought about by high temperature is gradually offset by its higher thermodynamic equilibrium limit. Entering the late scrubbing stage, curves display characteristics diametrically opposite to the early stage: lower temperatures correspond to lower dissolved oxygen concentrations. This reversal phenomenon is profoundly influenced by CO2 dissolution characteristics: CO2 solubility in aviation fuel far exceeds that of O2 and N2, and CO2 dissolution capacity strengthens further at low temperatures. Large quantities of CO2 entering the liquid phase occupy solvent space, producing a “site competition” effect, achieving deeper deoxygenation of RP5 fuel.
For ullage oxygen concentration changes, evolution patterns exhibited high consistency throughout the entire duration: lower MIG temperatures corresponded to faster decline rates and lower final concentrations of ullage oxygen concentration, as shown in Figure 9b. This macroscopic pattern directly reflects coupling contrasts in gas–liquid two-phase mass transfer. On one hand, as analyzed in the dissolved oxygen discussion above, under low-temperature conditions, the total amount of dissolved oxygen “rebounding” from the fuel and evolving into the ullage was substantially reduced. Since bubbles penetrating the liquid surface and rupturing release substantially reduced additional oxygen source terms mixing into the ullage space, this greatly alleviated oxygen loading burden in the ullage space, enabling MIG displacement and dilution of initial air to proceed more efficiently. On the other hand, although high temperatures accelerated fuel deoxygenation in the early scrubbing stage, the large quantities of oxygen molecules that were rapidly “stripped” and entered the gas phase space with the bubbles formed a strong oxygen reverse supplementation. This effect directly offset the background dilution effect of MIG, thereby inevitably delaying the overall decline process of gas phase oxygen concentration. Overall, employing lower temperature MIG for scrubbing not only achieves thorough fuel deoxygenation through physical dissolution competition mechanisms but also cuts off oxygen rebound at the source, ensuring rapid achievement and maintenance of an optimal explosion-proof inerting state in the ullage.
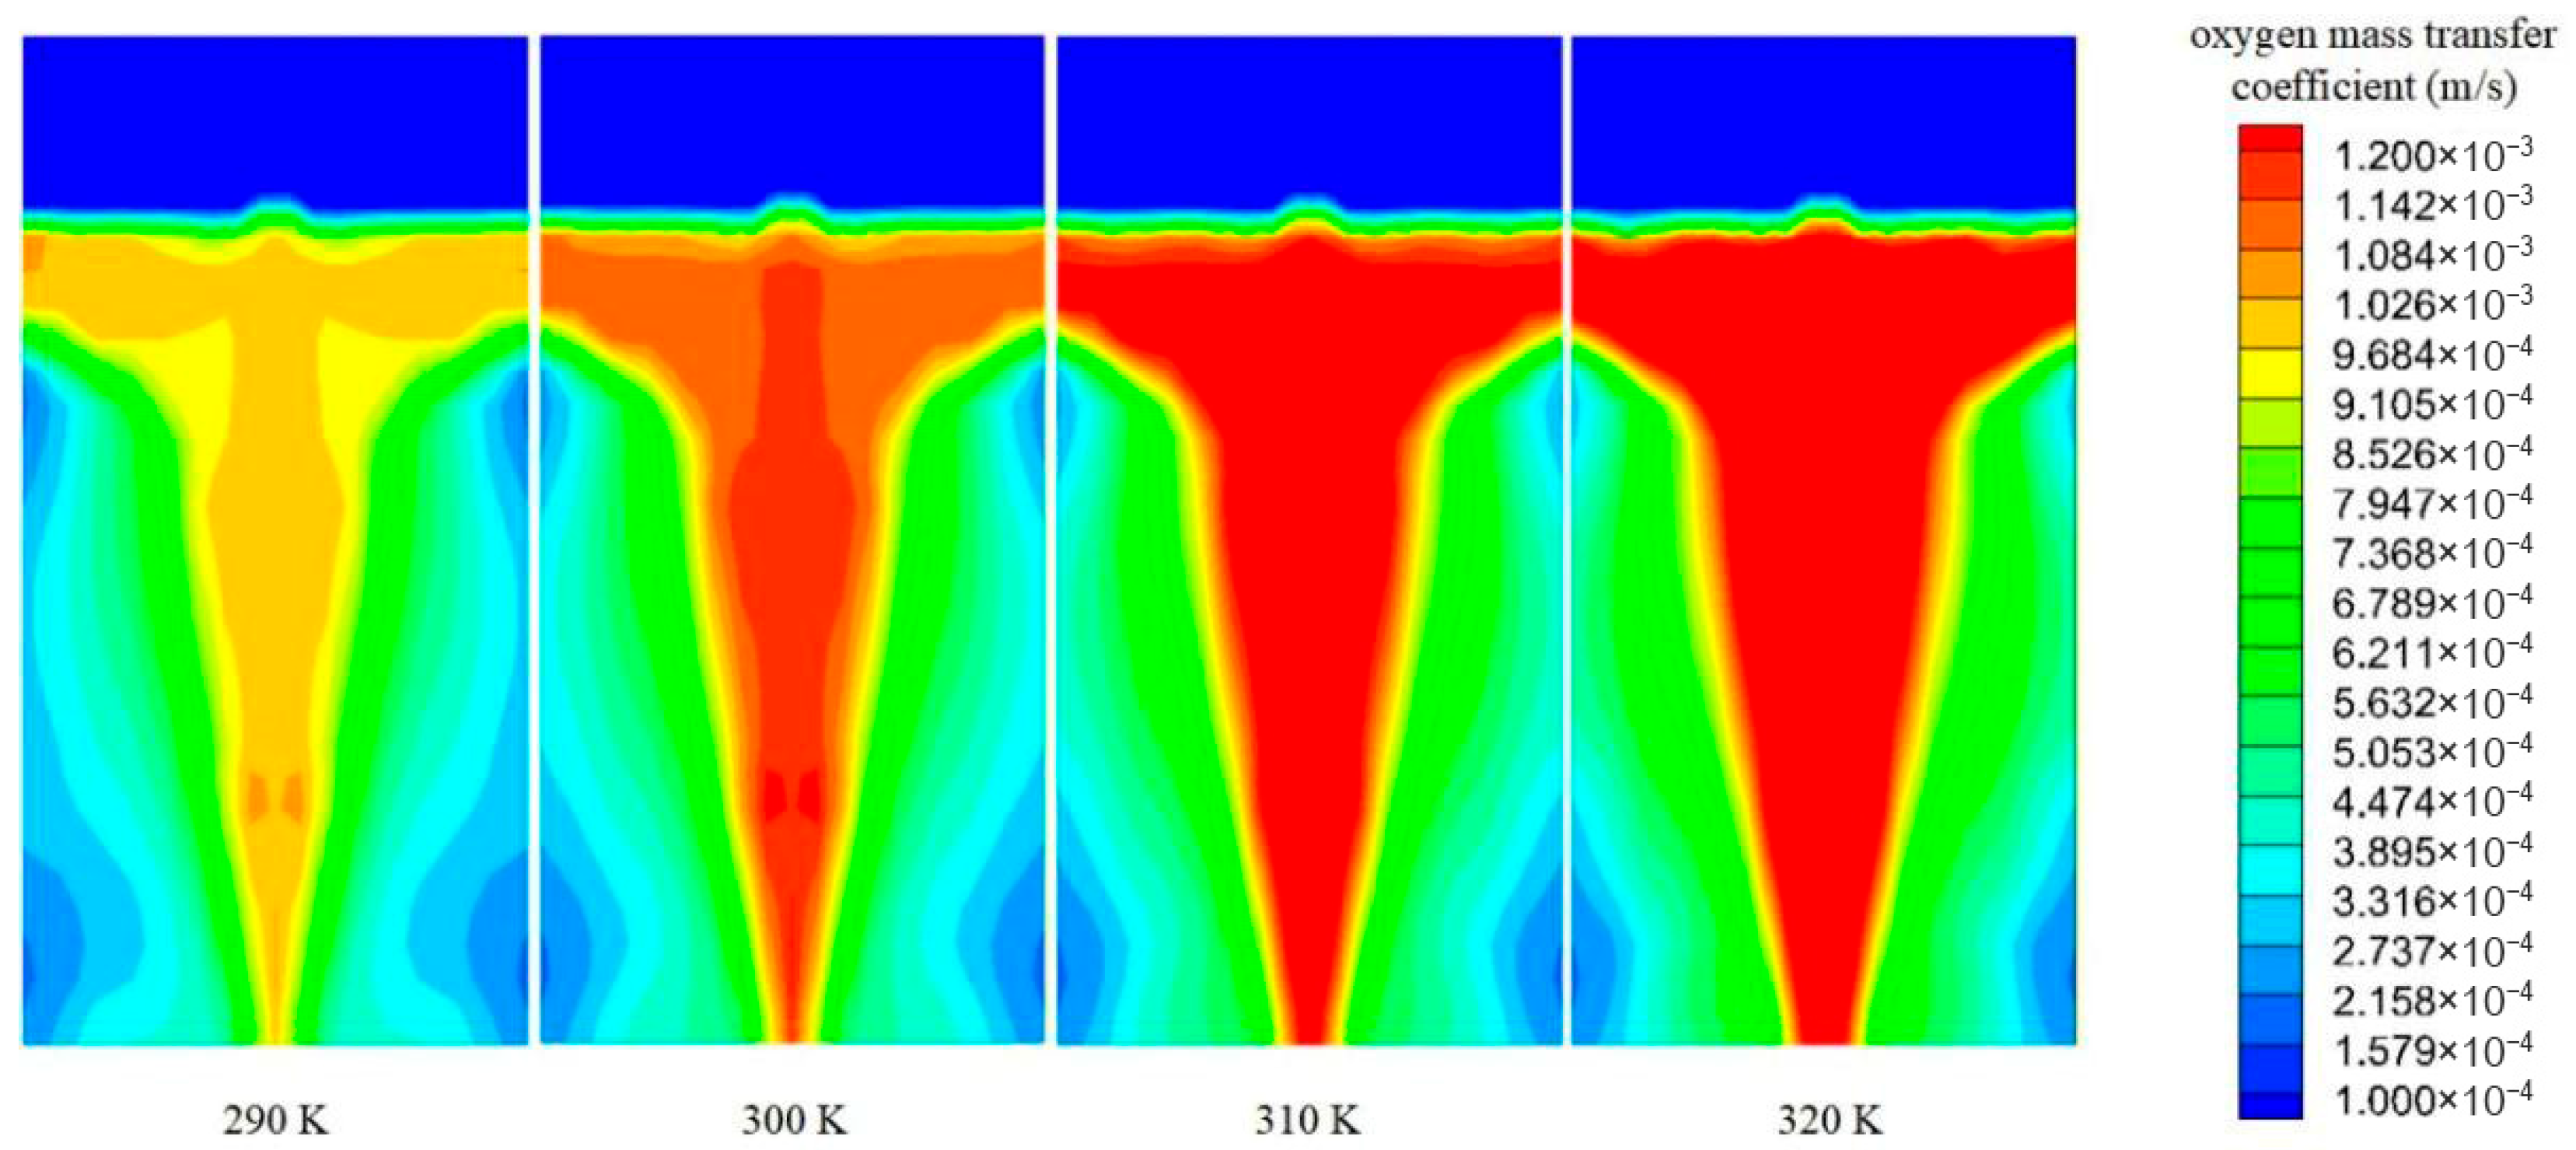
In Figure 10, contour plots of KO during fuel scrubbing at different MIG temperatures are presented. When MIG temperature gradually increased from 290 K to 320 K, the average liquid-side KO throughout the flow field increased from 6.152 × 10⁻⁴ m/s to 7.921 × 10⁻⁴ m/s, an increase of approximately 28.7%. High mass transfer coefficient regions were concentrated primarily in the mainstream zone directly above the gas distributor, and as temperature increased, zones of high oxygen mass transfer coefficient in the central region deepened continuously in color. This occurs because higher temperatures correspond to higher oxygen diffusion coefficients, enabling high-temperature conditions to maintain higher oxygen mass transfer coefficients in the macroscopic flow field.
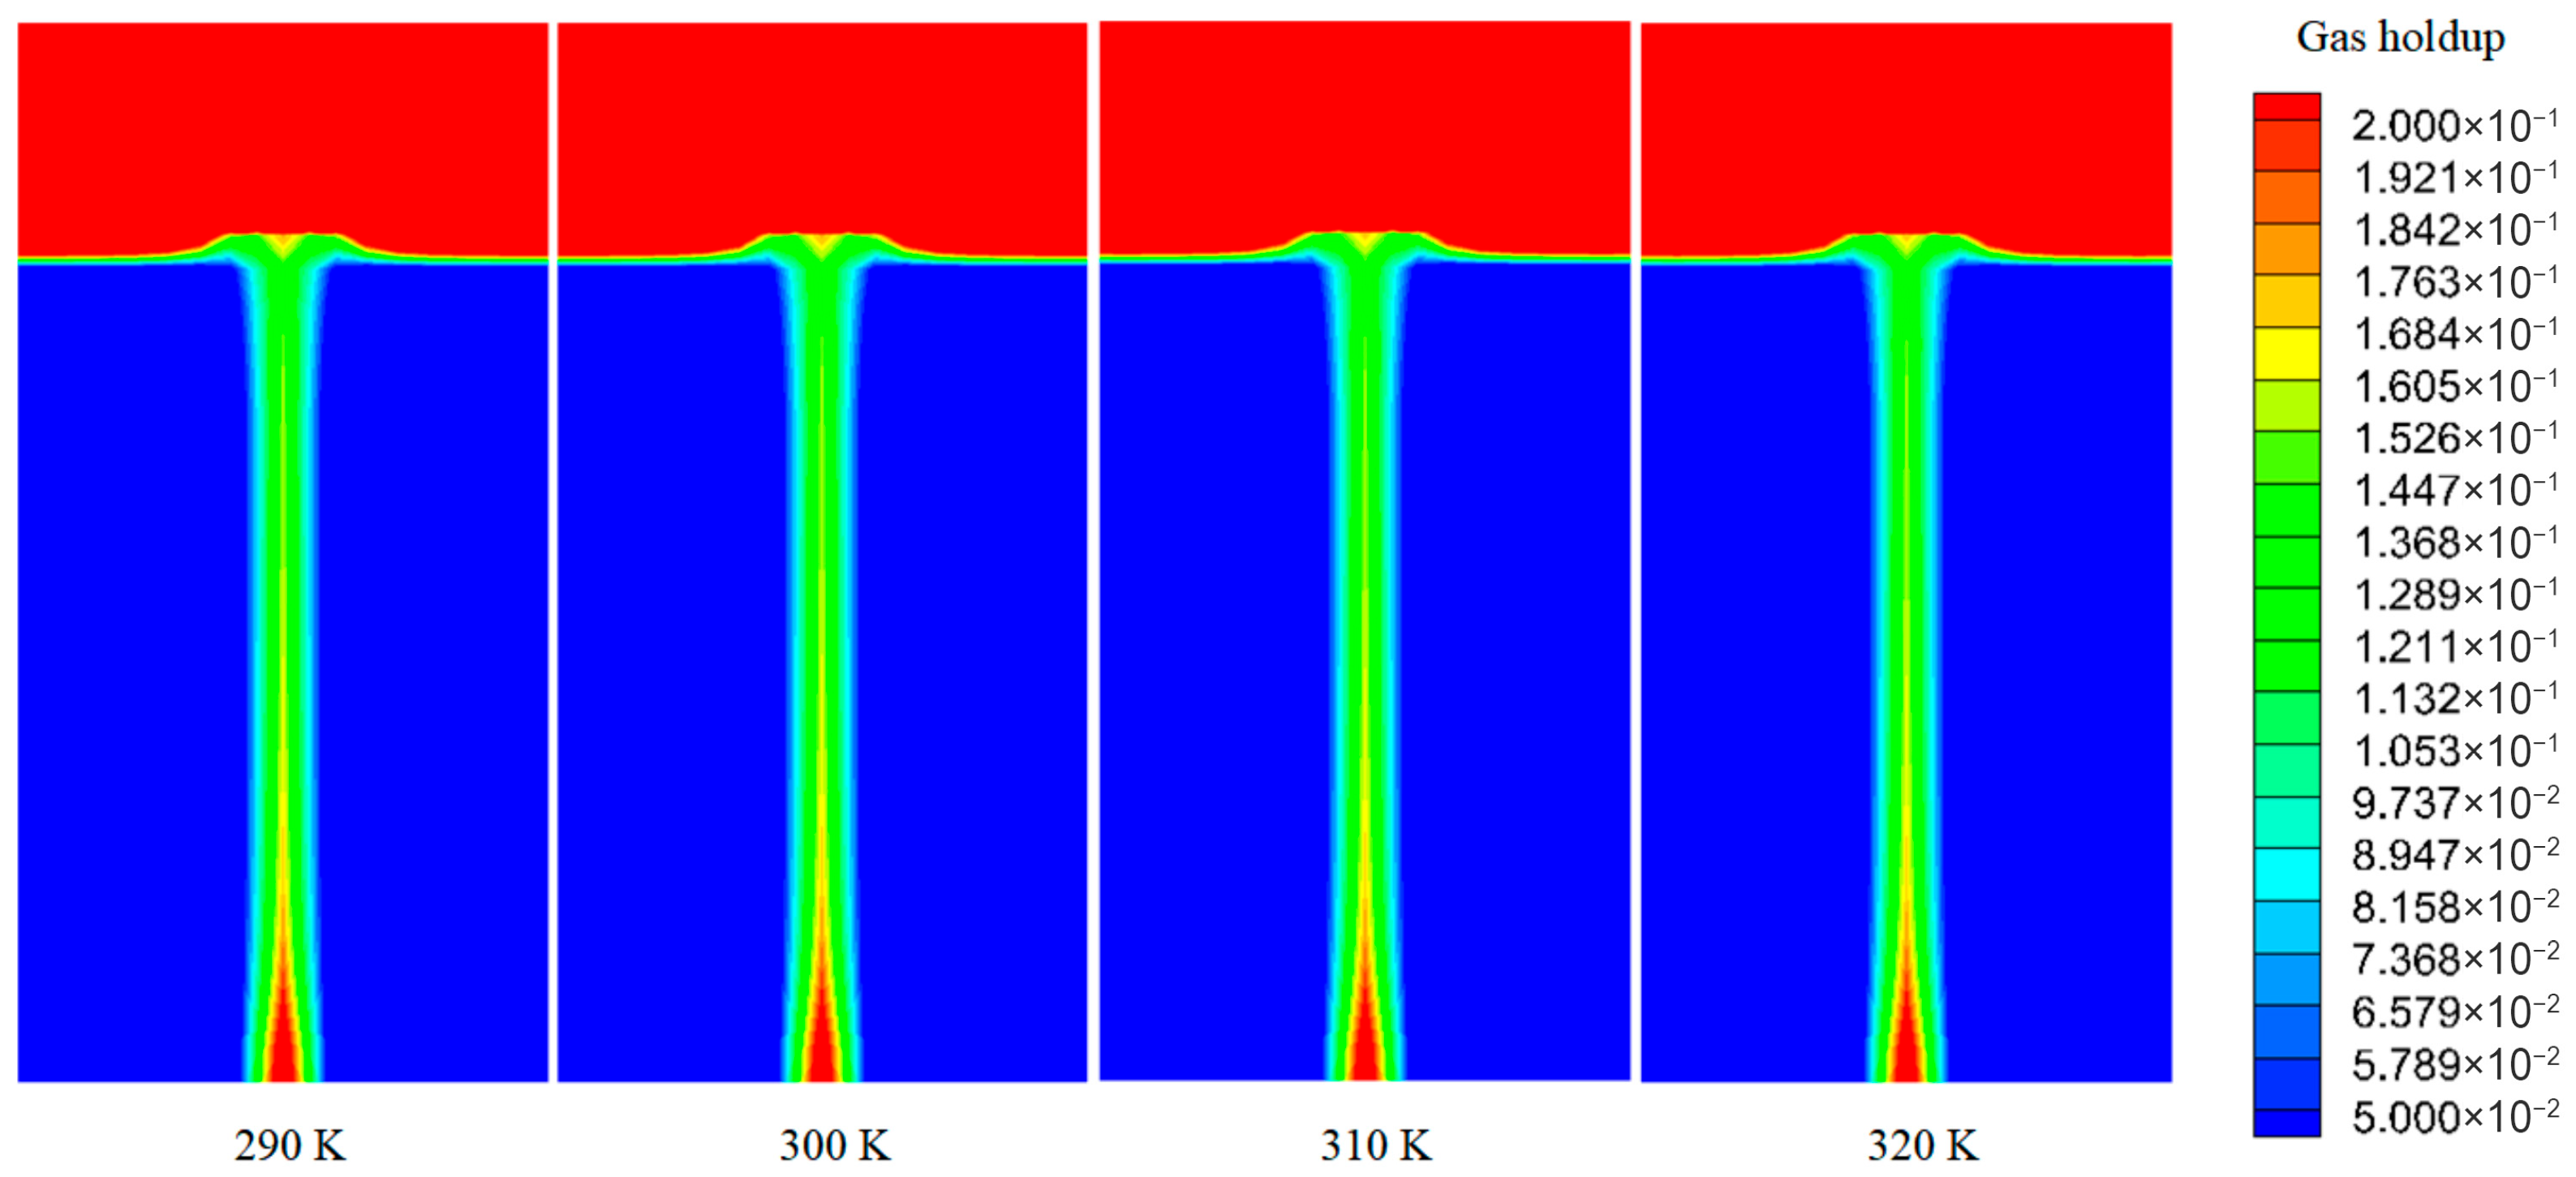
As shown in Figure 11, the MIG temperature (290–320 K) has a negligible impact on the gas holdup, which stays consistent at approximately 0.0127. This suggests that the thermal sensitivity of the scrubbing process is predominantly governed by the temperature-dependent mass diffusion coefficient and solubility, rather than the macroscopic gas–liquid distribution.
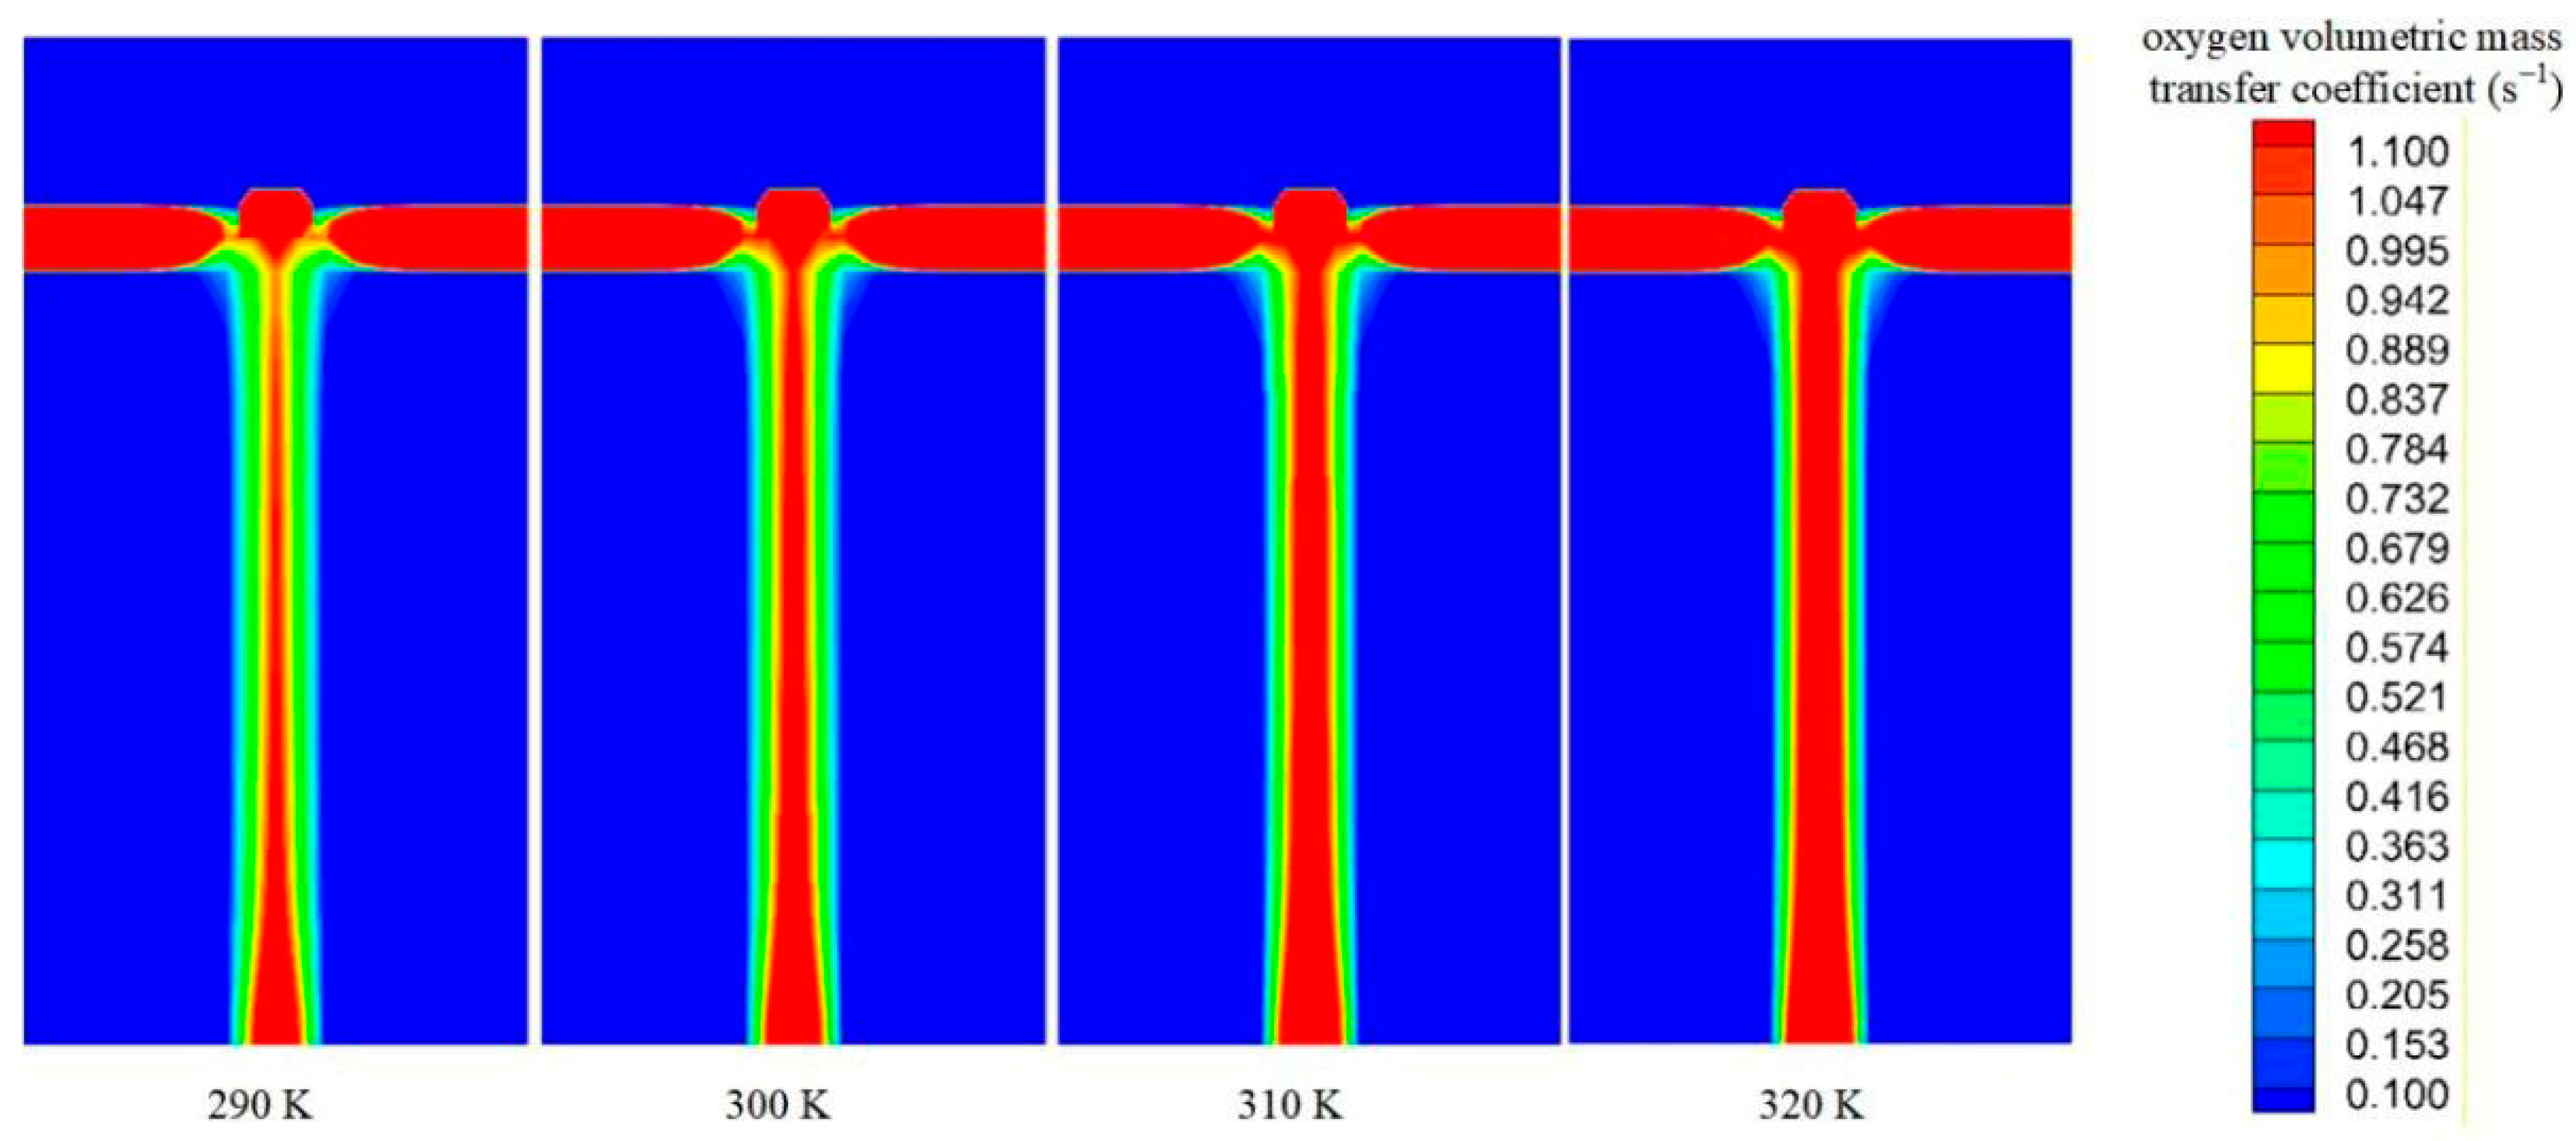
As shown in Figure 12, when MIG temperature increased from 290 K to 320 K, the average KOa throughout the flow field increased from 0.2445 s−1 to 0.2815 s−1, an increase of 15.1%. High mass transfer regions in macroscopic spatial morphology did not undergo significant radial broadening with temperature change, but remained highly concentrated at the tank central axis position, similar to Figure 7. However, although macroscopic contours of high mass transfer zones remained highly similar at different temperatures, internal mass transfer intensity underwent localized strengthening with increasing temperature. When temperature reached 320 K, KOa peak values in the central axis region increased significantly. Therefore, increasing MIG temperature, while failing to break flow field central constraints, achieves effective superposition and a leap of volumetric mass transfer intensity within the central plume zone through substantially enhanced interfacial mass transfer rates.

3.3. Effect of MIG Superficial Gas Velocity

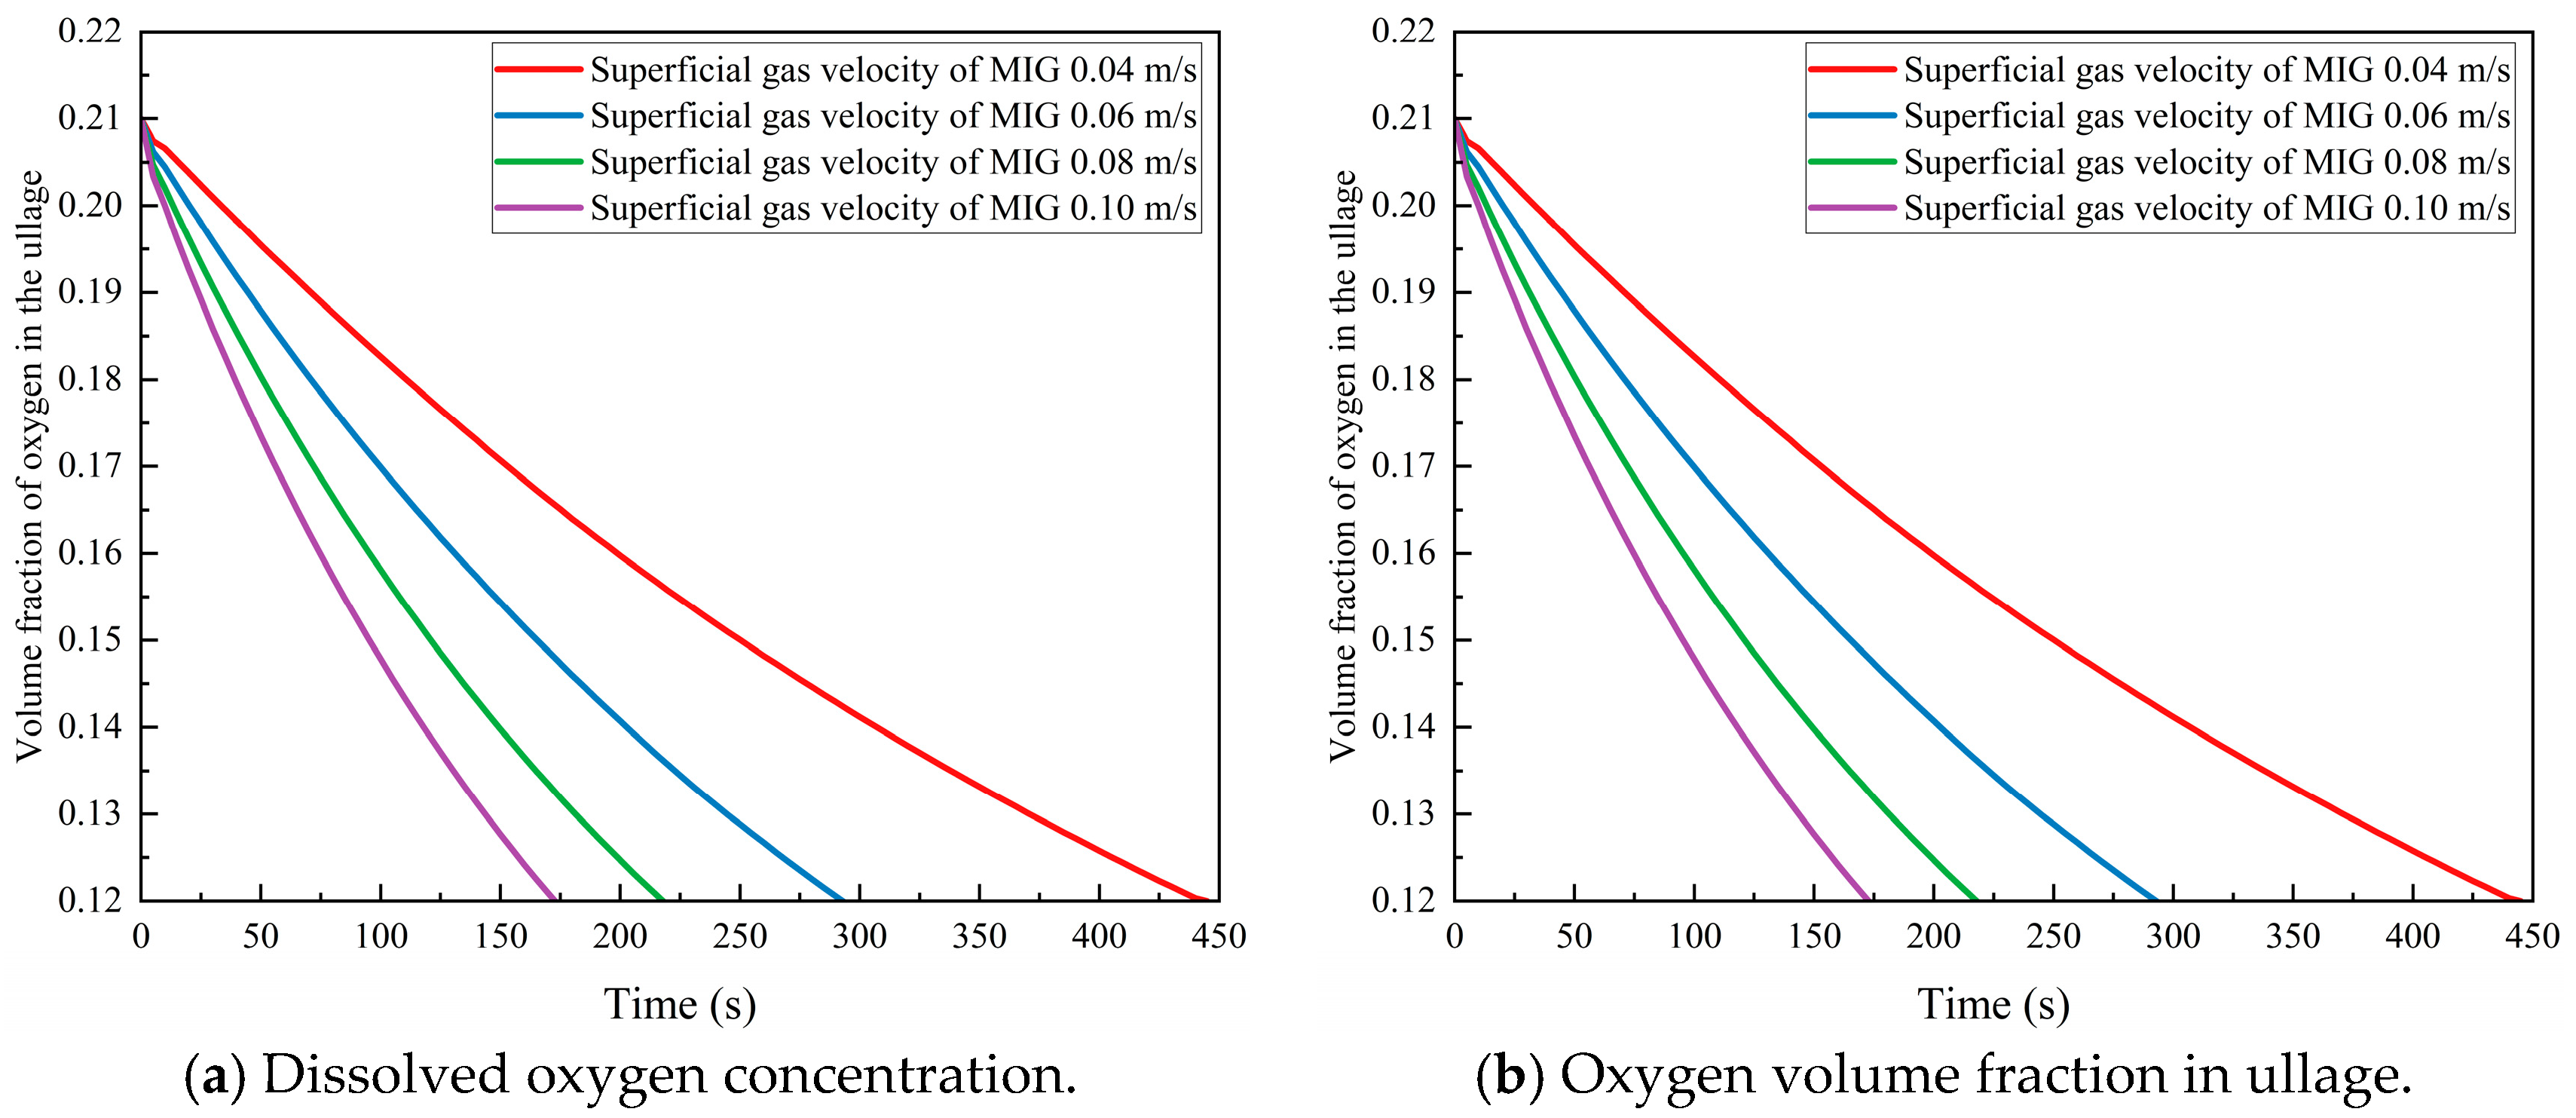
As shown in Figure 13a, increasing MIG superficial gas velocity can substantially accelerate RP5 fuel dissolved oxygen removal processes. In the early scrubbing stage, dissolved oxygen concentration decline trajectories at various gas velocities were relatively close. However, as scrubbing continued progressively, the dissolved oxygen concentration gap between 0.04 m/s and 0.10 m/s conditions expanded monotonically, with absolute concentration difference reaching 0.2981 mole/m3. At this point, fuel deoxygenation depth under high gas velocity conditions increased by approximately 25.4% compared to low gas velocity. On one hand, increasing superficial gas velocity directly leads to significant elevation of gas holdup within the flow field, multiplying the effective contact area between gas and liquid phases. On the other hand, higher gas velocity induces more intense liquid-phase turbulent pulsation and bubble wake-induced turbulence, continuously reducing liquid-side mass transfer resistance and enhancing mass transfer coefficients.
Figure 13b presents the decline curve of ullage oxygen concentration over time. The gas phase oxygen concentration difference between 0.04 m/s and 0.10 m/s expanded continuously from scrubbing initiation, with maximum ullage oxygen concentration difference reaching 4.53%. Increased superficial gas velocity multiplies physical displacement efficiency of original air in the gas phase space. Over time, low gas velocity conditions gradually become constrained by back-pressure accumulation from liquid-phase oxygen rebound, while high gas velocity conditions continuously break through this limitation through absolute volumetric flow rate advantage.
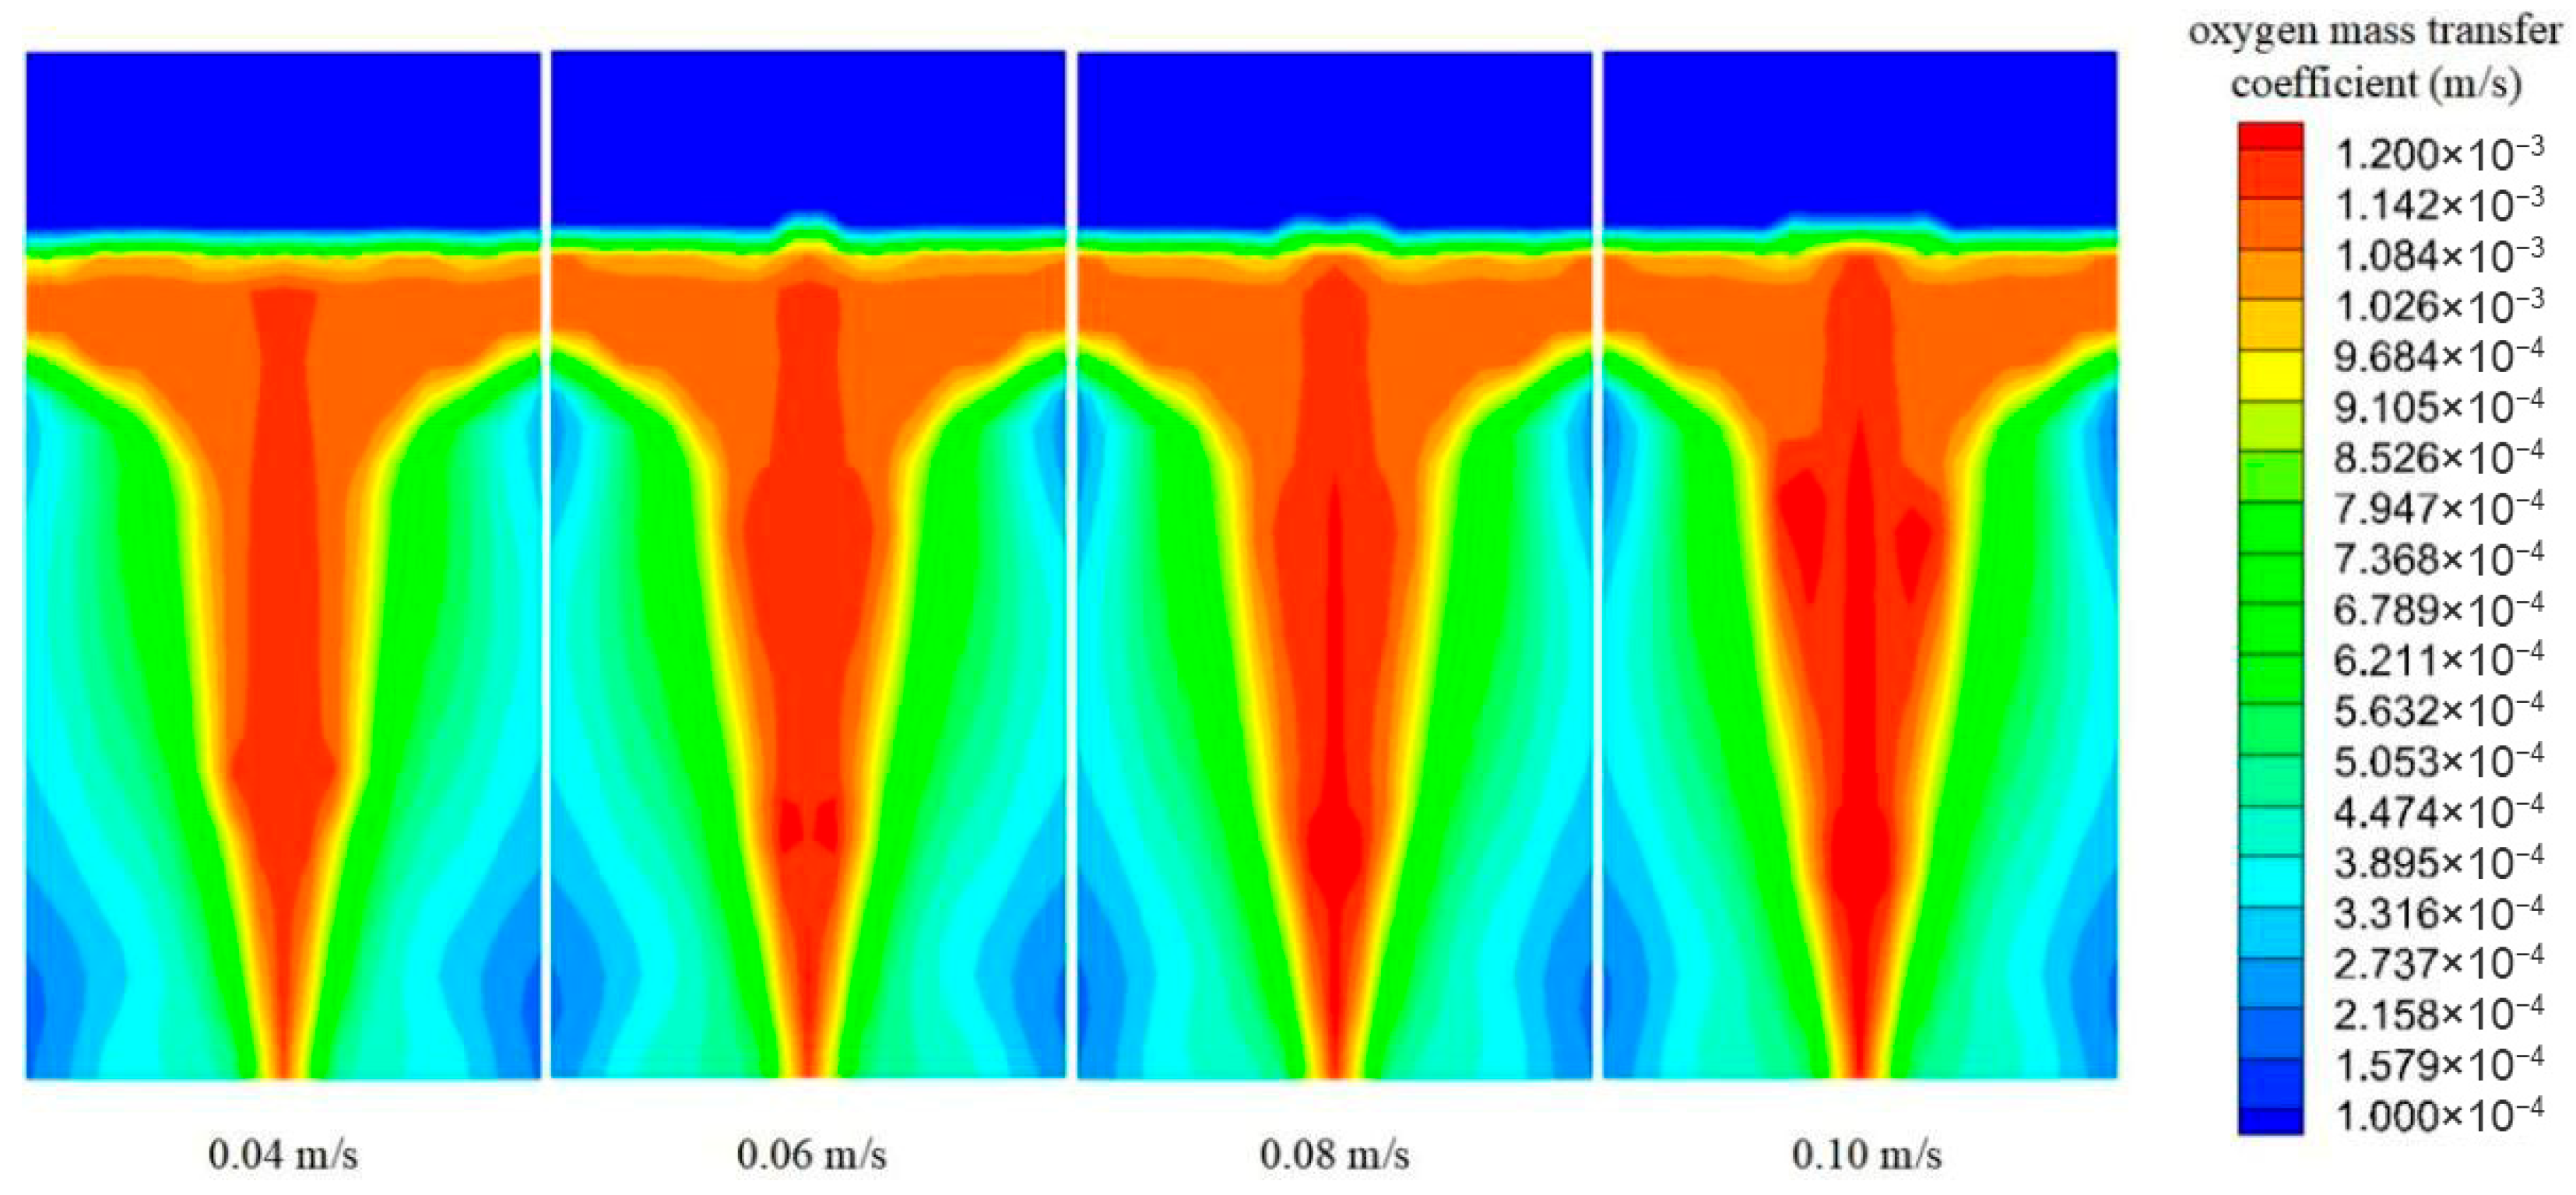
As shown in Figure 14, contour plots of KO during fuel scrubbing at different MIG superficial gas velocities are presented. When MIG superficial gas velocity gradually increased from 0.04 m/s to 0.10 m/s, the average liquid-side oxygen mass transfer coefficient throughout the flow field increased from 6.423 × 10⁻⁴ m/s to 6.925 × 10⁻⁴ m/s, an increase of approximately 8.44%. Increased superficial gas velocity directly causes overall rise velocity of MIG bubble swarms to accelerate, increasing absolute slip velocity between gas and liquid phases, thereby enhancing gas–liquid interfacial surface renewal frequency and elevating KO.
As shown in Figure 15, the superficial gas velocity is identified as the most dominant factor affecting gas holdup. By increasing the superficial gas velocity from 0.04 m/s to 0.10 m/s, the average gas holdup rises linearly from 0.0100 to 0.0175. This nearly 75% increase in gas holdup directly leads to a higher interfacial area concentration.
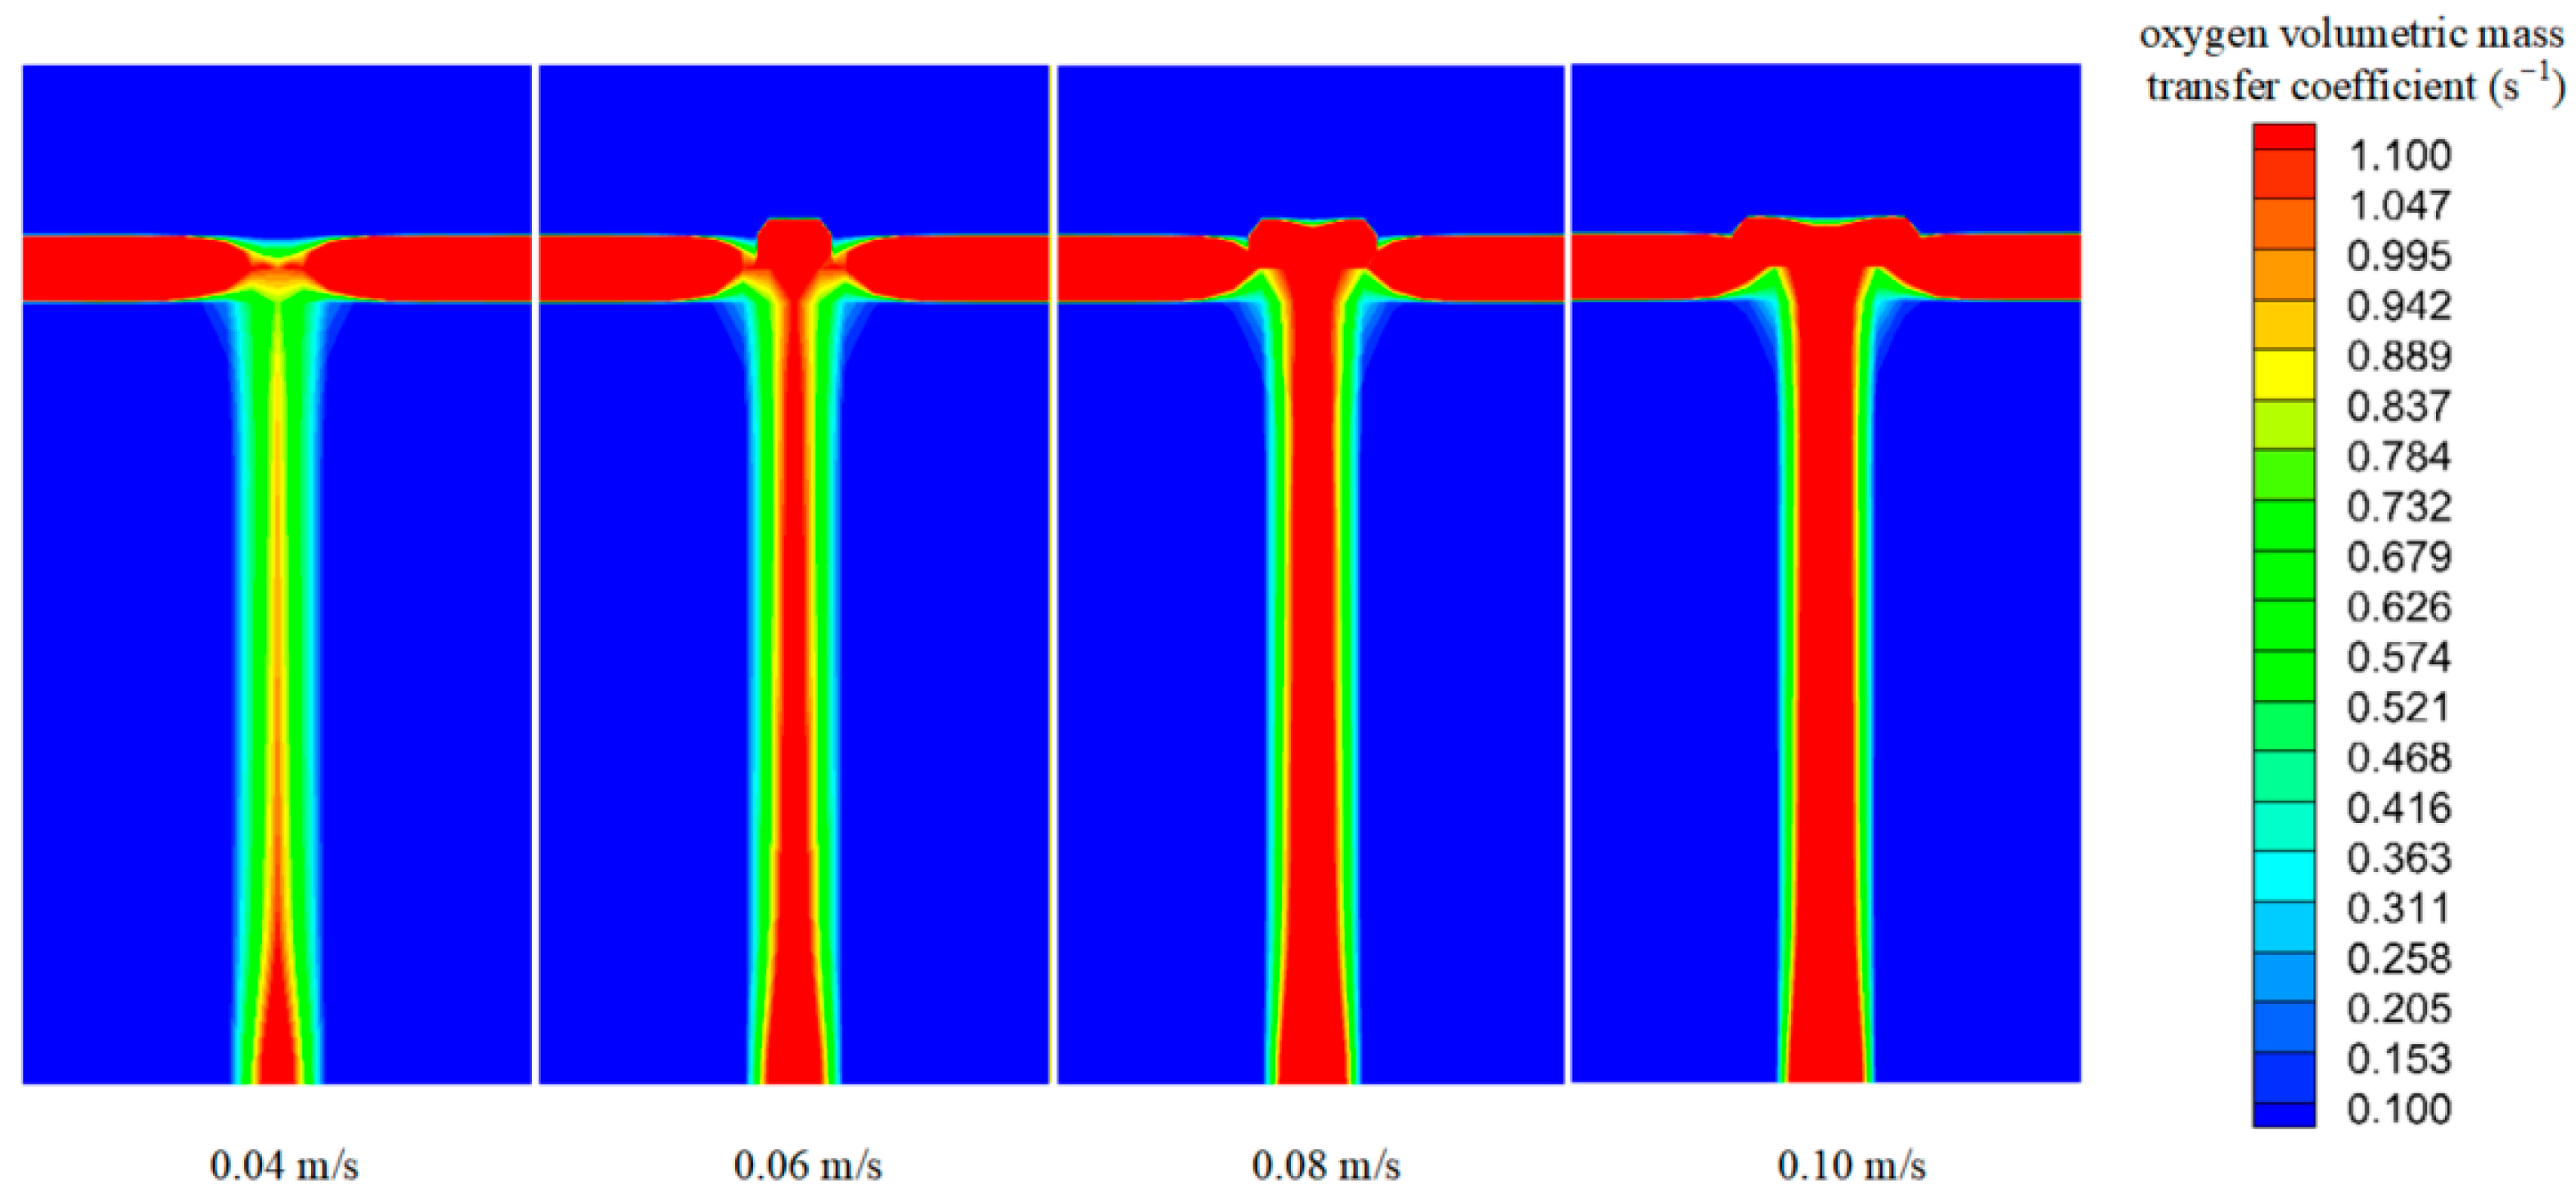
As shown in Figure 16, contour plots of KOa during fuel scrubbing at different MIG superficial gas velocities are presented. When MIG superficial gas velocity increased from 0.04 m/s to 0.10 m/s, the average KOa throughout the flow field increased from 0.2196 s−1 to 0.3434 s−1, an increase of 56.38%. Through comparative analysis of KO and KOa at different superficial gas velocities, the substantial improvement in overall deoxygenation performance from superficial gas velocity is attributed predominantly to increased interfacial area rather than improvement in single mass transfer coefficients. The high mass transfer region distribution morphology is similar to Figure 7 and Figure 11. Although increasing superficial gas velocity failed to break macroscopic flow field central constraints, through an extremely strong “area multiplication effect”, highly polarized and efficiently superposed mass transfer source terms were achieved within the central plume zone, ultimately constituting the physical core of the doubled leap in overall flow field scrubbing deoxygenation performance under high gas velocity conditions.

4. Conclusions

This study employed numerical simulation combined with experimental validation to deeply reveal multicomponent gas–liquid mass transfer dynamic evolution mechanisms during oxygen-consuming mixed inert gas scrubbing deoxygenation for high-vapor-pressure aviation fuel RP5. Research demonstrates that optimizing bubble scale and increasing inlet gas velocity can substantially enhance system macroscopic deoxygenation effectiveness. On the one hand, 1.0 mm micro-bubbles achieve localized polarization of mass transfer intensity in the central plume zone, causing oxygen volumetric mass transfer coefficient to jump 51.3% compared to 2.5 mm conditions. On the other hand, increasing superficial gas velocity triggers an intense “area multiplication effect” by elevating local gas holdup in the flow field, not only achieving a surge in the oxygen volumetric mass transfer coefficient up to 56.38% but also expanding the maximum difference in gas phase oxygen reduction performance throughout the scrubbing cycle to 4.53%, with this inerting advantage exhibiting a significant cumulative amplification trend over time. Particularly notable is that, due to physical intervention from strong CO2 dissolution characteristics in MIG, temperature’s influence on deoxygenation depth displays unique “three-stage” reversal characteristics: the early scrubbing stage dominated by kinetic diffusion mechanisms with more intense deoxygenation at high temperatures and the late scrubbing stage driven by thermodynamic equilibrium limits and CO2 competitive dissolution, where low-temperature conditions not only achieve deeper fuel deoxygenation but also substantially weaken oxygen rebound to the gas phase space, thereby obtaining superior gas phase dilution effects. In summary, in forward engineering design of novel onboard oxygen-consuming inerting systems, employing micro-pore gas distribution devices, maintaining higher superficial gas velocities, and combining the dynamic thermal management strategies of “early-stage heating for activation, late-stage cooling for deep deoxygenation” represent the optimal technical pathway for achieving full-envelope high-efficiency explosion protection for RP5 fuel tanks.

Author Contributions

Conceptualization, C.L. and Q.X.; methodology, C.L. and Y.Z.; software, C.L. and G.L.; writing—original draft preparation, C.L. and S.L.; writing—review and editing, S.L. and G.L. All authors have read and agreed to the published version of the manuscript.

Funding

This research was funded by National Natural Science Foundation of China, grant number 52502421, 52206013, and High-level talent work start-up fee funded project of the Jinling Institute of Technology of China, grant number jit-b-202044.

Data Availability Statement

The original contributions presented in this study are included in the article. Further inquiries can be directed to the corresponding author.

Conflicts of Interest

The authors declare no conflicts of interest.

References

  1. Charles, D. The Impact of Oil Prices on Guyana’s Real Exchange Rate: An AlphaFold-Decomposition Analysis. FinTech Sustain. Innov. 2026, 2, A3. [Google Scholar] [CrossRef]
  2. Cavage, W.M. Ground-Based Inerting of Commercial Transport Aircraft Fuel Tanks; DOT/FAA/AR-01/63; FAA William J. Hughes Technical Center: Atlantic City, NJ, USA, 2001.
  3. Summer, S.M. Mass Loading Effects on Fuel Vapor Concentrations in an Aircraft Fuel Tank Ullage; DOT/FAA/AR-TN99/65; FAA William J. Hughes Technical Center: Atlantic City, NJ, USA, 1999.
  4. Cai, Y.; Bu, X.; Lin, G.; Sun, B.; Zeng, Y.; Li, Z. Experimental study of an aircraft fuel tank inerting system. Chin. J. Aeronaut. 2015, 28, 394–402. [Google Scholar] [CrossRef]
  5. Tu, Y.; Du, C.; Zeng, Y. Experimental and numerical investigation of the aircraft fuel tank inerting system. Aust. J. Mech. Eng. 2023, 23, 99–109. [Google Scholar] [CrossRef]
  6. Feng, S.; Peng, X.; Chen, C.; Zhang, R.; Liu, W. Effect of air supplementation on the performance of an onboard catalytic inerting system. Aerosp. Sci. Technol. 2020, 97, 105605. [Google Scholar] [CrossRef]
  7. Martin, K.; Josef, K.; Andreas, F. Multifunctional fuel cell system in an aircraft environment: An investigation focusing on fuel tank inerting and water generation. Aerosp. Sci. Technol. 2013, 29, 330–338. [Google Scholar] [CrossRef]
  8. Shao, L.; Tan, J.; Liu, W.; Yang, J.; Hei, B.; Qu, J. System performance comparison of oxygen consumption and air separation for aircraft fuel tank inerting. Case Stud. Therm. Eng. 2024, 60, 104749. [Google Scholar] [CrossRef]
  9. Utsav, R.A.; Ajay, K.P. Optimization of an Electrochemical Gas Separation and Inerting. J. Electrochem. Soc. 2022, 169, 063514. [Google Scholar] [CrossRef]
  10. Frank, M.; Drikakis, D. Inert state of fuel tank during aircraft ascent. In Proceedings of the 55th AIAA Aerospace Sciences Meeting, Grapevine, TX, USA, 9–13 January 2017. [Google Scholar]
  11. Yuri, T.; Craig, P.L.; Amir, Z. Analytical investigation into the effects of nitrogen enriched air bubbles to improve aircraft fuel system water management. Proc. Inst. Mech. Eng. Part G J. Aerosp. Eng. 2019, 233, 861–870. [Google Scholar]
  12. Shao, L.; Feng, S.; Li, C.; Liu, W.; Huang, X. Effect of scrubbing efficiency on fuel scrubbing inerting for aircraft fuel tanks. Aircr. Eng. Aerosp. Technol. 2019, 91, 225–234. [Google Scholar] [CrossRef]
  13. Burns, M.; Cavage, W.M. Inerting of a Vented Aircraft Fuel Tank Test Article With Nitrogen-Enriched Air; DOT/FAA/AR-01/6; FAA William J. Hughes Technical Center: Atlantic City, NJ, USA, 2001.
  14. Li, C.; Feng, S.; Xu, L.; Peng, X.; Yan, Y. Gas–liquid mass transfer characteristics of aviation fuel scrubbing in an aircraft fuel tank. Sci. Rep. 2021, 11, 15426. [Google Scholar] [CrossRef]
  15. D2779-92; Standard Test Method for Estimation of Solubility of Gases in Petroleum Liquids. ASTM International: West Conshohocken, PA, USA, 2002.
  16. Shao, L.; Liu, W.; Li, C.; Feng, S.; Wang, C.; Pan, J. Experimental comparison between aircraft fuel tank inerting processes using NEA and MIG. Chin. J. Aeronaut. 2018, 31, 1515–1524. [Google Scholar] [CrossRef]
  17. Peng, X.; Wang, H.; Huang, L.; Liu, G.; Wang, C.; Feng, S. Performance of an oxygen-consuming inerting system for an aircraft fuel tank with RP-3 aviation fuel in flight. Aerosp. Sci. Technol. 2022, 123, 107446. [Google Scholar] [CrossRef]
  18. Li, C.; Liu, S.; Xu, L.; Feng, S.; Liu, G. Study on the deoxygenation characteristics of RP5 aviation fuel via nitrogen-enriched air scrubbing inerting. Sci. Rep. 2026, 16, 14313. [Google Scholar] [CrossRef]
  19. Cavage, W.M. The Effect of Fuel on an Inert Ullage in a Commercial Transport Airplane Fuel Tank; DOT/FAA/AR-05/25; FAA William J. Hughes Technical Center: Atlantic City, NJ, USA, 2005.
  20. Li, C.; Yang, H.; Liu, S.; Feng, S.; Xu, L.; Wang, Z. Performance Analysis and Optimization of Fuel Tank Ground-Based Washing Inerting on Unmanned Aerial Vehicles. Aerospace 2023, 10, 244. [Google Scholar] [CrossRef]
  21. Ruzicka, M.C.; Orvalho, S. Dynamic gas disengagement in bubble columns—Review. Chem. Eng. J. 2025, 525, 169497. [Google Scholar] [CrossRef]
  22. Yang, X.; Zhang, T.; Liu, Z.; Zhang, R.; Chen, C.; Li, Z.; Demeestere, K.; Van Hulle, S.W. Intensification of ozone gas/liquid mass transfer and ozonation efficiency: A critical review. Water Res. 2026, 288, 124719. [Google Scholar] [CrossRef]
  23. Shi, W.; Yang, X.; Sommerfeld, M.; Yang, J.; Cai, X.; Li, G.; Zong, Y. Modelling of mass transfer for gas-liquid two-phase flow in bubble column reactor with a bubble breakage model considering bubble-induced turbulence. Chem. Eng. J. 2019, 371, 470–485. [Google Scholar] [CrossRef]
  24. Yan, P.; Jin, H.; Gao, X.; He, G.; Guo, X.; Ma, L.; Yang, S.; Zhang, R. Numerical analysis of bubble characteristics in a pressurized bubble column using CFD coupled with a population balance model. Chem. Eng. Sci. 2021, 234, 116427. [Google Scholar] [CrossRef]
  25. Song, K.; Hibiki, T. Modeling interfacial area concentration in bubbly flow. Phys. Fluids 2025, 37, 073347. [Google Scholar] [CrossRef]
  26. Shen, X.; Jia, Z.; Zhang, H.; Wang, T. Numerical simulation of volumetric mass transfer coefficients in slurry bubble columns with a CFD-PBM coupled model. Chem. Eng. Sci. 2025, 318, 122153. [Google Scholar] [CrossRef]
  27. Li, Y.; Zhang, X.; Liu, S.; Li, C.; Cui, Y.; Shi, X.; Su, X.; Gao, J.; Lan, X. Numerical simulation of flow characteristics in microbubble column reactors with two different tubular gas spargers. Chem. Eng. Process. Process Intensif. 2025, 216, 110431. [Google Scholar] [CrossRef]
  28. Nedeltchev, S.; Mühlbauer, A.; Ferrario, A.; Varallo, N.; Marchini, S.; Pjontek, D.; Hlawitschka, M.W.; Besagni, G. Comprehensive Analysis of the Overall Gas Holdup Profiles in Various Air-Water Bubble Columns. J. Chem. Eng. Jpn. 2025, 58, 2588982. [Google Scholar] [CrossRef]
  29. Zhang, R.; Liu, W. Analysis of the influence of day and night temperature difference on oxygen concentration in ullage space of fuel tank. Aircr. Eng. Aerosp. Technol. 2023, 95, 358–364. [Google Scholar] [CrossRef]
  30. Liu, G.; Wang, L.; Wang, H.; Huang, L.; Peng, H.; Feng, S. Study on cooling inerting of an airborne fuel tank in flight. Aircr. Eng. Aerosp. Technol. 2022, 94, 1628–1635. [Google Scholar] [CrossRef]
  31. Shao, L.; He, J.; Lu, X.; Liu, W. Optimization Study of Inert Gas Distribution for Multiple-Bay Fuel Tank. Processes 2023, 11, 2441. [Google Scholar] [CrossRef]
  32. Jia, B.; Wang, D.; Zhao, Z.; Xu, Y.; Du, H.; Yao, C.; Han, D. The role of temperature non-uniformity in forced air pre-cooling of tomatoes: A comparative study. Int. Commun. Heat Mass Transf. 2026, 172, 110748. [Google Scholar] [CrossRef]
  33. Yarahmadi, S.; Asbagh, G.; Jafari, M. Computational fluid dynamics (CFD) in multiphase heat transfer: A critical systematic review of methods and applications. Int. Commun. Heat Mass Transf. 2026, 173, 110833. [Google Scholar] [CrossRef]
  34. Adzaklo, S.Y.; Sarkodie, K.; Agyei, E.; Yamoah, S.; Asiedu, N.Y. Investigation of drag models for simulation of gas-liquid two-phase flow systems. Sci. Rep. 2025, 15, 39440. [Google Scholar] [CrossRef]
  35. Liu, J. Chinese Jet Fuel; China Petrochemical Press: Beijing, China, 1991; pp. 139–140, 149–150. [Google Scholar]
  36. Li, C.; Liu, W.; Peng, X.; Shao, L.; Feng, S. Measurement of mass diffusion coefficients of O2 in aviation fuel through digital holographic interferometry. Chin. J. Aeronaut. 2019, 32, 1184–1189. [Google Scholar] [CrossRef]
  37. Feng, S.; Li, C.; Peng, X.; Shao, L.; Liu, W. Digital holography interferometry for measuring the mass diffusion coefficients of N2 in RP-3 and RP5 jet fuels. Aircr. Eng. Aerosp. Technol. 2019, 91, 1093–1099. [Google Scholar] [CrossRef]
  38. Li, C.; Feng, S.; Xu, L.; Wang, Z. Measurement of mass diffusion coefficient of CO2 in RP5 jet fuel. J. Beijing Univ. Aeronaut. Astronaut. 2022, 48, 412–418. [Google Scholar]
  39. Clift, R.; Grace, J.; Weber, M. Bubbles, Drops, and Particles; Academic Press: New York, NY, USA, 1978. [Google Scholar]
  40. Higbie, R. The rate of absorption of a pure gas into a still liquid during short periods of exposure. Trans. Am. Inst. Chem. Eng. 1935, 31, 365–389. [Google Scholar]
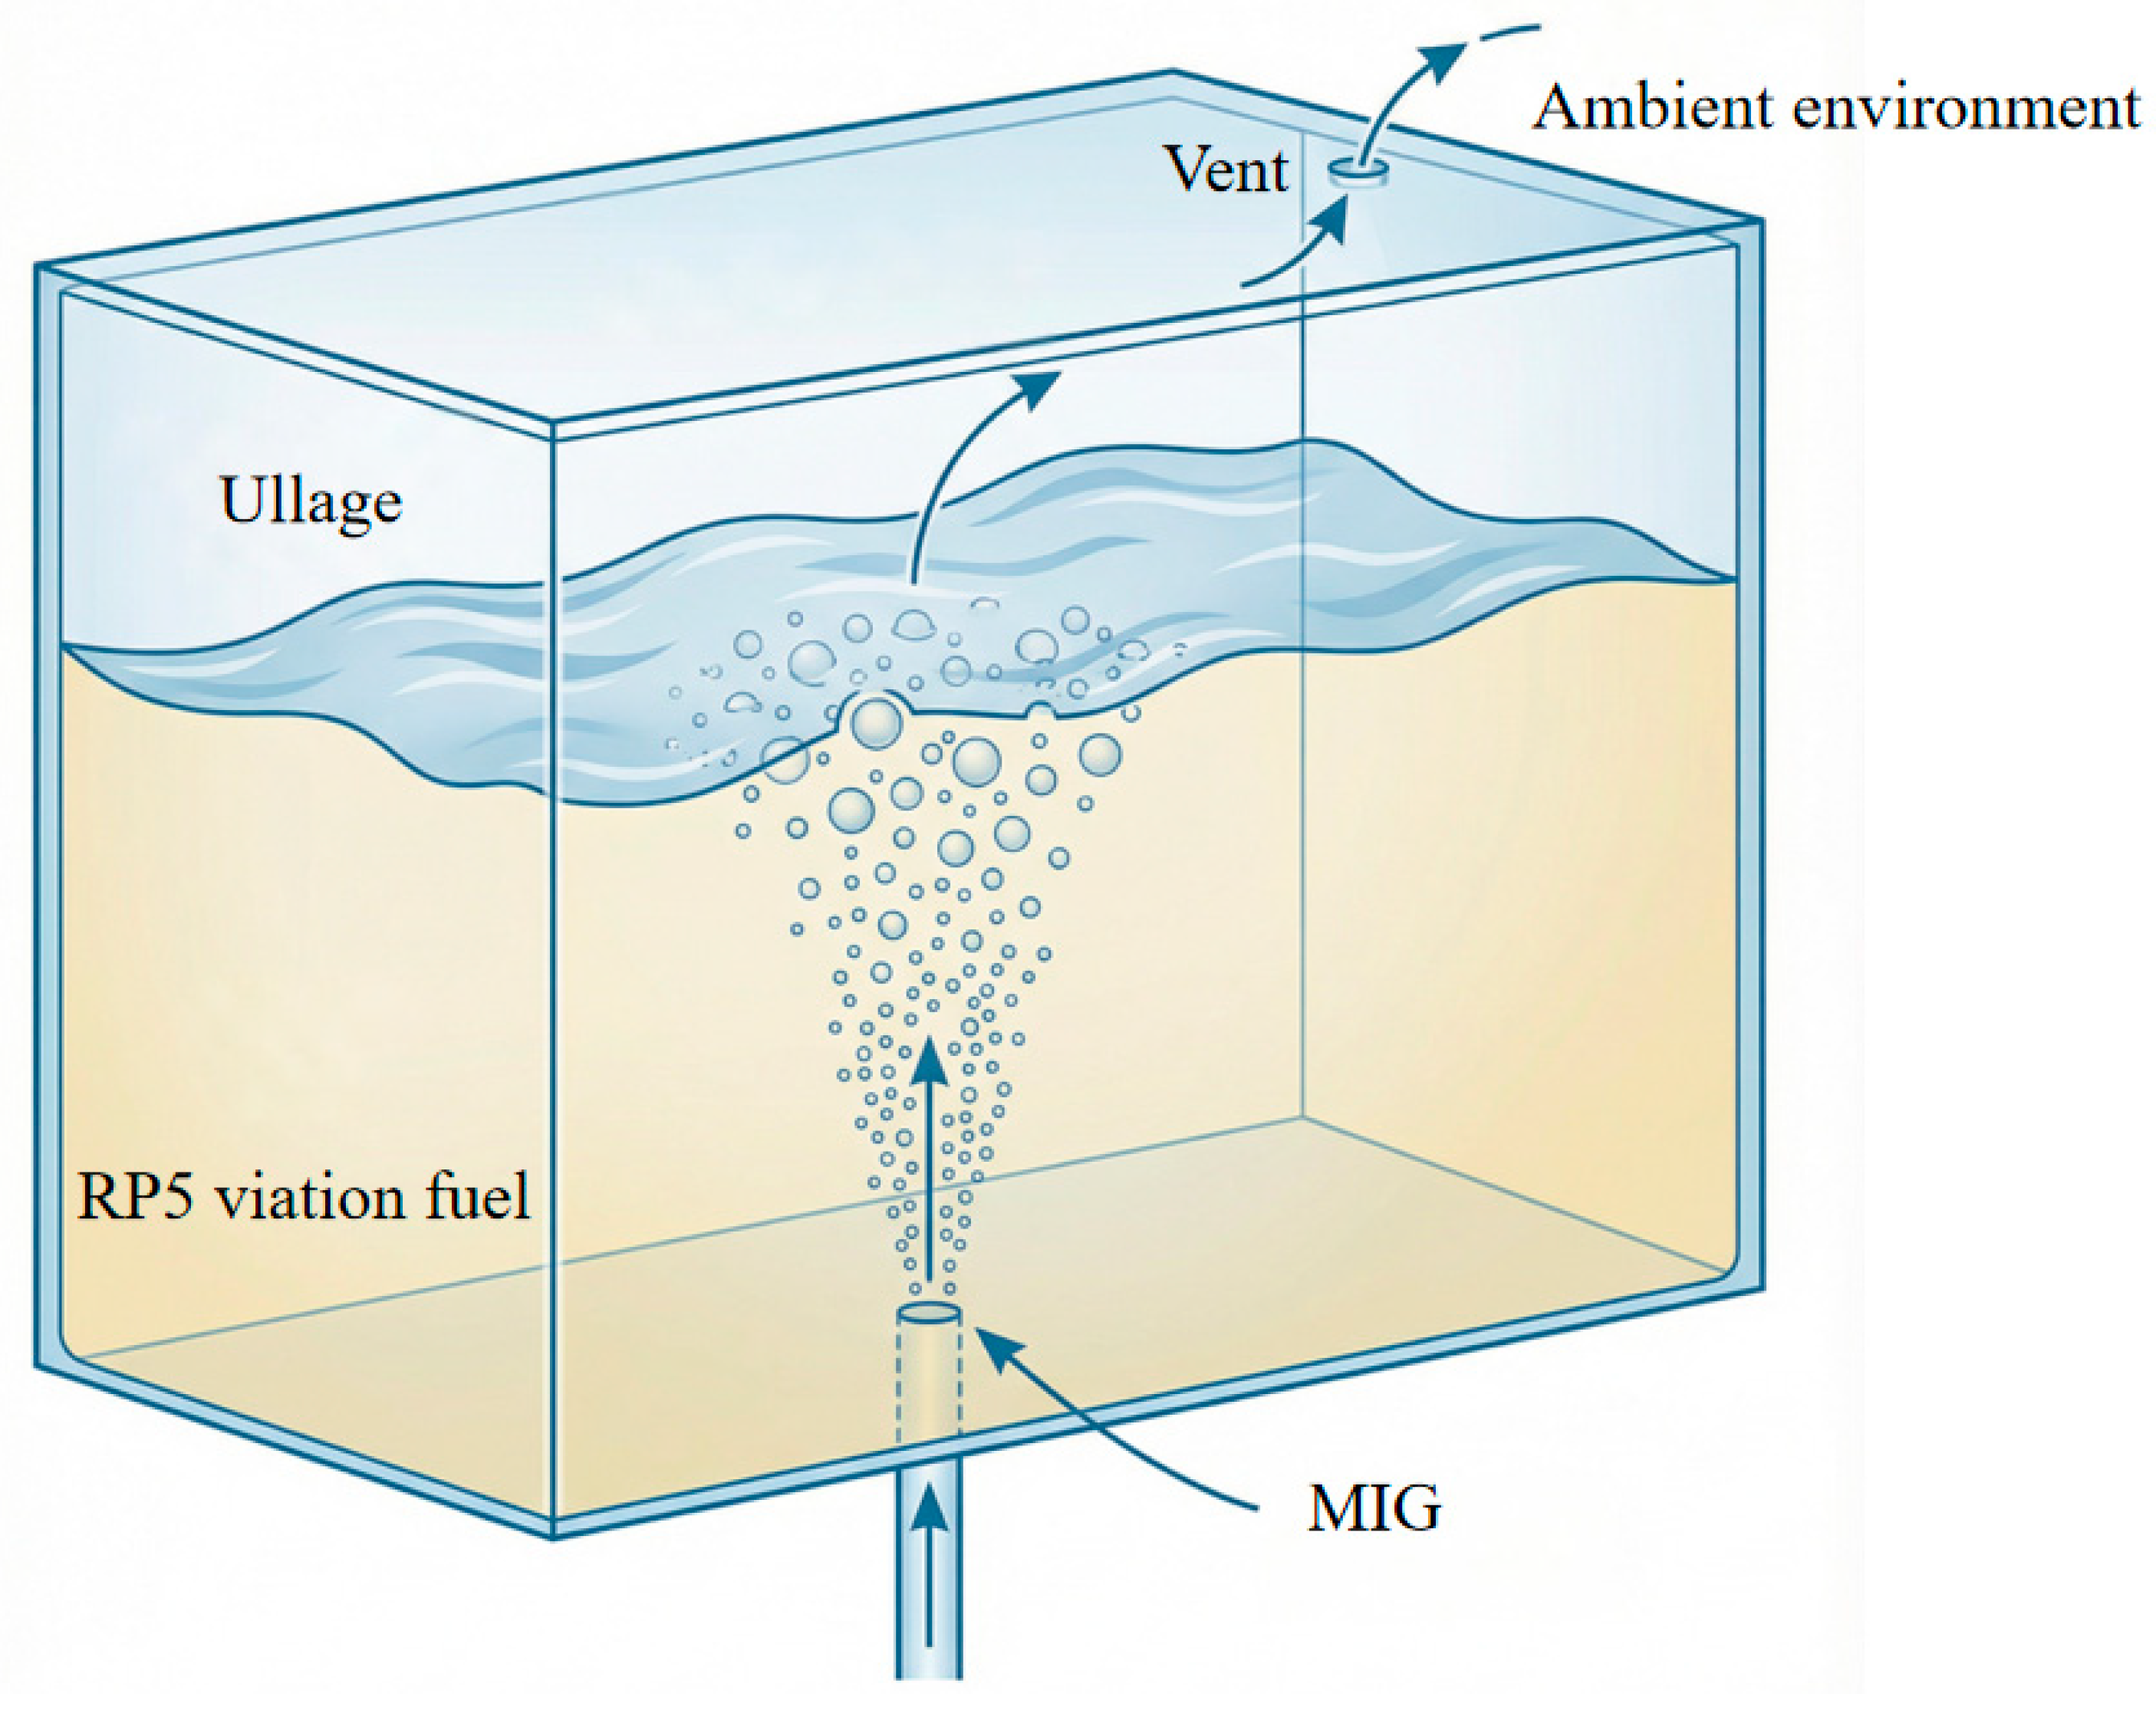
Figure 1. Schematic diagram of fuel scrubbing inerting system.
Processes 14 01537 g001
Figure 2. Experimental setup for fuel scrubbing inerting system.
Processes 14 01537 g002
Figure 3. Morphology and size distribution of MIG bubbles.
Processes 14 01537 g003
Figure 4. Comparison between CFD simulation and experimental measurements.
Processes 14 01537 g004
Figure 5. Oxygen concentration variation with different MIG bubble diameters.
Processes 14 01537 g005
Figure 6. Oxygen mass transfer coefficient with different MIG bubble diameters.
Processes 14 01537 g006
Figure 7. Gas holdup with different MIG bubble diameters.
Processes 14 01537 g007
Figure 8. Oxygen volumetric mass transfer coefficient with different MIG bubble diameters.
Processes 14 01537 g008
Figure 9. Oxygen concentration variation with different MIG temperature.
Processes 14 01537 g009
Figure 10. Oxygen mass transfer coefficient with different MIG temperatures.
Processes 14 01537 g010
Figure 11. Gas holdup with different MIG temperatures.
Processes 14 01537 g011
Figure 12. Oxygen volumetric mass transfer coefficient with different MIG temperature.
Processes 14 01537 g012
Figure 13. Oxygen concentration variation with different MIG superficial gas velocities.
Processes 14 01537 g013
Figure 14. Oxygen mass transfer coefficient with different MIG superficial gas velocities.
Processes 14 01537 g014
Figure 15. Gas holdup with different MIG superficial gas velocities.
Processes 14 01537 g015
Figure 16. Oxygen volumetric mass transfer coefficient with different MIG superficial gas velocities.
Processes 14 01537 g016
Disclaimer/Publisher’s Note: The statements, opinions and data contained in all publications are solely those of the individual author(s) and contributor(s) and not of MDPI and/or the editor(s). MDPI and/or the editor(s) disclaim responsibility for any injury to people or property resulting from any ideas, methods, instructions or products referred to in the content.