1. Introduction
Methods for producing micro- and nanoparticles using carbon dioxide are widely studied for pharmacological applications due to the high purity of the final product [
1]. Supercritical (SC) carbon dioxide is used as a safe “green” solvent for pharmaceutical compounds due to its unique properties: chemical inertness, non-toxicity, non-flammability, and technologically accessible critical parameters (T
cr = 304 K, P
cr = 73.8 bar), as well as extremely low viscosity, high diffusion and thermal conductivity coefficients, and finely tunable density and solvent power [
2], which can be precisely adjusted by varying the pressure and temperature of the medium. During rapid adiabatic expansion in a nozzle of a solution of a target substance in supercritical carbon dioxide into a chamber with reduced pressure (an expansion chamber), a liquid jet of this solution is formed, which almost immediately disintegrates into a gas-droplet jet consisting of molecules, clusters, and droplets of the target substance solution in liquid CO
2. Consequently, during further expansion, droplet evaporation occurs, leading to the formation of solid aggregates whose geometric shape correlates with the shape of the droplets in the initial gas-droplet medium. It should be noted that due to the significant non-equilibrium nature of the expansion process, precipitation predominantly leads to the formation of amorphous aggregates. This principle underlies micronization via the rapid expansion of the supercritical solutions (RESS) method [
3]. This approach enables the production of smaller particles with a narrower size distribution compared to “classical” methods such as mechanical grinding and spray drying [
4]. However, it should be noted that during the injection of the solution into the expansion chamber, the initial pressure and temperature conditions in the supercritical reactor inevitably change. This leads to variations in the size of the target substance aggregates in the jet and, consequently, to broadening of the final particle size distribution in the expansion chamber. The traditional approach to studying the RESS process involves analyzing the final product—particles deposited on a substrate—using scanning electron microscopy (SEM) or X-ray diffraction analysis. Such post factum analysis, while serving as the “gold standard” for validation, has several significant drawbacks. It does not allow real-time observation of the process dynamics, and the transport of particles from the jet expansion zone to the substrate, as well as their subsequent agglomeration, can distort the true nucleation and growth behavior. Meanwhile, the process of adiabatic expansion of the solution into vacuum is extremely rapid, occurring at or even above the speed of sound. In the initial stages of expansion, large clusters or droplets may flow from the nozzle, with their size and composition changing within fractions of a second as the solution in the reactor becomes depleted. Understanding this dynamic is critically important for controlling the final product properties; however, most experimental methods do not allow one to peer into the “black box” of the expanding jet.
In this work, we investigate the dynamics of particle formation in the jet using an in situ method of time-resolved scattering indicatrix registration. The light scattering indicatrix is unique for a given radiation wavelength, size, and shape of the scattering particles. This property is used for determining the size of particles [
5]. For diagnostics of a particle ensemble in a jet using light scattering, it is necessary to minimize secondary multiple scattering effects (where a wave scattered by one particle interacts with another particle). In such a case, the integral scattering indicatrix will be determined by the sum of the contributions from individual particles. Assuming spherical particle shape in the jet, the Mie solution can be applied to describe the scattering of a plane electromagnetic wave [
6]. Thus, the particle size distribution is established by fitting, whereby the calculated scattering indicatrix describes the experimental data. In the experiment, for each scattering angle, the time dependence of the scattering signal amplitude on the jet lifetime can be recorded. Modern methods allow data acquisition rates up to the GHz level, providing sub-nanosecond temporal resolution of the process. Consequently, it becomes technically feasible to measure the evolution of the scattering indicatrix during jet expansion, followed by reconstruction of the particle formation dynamics. The proposed time-resolved technique enables real-time monitoring of particle size changes directly in the jet, providing unique information on the jet dynamics. The method significantly differs from previous studies on nanoparticle generation using Mie scattering diagnostics, which were aimed at monitoring the final particle size distribution. For example, in studies [
7,
8,
9,
10], the three-wavelength extinction measurement (3-WEM) technique was employed to monitor the resulting particles during the RESS process. The small size of the particle jet, combined with low particle concentration and short pulse duration, often prevents the detection of significant spectral changes in the probing radiation. In contrast, high-power laser radiation (P > 1 W) can be used to measure scattering patterns, which resolves this issue. In our study of the dynamics of laser ablation of gold particles on time scales of 10–1000 μs in supercritical carbon dioxide, we also successfully applied optical diagnostics based on Mie scattering [
11].
We developed this technique to investigate the formation of solute particles during explosive boiling of their solutions. Carbon dioxide with ibuprofen was used as a model solution. The process under study is a variant of RESS. A liquid solution of ibuprofen in carbon dioxide is created in the reactor under subcritical conditions (302 K and 71 bar). Upon opening the valve to the expansion chamber, the vapor pressure above the liquid drops sharply, inducing explosive boiling of the solution. The dynamics of the decomposition of an ibuprofen solution in liquid CO
2, superheated as a result of a sharp drop in vapor pressure above it, is such that during its explosive boiling, large liquid aggregates of the solution are initially formed, which then, if they also happen to be in a superheated state, disintegrate into smaller aggregates, and so on, until stable drop-lets are formed, the size of which is determined by the experimental conditions [
12]. Simultaneously, in the same time sequence, they enter the nozzle and, upon expansion, form amorphous ibuprofen aggregates as a result of solvent evaporation. This approach will allow greater micronization efficiency to be achieved due to medium fragmentation prior to the atomization stage. Thus, the aim of this work is to investigate the dynamics of ibuprofen microparticle formation during vacuum expansion of a jet produced by explosive boiling of a liquid CO
2 solution with ibuprofen, using an in situ method of time-resolved Mie scattering indicatrix registration.
2. Materials and Methods
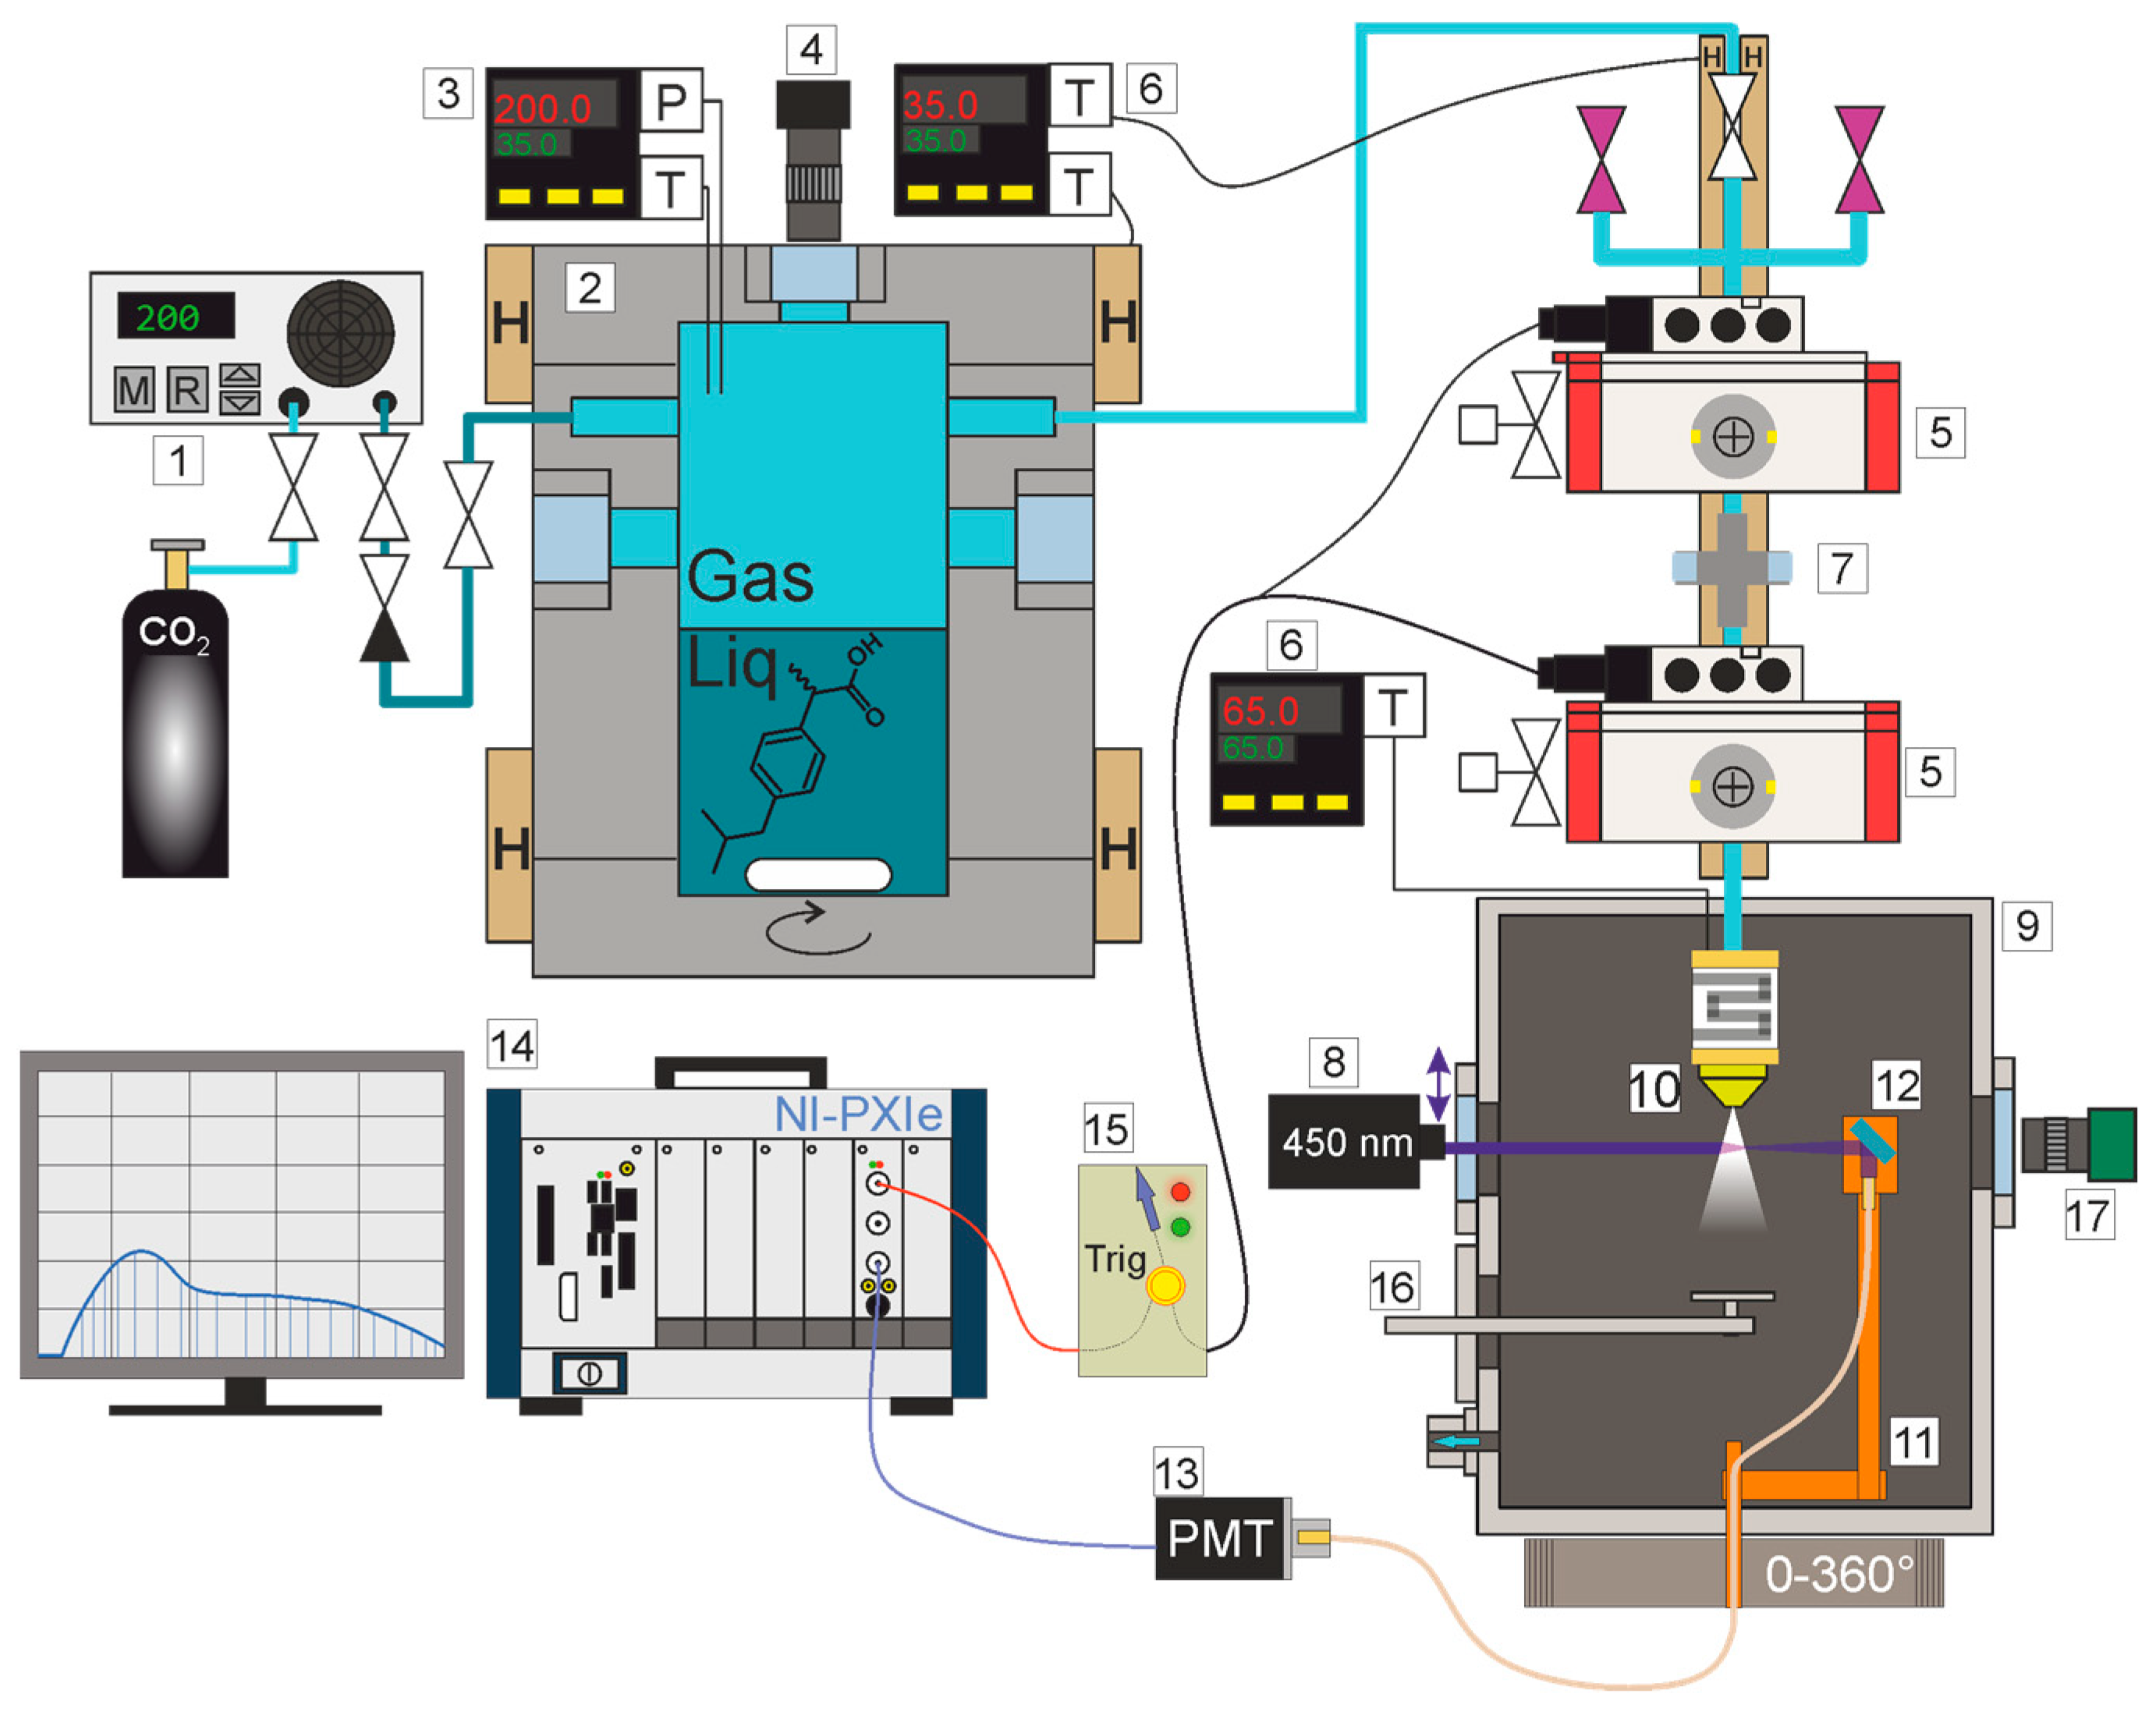
To investigate the dynamics of particle formation, an experimental setup was developed. The setup combines a supercritical reactor with a pulsed ejection system and an in situ optical diagnostic complex based on Mie scattering (see
Figure 1). A solution of ibuprofen (racemic mixture manufactured by Hubei Granules-Biocause Pharmaceutical Co., Ltd., Jingmen, China) in carbon dioxide (99.99% purity) was prepared in a high-pressure reactor with an internal volume of 75 cm
3. The reactor design allowed maximum pressure and temperature values of 400 bar and 100 °C, respectively. The initial pressure and temperature of the solution were created and maintained using a custom-developed “SCF-Minilab” system [
13]. The experimental setup includes a high-pressure pump, a set of heating elements, temperature and pressure sensors installed inside the reactor, and a control system based on industrial automation modules (manufactured by OWEN, Moscow, Russia) with feedback. This enabled the initial conditions for the solution to be maintained with an accuracy of 1 bar and 1 °C, respectively. In the experiment, they were T
0 = 302 K and P
0 = 71 bar, such that a solution of ibuprofen in the liquid phase of carbon dioxide and a CO
2 gas phase coexisted in the reactor. Subcritical conditions for carbon dioxide were chosen based on the aim of preserving the solubility of ibuprofen, which decreases with pressure [
14]. Ibuprofen was loaded into the reactor in excess, resulting in the formation of a saturated solution of ibuprofen in CO
2 and a solid ibuprofen phase at the bottom. Intensification of ibuprofen dissolution was achieved using a magnetic stirrer. For visual monitoring of the medium state, the reactor was equipped with seven windows (six in a hexagonal pattern on the side surface and one in the upper part). The reactor volume was connected to a vacuum expansion chamber (V = 1200 cm
3) through an injection system based on 1/4” ball valves with double-acting pneumatic actuators PNA-DA-052 (Velma). The pneumatic actuators were controlled using an Arduino Nano hardware platform with an ATmega328 microcontroller, which allowed control of the valve opening time and frequency, as well as generation of a TTL synchronization pulse for the measuring instruments. The minimum valve opening duration was ≈300 ms. Upon valve opening, the CO
2 pressure above the liquid solution dropped sharply, resulting in explosive boiling. The vaporized solution rushed through the injection system into the expansion chamber. Pulsed atomization of the vapor solution into vacuum was performed using commercially available 3D printer micro-nozzles (diameters 200 and 100 μm), which were mounted on the outlet tube with a cartridge heater. Thus, in the experiment, nozzles with different diameters allowed adjustment of the gas pressure decay rate above the solution, consequently controlling the intensity of liquid boiling. Additional local heating of the nozzle to 80 °C compensated cooling during expansion of the vapor–gas jet (Joule–Thomson effect), preventing nozzle clogging with CO
2 crystals. The residual pressure in the expansion chamber was maintained at no more than 0.02 mbar using a rotary forevacuum pump with a pumping speed of 16 L/s. The central part of the chamber was equipped with a set of 6 quartz windows around the perimeter to provide optical access to the jet at the nozzle exit plane. Probing was performed using radiation from a diode laser (λ = 450 nm, power 2 W) with vertical polarization. The laser beam was focused into the jet using a long-focus lens with F = 10 cm, NA = 0.03, forming a beam waist with a Rayleigh length of z
r ≈ 3000 μm, which allowed the incident radiation in the measurement zone to be considered a plane wave with constant intensity. To prevent saturation of the photomultiplier tube (PMT), the laser operated in TTL modulation mode at a frequency of 10 kHz. Radiation scattered by the particles was collected by the end face of an optical fiber (inner diameter 1 mm, quartz fiber QQ UV) mounted on a rotation platform. For each angle, 10 experimental measurements were obtained; the resulting indicatrix is the mean of these 10 points. The platform provided angular scanning in the range of 20–160° with a step of 10° and an accuracy of ±1°, as well as translational movement along the jet axis up to 20 mm from the nozzle exit with an accuracy of ±0.2 mm. The signal from the optical fiber was recorded using a PMT (model H11902-20, Hamamatsu Photonics, Hamamatsu, Japan) and acquired using a high-speed ADC NI PXIe-5160. This configuration allowed acquisition of the temporal dynamics of scattering indicatrix from micro- and nanoparticles with a time resolution of no worse than 100 μs, which was limited by the PMT sampling rate of 20 kHz. The loss of laser radiation energy due to scattering in the jet, monitored by a photodiode behind the exit window, did not exceed 3%. This can be considered an indication of a minimal contribution of multiple scattering to the overall indicatrix, since a high fraction of laser beam energy depletion (>10%) in the layer would indicate a high particle concentration and consequently multiple scattering of the electromagnetic wave by neighboring particles [
6]. For post-processing validation of the micronization results, a revolver-type platform with four substrates for particle collection was placed in the expansion chamber. The platform positioned the substrates at a distance of 100 mm from the nozzle exit. Images of the jet in scattered radiation were captured using a high-speed camera with a global shutter and a long-focus microscope objective.
3. Results and Discussion
Processing of the obtained scattering indicatrices was based on solving the Mie scattering for an ensemble of spherical particles. In this case, the experimentally observed scattering signal intensity for each registration angle is determined by the sum of the contributions from individual particles constituting the jet. The particle size distribution was approximated by a lognormal function [
15]. The lognormal function for describing the probability p(a) of particle distribution is represented as:
The parameters of the lognormal distribution
µ and
σ are related to the mean size
M and variance
V. For each particle from the distribution
p(
a) with radius
a, the scattering signal intensity
I for the observation angle
θ can be calculated as:
where
S1 is the scattering amplitude for a single particle in the Mie scattering [
6]. To solve the problem, it is necessary to specify the parameter
x = 2
πa/
λ and the complex refractive index of the particle
m =
n + ik. The calculation is performed for a sphere located in a non-absorbing medium. For ibuprofen at a wavelength of 450 nm, the refractive index was taken as
n = 1.52,
k = 0—no absorption [
16]. Measurements of the optical properties of ibuprofen melt were carried out using a refractometric method. A DR-M2/1550 refractometer (Atago) was used for the measurements. For these optical measurements, ibuprofen powder was deposited onto a substrate, melted at 353 K for 3 min, and then slowly cooled (over more than 20 min) to room temperature. The glass transition temperature of ibuprofen is 230 K [
17]. Therefore, we consider the measured refractive index to correspond to the amorphous state. The amorphous state of ibuprofen particles deposited from the jet was confirmed by SEM analysis. As a result, for an ensemble of particles with a given size distribution p(a), the optical response matrix is calculated as:
For the scattering indicatrices, z represents the scattering angle z = θ, and Tscat(x, z) = S1(x, θ) are the amplitude scattering functions from Formula (2). For comparison with the actual experiment, the relative scattering value for symmetric registration angles was calculated as Ratio(θ) = Mfor(θ)/Mback(π − θ). The choice of symmetric angles minimizes the effect of changes in the solid angle of registration when rotating the fiber relative to the jet. Calculations of scattering by a single ibuprofen particle show that for the wavelength used in the experiment, the approximate transition from Rayleigh scattering to Mie scattering corresponds to particles with a radius of about 20 nm, which is the lower sensitivity limit of the method. When particles reach micron sizes, the scattering pattern narrows into a cone in the direction of the probing radiation propagation, which defines the upper limit of the method at <1.5 μm.
To solve the inverse problem, an approach based on linear interpolation was used. Therefore, a database was first generated in which scattering indicatrices were calculated for each pair of µ and σ within a specified range and with a specified step. For all given µ and σ, parallel calculation and storage of Tscat were performed, which were then used to compute the optical response matrices according to Equation (3). Gaussian noise was added to the obtained results to ensure model robustness against experimental uncertainties. The magnitude of the added synthetic noise was optimized; increasing or decreasing it by 3–5% worsened the model performance. This process resulted in an extensive database (100,000 unique distributions) establishing a correspondence between the lognormal distribution parameters (μ, σ) and the synthesized optical response matrices. To solve the inverse problem of determining the particle distribution parameters (μ, σ) from the light scattering data, a program was developed that implements an algorithm for comparing the experimental curve for each time point from the selected range with the database:
Interpolation to match the experimental angles (since the database contains a wider range of angles than used in the experiment).
Normalization of the theoretical and experimental curves to unity (absolute scattering intensity values may differ significantly due to varying particle concentrations, laser power, and other parameters. However, the angular dependence shape is determined solely by the particle shape and size.)
Calculation of the MSE between the normalized curves (selection based on the minimum value).
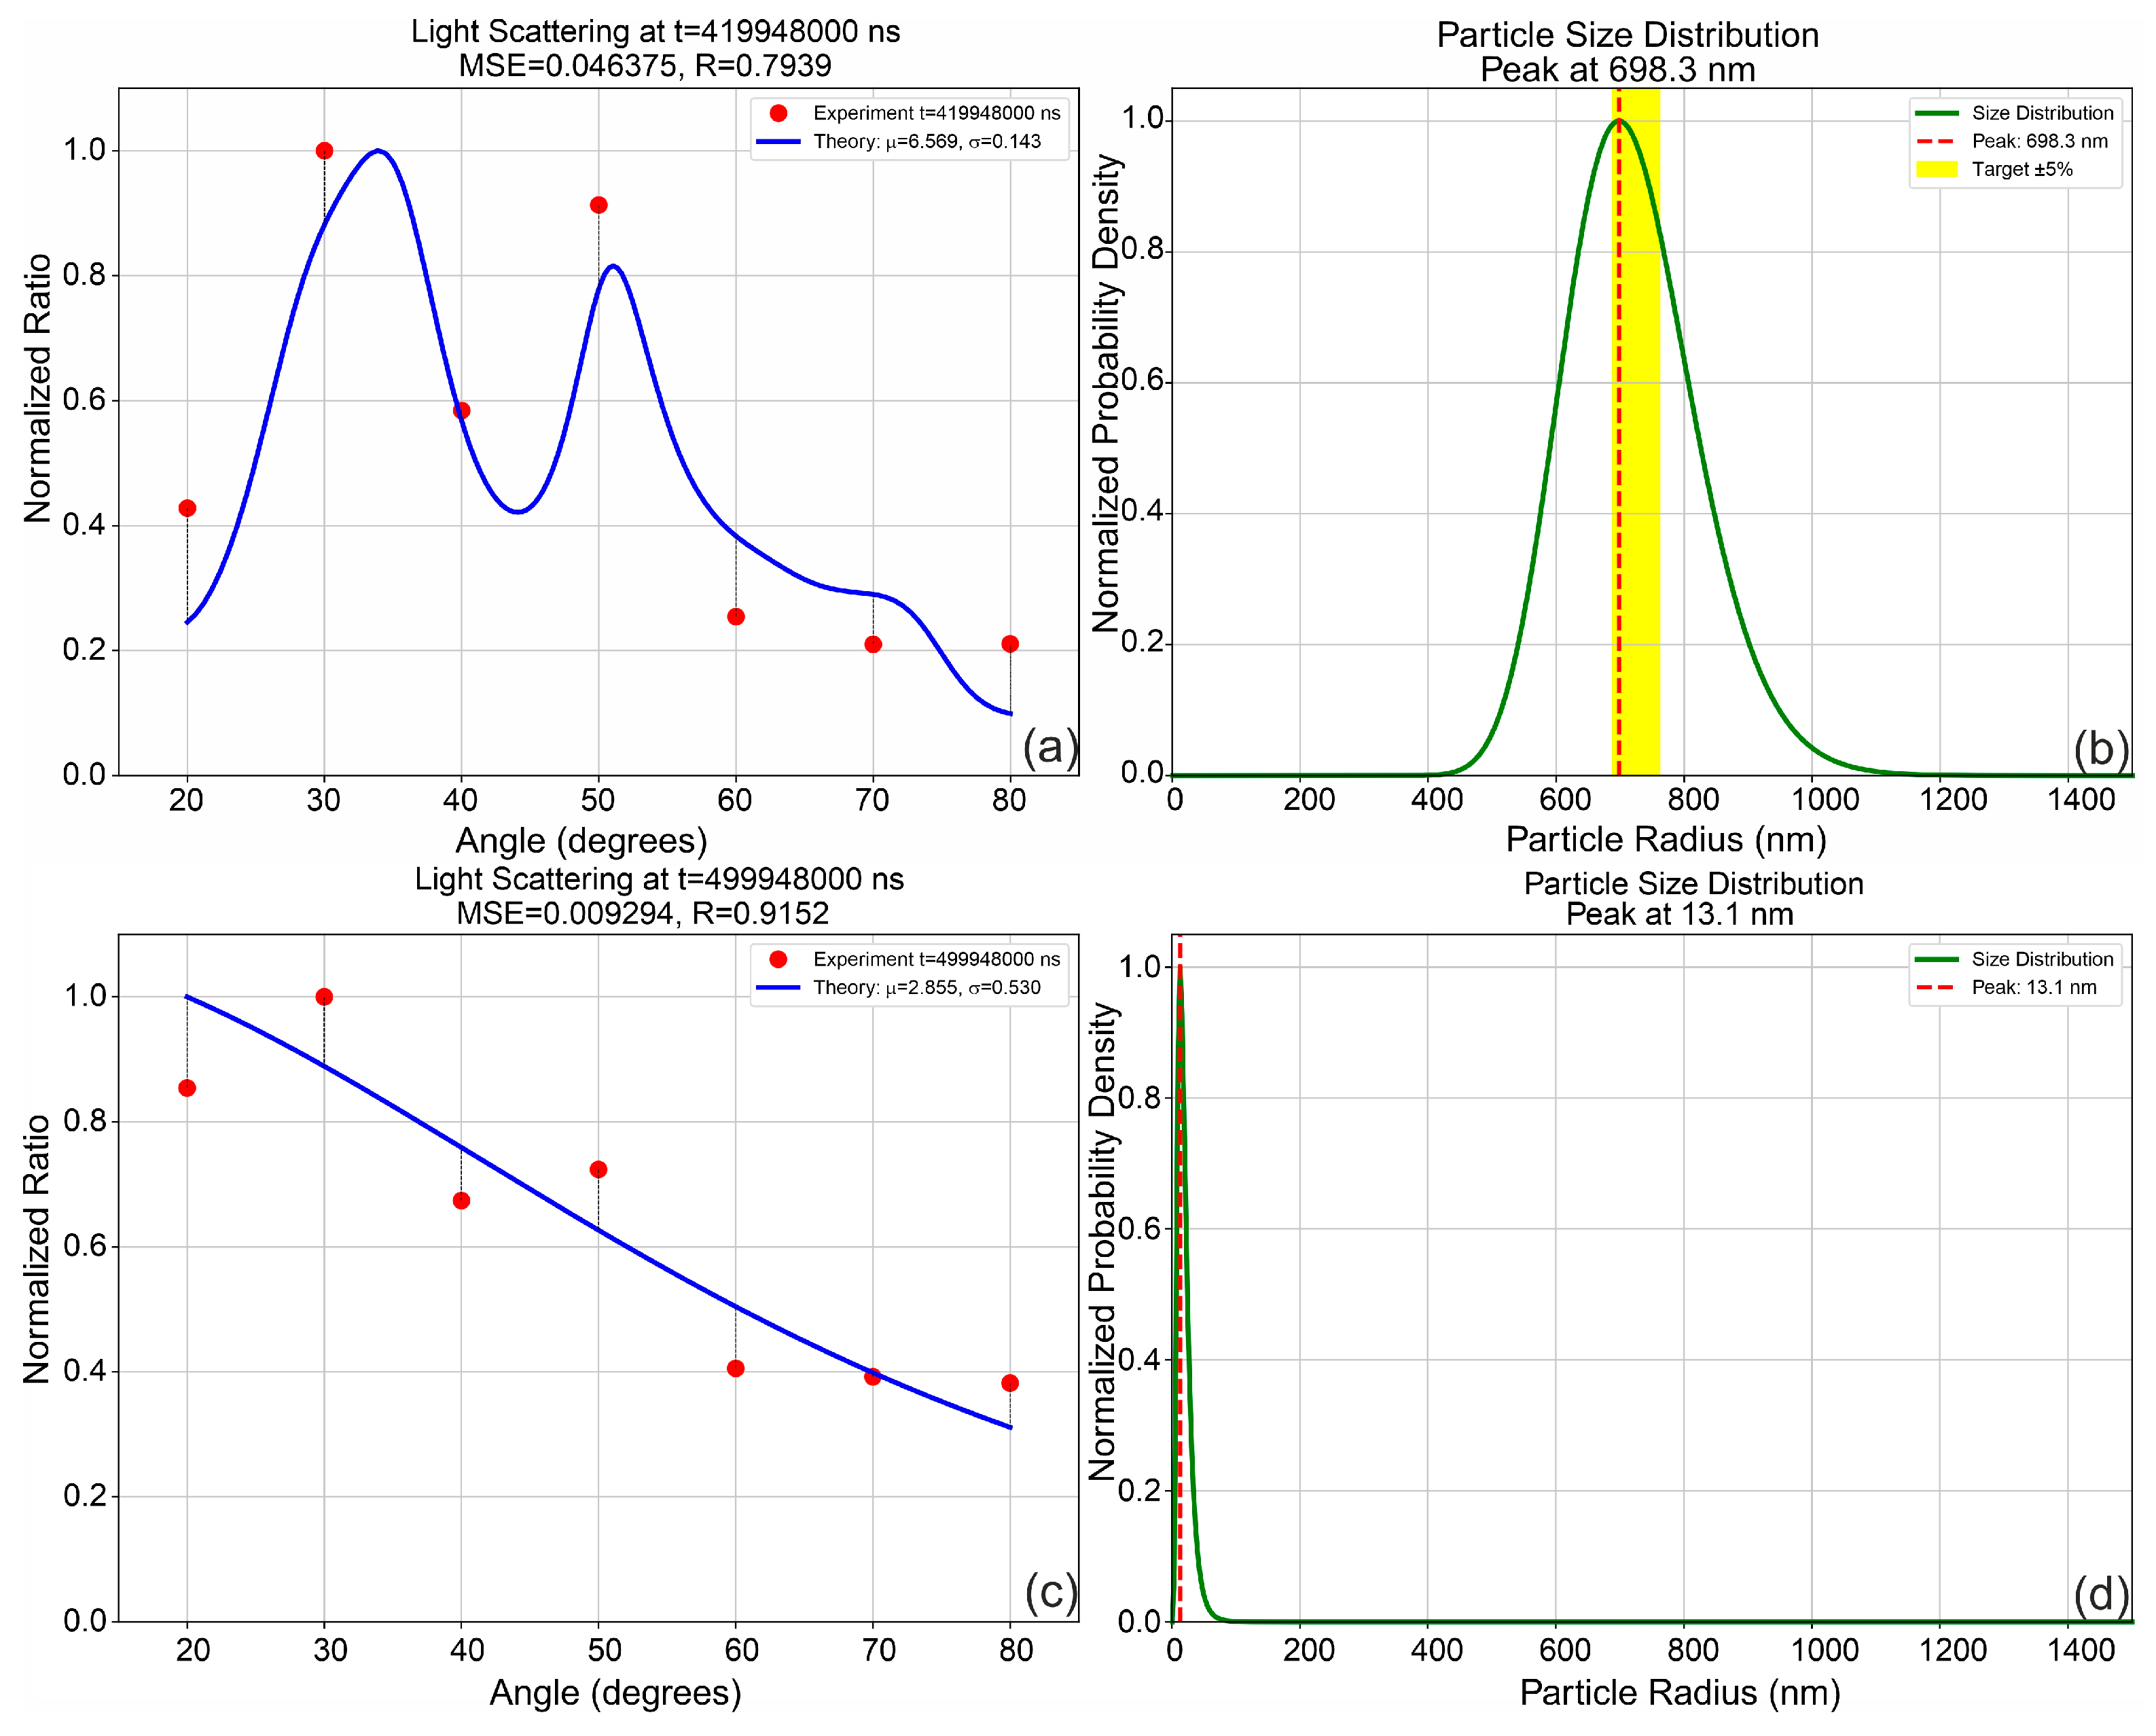
The program outputs the parameters
μ and
σ of the best-fit distribution, its peak, and the MSE value for a given time
t; see
Figure 2. Thus, the program does not simply search for a single distribution that best fits all experimental data at once; rather, it finds a sequence of distributions, each of which best describes the system evolution at a specific time point, and then combines them into an overall picture. Integration of all obtained distributions was also performed, with weights proportional to the maximum signal intensity at time
t (scattering intensity is directly proportional to the number of particles). The particle size distributions obtained by the optical method were compared with scanning electron microscopy (SEM) data from the deposited substrate.
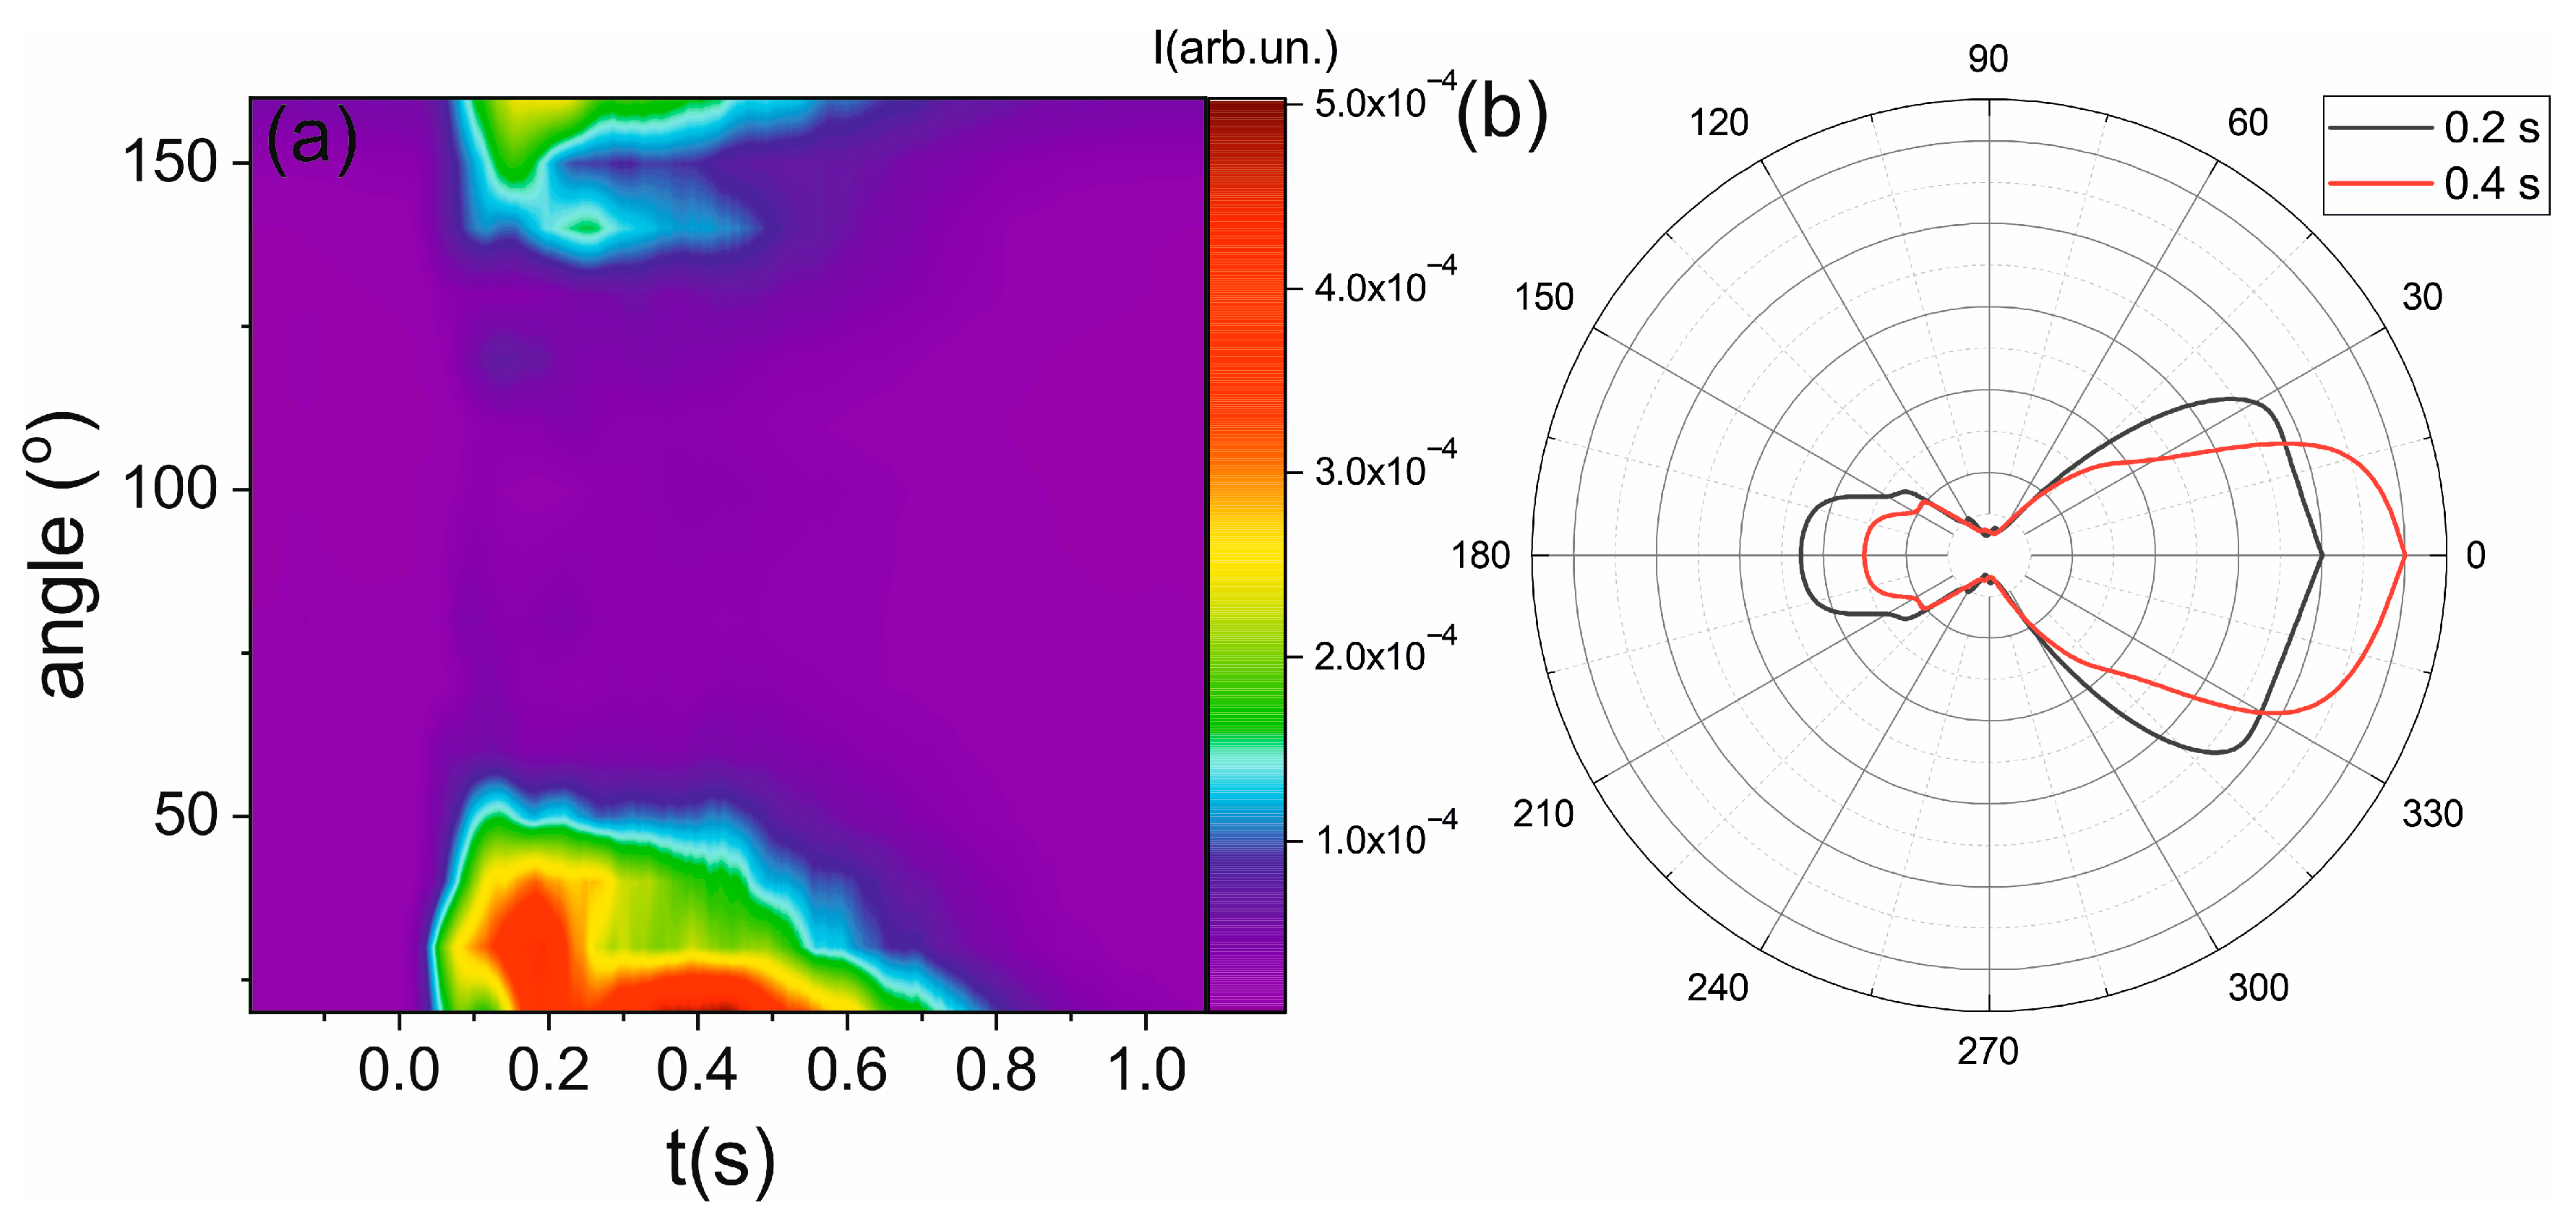
During explosive boiling and outflow of the droplet cloud of the solution into the expansion chamber through the injection system and nozzle, the parameters inside the reactor itself change, which in turn affects the conditions in the jet and, consequently, the sizes of the particles being formed. In this regard, we conducted a study of the dynamics of micro- and nanoparticle size changes in the jet using the Mie scattering method. The obtained results are presented as a two-dimensional heat map of the scattered signal intensity
I (
θ,
t) in
Figure 3a, where
θ is the scattering registration angle, and
t is the time elapsed since the arrival of the control trigger. The presented dynamics clearly demonstrate that the observed process can be divided into four stages. The first stage corresponds to the moment immediately after valve opening, when the jet is just being formed (0.2–0.3 s). The second stage lasts from 0.3 to 0.5 s. During the second stage, valve closure occurs. However, the gas-droplet fraction still remains in the converging nozzle and the adjoining tube (injection chamber). After this, the shape of the scattering indicatrix changes abruptly, and the third stage begins, lasting up to approximately 1 s. The substance in the injection chamber then becomes depleted, corresponding to the fourth stage. The first and fourth stages are consequences of the pulsed nature of the process (valve opening is not instantaneous, as is the limited volume of substance in the injection chamber); however, the greatest interest lies in the sharp jump in the indicatrix shape observed during the transition from the second to the third stage, see
Figure 3b.
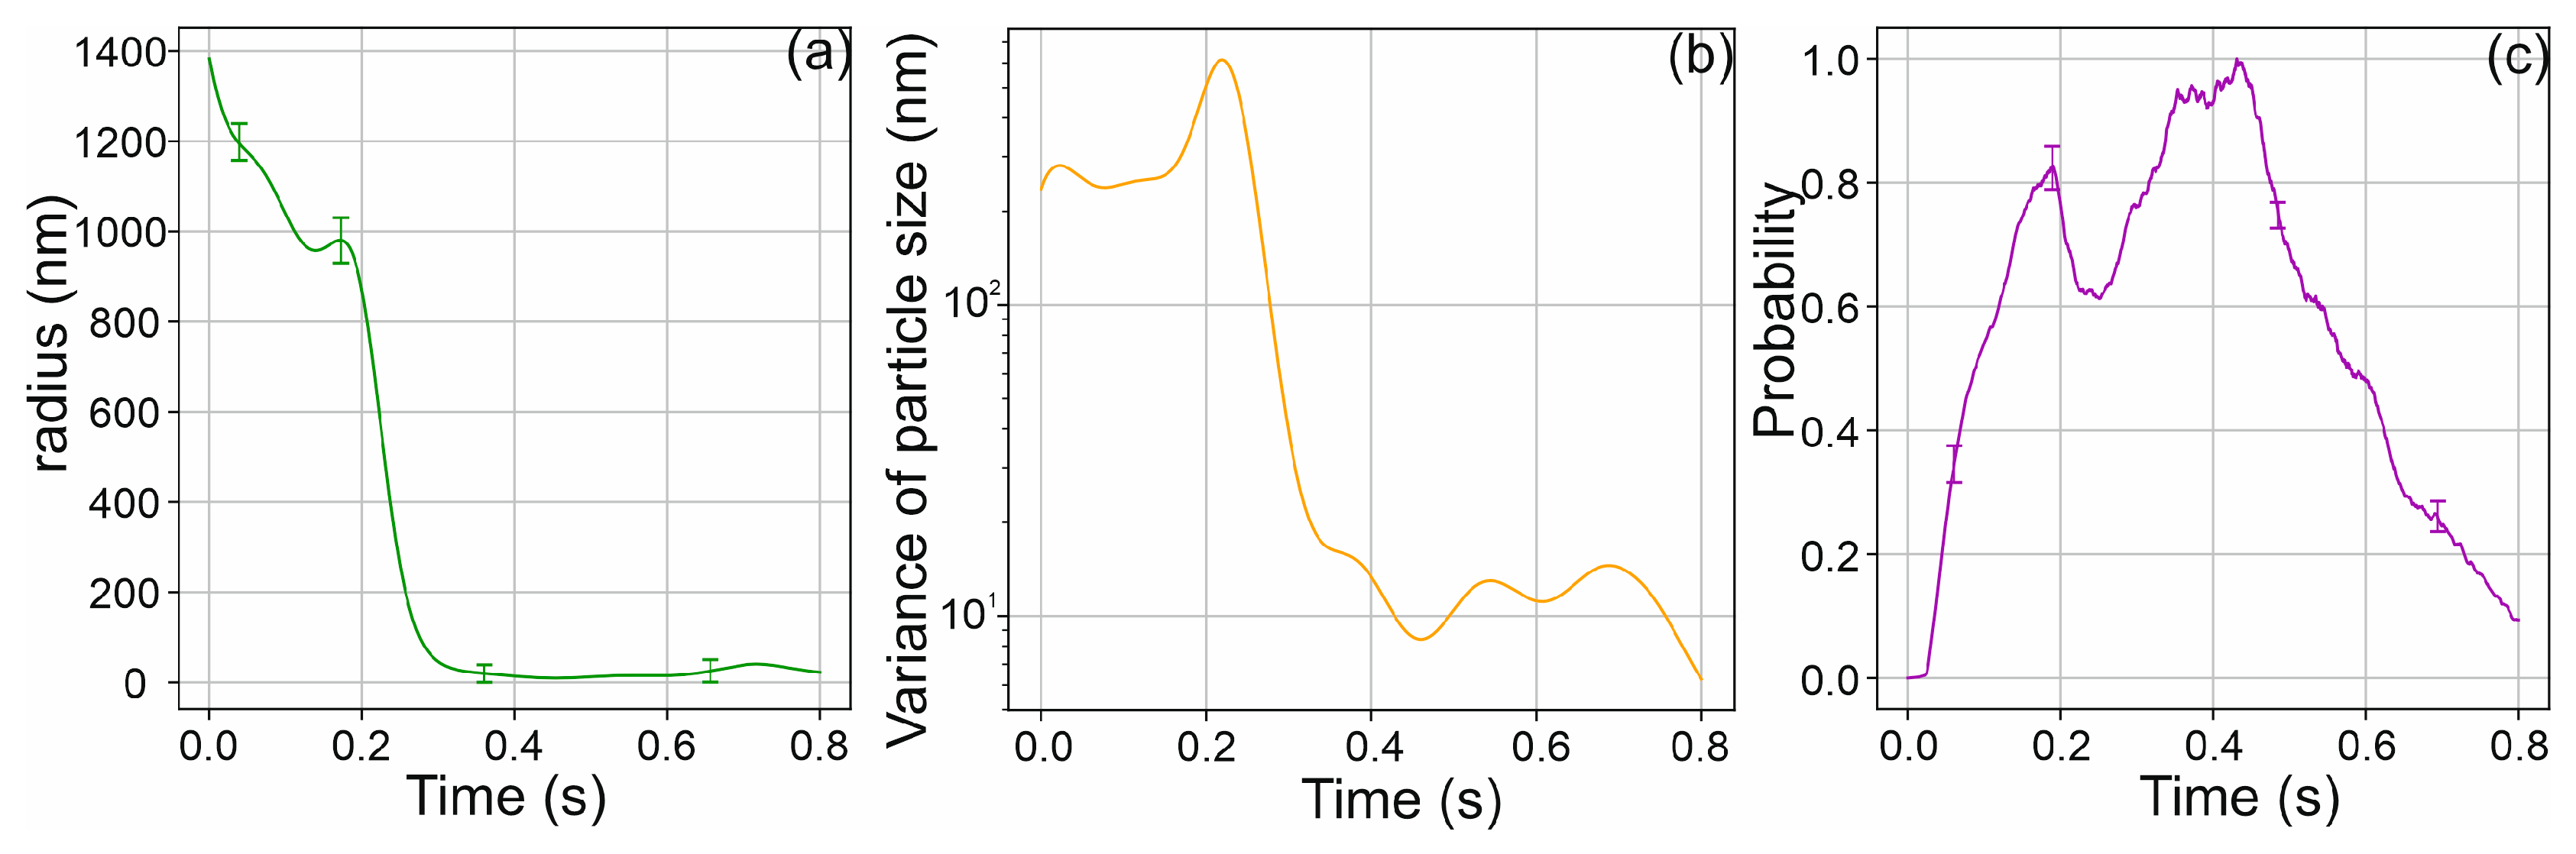
Based on the analysis of the scattering indicatrices recorded at sequential time points, the distribution of micro- and nanoparticles in the jet was reconstructed (
Figure 4a). Immediately after jet formation, the microaggregate radius is 1.4 ± 0.2 μm. During the first ~0.1 s, it decreases to 1 ± 0.1 μm, after which it remains practically unchanged. The microparticle concentration at this stage remains relatively low (
Figure 4c). The flux of ibuprofen nanoaggregates reaches its maximum approximately 0.2 s after valve opening. At this moment, simultaneously with the peak in scattering intensity, the characteristic nanoparticle size begins to decrease rapidly, reaching 100 ± 20 nm after ~0.3 s. Subsequently, the characteristic shape of the indicatrix changes abruptly (see
Figure 3), corresponding to the detection of nanoparticles with sizes of 20–50 nm in the jet. This size persists until complete depletion of the injection chamber. The maximum number of scatterers (nanoparticles) is observed approximately 0.4 s after valve opening (
Figure 4c), after which their concentration gradually decreases.
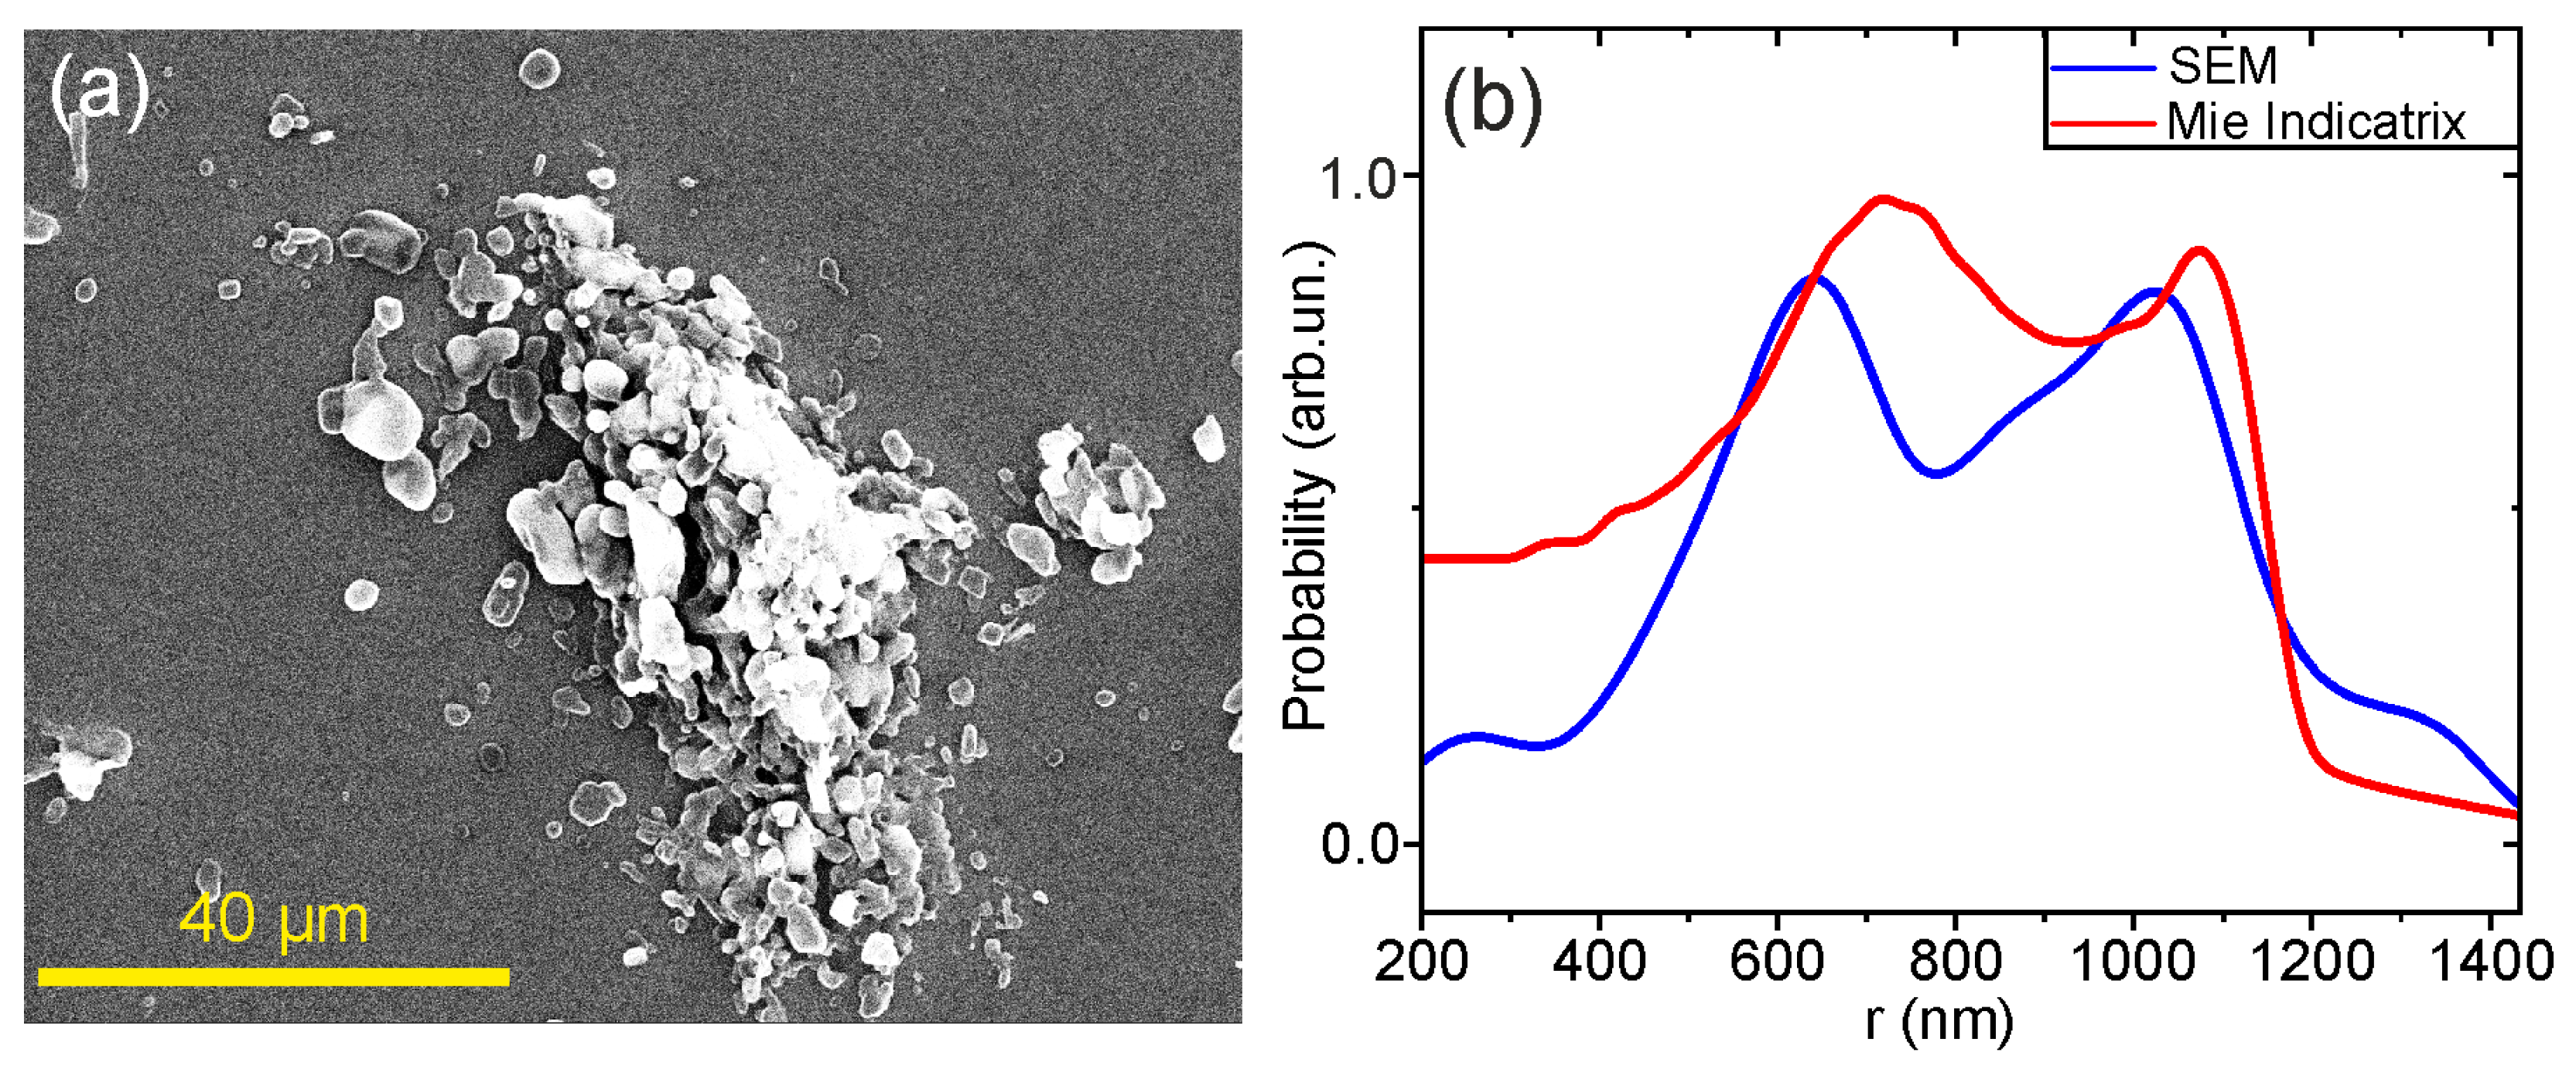
To verify the results obtained by the Mie scattering method, SEM analysis was performed on ibuprofen aggregates deposited in the vacuum chamber after the experiment. The obtained data indicate a bimodal particle size distribution with maxima at approximately 650 and 1050 nm (
Figure 5). Notably, the presence of nanoparticles with sizes of 20–50 nm was not confirmed. For proper comparison with the electron microscopy data, integration of the particle size distributions obtained for different time delays (
Figure 4a) was performed. Each distribution was approximated by a Gaussian function and multiplied by weights proportional to the particle concentration in the jet at the corresponding time point (
Figure 4c). The result of this integration is shown in
Figure 5.
The performed experiments allow detailed tracking of the particle formation dynamics during explosive boiling of an ibuprofen solution with carbon dioxide under subcritical conditions and reconstruction of the sequence of events occurring after valve opening. At the initial moment, a high concentration of solution droplets is created in the reactor. Upon rapid expansion of this droplet cloud, rapid evaporation of carbon dioxide from the droplets occurs, and at this stage, relatively large ibuprofen microaggregates with a size of approximately 1.4 μm are formed, since the high concentration of dissolved substance promotes active particle growth. Approximately 0.1 s after the onset of outflow, the situation begins to change, as the boiling intensity decreases due to the active evaporation of CO
2 from the solution. Under these conditions of reduced concentration, the process shifts toward the formation of smaller droplets; therefore, we observe a decrease in microaggregates size to approximately 1 μm, while the total number of particles remains relatively low. Subsequently, approximately 0.2–0.3 s after valve opening, the ibuprofen concentration becomes so low that nanoparticle formation processes begin to dominate in the flow, with sizes decreasing to 100 nm. It is likely that the CO
2 evaporation process begins to compensate for the pressure above the liquid solution, leading to the cessation of explosive boiling. In the final stage of the process, when the ibuprofen concentration in the injection chamber drops to nearly zero, almost pure carbon dioxide begins to flow from the nozzle, which can also condense upon expansion, forming nanoscale clusters with a log-normal distribution [
18]. Thus, the nature of boiling of the liquid solution (ibuprofen in CO
2) in the reactor determines the chronological change in the size of solid ibuprofen aggregates at the nozzle outlet. This is because the size of the liquid aggregates of the ibuprofen solution formed during boiling directly correlates with the size of the solid aggregates formed upon their evaporation during expansion. Spontaneous explosive boiling at the initial moment, when liquid aggregates of maximum size are formed, followed by a decrease in boiling intensity up to almost equilibrium evaporation of CO
2 at the end of the process (when the pressure in the reactor becomes practically equal to the saturation pressure of CO
2 at 302 K), gives rise (see
Figure 4a) to a rapid decrease in the size of solid ibuprofen aggregates down to the size of inevitably co-forming CO
2 nanoclusters. Thus, the entire process can be described as a single-stage dynamics of solid ibuprofen aggregate formation against a background of accompanying CO
2 clustering.
Upon deposition onto the substrate under vacuum conditions, these CO
2 clusters immediately evaporate, which is confirmed by the electron microscopy data shown in
Figure 5. Electron microscopy of the deposited material reveals a bimodal particle size distribution with maxima at 650 and 1050 nm. The presence of nanoparticles with sizes of 20–50 nm is not confirmed, which is in good agreement with the integrated light scattering data. As indirect evidence supporting our assumption of CO
2 clusters in the jet, we can invoke the semi-empirical Hagena theory [
19]. This theory allows estimation of the average size of CO
2 clusters based on our sonic nozzle parameters (critical diameter 200 μm, half-angle 45°), the initial reactor conditions (T
0 = 302 K, P
0 = 71 bar), and the gas constant (Hagena parameter) [
20]. The calculation shows that under the given conditions, clusters containing about 1.7 × 10
6 molecules are formed. The average diameter of such clusters is D = 48 nm (assuming an intermolecular distance of 4 Å [
21]). Thus, the estimate from Hagena’s theory agrees with the results of cluster diagnostics by Mie scattering.
The performed study clearly demonstrates that the process of ibuprofen particle formation during explosive boiling of an ibuprofen solution with carbon dioxide is non-stationary, and the parameters of the resulting particles change significantly over time. Moreover, the final outcome is influenced not only by the initial thermodynamic parameters, such as temperature, pressure, and initial concentration, but also by the dynamics of explosive boiling of the solution in the reactor. This has practical significance for the application of the method, as it shows that to obtain particles of a desired size, it is necessary to control not only the initial conditions but also the temporal parameters of product collection.
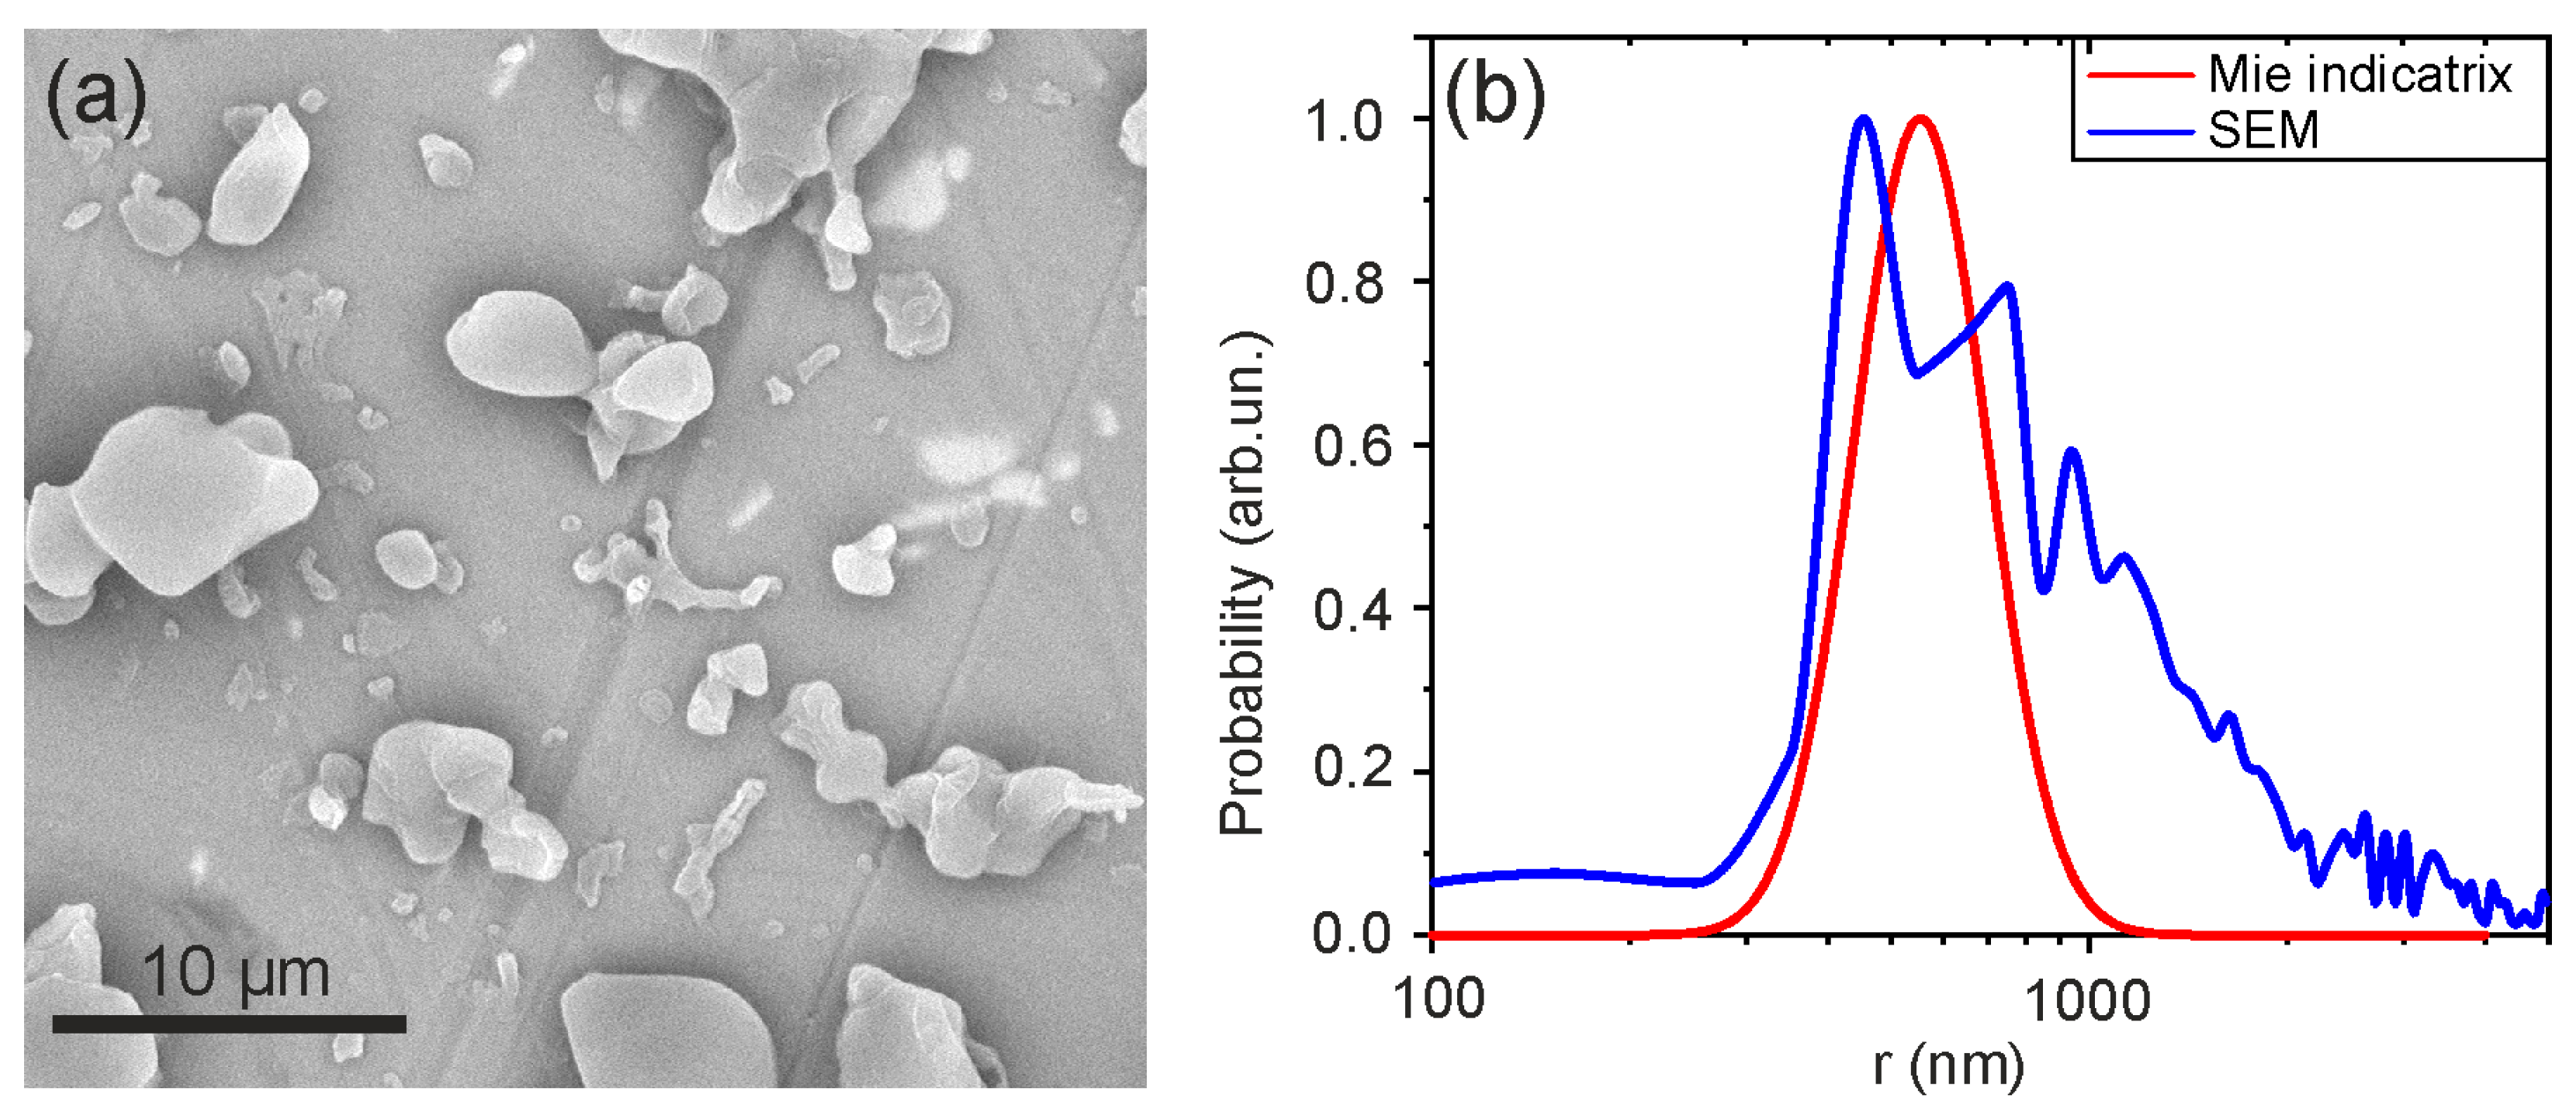
As the experiments showed, control of the explosive boiling process of the solution can be achieved by varying the nozzle diameter. In the experiment, the nozzle diameter was reduced by a factor of two, from 200 to 100 μm. This led to a decrease in the boiling intensity of the solution and, consequently, a reduction in the size of the detected particles (see
Figure 6a). We observe that at the first stage of the process, approximately 0.1 s after valve opening, the model distribution (see
Figure 6b) shows the formation of particles approximately two times smaller than in the case of using the 200 μm nozzle.
A decrease in the CO
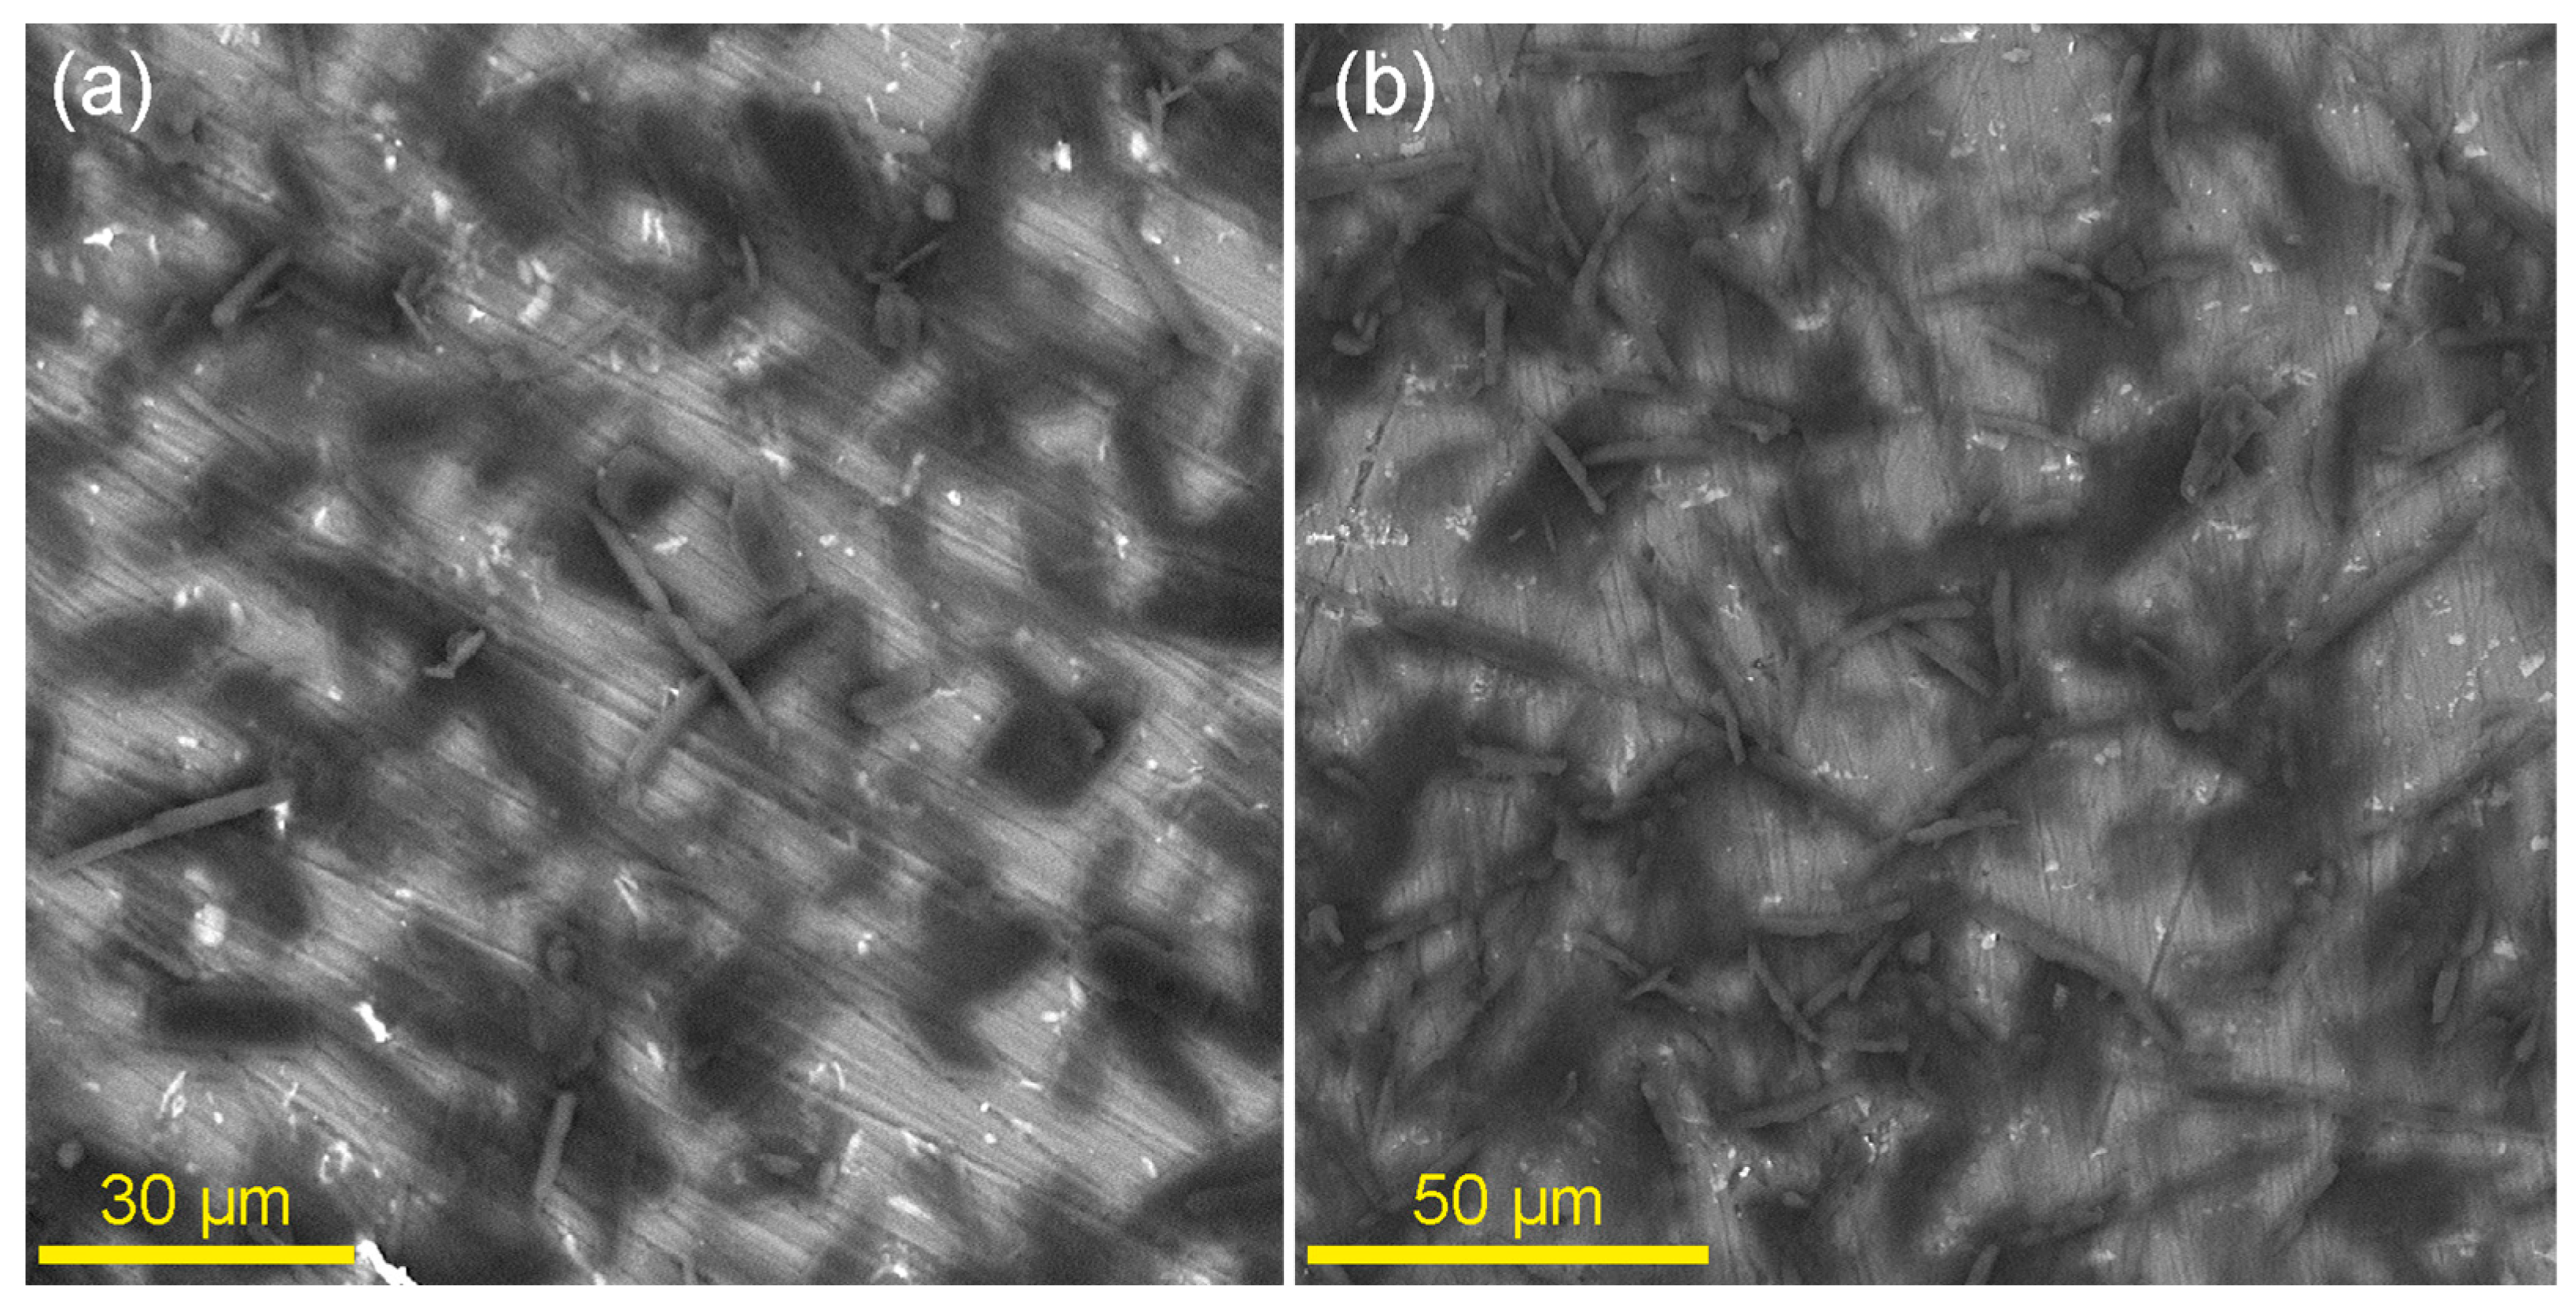
2 pressure above the liquid solution leads to a significant drop in the number of produced particles (observed on the substrate). As noted above, this occurs due to a reduction in the solubility of ibuprofen in liquid carbon dioxide when moving away from the critical pressure and temperature. When the conditions in the reactor transition into the supercritical region, large, elongated particles with sizes of tens of micrometers are formed in the jet (see the example in
Figure 7). Thus, the selected conditions of T
0 = 302 K and P
0 = 71 bar for explosive boiling make it possible to enhance the micronization of ibuprofen compared to the classic RESS process.
In traditional RESS processes, optimization efforts are almost exclusively focused on choosing the right pre-expansion temperature and pressure to achieve a desired particle size distribution. Our work demonstrates that controlling the rate and manner of boiling (e.g., explosive vs. mild) offers an additional method for tailoring particle properties. For continuous manufacturing, this means that reactor design and operation should not only maintain steady-state temperature and pressure but also actively manage the boiling regime. For instance, by modulating the pressure release profile or introducing nucleation sites to control the intensity of bubble formation. Consequently, scale-up strategies that simply replicate the initial thermodynamic parameters from a lab-scale setup to a larger reactor may fail if the boiling dynamics differ (e.g., due to altered heat transfer or surface-to-volume ratios). A robust scale-up approach would therefore require either (i) mimicking the dynamic pressure-decay profile that produces the desired boiling regime, or (ii) incorporating in-line monitoring (such as the time-resolved Mie scattering method presented here) to ensure that the particle formation dynamics remain within the target window. From an industrial perspective, the proposed method opens the door to producing ibuprofen (and other pharmaceutical) particles with tunable morphologies and sizes by deliberately designing the boiling dynamics—for example, exploiting explosive boiling to achieve enhanced micronisation, as we have demonstrated.




 ,
,