Article

Cytokinin-Mediated Modulation of Essential Oil Composition in Lemongrass (Cymbopogon citratus Greenhouse Plants Derived In Vitro): Hydrodistillation-Based Characterization and Biomass Scaling Model


by
María del Rosario Cárdenas-Aquino
1,†,
Danna Lorena Ovalle-Ayala
2,†,
José Guadalupe Ávila-Hernández
1,
Enrique Ramírez-Chávez
3,
Agustino Martínez-Antonio
1,
Alberto Camas-Reyes
1,*,† and
Lisset Herrera-Isidrón
2,*
1
Departamento de Ingeniería Genética, Cinvestav Irapuato, Km. 9.6 Libramiento Norte Carr. Irapuato-León, Irapuato 36824, Gto., Mexico
2
Unidad Profesional Interdisciplinaria de Ingeniera Campus Guanajuato (UPIIG), Instituto Politécnico Nacional, Silao de la Victoria 36275, Gto., Mexico
3
Departamento de Bioquímica, Cinvestav Irapuato, Km. 9.6 Libramiento Norte Carr. Irapuato-León, Irapuato 36824, Gto., Mexico
*
Authors to whom correspondence should be addressed.
These authors contributed equally to this work.
Processes 2026, 14(10), 1532; https://doi.org/10.3390/pr14101532
Submission received: 22 March 2026 / Revised: 1 May 2026 / Accepted: 7 May 2026 / Published: 9 May 2026

Abstract

Lemongrass (Cymbopogon citratus) essential oil is mainly composed of the acyclic monoterpene aldehydes geranial (α-citral) and neral (β-citral), collectively known as citral, which exhibit documented cytotoxic activity against cancer cell lines, as well as geraniol and limonene, among other monoterpenoids. In a previous study we reported that the constituents of the essential oil (EO) composition of lemongrass in vitro plants were modulated by different types of cytokinins (CKs) exogenously added to the culture medium. However, in that work, EO components were detected as volatile headspace compounds by SPME-GC/MS rather than as bulk oil extracts directly injected to GC/MS. Therefore, in this study, EOs were extracted by hydrodistillation from plants micropropagated with different CKs (BAP or 2iP) under different osmotic conditions (MS 3/3 and MS 5/5) and subsequently established in a greenhouse. Analysis of EO in C. citratus plants showed that plants grown on MS-3/3 BAP had more α-citral, and plants grown on MS-5/5 2iP had more limonene. This study demonstrates the impact of various CKs on EO production in lemongrass. The findings showed that 5/5 2iP produced the highest limonene yield, indicating a potential yield of 100 mL from 8719 plants. Similarly, 101 plants under the 5/5 Ctrl treatment are required for 100 mL of citral, and 34 plants under the 5/5 Ctrl treatment are required for 100 mL of geranyl acetate. The 5/5 2iP requires 816 plants to produce 100 mL of geraniol, and it takes 11,340 plants to produce 100 mL of β-caryophyllene from the 3/3 2iP treatment.

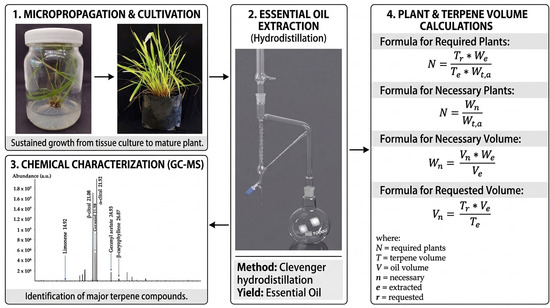
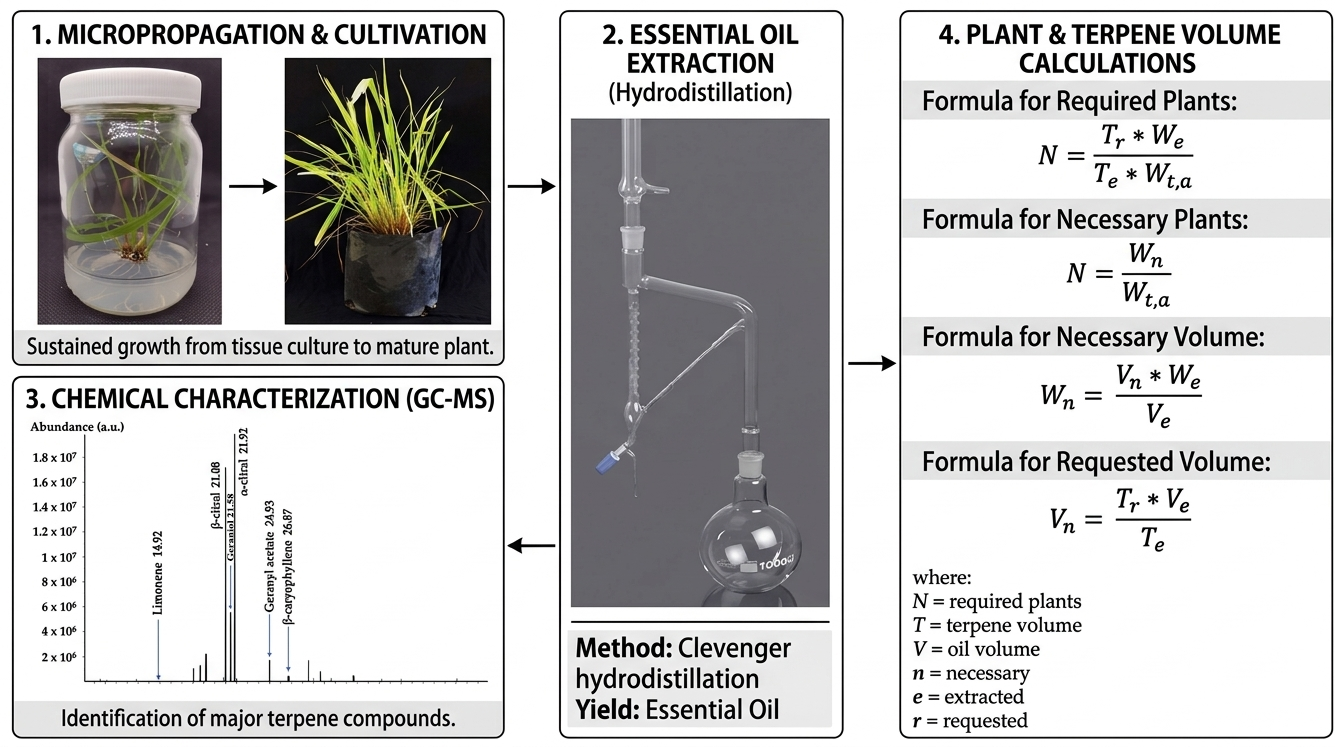
Graphical Abstract

1. Introduction

Plants synthesize compounds and metabolites with diverse functions and biological properties; some of these metabolites, weighing less than 400 Da, are known as volatile compounds. Monoterpenes, the major active constituents of EO, are a class of volatile compounds with a 10-carbon skeleton and a wide range of oxygenated derivatives (monoterpenoids) [1]; they have antioxidant, antimicrobial, and antifungal properties, including anticancer [2], and herbicidal properties [3,4,5,6].
Plant EOs are produced and released by specific cells or organs, which vary by family and are located on or near the surface of the plant [7].
Terpenoids (isoprenoids) are volatile compounds and are important for plant functional processes such as membrane structure, photosynthesis, redox chemistry, and growth regulation [1]. They may also stabilize and protect plant membranes against high temperatures or act as antioxidants in leaves [8]. Terpenoids are formed from hemiterpenoid (C5), monoterpenoid (C10), and sesquiterpenoid (C15) backbones and are all synthesized from repeating 5-carbon units via condensation of isopentenyl diphosphate (IPP) and dimethylallyl diphosphate (DMAPP) [1].
The biosynthesis of monoterpenes can be described in four steps: first, production of terpenoid building blocks (IPP and DMAPP); second, head-to-tail addition of an IPP unit to DMAPP to produce geranyl diphosphate (GPP, C10) by prenyltransferase; third, conversion of GPP to the monoterpene parent skeleton; and fourth, transformation of the parent structure to various derivatives [1,9].
Production of the GPP molecule, after loss of the diphosphate group, results in an unstable cation that undergoes various isomerizations, which can react with a hydroxyl group to form geraniol, the first acyclic monoterpene. Geraniol then gives rise to other acyclic monoterpenes called dimethyloctanes (myrcene, linalool). Other cations are targeted by cyclases to produce monocyclic monoterpenes such as caranes (3-carene, 4-caranol) and 3-menthanes (limonene, menthol), and bicyclic monoterpenes such as boranes, camphanes and fenchanes, pinanes and thujanes [1,9].
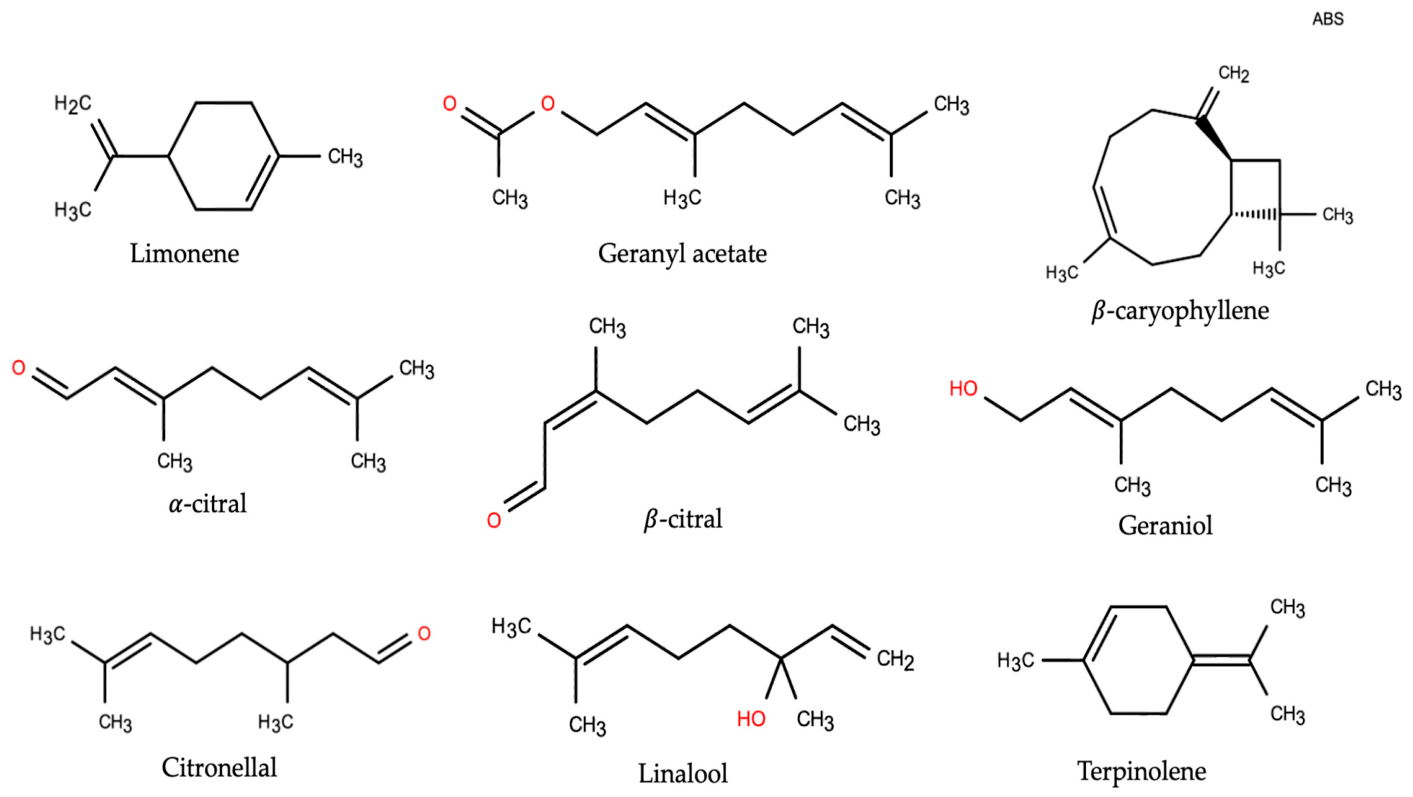
The genus Cymbopogon, which includes aromatic species, belongs to the family Poaceae (Gramineae). The most widespread species known in Mexico is Cymbopogon citratus (DC.) Stapf (lemongrass) (https://www.itis.gov/). Extensive research has been conducted on the chemical constituents of EO from various species of Cymbopogon, such as citral (a blend of two isomers: geranial and neral), geraniol, citronellol, citronellal, linalool, limonene, β-caryophyllene, and geranyl acetate, among other monoterpenes [10] (Figure 1). Although they are economically significant, research on the biosynthesis of Cymbopogon EO is limited compared to other plant families.
The use of different cytokinins (CKs) to increase EO content in various aromatic plants, including C. citratus, has been previously reported [9,11,12]. Studies such as that by Camas-Reyes et al. [9] have compared the components of EOs with the enhancement of monoterpene biosynthesis using exogenous CKs, such as 6-Benzylaminopurine (BAP), 6-(γ,γ-Dimethylallylamino)purine (2iP), kinetin (KIN), and trans-zeatin (tZ) in the culture media. However, in their work, EO components were detected as volatiles via solid-phase microextraction-gas chromatography-mass spectrometry (SPME-GC/MS) rather than as oil extracts, and by analyzing oil components injected directly into GC/MS.
Although the essential oil of C. citratus has been widely characterized, and citral is recognized as a quality marker, most reports rely on field-grown plants and conventional hydrodistillation, without examining how micropropagation conditions with the use of different types of CKs in the in vitro culture medium shape oil composition at the plant level. Furthermore, previous work on lemongrass has focused either on volatile profiling or on single-CK applications in the field, but has not integrated plant architecture, biomass allocation, and essential oil composition into a unified framework for production planning.
Thus, there is a lack of studies that (i) compare BAP and 2iP during in vitro propagation and subsequent greenhouse growth, (ii) quantify their impact on the composition of hydrodistilled oils, and (iii) translate these effects into quantitative estimates of plant biomass and plant numbers required to obtain target volumes of key terpenes such as citral, geraniol and limonene. In this study, EOs were extracted from plants cultivated in vitro with BAP or 2iP under varying conditions in MS (Murashige and Skoog culture media [13] (MS 3/3 and MS 5/5) by hydrodistillation and subsequently transferred to a greenhouse for further development. Leaf samples were then analyzed by mass spectrometry to obtain a more accurate estimate of the components of C. citratus essential oil. Furthermore, a projection of input requirements was made based on the results obtained. This considered growth rates, extraction volumes, and EO composition (amount of citral, limonene, geraniol, geranyl acetate, and β-caryophyllene) for each treatment.

2. Materials and Methods

2.1. Culture Establishment and Propagation Protocol

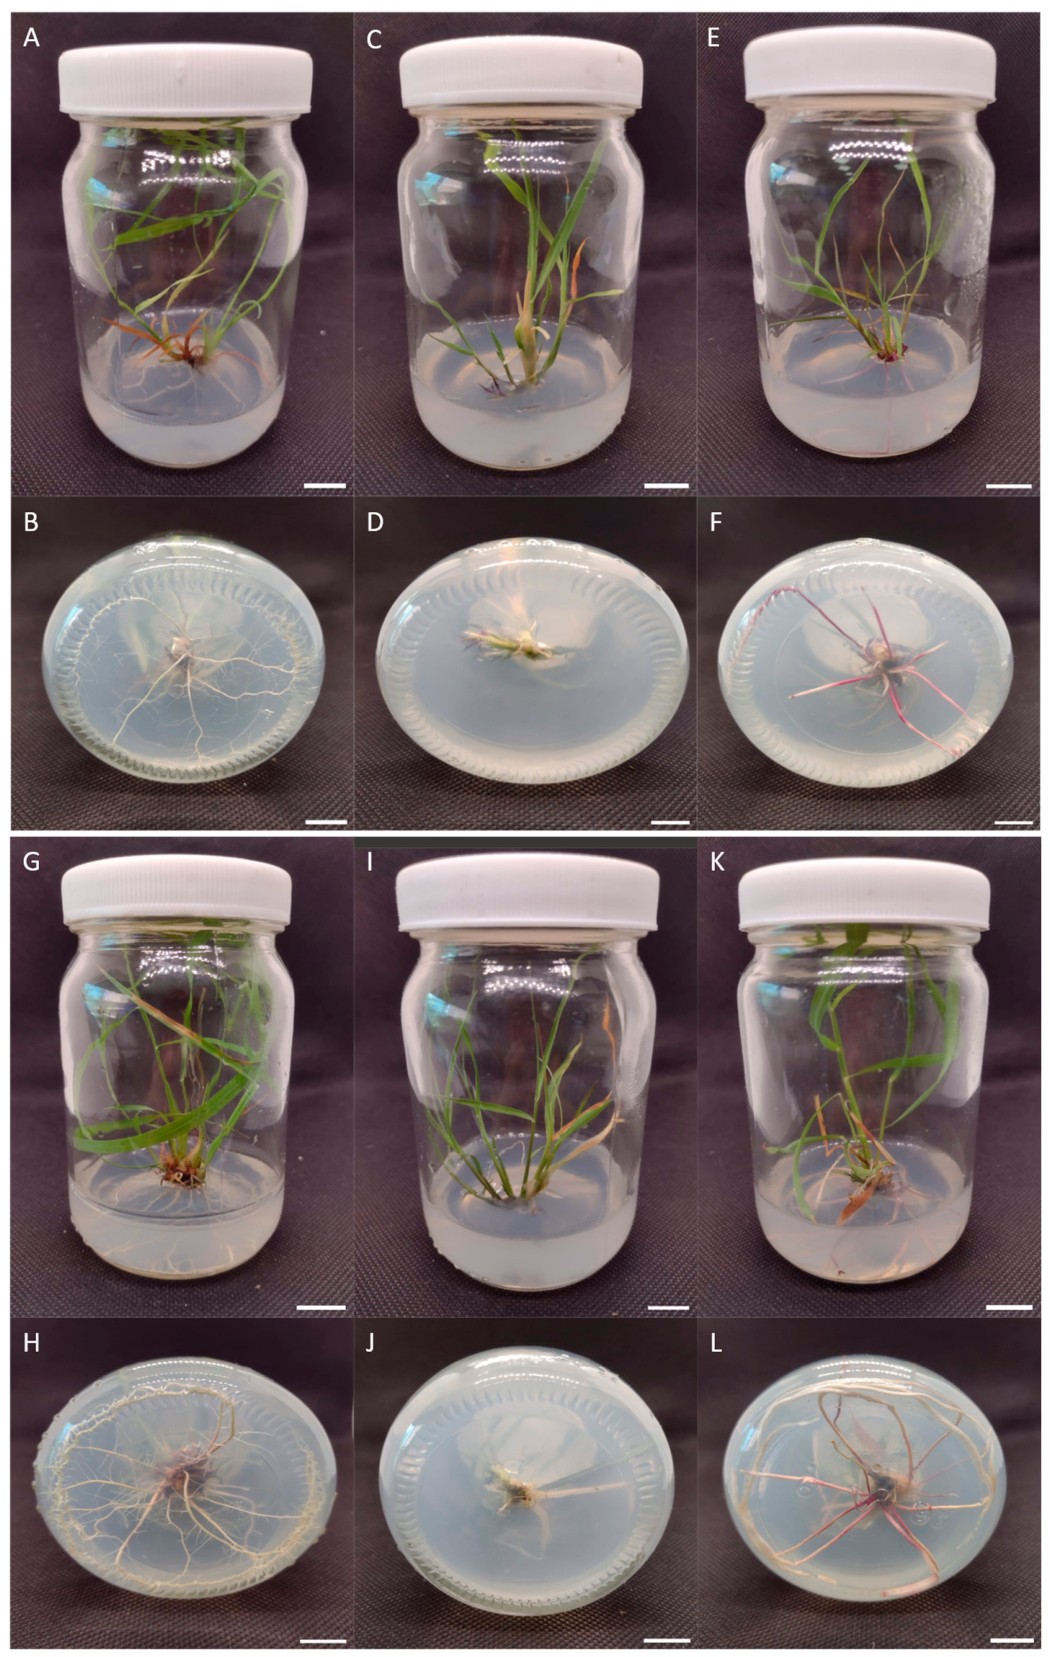
C. citratus germinated 3-day-old seedlings were subcultured to fresh complete MS medium containing 0.3% sucrose (Grade I, 98.5%, Sigma-Aldrich, St. Louis, MO, USA), 0.3% Gelrite® (Gelzan™ CM, CP Kelco U.S., Inc., Atlanta, GA, USA; Sigma-Aldrich St. Louis, MO, USA) and 2.0 mg/L BAP (98%, Sigma-Aldrich, St. Louis, MO, USA) pH 5.8. Plantlets initiated by axillary meristems developing their leaf primordia into axillary buds were individualized and subcultured into six different fresh MS media containing 3% sucrose, 0.3% Gelrite®, and 2.0 mg/L BAP (pH 5.8) (3/3 BAP treatment); MS medium containing 3% sucrose, 0.3% Gelrite®, and 2.0 mg/L 2iP (98.5%, Sigma-Aldrich, St. Louis, MO, USA) (pH 5.8) (3/3 2iP treatment); MS medium containing 3% sucrose, 0.3% Gelrite®, without any growth regulator (pH 5.8) (3/3 Ctrl treatment); MS medium containing 5% sucrose, 0.5% Gelrite®, and 2.0 mg/L BAP (pH 5.8) (5/5 BAP treatment); MS medium containing 5% sucrose, 0.5% Gelrite®, and 2.0 mg/L 2iP treatment (pH 5.8) (5/5 2iP treatment); and MS medium containing 5% sucrose, 0.5% Gelrite®, without any growth regulator (pH 5.8) (5/5 Ctrl treatment) (Figure 2). The open-source image processing software FIJI (Fiji Is Just ImageJ), which is based on ImageJ2 (version 2.16.0/1.54p) [14], was used to place the scale bar on the images.

2.2. Plant Materials

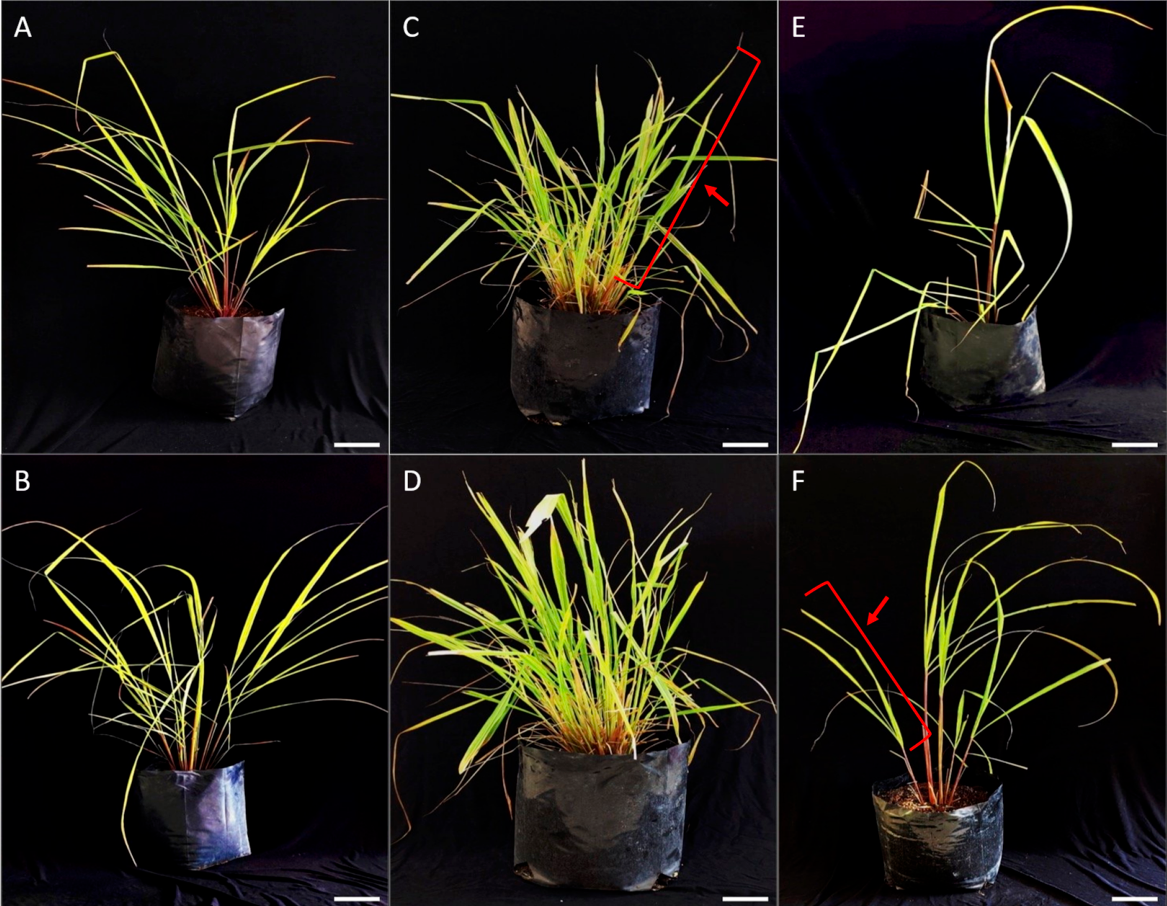
Fresh leaves of lemongrass (C. citratus) were collected from greenhouse plants with a soil combination of organic humus with Agrolita® and Perlite® (3:1:1 v/v) from September to November 2024. The samples obtained (15.0 g each) were homogeneous and harvested from the same greenhouse (Figure 3).

2.3. Extraction of Essential Oils

The EOs were extracted from the fresh leaves of three independent C. citratus plants per three independent biological replicas tested. Cut leaves from three C. citratus plants per replica were not pooled. Fifteen g of leaf tissue from each of the three plants per replica were subjected to hydrodistillation using a Clevenger-type apparatus [15] for four hours. The resulting EO was dehydrated with anhydrous sodium sulfate. Dehydration was carried out twice with anhydrous ether, and the extract was kept refrigerated at 4 °C in isooctane for GC/MS analysis.

2.4. Characterization of Essential Oils Through Liquid–Gas Chromatography-Mass Spectrometry (GC/MS)

The EOs were analyzed by gas chromatography coupled to mass spectrometry (GC/MS) to identify their components. The analysis was performed using an Agilent 5973 inert gas chromatograph/mass spectrometer (GC/MS) coupled to an Agilent 5973N mass selective detector (Agilent Scientific Instruments, Santa Clara, CA, USA). An Agilent capillary column HP-5 of 30 m X 250 μm in diameter X 0.25 μm in thickness (19091J–433: USC353412K–60–325 °C (325 °C) was used. Helium was used as the carrier gas at a flow rate of 0.6 mL/min. The initial temperature in the column was 60 °C, then increased to a maximum of 260 °C. The column pressure corresponded to 3.0638 psi. Run time was 26.25 min with a post-run time of 2 min. The constituents were identified by their fragmentation patterns in mass spectra, compared with data stored in NIST-MS-2011 (version 2.0f) through the Acquisition mode in Mass Hunter\GCMS\2\5973\attune and/or published data [9]. The quantitative analysis was carried out in triplicate.

2.5. Experimental Design

We used a multifactorial (2 × 3 × 3) experimental design with different levels of each tested factor: (1) MS culture media (MS 3/3, MS 5/5); (2) MS culture media with two different CKs (BAP and 2iP) at 2 mg/L and one Ctrl MS medium without any growth regulator; and (3) the content (area %) of three terpenes, either minor or major terpenes by separate, containing three biological replicas and three technical repeats of sampling units. Thus, the results of eighteen content (area %) values (Table S1) were analyzed through a multifactorial ANOVA and Tukey’s test (p < 0.05) [16]. The statistical analysis was performed using GraphPad Prism 10 (version 10.3.1 (464), 21 August 2024).

3. Results

3.1. Chemical Composition of EOs of the Plants Studied

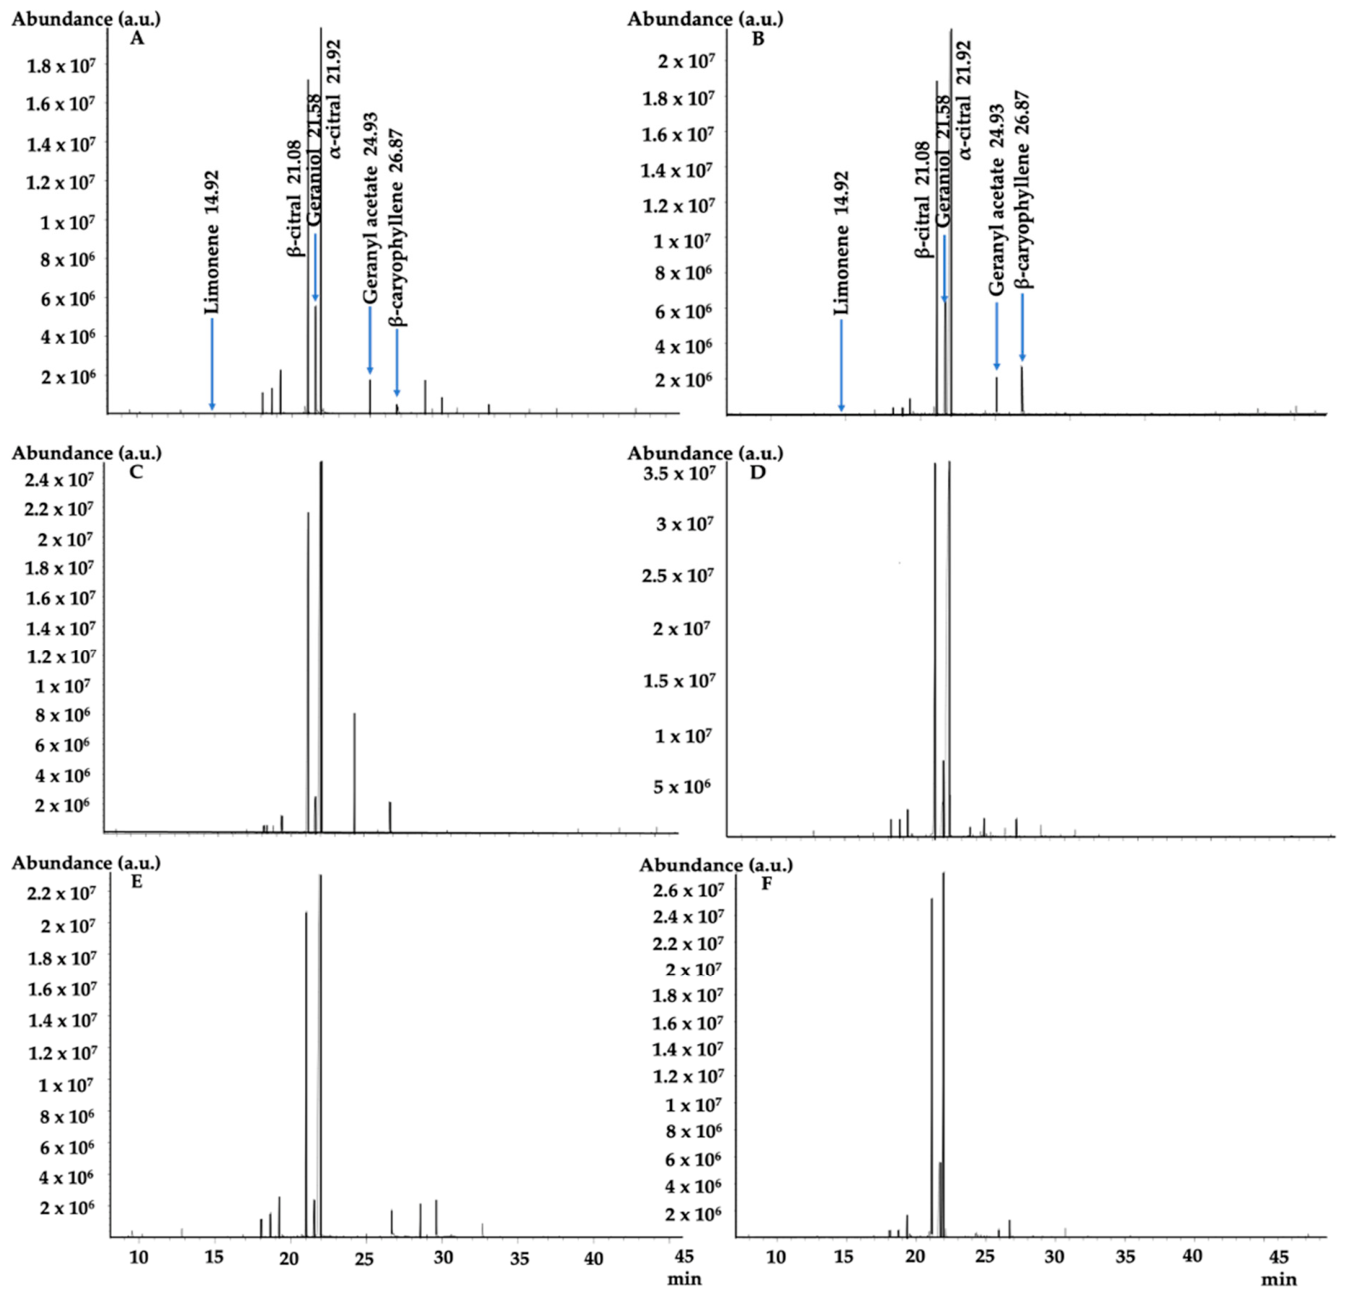
The GC/MS analysis of the EOs from the plants studied across the three treatments (Figure 3) revealed variation in chemical composition, including differences in quality and quantity. Firstly, we compared the GC/MS profile of a citral analytical standard sample (a mixture of neral and geranial from AMCO International S.A. de C.V., Ciudad de México, Mexico) with the profile obtained from fresh leaves of an adult lemongrass plant grown in the greenhouse for three months, and from an in vitro-grown plant. β-citral (neral) and α-citral (geranial) mass spectra and retention times (RTs) obtained previously from GC/MS analysis of citral analytical standard were identical to those of C. citratus leaves (Table 1). The GC/MS analysis of C. citratus EO from the different CK treatments identified many constituents, though most were present in small quantities (less than 1%). The chemical compounds of principal interest reported in C. citratus EO include β-citral, α-citral, nerol, geraniol, citronellal, terpinolene, geranyl acetate, myrcene, and terpinol methylheptenone [17,18]. Furthermore, sesquiterpenes were found to be present only in small proportions, and aromatic compounds such as eugenol were also present [19]. In Table 1, we summarize the most constant marker components present in the essential oil of established plants of C. citratus.
The values represent the average percentage concentration for each terpenoid across the different treatments. The term ‘area %’ is used to denote the total sum of the abundance of all terpenoids in the EO profile, which is then divided by the average quantity of each constituent. The result was expressed as a percentage.
In all treatments, the monoterpene fraction was dominated by β-citral and α-citral, which together accounted for between 28% and 78% of the total terpenes in the EO profiles. Geraniol levels ranged from 2% to 10%. Other monoterpenes were present at levels below 2% (Figure 4, Table 1).
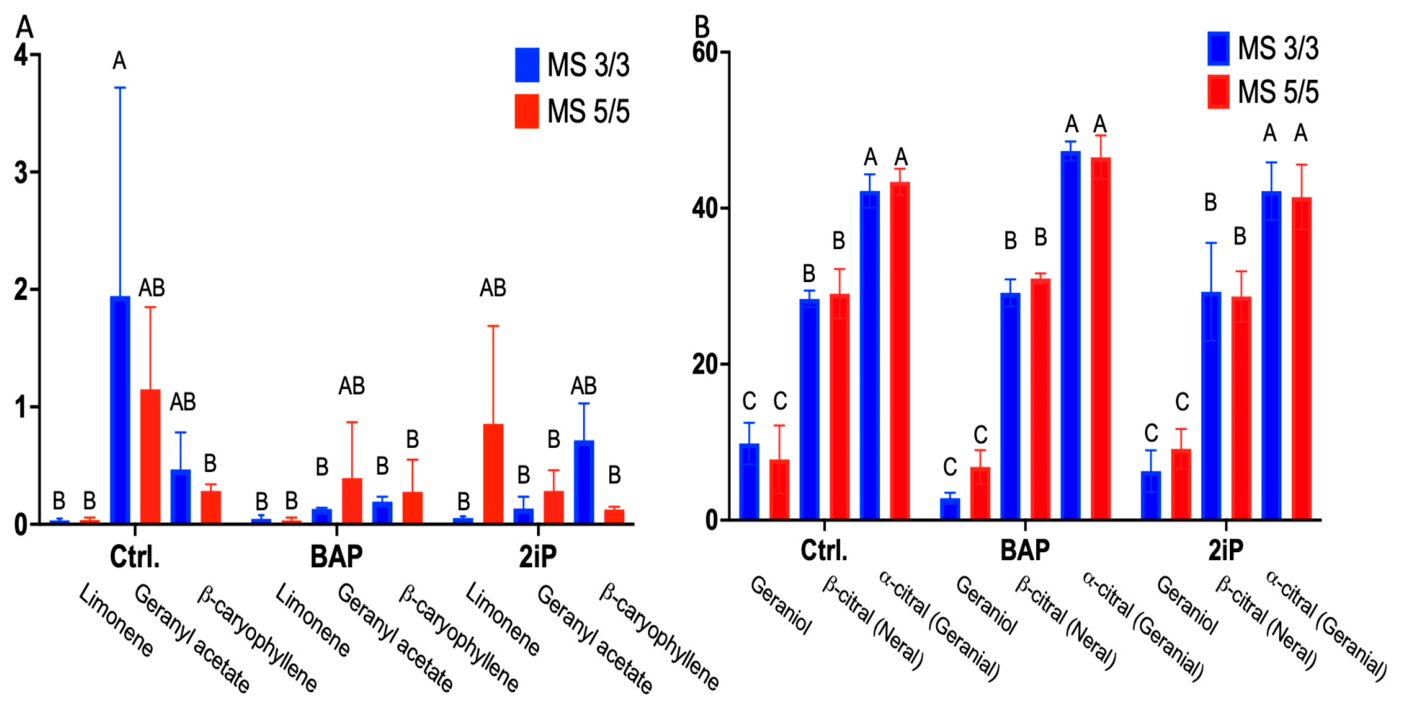
The quantitative analysis of the relative abundance (%), detected from leaf samples of three-month-old C. citratus plants grown from in vitro shoots, shows the effect of each CK on the content (%) of the major bioactive essential oil compound, β- and α-citral, in leaves of established plants grown in MS 3/3 (2iP or BAP treatment) or MS 5/5 (2iP or BAP treatment) (Figure 5, Tables S2 and S3). The results of the quantification to determine the yield of citral (mg/mL), the major component of the C. citratus EO, are presented in the Supplementary Materials (Tables S4 and S5; Figure S1). Quantification was based on a calibration curve made with the citral analytical commercial standard. Similarly, the essential oil extraction yield, expressed as a percentage and in mL/100 g is presented in Tables S6 and S7 of the Supplementary Materials.
From an applied perspective, these results indicate that the choice of CK and culture medium can be used to bias the essential oil profile towards citral-rich or limonene/geraniol-enriched compositions while maintaining the characteristic chemotype of C. citratus, in which geranial and neral together typically account for 60–80% of the oil. This tunability is particularly relevant for tailoring lemongrass oils to applications where citral content and the relative abundance of co-constituents modulate antimicrobial, antioxidant, or sensory properties.

3.2. A Scaling Model for the Production of Essential Oils Based on Biomass

The purpose of this model is to provide a quantitative method for integrating information on plant growth, extraction yield, and the chemical composition of EO into a production estimate. Although biomass growth in C. citratus under ex vitro conditions has been previously described [20,21] and acclimatization responses from in vitro to ex vitro conditions have been reported in other species [22,23] current approaches do not integrate biomass dynamics, essential oil yield, and terpene composition into a unified predictive framework. To address this limitation, a semi-empirical model was developed to link plant growth, biomass allocation, and chemical composition for the estimation of terpene production under controlled micropropagation and greenhouse conditions. To accomplish this, the model integrates specific experimental data from the system under study and documented physiological mechanisms, classifying it as a semi-empirical predictive model of metabolic productivity valid within the experimental framework, where any methodological change would require recalibration of the model parameters.

3.2.1. Weighted Linear Model for Biomass Calculation

The initial component of the model describes the generation of biomass per plant for each treatment over time. The growth component of the model is based on the partitioning of plant development into three structural variables height, shoots, and roots whose growth rates (GRs) were experimentally determined during the first month. First, the maximum potential biomass (MPB) is calculated based on (1) the growth rates (GRs) of height, shoots, and roots obtained experimentally during the first month of cultivation and (2) a weight distribution ratio (WDR) pondered according to the specific morphology of each treatment. Subsequently, (3) normalized phase growth coefficients (PGCs) are used to obtain the first part of the model.
Growth Rates (GRs)
Plant growth was segmented into three strategic variables (height, shoot generation, and root generation), which were measured experimentally in 10 specimens per treatment during the first month of cultivation. This partitioning follows classical functional growth theory, in which biomass allocation among organs determines overall plant performance [24,25]. This information was used to generate the GR per variable.
Weight Distribution Ratio According to Morphology (WDR)
Weight distribution factors (WD) were defined by integrating literature constraints with experimentally observed morphological responses. Meta-analyses indicate that leaf biomass fractions typically range from 0.6 to 0.8 and root fractions from 0.15 to 0.25 during early vegetative stages [26]. The GR showed specific morphological differences among treatments, thus experimentally corroborating that the weight distribution across treatments is not analogous, as there are known and documented effects of morphological alterations in C. citratus plants due to the use of different growth regulators. Such as height repression and rapid shoot proliferation with BAP, or high root development with 2iP [9,27]. Therefore, it is necessary to define a characteristic WDR for each treatment. For the control treatments, a distribution of 60% of the weight to height, 20% to shoots, and 20% to roots was designated, consistent with the patterns observed in gramineous plants during early stages of vegetative growth, where studies of biomass distribution in poaceae represent 70–85% to the aerial fraction and between 15–25% to the root system [25,26]. For the 2iP and BAP treatments, the weight distribution was obtained by comparing the morphological differences between treatments according to the experimental growth data, considering 50% height, 20% shoots, and 30% roots for the 2iP treatments, and 40%, 40%, and 20%, respectively, for the BAP treatment.
The next step was to use the equation to calculate the maximum amount of potential biomass that can be generated per plant each month, based on the relationship between weight distribution:
F p o t = 1 + G R h W D R h + 1 + G R S W D R S + 1 + G R r ( W D R r )
where
  • Fpot = potential growth factor
  • GR = growth rate
  • WDR = weight distribution ratio
  • h = heights; s = shoots; r = roots
  • 1 = biomass proportion (100%)
Use of Normalized Growth Rate Coefficients by Phase
It is well established that plant growth is not constant over time but instead exhibits phases of acceleration and deceleration driven by metabolic adjustments and environmental interactions. Unlike microbial systems, where growth parameters can often be standardized, plant biomass accumulation is highly variable and context-dependent, particularly when transitions between in vitro and ex vitro conditions are involved. These transitions introduce additional sources of variability related to environmental conditions, cultivation practices, and species-specific responses. Nevertheless, consistent physiological trends have been reported across plant species, allowing the definition of biologically plausible growth ranges. Then, in this research relative growth rate (RGR) values were defined based on such physiological trends rather than fixed universal constants. Thus, to represent the physiological changes associated with the transition from vitro to ex vitro conditions, normalized RGR coefficients were used, which were determined based on a moderate logistic growth rate that declines from a value of 100%, corresponding to the optimal potential physiological growth rate of C. citratus under ideal conditions.
In this way, even though during the in vitro phase C. citratus plants were maintained under controlled environmental conditions that promote high growth rates, some limitations such as reduced stomatal functionality and incomplete cuticle development can restrict photosynthetic efficiency as reported by [28,29]. Therefore, for the first month, in vitro culture phase was assigned with an RGR of 80%, reflecting high but suboptimal growth. For the second month, a phase that corresponds to the transition from in vitro to ex vitro conditions, the most critical phase, the RGR assigned was reduced to 30%. In this regard, in general, it has been reported that this stage is characterized by a substantial reallocation of metabolic resources with a shift from heterotrophic to autothrophic metabolism, which often results in a temporary reduction in net biomass accumulation attributed to the initial critical ex vitro adaptation [29,30,31]. Finally, by the third month, plants continued their recovery under greenhouse conditions. At this stage, although growth resumes, full physiological recovery is not immediately achieved, as acclimatization processes can extend for 12 weeks after ex vitro establishment [28]. Consequently, this stage was assigned with an intermediate RGR value of 60% reflecting partial recovery of growth capacity. The next step was to use the equation to calculate the monthly aerial fraction of biomass per plant:
M P B t = ( W t 1   ) ( F p o t , t 1 )
W t = W t 1 + M P B t R G R t
W t , a = W t W t W D R r
where
  • MPBt = monthly maximum potential biomass
  • W(t−1) = real biomass (previous month)
  • WDR = weight distribution ratio
  • Fpot = potential growth factor
  • Wt = monthly biomass
  • RGRt = monthly related growth rate
  • a = aerial fraction;
  • r = roots
This proposal aligns with classical approaches to plant growth analysis, based on relative growth rates and biomass allocation patterns, which are widely used in plant physiology to describe plant structural dynamics [24,26,32].
System of Equations for Calculating the Required Number of Plants per Terpene Requested
A system of mathematical relationships is established based on the experimental results of oil volumes extracted in each treatment and their composition. This system assumes linear behavior in the extraction and composition of EO, based on the methodology studied, and aims to predict the approximate number of plants required per treatment to produce a given quantity of any of the five main terpenes in the EO. The next step is to use the equation for calculating the number of plants required per treatment based on the amount of terpene requested:
N = T r W e T e W t , a
where
  • N = required plants
  • T = terpene volume
  • Wt = monthly biomass
  • e = extracted
  • r = requested
  • a = aerial fraction
Although when integrating the model equations, the variable corresponding to the total volume of essential oil is algebraically canceled out, the data is already contained in the terpene volume variable, as this requires experimental data for each treatment of relative percentage area (RPA) per terpene and total volume of oil extracted.
The calculations are established at three months because, according to experimental results, this is the minimum time required for all treatments under homogeneous conditions to develop the minimum required aerial biomass (leaves) of 15.0 g to carry out at least one extraction of EO according to the established methodology. That is why it is necessary to subtract the root weight fraction from the monthly biomass obtained in order to obtain the monthly aerial biomass fraction per plant. The results of using the predictive model to calculate aerial biomass per treatment at three months are summarized in Table 2.
Example of application for 3/3 Ctrl:
F p o t = 1 + 7.0 0.60 + 1 + 0.3333 0.20 + 1 + 1.8722 ( 0.20 ) = 5.64   g
W 1 = 1   g + 1.0   5.64 1.0 ( 0.80 ) = 4.71   g
W 2 = 4.71   g + 4.71   5.64 1.0 ( 0.30 ) = 11.27   g
W 3 = 11.27   g + 11.27   5.64 1.0 ( 0.60 ) = 42.67   g
W 3 , a = 42.67   g 42.67   g 0.20 = 34.14   g
Once the fraction of aerial biomass per treatment was known, the terpene production was scaled up using the proposed predictive model. The calculations were performed based on the production request of 100 mL of terpene. Similarly, a visual comparison was made of those treatments that experimentally obtained the largest RPA in the chromatographic analyses (Table 3).
Example of application for the production of 100 mL of limonene–5/5 2iP:
N = ( 100.0   m L ) ( 15.0   g ) ( 0.0053703   m L ) ( 32.04   g ) = 8719   p l a n t s
By explicitly linking plant growth parameters, biomass allocation patterns, and essential oil composition, this semi-empirical model provides a practical tool for estimating the number of plants needed to supply a given volume of individual terpenes under specific micropropagation and greenhouse conditions. Such quantitative insight is rarely available for aromatic grasses and can support early-stage decisions on cultivar selection, CKs, and planting density in metabolite-oriented production systems.

4. Discussion

In the present study, we report the content of the main terpenes present in essential oil extracts of C. citratus plants and propose a semi-empirical scaling model to produce essential oil based on biomass. The EOs were obtained by hydrodistillation and analyzed by GC/MS from leaves of greenhouse-established plants, which were derived from in vitro propagation in different osmotic media (MS 3/3 and MS 5/5) containing 2 mg/L of the CKs BAP and 2iP. Once essential oil yield ant terpene composition was obtained, a semi-empirical model was developed to link growth, biomass allocation, and chemical composition for the estimation of terpene production under controlled micropropagation and greenhouse conditions. Except for citronellal, the most characteristic components or constant markers of the terpene profile of C. citratus obtained by hydrodistillation in this study were the same as those obtained by SPME in a previous study by Camas et al. [9], when comparing the same osmotic media (MS 3/3 and MS 5/5) for BAP and 2iP. In contrast, we found qualitative and quantitative differences in the relative abundance of each terpene between the two methods. For example, when comparing the terpene contents (from lowest to highest polarity) measured as volatiles [9] against our results obtained by steam distillation, the highest volatile limonene content (41.61%) was detected in the 3/3 2iP treatment, whereas, by steam distillation, it was 0.86% in the 5/5 2iP treatment. In the case of volatile β-citral, the highest content (37.33%) was detected in the 3/3 BAP treatment, whereas by steam distillation it was 31.0% in the 5/5 BAP treatment. In contrast, the highest geraniol content (9.83%) was obtained by steam distillation compared to 1.57% as a volatile in 5/5 Ctrl. As for the volatile α-citral content, it was higher (80.04%) with 5/5 Ctrl than by steam distillation (47.33%) with 3/3 BAP. The geranyl acetate content (25.79%) was higher as a volatile compound in the 5/5 Ctrl treatment than the 1.94% obtained by steam distillation in the 3/3 Ctrl treatment. Finally, the highest β-caryophyllene content (3.42%) was also obtained as a volatile compared to 0.72% by steam distillation with 3/3 2iP. In general, the terpene contents of C. citratus measured as volatiles directly from the leaf were higher than the terpene contents obtained by steam distillation. These differences may be because SPME method directly detects volatiles such as the aroma profile from fresh leaves without thermal degradation, while steam distillation requires larger quantities of the material, takes more time, and may result in greater degradation or evaporation of the oil components because it involves high temperatures and longer processing times [33]. However, hydrodistillation is preferable for extracting oils because it estimates the actual quantities that can be obtained and allows for yield calculation based on biomass.
The relative abundance for β-citral (neral) and α-citral (geranial) identified as the most abundant components in the EO of C. citratus [17], are consistent with those reported by Tchoumbougnang et al. [19], Kim et al. [34], Trang et al. [35], Vyshali et al. [18], Blanco et al. [36], and Nonviho et al. [37]. The same applies to the values reported by Cavalcanti et al. [38], where the EOs of C. citratus were obtained by hydrodistillation. Although the main difference between this study and the others mentioned lies in the application of CK and its effect on the biosynthesis of terpenes.
To determine the citral yield (β- + α-citral), its concentration was quantified in mg/mL in the oil volume obtained from the different treatments. The average values shown in Table S5 indicate a 70% increase in the treatments with BAP and 2iP compared to the controls without CKs. However, these differences do not appear significant due to the wide standard deviations observed. This is reflected in the oil yield values obtained by weight (Table S6) and by volume (Table S7) for each treatment, where the extracted oil yield values are very similar across all treatments, although the yield (2–3% w/w) was similar or higher compared with yields reported for other aromatical herbs obtained by steam distillation [36,39]. This means that the extraction method was consistent and the yield around 1.13 mL per 100 g (~1%) of initial material is the same for the different treatments. In this regard, it can be concluded that there is no difference between the treatments, although there is a significant difference in the relative abundance of the various terpenes, as was mentioned earlier and below.
SPME/GC-MS analysis performed in the study by Camas-Reyes et al. [9] showed that the content and composition of EO varied between treatments, and that these variations were related to the type of CK and the branching morphology of the in vitro shoots. In this study, the terpene pattern of the EO also differed quantitatively between the MS 3/3 and MS 5/5 culture media (Figure 4) compared to the Ctrl (without CKs) treatment. In summary, a significant difference was observed between the content of β-citral, α-citral, and geraniol terpenes in the essential oil profiles of MS 3/3 and MS 5/5 compared to the Ctrl treatment (Figure 5), while the other three terpenes (limonene, geranyl acetate, and β-caryophyllene) were less representative compared to the Ctrl treatment. For example, the highest α-citral content was found in BAP-induced MS 3/3 (47.33%), while the highest β-citral content was found in BAP-induced MS 5/5 (31.00%) (Table 1). Compared with previous reports in which citral typically represents 65–85% of C. citratus oil, our micropropagated plants showed citral levels within the lower to intermediate range but with a noticeable modulation by CK treatment, particularly in the relative contributions of geranial, neral and geraniol. This suggests that micropropagation conditions and CK regimes can fine-tune oil composition without altering the overall chemotype, offering an additional layer of control beyond genotype and environment
CKs are considered negative regulators of root growth and lateral root formation. However, the limited literature on CK in the context of in vitro propagation of C. citratus was addressed in Camas-Reyes et al. [9] and Cárdenas-Aquino et al. [27]. The present study, like the studies mentioned above, failed to induce root system formation in the BAP treatment. This effect of BAP suggests a differential response of plants to different CKs, compared with the whiter, thinner roots that grew in the Ctrl basal medium without CK (Figure 2). Therefore, it is likely that the differential response of C. citratus shoots to CKs (2iP and BAP) is based mainly on the signaling of two components of CK, specifically with the type of response regulators (RRs), in addition to cell cycle regulation, RNA, proteins, ribosomal proteins, and polyribosome synthesis. The molecular mechanisms identified by which BAP activates B-type RRs to produce shoots and inhibit root development, and the mechanisms by which 2iP activates A-type RRs to produce roots and inhibit shoot proliferation, are consistent with the observed phenotype in C. citratus [27] (Figure 2). Our findings are consistent with field studies showing that foliar BAP can alter citral percentage without markedly changing total oil yield, but extend these observations by demonstrating that BAP and 2iP applied during in vitro propagation differentially impact both plant architecture and the relative abundance of key monoterpenes in adult plants.
In line with molecular evidence that BAP and 2iP activate distinct response regulator modules during lemongrass micropropagation, the contrasting shoot–root phenotypes observed here likely contribute to treatment-specific biomass allocation and, consequently, to differences in terpene productivity per plant; in this regard, the differential effects of various CKs on plant architecture and biomass are linked to terpene production. Regarding this, as a functional example, in a previous study Camas et al. [9] published by our group. The CK BAP in the in vitro culture medium induces an increase in the terpene citral, which in turn, is related to plant architecture and the number of shoots produced. These results functionally link the type of CK to plant morphology (which is preserved until the greenhouse stage) and to biomass and their relative abundance of citral. This background validates our proposed model. We therefore applied a deterministic, biomass-based production scaling model to estimate the number of C. citratus plants required for each treatment to produce a specific volume of the terpene present in its essential oil. While it is intuitive to assume that treatments with higher RPA for a given terpene are ideal for maximizing the production of that compound, these are not necessarily the most suitable treatments for minimizing biomass use when scaling up the process. Crater and Lievense [40] mention that results obtained at small scales often differ significantly when scaled up due to changes in volumetric ratios, mass transfer, and other factors affecting process efficiency. Although the model assumes linearity between biomass, oil yield and terpene composition, and is therefore valid only within the experimental conditions tested, it captures the main physiological transitions from in vitro to ex vitro growth and the experimentally observed allocation patterns among shoots, leaves and roots. However, unlike microbial systems, where growth parameters can often be standardized, plant biomass accumulation is highly variable and context-dependent, particularly when transitions between in vitro and ex vitro conditions are involved. These transitions introduce additional sources of variability related to the growth season, environmental conditions, cultivation practices, and species-specific responses. For this reason, one of the limitations of this model is that is not exactly linear, as applying to our data revealed that relative abundances do not necessarily correspond to a lower number of plants required (Table 3). That is, a higher relative abundance of a terpene, such as citral, not necessarily correlate linearly with a lower number of plants required to obtain it. This depends on the plant’s architecture, and on the fact that biomass accumulation must be a dominant factor at scaling. Although plant metabolic processes are inherently non-linear, this first-order approximation enables integration of heterogeneous datasets under controlled conditions and is consistent with the conceptualization of plants systems as biochemical platforms under defined environments [41]. In this sense, it should be viewed as a decision-support tool that provides realistic ranges for biomass and plant numbers rather than exact predictions, and that can be recalibrated as additional data from pilot-scale extractions become available.
The model is a simple yet effective analytical tool for relating plant biomass and terpene production under controlled experimental conditions. While it does not attempt to mechanistically represent all the physiological processes involved in essential oil production, its structure enables diverse experimental information to be integrated into a coherent, quantitative estimate. This can contribute to comparative analysis of treatments and preliminary planning of biomass requirements for experimental plant metabolite production systems. Importantly, as we mentioned before, the model reveals that treatments with the highest relative percentage area of a given terpene are not always those minimizing the number of plants required to obtain a target volume of that compound. This highlights a critical limitation for optimization strategies based solely on oil composition or relative abundance. This distinction is crucial for bioprocess design, where the objective often shifts from maximizing concentration to minimizing land use, biomass input, and environmental footprint per unit of bioactive molecule produced.
This approach is particularly useful in comparative studies of agronomic or regulatory treatments, where the focus is on evaluating the impact of modifications to plant architecture or growth on the productivity of bioactive compounds. From an industrial perspective, it is particularly interesting because it would maximize production of specific components with the fewest possible inputs, optimize yield per gram of raw material, improves efficiency, reduces environmental impact, and positively impacts the economy [42,43]. However, at the current stage it is framed as an exploratory conceptual analysis limited to the experimental data available. With further studies we think it may become predictive following small-scale experiments with plants grown in the field to get a high level of validation. After these experiments have been carried out it will be possible to conduct the type of sensitivity analysis to be more assertive for making reliable decisions and scalable at the industry level.
In summary, this study demonstrates that integrating micropropagation strategies based on BAP and 2iP with a biomass-driven scaling model enables a rational design of lemongrass production systems aimed at specific terpene targets rather than total essential oil alone. By linking CK-dependent plant architecture, essential oil composition, and estimated plant numbers per 100 mL of terpene, our approach could help bridge the gap between plant physiology and industrial metrics of process efficiency in the near future.

5. Conclusions and Perspectives

The analysis of the chemical composition of C. citratus EO obtained in this study, compared with the terpenes measured as volatiles, showed that is no variation in the terpene profile, but there is a difference between the two methods. In general, a higher content of volatile terpenes was detected than after hydrodistillation. A similarity in which citral (a mix of neral and geranial) was the predominant component was found.
The present study demonstrates that the choice of CK and osmotic medium during in vitro propagation has a measurable impact on the EO composition of greenhouse-established C. citratus plants, although there were no significant differences in the yield of citral and the oil yield among treatments, the yield was similar compared with other publications.
The semi-empirical scaling model presented here provides a practical and quantitative framework for estimating biomass requirements to produce defined volumes of individual terpenes. These findings are relevant for the rational design of micropropagation-based production systems targeting specific EO constituents of commercial interest, particularly citral, geraniol, and geranyl acetate. Future work should focus on validating the scaling model at small-scale plant experiments in the field with experimentally measured biomass in all the growth stages. After that, it will be possible to begin standardizing the model to be more reliable and fully predictive.

Supplementary Materials

The following supporting information can be downloaded at: https://www.mdpi.com/article/10.3390/pr14101532/s1, Table S1: Experimental Design for the three Minor Terpenes and three Major Terpenes; Table S2: ANOVA and Tukey’s statistical tests for Minor Terpenes; Table S3: ANOVA and Tukey’s statistical tests for Major Terpenes; Table S4: Obtained areas from GC/MS of the citral commercial standard, which is a blend of β-Citral and α-Citral read as a serial dilution from 1:100 to 1:10,000 (v/v) dissolved in Isoctane; Table S5: Calculated Yield (mg/mL) for β- and α-Citral (the sum of both isomers) from the three replicas of BAP, 2iP, and Ctrl samples, based on the calibration curve done with the commercial standard mentioned in the text of the manuscript; Table S6: Yield of essential oil extracted from 15.0 g of leaves based on the weight of the oil volume extracted; Table S7: Yield of essential oil in mL/100 gr based on the extracted oil volume; Figure S1: Linear regression analysis for the Areas SUM corresponding to each dilution point in Table S4.

Author Contributions

Conceptualization, M.d.R.C.-A. and A.C.-R.; formal analysis, M.d.R.C.-A. and D.L.O.-A.; funding acquisition, L.H.-I.; investigation, M.d.R.C.-A., D.L.O.-A. and A.C.-R.; methodology, D.L.O.-A.; resources, A.M.-A. and L.H.-I.; validation, M.d.R.C.-A., D.L.O.-A. and E.R.-C.; visualization, M.d.R.C.-A., D.L.O.-A., E.R.-C. and A.C.-R.; writing—original draft preparation, M.d.R.C.-A., D.L.O.-A. and A.C.-R.; writing—review and editing, J.G.Á.-H., A.M.-A. and L.H.-I. All authors have read and agreed to the published version of the manuscript.

Funding

This research was funded by Ingredientes Especializados S.A. de C.V., grant number CIEA/CEC/IRA/16062022/008 (2023-24). This research was funded, in part, by SIP IPN project 20251332.

Data Availability Statement

The original contributions presented in this study are included in the article/Supplementary Material. Further inquiries can be directed to the corresponding authors.

Acknowledgments

M.d.R.C.-A. and A.C.-R. received postdoctoral fellowships from SECIHTI. The authors would like to thank Francisco Martínez and Julio Limón for encouraging us on the theme.

Conflicts of Interest

The authors declare no conflicts of interest. The funders had no role in the design of the study, in the collection, analysis, or interpretation of data, in the writing of the manuscript, or in the decision to publish the results.

Abbreviations

The following abbreviations are used in this manuscript:
2iP6-(γ,γ-Dimethylallylamino)purine
BAP6-Benzylaminopurine
CKsCytokinins
CtrlControl
DMAPPDimethylallyl diphosphate
DMTsDrimane-type sesquiterpenoids
EOEssential oil
FPPFarnesyl diphosphate
GPPGeranyl diphosphate
GRGrowth rates
IPPIsopentenyl diphosphate
KINKinetin
GC/MSLiquid–Gas Chromatography/Mass Spectrometry
MPBMaximum potential biomass
PGCPhase growth coefficients
RGRRelative growth rate
ROSReactive oxygen species
RPARelative percentage area
SPME-GC/MSSolid Phase Microextraction-Gas Chromatography/Mass Spectrometry
tZtrans-zeatin
WDRWeight distribution ratio

References

  1. de Alvarenga, J.F.R.; Genaro, B.; Costa, B.L.; Purgatto, E.; Manach, C.; Fiamoncini, J. Monoterpenes: Current knowledge on food source, metabolism, and health effects. Crit. Rev. Food Sci. Nutr. 2023, 63, 1352–1389. [Google Scholar] [CrossRef]
  2. Beeby, E.; Magalhães, M.; Poças, J.; Collins, T.; Lemos, M.F.L.; Barros, L.; Ferreira, I.C.F.R.; Cabral, C.; Pires, I.M. Secondary metabolites (essential oils) from sand-dune plants induce cytotoxic effects in cancer cells. J. Ethnopharmacol. 2020, 258, 112803. [Google Scholar] [CrossRef]
  3. Dudai, N.; Poljakoff-Mayber, A.; Mayer, A.M.; Putievsky, E.; Lerner, H.R. Essential oils as allelochemicals and their potential use as bioherbicides. J. Chem. Ecol. 1999, 25, 1079–1089. [Google Scholar] [CrossRef]
  4. Graña, E.; Diaz-Tielas, C.; Sanchez-Moreiras, A.M.; Reigosa, M.J. Mode of action of monoterpenes in plant-plant interactions. Curr. Bioact. Compd. 2012, 8, 80–89. [Google Scholar] [CrossRef]
  5. Graña, E.; Sotelo, T.; Diaz-Tielas, C.; Reigosa, M.J.; Sanchez-Moreiras, A.M. The phytotoxic potential of the terpenid citral on seedlings and adult plants. Weed Sci. 2013, 61, 469–481. [Google Scholar] [CrossRef]
  6. Chaimovitsh, D.; Shachter, A.; Abu-Abied, M.; Rubin, B.; Sadot, E.; Dudai, N. Herbicidal Activity of Monoterpenes Is Associated with Disruption of Microtubule Functionality and Membrane Integrity. Weed Sci. 2017, 65, 19–30. [Google Scholar] [CrossRef]
  7. Ailli, A.; Handaq, N.; Touijer, H.; Gourich, A.A.; Drioiche, A.; Zibouh, K.; Eddamsyry, B.; El Makhoukhi, F.; Mouradi, A.; Bin Jardan, Y.A.; et al. Phytochemistry and Biological Activities of Essential Oils from Six Aromatic Medicinal Plants with Cosmetic Properties. Antibiotics 2023, 12, 721. [Google Scholar] [CrossRef]
  8. Delfine, S.; Loreto, F.; Pinelli, P.; Tognetti, R.; Alvino, A. Isoprenoids content and photosynthetic limitations in rosemary and spearmint plants under water stress. Agric. Ecosyst. Environ. 2005, 106, 243–252. [Google Scholar] [CrossRef]
  9. Camas-Reyes, A.; Vuelvas-Nolasco, R.; Cabrera-Ponce, J.L.; Pereyra-Alférez, B.; Molina-Torres, J.; Martínez-Antonio, A. Effect of Different Cytokinins on Shoot Outgrowth and Bioactive Compounds Profile of Lemograss Essential Oil. Int. J. Plant Biol. 2022, 13, 298–314. [Google Scholar] [CrossRef]
  10. Ganjewala, D.; Luthra, R. Essential oil biosynthesis and regulation in the genus Cymbopogon. Nat. Prod. Commun. 2010, 5, 163–172. [Google Scholar] [CrossRef]
  11. Craveiro, A.; Barreira, E.S.; Rabi, J.D.D. Estudo sobre o efeito de citocininas na biossintese de monoterpenos. In Proceedings of the 41st Annual SBPC Meeting, Fortaleza, Brazil, 9–15 July 1989; p. 531. [Google Scholar]
  12. Prins, C.L.; Freitas, S.P.; Gomes, M.M.A.; Vieira, I.J.C.; Gravina, G.A. Citral accumulation in Cymbopogon citratus plant as influenced by N6-benzylaminopurine and light intensity. Theor. Exp. Plant Physiol. 2013, 25, 159–165. [Google Scholar] [CrossRef]
  13. Murashige, T.; Skoog, F. A revised medium for rapid growth and bioassays with Tobacco tissue cultures. Physiol. Plant 1962, 15, 473–497. [Google Scholar] [CrossRef]
  14. Rueden, C.T.; Schindelin, J.; Hiner, M.C.; DeZonia, B.E.; Walter, A.E.; Arena, E.T.; Eliceiri, K.W. ImageJ2: ImageJ for the next generation of scientific image data. BMC Bioinform. 2017, 18, 529. [Google Scholar] [CrossRef] [PubMed]
  15. Craveiro, A.A.; Matos, F.J.A.; Alencar, J.W. A simple and inexpensive steam generator for essential oils extraction. J. Chem. Ed. 1976, 53, 652. [Google Scholar] [CrossRef]
  16. Tukey, J.W. Comparing individual means in the analysis of variance. Biometrics 1949, 5, 99–114. [Google Scholar] [CrossRef] [PubMed]
  17. Saleem, M.; Afza, N.; Anwar, M.A.; Hai, S.M.; Ali, M.S. A comparative study of essential oils of Cymbopogon citratus and some members of the genus Citrus. Nat. Prod. Res. 2003, 17, 369–373. [Google Scholar] [CrossRef] [PubMed]
  18. Vyshali, P.; Saraswathi, K.J.T.; Mallavarapu, G.R. Chemical Composition of the Essential Oils of Cymbopogon citratus (DC.) Stapf Grown in Three Locations in South India. J. Essent. Oil Bear. Plants 2015, 18, 230–235. [Google Scholar] [CrossRef]
  19. Tchoumbougnang, F.; Jazet Dongmo, P.M.; Lambert Sameza, M.; Nkouaya Mbanjo, E.G.; Fotso, G.B.; Zollo, P.H.; Menut, C. Activité larvicide sur Anopheles gambiae Giles et composition chimique des huiles essentielles extraites de quatre plantes cultivées au Cameroun. Biotechnol. Agron. Soc. Environ. 2009, 13, 77–84. Available online: https://popups.uliege.be/1780-4507/index.php?file=1&id=17148&pid=3547 (accessed on 6 May 2026).
  20. Kumar, A.; Sharma, N.; Gupta, A.; Aggarwal, A.; Kumar, P.; Kumar Sharma, M. Growth and yield responses of west indian lemongrass (Cymbopogon citratus) to bio-inoculants under field conditions. J. Cent. Eur. Agric. 2021, 22, 520–530. [Google Scholar] [CrossRef]
  21. Leal, T.D.B.; Freitas, S.D.P.; Silva, J.F.; Carvalho, A.D. Produção de biomassa e óleo essencial em plantas de capim cidreira [Cymbopogon citratus (Dc.) Stapf.] em diferentes idades. Rev. Bras. Plant. Med. 2003, 5, 61–64. [Google Scholar] [CrossRef]
  22. Carvalho, L.; Amancio, S. Effect of Ex Vitro Conditions on Growth and Adcquisition of Autotrophic Behaviour during the Acclimatisation of Chestnut Regenerated In Vitro. Sci. Hortic. 2002, 95, 151–164. [Google Scholar] [CrossRef]
  23. Kadleček, P.; Tichá, I.; Haisel, D.; Čapková, V.; Schäfer, C. Importance of in vitro pretreatment for ex vitro acclimatization and growth. Plant Sci. 2001, 161, 695–701. [Google Scholar] [CrossRef]
  24. Poorter, H.; Nagel, O. The role of biomass allocation in the growth response of plants to different levels of light, CO2, nutrients and water: A quantitative review. Aust. J. Plant Physiol. 2000, 27, 595–607. [Google Scholar] [CrossRef]
  25. Shipley, B.; Meziane, D. The balanced-growth hypothesis and the allometry of leaf and root biomass allocation. Func. Ecol. 2002, 16, 326–331. [Google Scholar] [CrossRef]
  26. Poorter, H.; Niklas, K.J.; Reich, P.B.; Oleksyn, J.; Poot, P.; Mommer, L. Biomass allocation to leaves, stems and roots: Meta-analyses of interspecific variation and environmental control. New Phytol. 2012, 193, 30–50. [Google Scholar] [CrossRef] [PubMed]
  27. Cárdenas-Aquino, M.d.R.; Camas-Reyes, A.; Valencia-Lozano, E.; López-Sánchez, L.; Martínez-Antonio, A.; Cabrera-Ponce, J.L. The Cytokinins BAP and 2-iP Modulate Different Molecular Mechanisms on Shoot Proliferation and Root Development in Lemongrass (Cymbopogon citratus). Plants 2023, 12, 3637. [Google Scholar] [CrossRef]
  28. Kozai, T.; Kubota, C.; Jeong, B.R. Environmental control for the large-scale production of plants through in vitro techniques. Plant Cell Tissue Organ Cult. 1997, 51, 49–56. [Google Scholar] [CrossRef]
  29. Hazarika, B.N.; Teixeira da Silva, J.A.; Talukdar, A. Effective acclimatization of in vitro cultured plants: Methods, physiology and genetics. In Floriculture, Ornamental and Plant Biotechnology: Advances and Topical Issues, 1st ed.; Teixeira da Silva, J.A., Ed.; Global Science Books: Bexhill-On-Sea, UK, 2006; Volume 2, pp. 427–438. [Google Scholar]
  30. Pospíšilová, J.; Tichá, I.; Kadleček, P.; Haisel, D.; Plzáková, Š. Acclimatization of micropropagated plants to ex vitro conditions. Biol. Plant. 1999, 42, 481–497. [Google Scholar] [CrossRef]
  31. Xiao, Y.; Niu, G.; Kozai, T. Development and application of photoautotrophic micropropagation plant system. Plant Cell Tissue Organ Cult. 2011, 105, 149–158. [Google Scholar] [CrossRef]
  32. Hunt, R. Plant Growth Curves: The Functional Approach to Plant Growth Analysis; Edward Arnold, Cambridge University Press: London, UK, 1982. [Google Scholar]
  33. Huang, B.; Lei, Y.; Tang, Y.; Zhang, J.; Qin, L.; Liu, J. Comparison of HS-SPME with hydrodistillation and SFE for the analysis of the volatile compounds of Zisu and Baisu, two varietal species of Perilla frutescens of Chinese origin. Food Chem. 2011, 125, 268–275. [Google Scholar] [CrossRef]
  34. Kim, V.H.T.; Minh, Q.N.; Vinh, H.D.T.; Hai, N.T.; Ly, H.T.; Hien, N.T.; Trang, D.T.; Dang, N.H.; Dat, N.T. Chemical composition and cytotoxic activity of the essential oils of Cymbopogon citratus L. grown in Phu Tho province. J. Biotech. 2016, 14, 683–687. [Google Scholar] [CrossRef]
  35. Trang, D.T.; Van, H.T.K.; Minh, N.T.T.; Van, C.P.; Dang, N.H.; Dang, H.D.; Quang, T.N.; Tien, D.N. Essential oils of lemongrass (Cymbopogon citratus Stapf) induces apoptosis and cell cyclle arrst in A549 lung cancer cells. BioMed Res. Int. 2020, 2020, 5924856. [Google Scholar] [CrossRef]
  36. Blanco, M.M.; Costa, C.A.; Freire, A.O.; Santos, J.G., Jr.; Costa, M. Neurobehavioral effect of essential oil of Cymbopogon citratus in mice. Phytomedicine 2009, 16, 265–270. [Google Scholar] [CrossRef] [PubMed]
  37. Nonviho, G.; Wotto, V.D.; Noudogbessi, J.P.; Avlessi, F.; Akogbeto, M.; Sohounhloué, D.C.K. Insecticidal activities of essential oils extracted from three species of Poaceae on Anopheles gambiae spp., major vector of malaria. Sci. Stud. Res. Chem. Chem. Eng. Biotechnol. Food Ind. 2010, 11, 411–420. Available online: https://pubs.ub.ro/uploads/articole/3277/CSCC6201011V04S01A0002.pdf (accessed on 6 May 2026).
  38. Cavalcanti, E.S.; Morais, S.M.; Lima, M.A.; Santana, E.W. Larvicidal activity of essential oils from Brazilian plants against Aedes aegypti L. Memórias Inst. Oswaldo Cruz 2004, 99, 541–544. [Google Scholar] [CrossRef]
  39. Romero, E.; Bistoni, S.; Comeli, N. Optimización del proceso de extracción ora rastre de vapor de aceite esencial de Mentha piperita L. y Origanume vulgare L. CIZAS 2024, 21, 83–94. [Google Scholar]
  40. Crater, J.S.; Lievense, J.C. Scale-up of industrial microbial processes. FEMS Microbiol. Lett. 2018, 365, fny138. [Google Scholar] [CrossRef]
  41. Rao, S.R.; Ravishankar, G.A. Plant cell cultures: Chemical factories of secondary metabolites. Biotechnol. Adv. 2002, 20, 101–153. [Google Scholar] [CrossRef]
  42. Rihawi, B. The impact of ISO 22000: 2018 on food facilities performance with multiple production lines. CyTA-J. Food 2024, 22, 2431281. [Google Scholar] [CrossRef]
  43. Roffé, M.A.; Ignacio González, F.A. The impact of sustainable practices on the financial performance of companies: A review of the literature. Vis. Futuro 2024, 28, 221–240. [Google Scholar] [CrossRef]
Figure 1. The structures of the main components of Lemongrass essential oil.
Processes 14 01532 g001
Figure 2. In vitro micropropagated C. citratus plants. (A) 3/3 Ctrl treatment shoots; (B) 3/3 Ctrl treatment roots; (C) 3/3 BAP treatment shoots; (D) 3/3 BAP treatment roots; (E) 3/3 2iP treatment shoots; (F) 3/3 2iP treatment roots; (G) 5/5 Ctrl treatment shoots; (H) 5/5 Ctrl treatment roots; (I) 5/5 BAP treatment shoots; (J) 5/5 BAP treatment roots; (K) 5/5 2iP treatment shoots; (L) 5/5 2iP treatment roots. Scale bar = 1 cm.
Processes 14 01532 g002
Figure 3. Macropropagated plants of C. citratus. Three-month-old plants grew successfully in the greenhouse after being transplanted into the soil. (A) 3/3 Ctrl treatment; (B) 5/5 Ctrl treatment; (C) 3/3 BAP treatment; (D) 5/5 BAP treatment; (E) 3/3 2iP treatment; (F) 5/5 2iP treatment. The part of the plant that was analyzed is indicated by the red arrow and bracket (leaves). Scale bar = 10 cm.
Processes 14 01532 g003
Figure 4. Terpenoid profile from leaf samples of established plants in the greenhouse. Plants were grown from shoots on MS 3/3 and MS 5/5 media with 2 mg/L BAP or 2iP. (A) 3/3 Ctrl treatment; (B) 5/5 Ctrl treatment; (C) 3/3 BAP treatment; (D) 5/5 BAP treatment; (E) 3/3 2iP treatment; (F) 5/5 2iP treatment. Terpenoid names and retention times are shown. The blue arrows indicate the presence of limonene, geraniol, geranyl acetate, and β-caryophyllene.
Processes 14 01532 g004
Figure 5. (A) Effect of BAP and 2iP on the content (%) of each minor compound quantified extracted from leaves of established plants derived from in vitro plants grown on MS 3/3 or MS 5/5. (B) Effect of each CK on the content (%) of the major compounds, extracted from leaves of established plants derived from in vitro plants grown on MS 3/3 or MS 5/5. Results represent the average values of three independent replicates. The A, B, C, and AB uppercase letters over the columns indicate the result of Tukey’s test (p < 0.05) after comparing the various treatments.
Processes 14 01532 g005
Table 1. Chemical composition of the main volatile oils obtained from fresh tissue of leaves of C. citratus established plants in a greenhouse. RT = retention time; (%) = maximum content; SD = Standard Deviation.
C. citratus Essential Oil Composition Obtained by GC/MS
RTMain ConstituentsMS 3/3 (%) ± SDMS 5/5 (%) ± SD
CtrlBAP2iPCtrlBAP2iP
14.92Limonene0.03 ± 0.020.05 ± 0.030.05 ± 0.020.04 ± 0.020.03 ± 0.020.86 ± 1.18
21.08β-citral (Neral)28.36 ± 1.0829.14 ± 1.7529.29 ± 6.2629.03 ± 3.1731.00 ± 0.6528.67 ± 3.25
21.58Geraniol9.83 ± 2.662.81 ± 0.704.93 ± 2.687.79 ± 4.366.83 ± 2.169.14 ± 2.57
21.92α-citral (Geranial)42.22 ± 2.1447.33 ± 1.2242.18 ± 3.6943.38 ± 1.6946.53 ± 2.8041.43 ± 4.15
24.93Geranyl acetate1.94 ± 1.780.13 ± 0.010.13 ± 0.101.15 ± 0.990.39 ± 0.480.29 ± 0.25
26.87β-caryophyllene0.47 ± 0.320.19 ± 0.040.72 ± 0.450.29 ± 0.080.28 ± 0.270.13 ± 0.04
Table 2. Aerial biomass (g) at three months of growth estimated for each treatment using the predictive model. SD = Standard Deviation.
Monthly Biomass Estimated—Predictive Model
TreatmentW1 ± SDW2 ± SDW3 ± SDW3,a ± SD
3/3 Ctrl4.71 ± 0.1711.27 ± 0.5242.67 ± 2.4434.14 ± 1.95
5/5 Ctrl4.94 ± 0.1412.23 ± 0.4348.36 ± 2.1338.69 ± 1.70
3/3 BAP3.58 ± 0.327.04 ± 0.7620.67 ± 2.8116.53 ± 2.25
5/5 BAP3.63 ± 0.337.22 ± 0.8121.47 ± 3.0117.18 ± 2.40
3/3 2iP4.74 ± 0.4011.37 ± 1.1943.23 ± 5.6730.26 ± 3.97
5/5 2iP4.84 ± 0.3211.80 ± 0.9845.76 ± 4.7732.04 ± 3.34
Table 3. Comparison of C. citratus plants required to produce 100 mL of terpene from treatments with higher RPAs vs. treatments with lower RPAs.
TerpeneTreatment with Higher RPAPlants Required Higher RPATreatment with Lower RPAPlants Required Lower RPA
Limonene5/5 2iP87195/5 2iP8719
Citral5/5 BAP3185/5 Ctrl101
Geranyl acetate3/3 Ctrl50385/5 Ctrl34
Geraniol3/3 Ctrl9965/5 2iP816
β-caryophyllene3/3 2iP11,3403/3 2iP11,340
Disclaimer/Publisher’s Note: The statements, opinions and data contained in all publications are solely those of the individual author(s) and contributor(s) and not of MDPI and/or the editor(s). MDPI and/or the editor(s) disclaim responsibility for any injury to people or property resulting from any ideas, methods, instructions or products referred to in the content.