Abstract
As coal-fired power plants shift from being primary power sources to operating as flexible peak-shaving units, the reheater—a critical component of the boiler’s ‘four tubes’—has attracted significant attention. This study focuses on the tube wall temperature distributions of the reheater at different loads and measurement points, analyzing factors that contribute to its uneven heat distribution. The results indicate that the heat distribution across the tubes of the low temperature reheater (LRH) is uneven. From the left to the right side of the tube panel, the tube wall temperatures form two parabolic profiles. The tubes most susceptible to overheating are the first tube of the 91st panel and the first tube of the 181st panel. For the high-temperature reheater (HRH), at an electrical load of 217.7 MW, the maximum temperature difference is higher than that of LRH. At all other electrical loads, however, the maximum temperature difference of the HRH is lower than that of the LRH. The LRH is at a higher risk of tube rupture caused by uneven heating compared to the HRH.
1. Introduction
On 15 July 2024, the National Development and Reform Commission (NDRC) and the National Energy Administration (NEA) released the Action Plan for the Construction of Low-Carbon Transformation of Coal-Fired Power (2024–2027) [1], which once again drew attention to the top-level design of China’s coal-fired power industry policy. The Energy Law of the People’s Republic of China [2], which took effect on 1 January 2025, stipulates that fossil energy should be developed rationally and utilized in a clean and efficient manner; it also emphasizes that coal should play a role in basic support and system regulation within the energy supply system, while the layout of coal-fired power generation projects should be optimized and the regulatory capacity of coal-fired power generation should be enhanced. The 14th Five-Year Plan for the Modern Energy System [3] clearly states that coal-fired power will shift from a primary power source to a basic support and system-regulating power source, providing auxiliary services such as reliable capacity, peak shaving, and frequency modulation. It aims to achieve a cumulative flexibility transformation scale of over 200 million kW for coal-fired power units by 2025. All the aforementioned documents highlight that coal, as a cornerstone for China’s energy supply, should be valued, and the instability caused by new energy sources should be mitigated by leveraging the regulatory role of coal-fired power.
The primary regulatory function of coal-fired power is peak shaving. In 2025, the NDRC and NEA issued the Special Action Implementation Plan for the Upgrading of a New Generation of Coal-Fired Power (2025–2027) [4], which sets forth the following technical requirements for deep peak shaving:
- Existing units shall achieve a minimum power generation output of 25–40% of the rate d load;
- Newly built bituminous coal-fired pulverized coal furnace units shall strive to reach 25% or lower of the rated load under pure condensing conditions;
- Pilot demonstration units of the new generation of coal-fired power shall reach below 20% of the rated load.
A wide range of peak shaving leads to significant changes in boiler combustion and intensified uneven heat absorption across various heating surfaces, which further degrades the heat absorption performance of heating surfaces—especially high-temperature heating surfaces. Thus, under the requirements and support of relevant national industrial policies, the safety of high-temperature heating surfaces in coal-fired power plant boilers faces considerable challenges in the context of deep peak shaving.
As one of the closely watched “four key tubes” of boilers (referring to water wall tubes, superheater tubes, reheater tubes, and economizer tubes), the boiler reheater is also a high-temperature heating surface. During the flexible peak-shaving process of units, thermal deviations caused by heat transfer inertia can results in tube ruptures and boiler shutdowns, leading to substantial economic losses for enterprises.
For instance, a single tube rupture in a 600 MW power unit can cause significant power generation loss, amounting to 3–4 million yuan. Therefore, studying the thermal conditions of reheaters can improve the boiler’s performance design and enhance the safe operation of the unit. Some typical studies are summarized in Table 1.

Table 1.
Some typical studies.
Researchers have proposed several prediction models to forecast the temperature of reheaters. However, for large-scale boiler systems, accurate computational prediction remains challenging without referencing substantial wall temperature data from engineering practice and conducting reasonable analysis. For instance, ultra-supercritical (USC) boilers are widely used in modern thermal power generation—particularly in clean coal-fired power systems. This is attributed to their higher thermal efficiency (typically over 45%), lower coal consumption, and reduced greenhouse gas emissions compared to conventional subcritical or supercritical units. Nonetheless, most existing studies rely on simulated data or samples from small-capacity units. This is primarily due to the strict requirements for unit operational stability and the high cost of on-site testing.
By directly utilizing long-term measured wall temperature data from multiple actually operating high-parameter, large-capacity units, this study overcomes the limitations of traditional research—such as “replacing measured data with simulations” and “extrapolating results from small-capacity units to large-capacity ones.” Consequently, the data in this study aligns better with engineering practice, and the conclusions boast higher credibility and application value.
2. Reheater Introduction
This study investigates the reheater tube wall temperatures of a 1000 MW ultra- supercritical pulverized-coal boiler. The boiler in question is a once-through, single-furnace unit with a furnace height is 64 m, adopting an opposed combustion mode single intermediate reheat technology
The reheater system is divided into two stages based on steam flow: the LRH and the HRH. The LRH is arranged in the flue gas duct upstream of the rear vertical shaft, while the HRH is located in the horizontal flue duct; its layout is illustrated in Figure 1. In operation, steam discharged from the turbine’s high-pressure cylinder is further heated by the reheaters. This process raises the steam’s enthalpy and temperature to specified values before it is returned to the turbine’s intermediate-pressure cylinder. The steam flow diagram is presented in Figure 2.
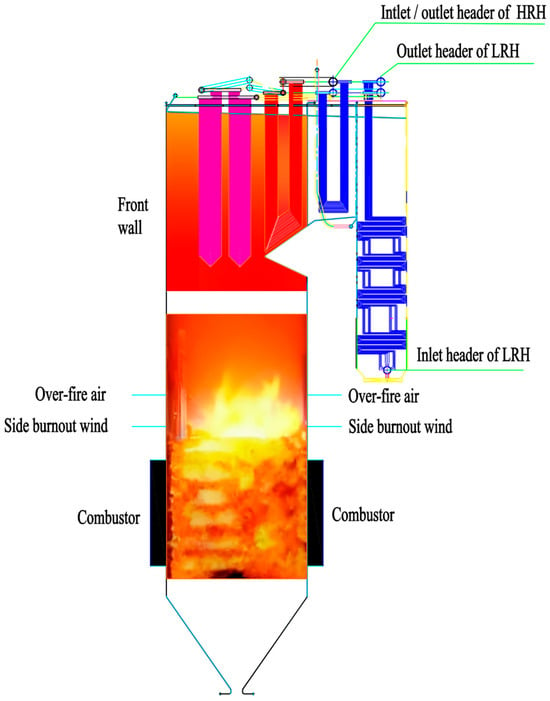
Figure 1.
Layout of reheater [19]. (This figure was drawn using Autodesk Autocad 2021).
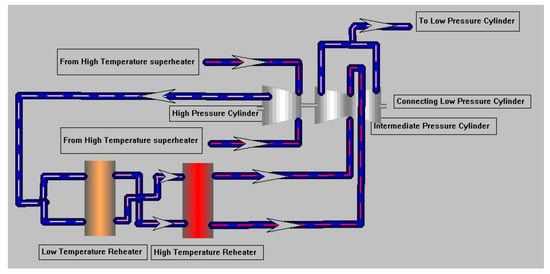
Figure 2.
Flow chart of reheated steam. (This figure was drawn using MCGS 6.2 (General version)).
3. Experimental Conditions and Measurement Points Arrangement
The experimental conditions and measurement points arrangement are as follows:
- The boiler’s operating conditions are detailed in Table 2.
 Table 2. Working conditions of the boiler.
  Table 3. Monitoring points arrangement.
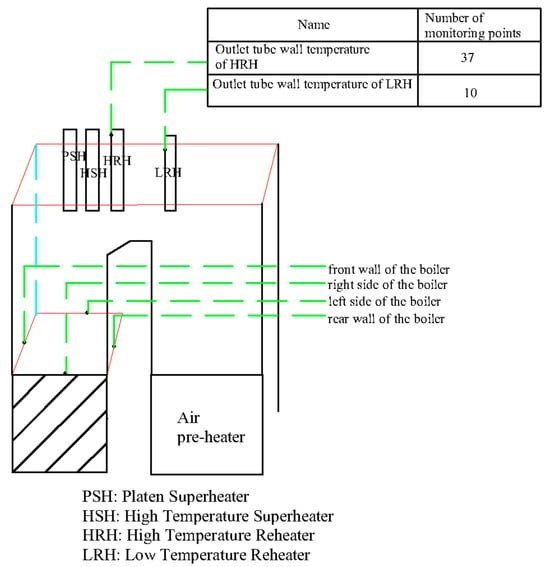 Figure 3. Schematic diagram of the front and rear walls, left and right side walls of the boiler. (This figure was drawn using Autodesk Autocad 2021).
- The sensor employed is a K-type thermocouple, with an allowable tolerance of ±1.5 °C. Its calibration date is 1 March 2023.
- Temperature data collection was performed from 1 May 2023 to 31 July 2024.
- The temperature rise curve of the main steam is illustrated in Figure 4. As observed in Figure 4, the main steam heating rate is approximately 1.19 °C/min within the first 114 min; after 114 min, the rate decreases to about 0.105 °C/min to maintain stable operation.
 Figure 4. Temperature rise curve of main steam. (This figure was drawn using Originpro 2025 (Learning Edition), the following figures were all draw by Originpro 2025 (Learning Edition)).
4. Result Analysis
4.1. LRH
Ten measurement points were installed on the LRH, with their corresponding tube numbers listed in Table 3. The temperature rise process of the LRH is depicted in Figure 5.
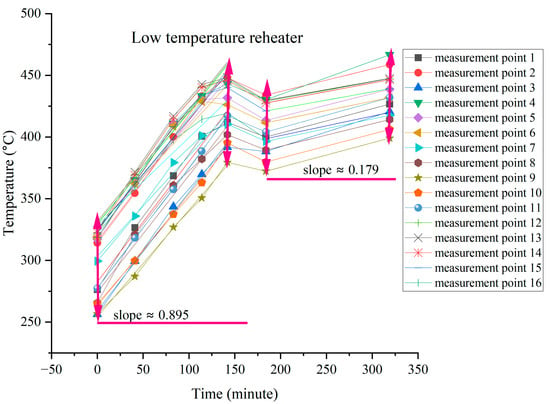
Figure 5.
Temperature rise of the LRH.
As shown in Figure 5, the heating rate of the LRH is approximately 0.895 °C/min within the first 142 min. After 142 min, the heating rate is reduced to about 0.179 °C, which helps minimize the temperature difference between the tube walls of the LRH.
The statistical results of wall temperatures at different loads for each measurement point of the LRH are presented in Figure 6. As observed in Figure 6, significant variations exist in the wall temperatures across the measurement points. Specifically, the temperature distribution among points 1–10 forms two parabolic patterns. Measurement points 4 and 7—corresponding to the 1st tube of the 91st and 181st tube bundles, respectively—represent the peaks of these parabolas, with maximum temperatures reaching 583.3 °C and 580.8 °C at electrical loads of 605.0 MW and 758.8 MW, respectively. As indicated in Table 3, however, these peak temperatures do not exceed the wall temperature limit.
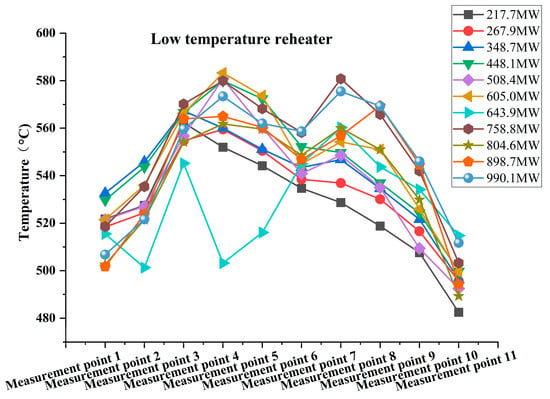
Figure 6.
Statistical diagram of wall temperature of LRH at different measurement points.
Figure 7 illustrates the maximum temperature difference, highest temperature, lowest temperature, and average temperature for each measurement point. It is evident from Figure 7 that the minimum temperature difference is 63.8 °C (at 267.9 MW), while the maximum reaches 88.3 °C (at 508.4 MW). The lowest recorded temperature is 482.5 °C, occurring at an electrical load of 217.7 MW. Figure 7 also reveals significant fluctuations in the highest temperature, lowest temperature, average temperature, and maximum temperature difference, indicating severe uneven heating of the LRH. Such uneven heating across the measured tubes will result in varying thermal stresses within the tube bundle. The heating of the tubes originates from two sources: superheated steam inside the tubes and flue gas outside the tubes. When the tube bundle structure and the flow rate of the working medium inside the tubes are fixed, the thermal deviation coefficient ρ—where . , , and represent the heat load unevenness coefficient, structural unevenness coefficient, and flow rate unevenness coefficient, respectively [20]—indicates that a higher heat load unevenness coefficient on the outer tube wall leads to a larger thermal deviation. This further results in a more significant temperature deviation of the working fluid in the deviated tube compared to the average temperature of the tube array, making the tube more susceptible to rupture under thermal stress.
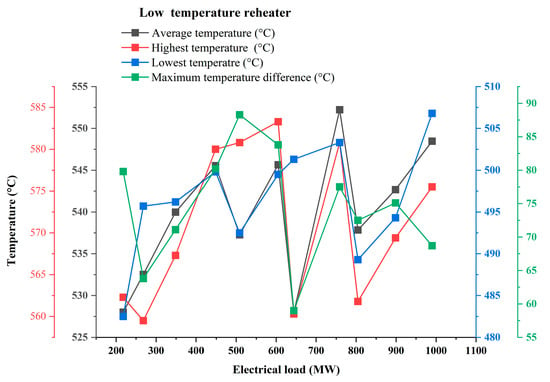
Figure 7.
The variation in highest temperature, lowest temperature, average temperature, and maximum temperature difference of the LRH with changes in electrical load.
Based on the aforementioned analysis, special attention should be paid to the operation of the first tube in both the 91st and 181st tube bundles, as well as the operating conditions at an electrical load of 508.4 MW.
4.2. HRH
A total of 37 measurement points were installed on the HRH. These points are distributed on the first tube (counted from the boiler front) of the odd-numbered tube panels, starting from the left side.
The corresponding locations of the measurement points and their associated tubes are presented in Table 3, and the temperature rise process of the HRH is illustrated in Figure 8. As observed in Figure 8, the heating rate of the HRH is 0.791 °C/min within the first 114 min, after which it decreases to 0.089 °C/min.
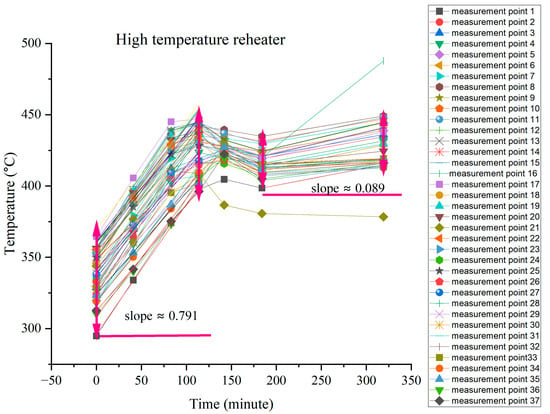
Figure 8.
Temperature rise of the HRH.
Compared with the LRH, the heating rate of the HRH begins to change 28 min earlier. This is because the HRH is arranged in the horizontal flue, enabling a quick response to changes in combustion adjustment. In contrast, the LRH is installed inside the rear shaft, which leads to a delayed response.
Figure 9 presents the temperature statistics for each measurement point of the HRH, which are critical for analyzing thermal deviation and optimizing boiler efficiency. As observed in Figure 9, the highest temperatures occur at measurement points 11, reaching 618.9 °C and corresponding to electrical loads of 898.7 MW. But, this temperature does not exceed the HRH’s tube wall temperature limit. Figure 9 also show that the tube wall temperature fluctuations are significant. For instance, at an electrical load of 217.7 MW, measurement point 9 shows a temperature peak of 596.6 °C, while valleys appeared at measuring points 1 and 21. Additionally, a significant temperature drop is observed at measurement point 21 under all electrical loads, except at 643.9 MW.
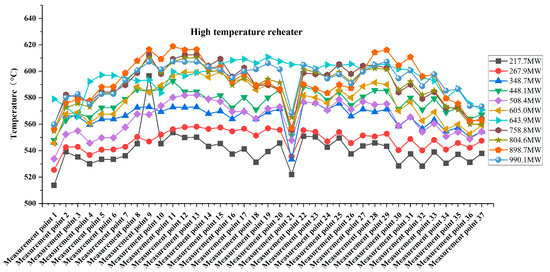
Figure 9.
Statistical diagram of wall temperature of high temperature reheater at different side points.
As illustrated in Figure 10, the variation trends of the highest temperature, lowest temperature, average temperature, and maximum temperature difference for each measurement point with electrical load are generally consistent. The lowest wall temperature is 513.8 °C. This minimum temperature occurs at measurement point 1 (the first tube of the first tube panel) under an electrical load of 217.7 MW.
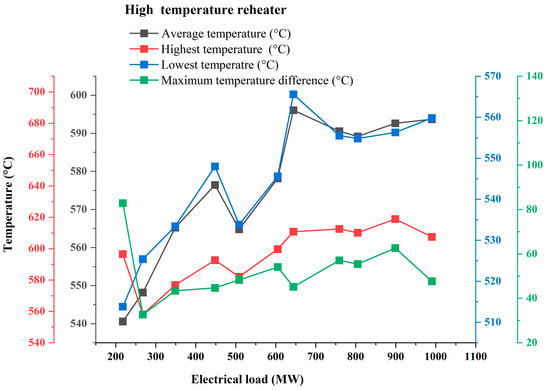
Figure 10.
The variation in highest temperature, lowest temperature, average temperature, and maximum temperature difference of the HRH with changes in electrical load.
Regarding temperature differences, the maximum value is 82.8 °C recorded at an electrical load of 217.7 MW. The minimum temperature difference is 32.7 °C, recorded at an electrical load of 267.9 MW. Overall, the maximum temperature difference varies significantly, and the average temperature ranges from 540.6 °C to 596.1 °C.
4.3. Comparison of Maximum Temperature Difference Between LRH and HRH
Figure 11 compares the maximum temperature differences across different measurement points of the LRH and HRH under the same load. As depicted in Figure 11, at electrical loads of 217.7 MW, the maximum temperature difference of the HRH exceeds that of the LRH. Under all other electrical loads, the maximum temperature difference of the LRH is higher than that of the HRH. This indicates that under most operating conditions, the heat distribution on the tube panels of the LRH is more uneven. Consequently, under flexible load-following conditions, the LRH is more prone to tube rupture caused by uneven heating. Therefore, greater attention should be directed to the LRH during flexible load-following operation.

Figure 11.
Comparison of maximum temperature difference between LRH and HRH.
Regarding the aforementioned issues of uneven wall temperature distribution, the cause analysis is as follows:
- (1)
- Under flexible load-following operation, load changes affect the entire boiler system. On the combustion side, load adjustments lead to corresponding changes in coal feeding rates, which in turn impact the output and operational parameters of coal mills. An imbalance in coal supply between the front and rear walls of the mills may trigger issues such as premature or delayed ignition of pulverized coal and deviation of the flame center. These problems ultimately cause fluctuations in flue gas temperature, which can further result in uneven of the reheater tube walls [21].
- (2)
- To maintain stable furnace combustion, the air supply to the furnace must increase or decrease in tandem with load adjustments. However, there is a lack of synchronization between the response time of coal feeding and that of airflow. This asynchrony is another key factor contributing to uneven wall temperatures in both LRH and HRH.
- (3)
- Changes in coal quality can also induce uneven heating. Coal with higher volatile content has a lower ignition temperature, enabling faster combustion and a shorter burnout time. To sustain stable combustion under such conditions, more coal must be fed into the furnace per unit time. This increases both the flue gas temperature and heat transfer in the reheaters, thereby raising the tube wall temperature.
- (4)
- Load variations also induce changes in the exhaust temperature of the turbine’s high-pressure cylinder (HPC). Specifically, if the HPC exhaust temperature rises—particularly during the boiler’s high-load operation—two key effects on the reheater occur. First, the flue gas flow rate and flue gas temperature at the reheater both increase. Second, the higher exhaust temperature raises the steam temperature at the reheater inlet, which reduces the temperature difference between the two heat transfer fluids (flue gas and steam) and weakens the overall heat transfer efficiency.
5. Conclusions
This study focuses on the wall temperature characteristics of LRH and HRH under different electrical loads. The key conclusions are drawn as follows:
- (1)
- The wall temperature distribution of the LRH exhibits two parabolic patterns from the left to the right wall, with measurement points 4 and 7 corresponding to the peaks of these parabolas. The LRH experiences uneven heating, with the wall temperature difference ranging from a minimum of 63.8 °C to a maximum of 88.3 °C. Under the experimental conditions, none of the LRH tubes exceeded the maximum allowable wall temperature limit.
- (2)
- For the HRH, the maximum temperature difference value is 82.8 °C, and the minimum is 32.7 °C. At electrical loads of 217.7 MW, the maximum temperature difference of the HRH is higher than that of the LRH. However, under flexible load-following operation, the LRH faces a higher risk of tube rupture due to uneven heating compared to the HRH.
Author Contributions
Conceptualization, L.Y. and J.P.; methodology, L.Y. and J.Y.; software, L.Y. and C.L.; validation, L.Y., J.Y. and J.P.; formal analysis, L.Y., J.P., J.Y. and C.L.; investigation, L.Y.; resources, J.P.; data curation, J.P. and L.Y.; writing—original draft preparation, L.Y.; writing—review and editing, L.Y., J.Y. and C.L.; project administration, J.P.; All authors have read and agreed to the published version of the manuscript.
Funding
This research was funded by the Programs for Henan Provincial Science and Technology Research Project (Grant No.232102320229), the Natural Science Foundation of Jiangsu Province of China (Grant No. BK20230700), the General Project of Basic Scientific Research of Jiangsu Province, Jiangsu Education Department (Grant No. 22KJB470012) and the Youth Foundation of Nanjing Institute of Technology (QKJ202201).
Data Availability Statement
The original contributions presented in this study are included in the article. Further inquiries can be directed to the corresponding author.
Conflicts of Interest
Author Jiang Pu was employed by Henan Electric Power Generation Limited Company Pingdingshan Generation Branch, Stater Power Investment Corporation. The remaining authors declare that the research was conducted in the absence of any commercial or financial relationships that could be construed as a potential conflict of interest.
References
- National Development and Reform Commission, National Energy Administration. Action Plan for the Construction of Low-Carbon Transformation of Coal-Fired Power (2024–2027). Available online: https://www.ndrc.gov.cn/xxgk/zcfb/tz/202407/t20240715_1391663.html (accessed on 5 March 2025).
- The Central People’s Government of the People’s Republic of China. Energy Law of the People’s Republic of China. 8 November 2024. Available online: https://www.gov.cn/yaowen/liebiao/202411/content_6985761.htm (accessed on 5 March 2025).
- National Development and Reform Commission, National Energy Administration. 14th Five-Year Plan for Modern Energy System. 15 April 2022. Available online: https://www.ndrc.gov.cn/xwdt/tzgg/202203/P020220322583239614565.pdf (accessed on 5 March 2025).
- National Development and Reform Commission, National Energy Administration. The Special Action Implementation Plan for the Upgrading of a New Generation of Coal-Fired Power (2025–2027). Available online: https://www.ndrc.gov.cn/xxgk/zcfb/tz/202504/t20250414_1397185.html (accessed on 5 March 2025).
- Modliński, N.; Szczepanek, K.; Nabagło, D.; Madejski, P.; Modliński, Z. Mathematical procedure for predicting tube metal temperature in the second stage reheater of the operating flexibly steam boiler. Appl. Therm. Eng. 2019, 146, 854–865. [Google Scholar] [CrossRef]
- González, M.M.P.; García, F.J.F.; Ramón, I.S.; Roces, H.S. Experimental thermal behavior of a power plant reheater. Energy 2006, 31, 665–676. [Google Scholar] [CrossRef]
- Prieto, M.M.; Suárez, I.; Fernández, F.; Sánchez, H.; Viescas, C. Application of a thermal model to a power plant reheater with irregular tube temperatures. Appl. Therm. Eng. 2007, 27, 185–193. [Google Scholar] [CrossRef]
- Purbolaksono, J.; Khinani, A.; Rashid, A.; Ali, A.; Ahmad, J.; Nordin, N. A new method for estimating heat flux in superheater and reheater tubes. Nucl. Eng. Des. 2009, 239, 1879–1884. [Google Scholar] [CrossRef]
- Jiang, L.; Li, Y.; Yao, Y.; Zhang, M.; Lu, J.; Huang, Z.; Zhou, T.; Yue, G. Heat transfer and protection of HRH of a 660 MW circulating fluidized bed boiler after black out. Appl. Therm. Eng. 2022, 213, 118654. [Google Scholar] [CrossRef]
- Xie, J.; Wen, W.; Yang, B.; Yang, F.; Ping, L.; Zhang, F.; Zhang, J. Thermal deviation analysis of HRH for single-tangential π type boiler. Appl. Therm. Eng. 2021, 192, 116846. [Google Scholar] [CrossRef]
- Wang, H.; Lu, X.; Zhang, W.; Wang, Q.; Chen, J.; Kang, Y.; Kuang, W.; Xin, S.; Liu, C.; Xie, X. Study on heat transfer characteristics of the high temperature reheater tube panel in a 300 MW CFB boiler with fluidized bed heat exchanger. Appl. Therm. Eng. 2015, 81, 262–270. [Google Scholar] [CrossRef]
- Yin, L.; Xie, J. Multi-feature-scale fusion temporal convolution networks for metal temperature forecasting of ultra-supercritical coal-fired power plant reheater tubes. Energy 2022, 238, 121657. [Google Scholar] [CrossRef]
- Yin, L.; Zhou, H. Modal decomposition integrated model for ultra-supercritical coal-fired power plant reheater tube temperature multi-step prediction. Energy 2024, 292, 130521. [Google Scholar] [CrossRef]
- Wang, X.; Du, C.; Zhang, K.; Zhang, Y.; Huang, Q. Steam oxidation behavior of T92 steel tube for high temperature reheater after long-term service in ultra-supercritical boilers. Corros. Sci. 2023, 221, 111352. [Google Scholar] [CrossRef]
- Ahmad, J.; Purbolaksono, J. An incident investigation on stub tube at high temperature reheater outlet header region of a power plant. Eng. Fail. Anal. 2010, 17, 1254–1259. [Google Scholar] [CrossRef]
- Xu, M.; Xue, S.; Hu, F.; Jiang, Z.; Zheng, L.; Ren, Y.; Li, Z.; He, S.; Deng, R. Failure case study on reheater pipes in a subcritical unit served for a thermal power plant. Case Stud. Therm. Eng. 2024, 59, 104550. [Google Scholar] [CrossRef]
- Yin, L.; Zhou, H. Multiscale convolutional attention Transformer based on transfer learning for temperature forecasting of ultra-supercritical coal-fired power plant reheater. Appl. Soft Comput. 2026, 186, 114068. [Google Scholar] [CrossRef]
- Gao, L. Analysis of reasons for undertemperature of superheater an reheater at a 660 MW ultra-supercritical boiler power plant. Boil. Manuf. 2024, 4, 9–10, 15. Available online: https://kns.cnki.net/kcms2/article/abstract?v=X-VFCYicIZtEnAOO_YSOVoHfX6eoSpPaax1S1NLW5pBUq6tyPzOporNBJbuxiCD3ZcRMOzbKsdpJWl6ANVH8RMBBKQWo0ej2Ym8Vux8S0ddXN4Td-vknib8IAoipMqHkwk9juOM670j8DThtKgE0jHtvxVD7o_acZSpve0MAfURQ4dMu3LSDFoh56i_KBUHz&uniplatform=NZKPT&language=CHS (accessed on 20 April 2025).
- Yan, L.; Yan, J.; Pu, J.; Song, Y.; Wu, X.; Lu, X. Study on superheater wall temperature in a 1000 MW ultra-supercritical power plant under flexible load operation. Case Stud. Therm. Eng. 2025, 74, 106994. [Google Scholar] [CrossRef]
- Du, S. The Numerical Simulation Calculation for Tube Wall Temperature of Pedant Superheater of Power Station Boiler. Master’s Thesis, North China Electric Power University, Beijing, China, 2008. Available online: https://kns.cnki.net/kcms2/article/abstract?v=kg-5wHjgO94cLELlyTxjoHPbYSdgXmJrYMOTBVYu4yRrz_GuPYStyT8uuZiXYDa6yji-zdzD5H8sCvTu3DtZkQJ5kS8OFtwOXE8Epa4obEjQioA8hZfjB90_hwEqk7sgZW1jOvOvvLntz0m6N-eBm6hDOWNhZDGI-BjETnlT0qvEXyOOB5nk3TOSJT1uSmwy&uniplatform=NZKPT&language=CHS (accessed on 10 December 2024).
- Lei, S.; Sun, F.; Shi, Y.; Lei, W.; Jiao, P.; Wang, N.; Huang, X. Studies of the start-up parameters on wall temperature of reheater. Power Syst. Eng. 2005, 21, 29–31. Available online: https://kns.cnki.net/kcms2/article/abstract?v=kg-5wHjgO97RODdsCmBtVOGung47Ffa_yHPS-0OSHSHxhnGqtBPsJ5UtHYbKdoseHZSKpx-Ff6gSL_EuqWsj-CJas8kme3GDrDCQLt0gCOM95eHa8M_w1zVKC_8Eg6P6-V9-cpRp-T_fTJoLiu6C0vO4lhUPyw91qItAbFxKDnDdOkxpkrFUKaS-SKZ_TQhD&uniplatform=NZKPT&language=CHS (accessed on 10 December 2024).
Disclaimer/Publisher’s Note: The statements, opinions and data contained in all publications are solely those of the individual author(s) and contributor(s) and not of MDPI and/or the editor(s). MDPI and/or the editor(s) disclaim responsibility for any injury to people or property resulting from any ideas, methods, instructions or products referred to in the content. |
© 2025 by the authors. Licensee MDPI, Basel, Switzerland. This article is an open access article distributed under the terms and conditions of the Creative Commons Attribution (CC BY) license (https://creativecommons.org/licenses/by/4.0/).