Article

Enhancing the Production of Milk and Milk Derivatives: A Case Study of Romania

by
Cristina Coculescu
1,
Ana Maria Mihaela Iordache
1,* and
Ioan Codruț Coculescu
2
1
Department of Informatics, Statistics and Mathematics, Romanian-American University, 012101 Bucharest, Romania
2
Department of Economic Informatics and Cybernetics, Bucharest University of Economic Studies, 010552 Bucharest, Romania
*
Author to whom correspondence should be addressed.
Processes 2026, 14(1), 109; https://doi.org/10.3390/pr14010109
Submission received: 14 November 2025 / Revised: 18 December 2025 / Accepted: 26 December 2025 / Published: 28 December 2025
(This article belongs to the Special Issue Development of Innovative Processes in Food Engineering)

Abstract

Milk and its by-products offer a concentrated source of proteins and nutrients that are essential for life and that can be challenging to obtain from other foods. There has been growing interest in the production, enhancement, and effective utilization of milk over time. The objective of this research paper is to contribute to ongoing efforts to enhance the production and collection of milk and dairy derivatives in Romania. In a study analyzing the dairy industry in the European Union, various indicators were examined with the aim of classifying countries and determining Romania’s position. To gain a comprehensive understanding of the dairy industry in the European Union, several indicators were considered, including milk production; different dairy products, such as butter and cheese; and data on bovine populations in various age groups. To efficiently classify the countries and identify Romania’s position, advanced data mining techniques were employed, including cluster analysis and neural network training. To enhance and advance the dairy industry in Romania, this study proposes the exploration of the potential advantages of implementing Industry 4.0 solutions, particularly on a larger scale, with Enterprise Resources Planning (ERP) software.

1. Introduction

The European Union (EU) stands as an important player in the global dairy industry, characterized by high productivity, with average milk yields among the highest worldwide, reaching nearly 7800 kg per cow in 2023 [1]. This level of efficiency is comparable to intensive production systems in countries such as the United States, where yields typically exceed 10,000 kg per cow annually [2], and China, where modern commercial farms achieve 6800–10,600 kg [3].
The abolition of the EU’s milk quota system in 2015 triggered a significant adjustment in the dairy market, leading to an increase in total milk production, while the overall number of dairy cows and farms decreased [4]. This structural change has concentrated production in the most favorable regions, creating a strong link between economic indicators and a nation’s milk output [5]. In 2024, a select group of countries, including Germany, France, and the Netherlands, collectively supplied approximately 48% of the EU’s raw cow’s milk [6].
Romania’s dairy sector presents a distinct case, dominated by many small subsistence farms, a legacy of the post-communist land reform that prioritized land equity over commercial efficiency. This fragmented structure directly contributes to low productivity. Data from Eurostat indicate that Romania’s average milk yield per cow was only 3540 kg in 2024, significantly below the EU average of 8120 kg per cow, placing it among the least efficient producers in the union [6]. Despite its agricultural potential, Romania has a negative trade balance in dairy products, relying heavily on imports to meet domestic demand. Consumer choices are heavily influenced by income, leading to a strong preference for cheaper, often imported products [7]. The lack of investment, limited access to modern technology, and difficulties in meeting EU quality standards have seen the vast majority of small farms struggle to implement formal quality control systems and sustainable production methods due to limited resources and a lack of access to specialized knowledge [8].
In this light, the research questions that the contribution tries to answer are as follows:
  • RQ1: In which group is Romania placed within the European Union in terms of the dairy industry?
  • RQ2: How could Romania enhance its performance in this industry?
The following are the main objectives underlying this paper:
  • Objective 1. Classification of the countries in the European Union according to the main indicators that characterize milk production and the main milk derivatives.
  • Objective 2. The identification of the position of Romania within this ranking.
  • Objective 3. Proposing the adoption of digital economy solutions, i.e., ERP (Enterprise Resources Planning) programs, as the main way to correct the above-identified deficiencies.
This research paper is structured as follows: Introduction, Literature Review, Materials and Methods, Results, Discussion, and Conclusion sections.

2. Literature Review

Despite the EU dairy industry’s high overall efficiency, farm-level financial performance varies considerably, with reported profit margins ranging widely across small, medium, and large farms. Research based on agricultural data from 2015 to 2020 indicates that revenue and debt management are key factors influencing profitability [9]. For smaller dairy producers, raw milk sales provide the most significant financial support. Nevertheless, farms of all sizes tend to experience lower profits when their debt-to-asset ratio is high. On top of that, a producer’s return on investment is usually increased by government assistance through the Common Agricultural Policy (CAP), albeit this benefit is less noticeable for the biggest businesses [9].
This creates a dual structure in the EU dairy sector, where highly productive large-scale operations coexist with smaller, efficient farms [10]. For example, from 2014 to 2021, German farms maintained the strongest competitive position among major EU producers, whereas large-scale Polish farms achieved the highest competitiveness in the same period [11]. Notably, total national output does not always mirror farm-level competitiveness: Western European farms often have high production potential, but farms in countries like Poland can achieve relatively strong return on equity despite their scale [12].
Examining dairy industries in EU member states through recent studies reveals a diverse landscape. For instance, Poland has a rapidly developing dairy industry, particularly in the organic sector, which has seen notable growth and a shift toward modern, larger-scale farms [10]. Similarly, the Czech Republic has experienced a positive trend in its dairy sector, with farms achieving high levels of productivity and efficiency that are competitive on a European scale [13]. However, profitability remains a persistent challenge, with farms needing to focus on cost-management and revenue diversification to improve their economic standing [14].
In Croatia, a significant portion of dairy farms show a low level of economic efficiency, despite some farms being highly specialized [15]. The profitability of these farms is often dependent on factors beyond their direct control, highlighting the vulnerability of the sector. Additionally, to illustrate how similar structural challenges affect efficiency and competitiveness in the region, the Serbian dairy industry, much like Romania’s, underscores the difficulties common across countries with comparable historical and economic contexts, such as a high number of small farms and weak supply chain infrastructure [16].
The analysis of agricultural production has historically relied on a suite of well-established statistical techniques, such as ANOVA, linear regression, and multivariate analysis. A significant body of academic work continues to utilize these methodologies to investigate the factors influencing output and other variables. Within dairy farm analytics, such studies are fundamental for quantifying the impact of key factors, namely the influence of seasonality in pasture-based systems on milk composition and functionality [17]. The application of these methods extends to the development of predictive models for estimating dry matter intake in dairy cows across diverse geographical contexts [18] and establishing a foundation for integrated welfare assessment systems for indoor-housed dairy cattle [19]. The utility of traditional statistics is also demonstrated through its application in predicting milk production by integrating animal and dietary data [20], as well as in forecasting logistical and distribution performance at the farm level [21].
Notwithstanding their established utility, traditional statistical methods, such as linear regression, ANOVA, and logistic regression, possess inherent limitations that become problematic within data-rich environments, including an inability to model complex, nonlinear relationships and inefficiency in processing high-dimensional datasets. In direct response to these limitations, the sector has witnessed a growing adoption of advanced data mining techniques and machine learning (ML) algorithms. The application of ML in agriculture has expanded significantly over the past two decades to address critical challenges related to productivity, animal health, and sustainability [22]. Systematic reviews confirm the effectiveness of these methods for leveraging heterogeneous data from sensors and farm management systems, thereby generating predictive insights that substantially enhance farm-level decision-making [23]. Subsequently, this capability can be amplified through the integration of ML with big data analytics and smart sensor technologies, enabling adaptive, real-time solutions that transcend the capabilities of traditional approaches [24].
Recent scholarly endeavors highlight the transformative potential of machine learning (ML) techniques in dairy farm management, particularly in areas such as reproductive monitoring, welfare assessment, and feed optimization [25]. Concrete applications reinforce this potential: cluster analysis and classification frameworks that integrate algorithms with accelerometer data have been shown to predict key cow behaviors—such as eating and rumination—with high accuracy [26]. Similarly, supervised learning approaches, including Random Forest models, have been employed to estimate milk yield degradation under heat stress, thereby providing managers with essential insights for mitigation strategies [27].
Moving from reactive to proactive, data-driven dairy management is now possible thanks to advanced predictive modeling’s shown capacity to estimate performance metrics like daily milk yield and milking frequency [28]. Artificial Neural Networks (ANNs), which are excellent at identifying intricate patterns in sizable, varied datasets, frequently outperform conventional modeling techniques. As a means of capturing the biological interactions that affect production, they have been successfully deployed to forecast milk yield with higher accuracy than traditional regression algorithms [29]. Likewise, ANNs can predict calving occurrences by analyzing streams of behavioral and activity data, thus enabling timely and potentially life-saving interventions [30]. Sophisticated deep learning architectures have also been used to automatically identify the feeding habits of cattle, allowing for accurate nutritional intake monitoring and the early identification of abnormalities related to health or welfare [31].
The concepts of Agriculture 4.0 [32,33], a paradigm shift that encourages the integration of smart technology across the agri-food supply chain, have had a growing impact on the dairy industry in recent years. Beyond enhancing operational efficiency, these advancements also facilitate more transparent and systematic evaluations of environmental performance [34,35]. This shift requires integrating digital advances with sustainable practices to meet modern goals centered on environmental impact, transparency, and resource efficiency, rather than the traditional focus on productivity and economic performance [36].
Within this evolving context, the use of data mining and advanced analytics has become indispensable, equipping farmers with powerful tools to enhance efficiency and support evidence-based decision-making [37]. A notable example is the Dairy Brain, which integrates large volumes of on-farm data to produce actionable, real-time insights [38]. By continuously processing information on feeding, reproduction, and herd health, such platforms enable dynamic management adjustments that optimize both profitability and long-term sustainability [39]. Complementary analytical methods can further be employed to improve processing efficiency through systematic comparisons of test protocols [40]. At the production level, AI-based systems in robotic milking farms have shown considerable potential by modeling productivity and milk quality from environmental and animal-specific data [41].
Simultaneously, by recognizing the many interdependencies found in farm ecosystems, system dynamics techniques have demonstrated efficacy in optimizing industrial-scale milk production [42]. To facilitate continuous data gathering and real-time analytics, Precision Livestock Farming (PLF) solutions rely on Internet of Things (IoT) and sensor-based applications [43]. Automatic milk recording systems with IoT capabilities offer a cost-effective starting point for digitization, while also lowering manpower requirements and elevating production monitoring [44]. Research from Ireland indicates that by using data-informed management, milk recording technology can significantly raise productivity [45]. In a similar vein, predictive modeling has been used in conjunction with smart devices to anticipate milk output, allowing for better choices regarding herd management and feeding plans [46].
Meanwhile, modern devices that combine advanced detection technologies with automated data processing, such as wearable activity monitors, rumen temperature sensors, and automated milking system sensors, help diagnose diseases, enabling early intervention and real-time health monitoring [47,48]. To follow grazing habits, spot irregularities, and identify welfare problems early on, location and mobility tracking technologies, such as GPS collars and pedometers, have also advanced [49].
Similarly, research on cattle proximity networks demonstrates that digital tools can record temporal and spatial changes in herd relationships that have immediate consequences for welfare management and disease prevention [50]. In the end, these developments help to raise welfare standards by enabling automated milking, ongoing health monitoring, and precise herd management [51,52].

3. Materials and Methods

The problem that this research paper aims to solve is the classification of the countries in the European Union and the position of Romania within it in terms of milk production and milk derivatives. At the same time, by analyzing the economic agents that operate in this branch of agriculture, as a scenario for improving the activity, the adoption of ERP (Enterprise Resources Planning) solutions is proposed. The methodology applied to achieve the above objectives is as follows:
  • Identify, collect, filter, and prepare available data for the problem to be solved.
  • Perform a first classification of countries according to all indicators, using cluster analysis.
  • Train a classification neural network to reduce the error generated by the previous step.
  • Identify the position of Romania in the classification achieved in Step 3 and proposal as a scenario for the recovery of the activity by adopting ERP software.
Table 1 presents and codes the indicators that, in most countries, summarize the production of milk and dairy products. Thus, indicators were chosen which refer to the collection of milk from cows and the quantity of milk-derived products such as yoghurt, cheese, and butter. To sustain this production, it is known that milk-producing animals are needed, so to measure the current and future potential of countries, indicators were chosen to quantify the number of dairy cows, young cows and cows for slaughter or not.
The data source for the indicators was the European Statistical Institute [6], at the year 2023 level, for an initial 27 countries in the European Union (Appendix A). Subsequently, after data collection, the authors found that for Luxembourg, Malta, and the Netherlands, no data were available for three of the indicators. These countries were removed from the analysis, and the sample now contains 24 countries. To enable comparison between countries, all indicators were expressed as percentages. Thus, the value of an indicator for a country represents that country’s percentage of the total achieved by all countries in the analysis for that indicator. The table with the initial data on which the research is based can be found in Appendix A (Table A1).
To perform a first classification of countries according to all indicators, the clustering Ward algorithm was chosen. This algorithm requires minimizing the total variance within a cluster, together with maximizing the degree of homogeneity of the clusters [53].
Next, in addition to minimizing the errors resulting from the cluster analysis, the training of a classification neural network was performed using the incremental backpropagation algorithm.
The incremental backprop method updates the weight estimates after each record based on trial-and-error adjustments applied to the learning rate [54]. For a big database, this method can be very time-consuming. The name of this method came from the reason that the weights are updated after each object—country, in this case—as opposed to the standard backpropagation technique that’s read the entire dataset and then adjusting the weights, according to Equation (1).
f x = t a n h x = e x e x e x + e x = e 2 x 1 e 2 x + 1   ,   f : R R
f x = t a n h x = 1 t a n h 2 x = 4 e x + e x 2   ,     x R
Hyperbolic tangent function tends to alleviate ill-conditioning to the Hessian matrix with a low coefficient of variation, the Standard Deviation divided by the mean, of the hidden layer units, using a hidden layer activation function that outputs values that are in the range of [−1, 1] (Equation (2)). In contrast, other functions transform the units in the hidden layer in the range of [0, 1].

4. Results

Through the application of cluster analysis on the data sample, a first classification of the countries according to all the indicators will be performed. The software involved for this step is SAS Enterprise Guide version 8.6.
Skewness measures the distribution of the values around the means, and depending on the values of this indicator the distribution graph can be tilted to the right (positive values) or to the left (negative values). In the case of this application (Table 2), the distribution graphs of the values of all indicators will be positively tilted, with the longer tail on the positive side of the Ox axis of the graph. The kurtosis column gives information about how flattened or not the plot of each indicator is or is not flattened with respect to the normal distribution. Thus, I2 has a mesokurtic distribution, and all other indicators, due to having kurtosis values greater than 3, have a leptokurtic distribution.
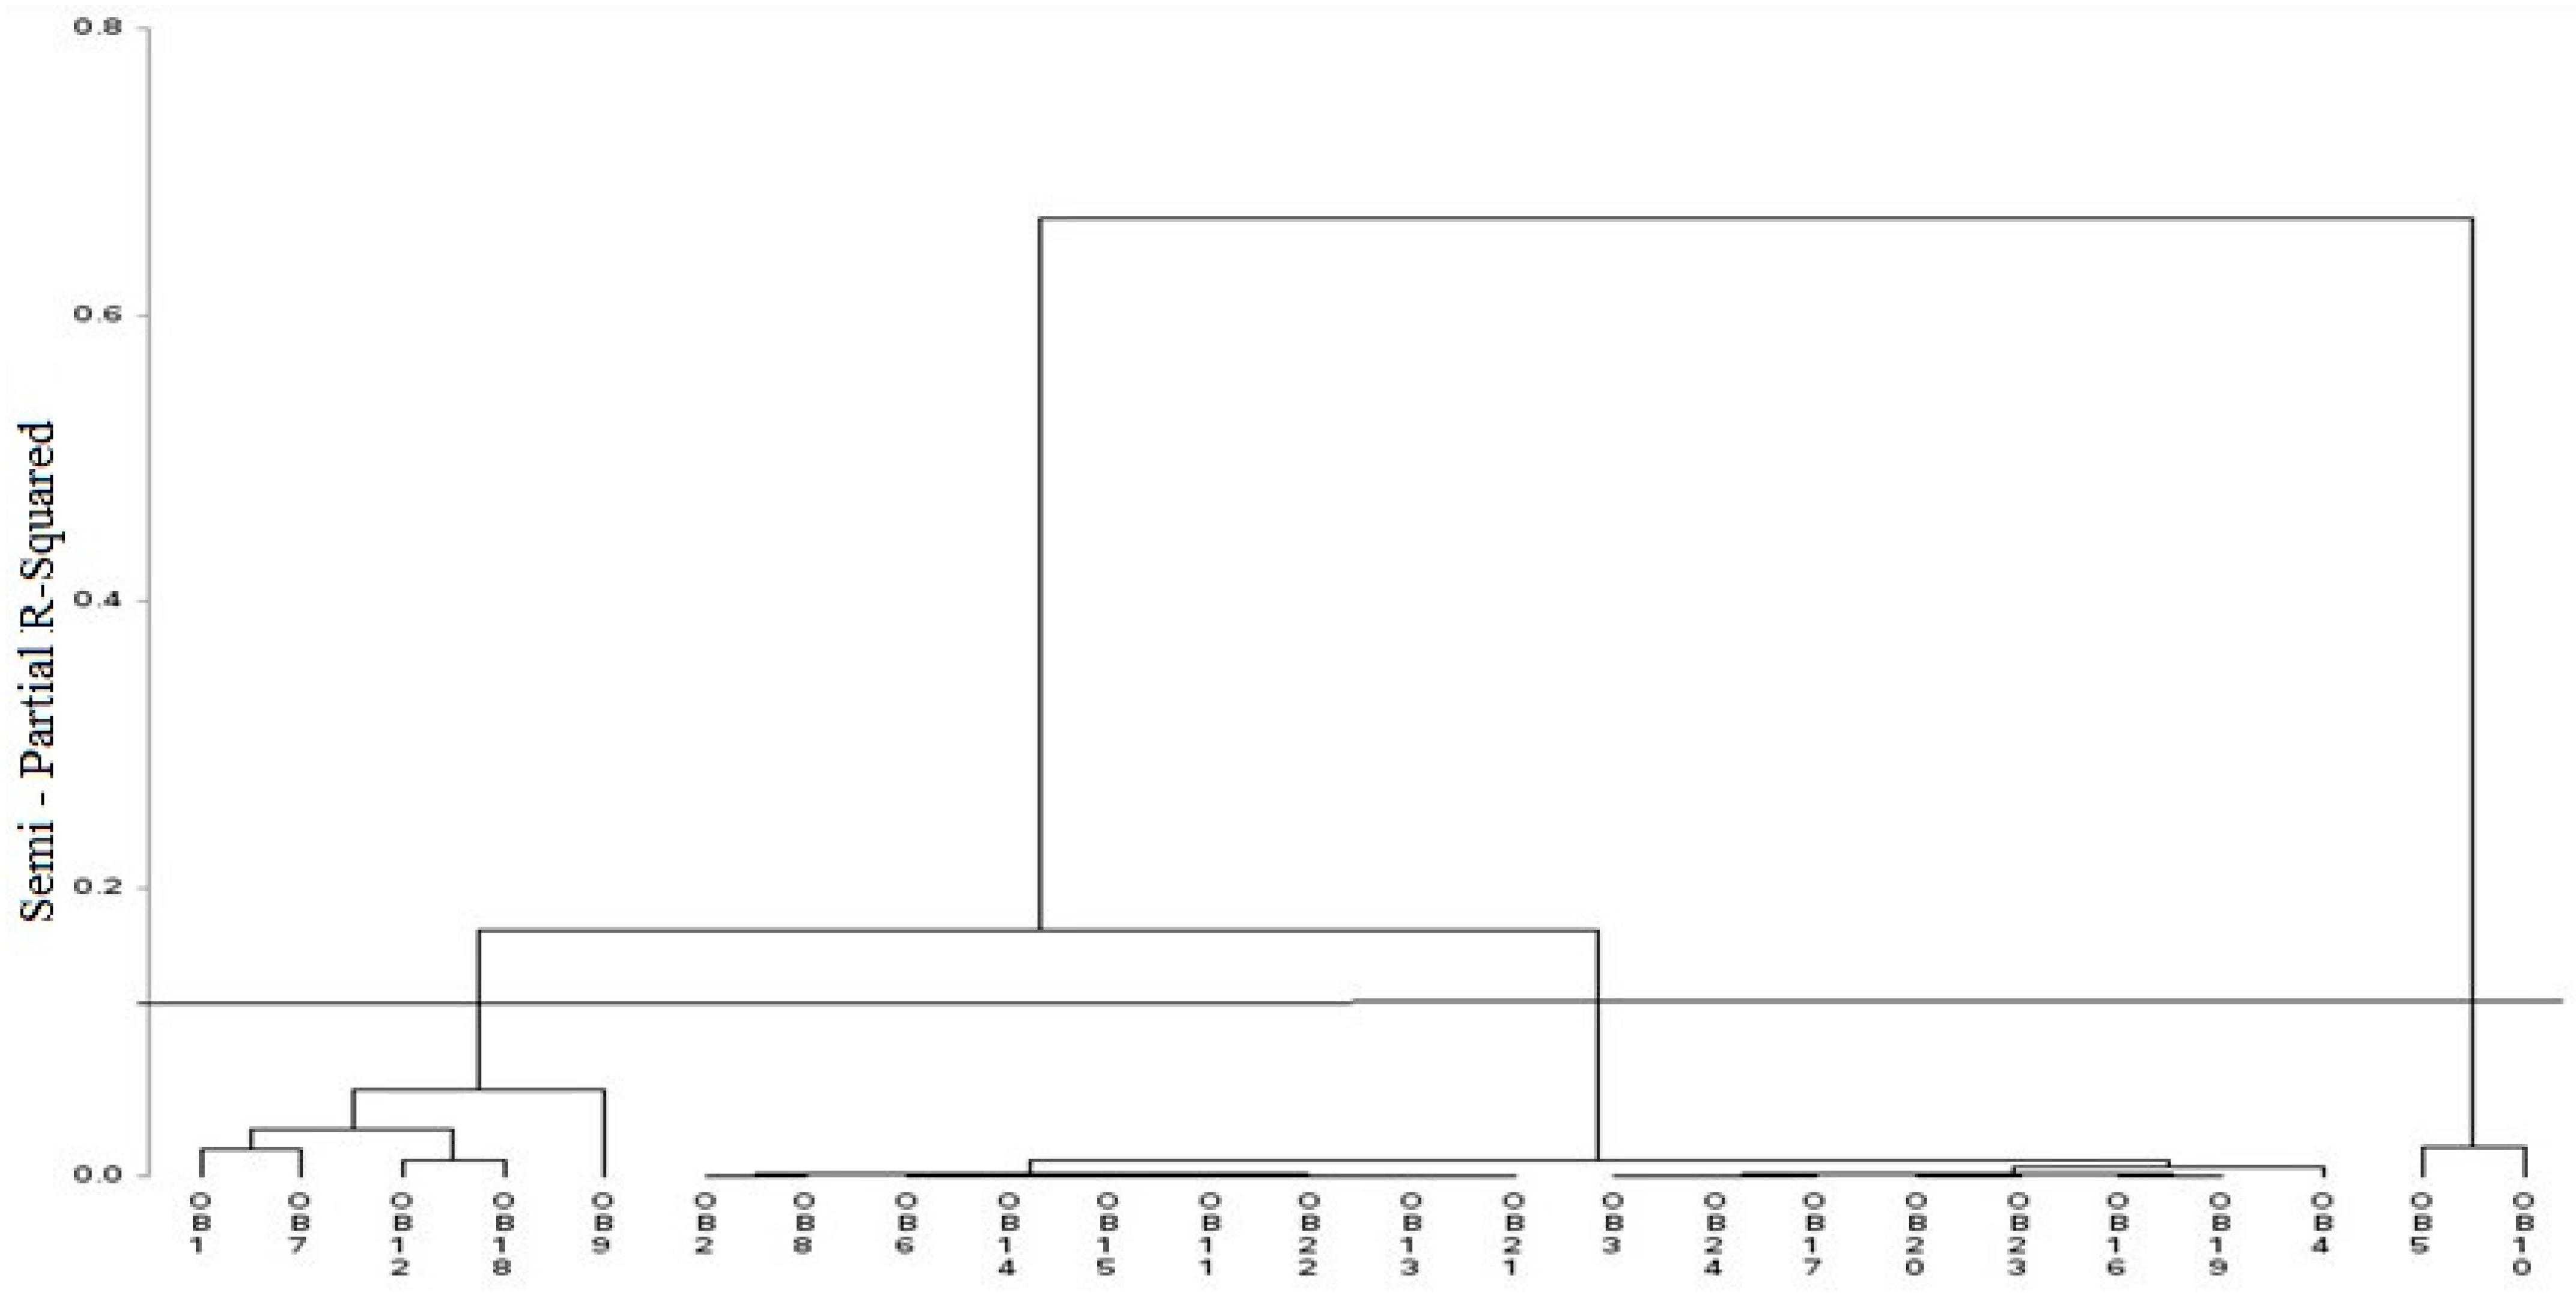
Table 3 contains information on the eigenvalues of the covariance matrix and provides information on whether to drop certain indicators. From a statistical point of view, the maximum amount of information was provided by all the indicators chosen in the application. Although, according to Benzecri’s criterion, the information accepted with minimum error is the one brought by the cumulative value (cumulative column in Table 3) that is 70%, all indicators will be kept in the analysis in order not to increase the error even more. The criterion chosen to perform the cluster analysis is the Ward method, which assumes minimizing the total variance within a cluster while increasing the distance between classes. The hierarchization of classes is shown in Figure 1.
According to the dendrogram shown in Figure 1 (the Ox axis shows the represented countries, and the Oy axis, the algorithm computes the semi-partial R-squared), the graph is cut at a value between 0.1 and 0.15. This range was chosen because it best reflects the objective of the classification, which is to obtain classes that are as far apart as possible with objects within them that are as close as possible. So, three classes will be drawn, with the following structure:
  • Class 1: Germany and France.
  • Class 2: Belgium, Ireland, Spain, Italy, and Austria.
  • Class 3: Bulgaria, Czechia, Denmark, Estonia, Greece, Croatia, Cyprus, Latvia, Lithuania, Hungary, Poland, Portugal, Romania, Slovenia, Slovakia, Finland, and Sweden.
So far, based on all the indicators, a classification of the countries in the European Union has been made, but with an assumed error. Further on, this error should be minimized to improve the previous classification. To solve this situation, a multi-layer perceptron classification neural network will be trained, which will have three layers of neurons: the first input layer will be composed of seven neurons (one for each indicator), the intermediate layer will contain five neurons (number determined experimentally), and the output layer will contain three neurons, one for each class determined previously. The software used to train the neural network is the SAS Enterprise Miner version 15.4.
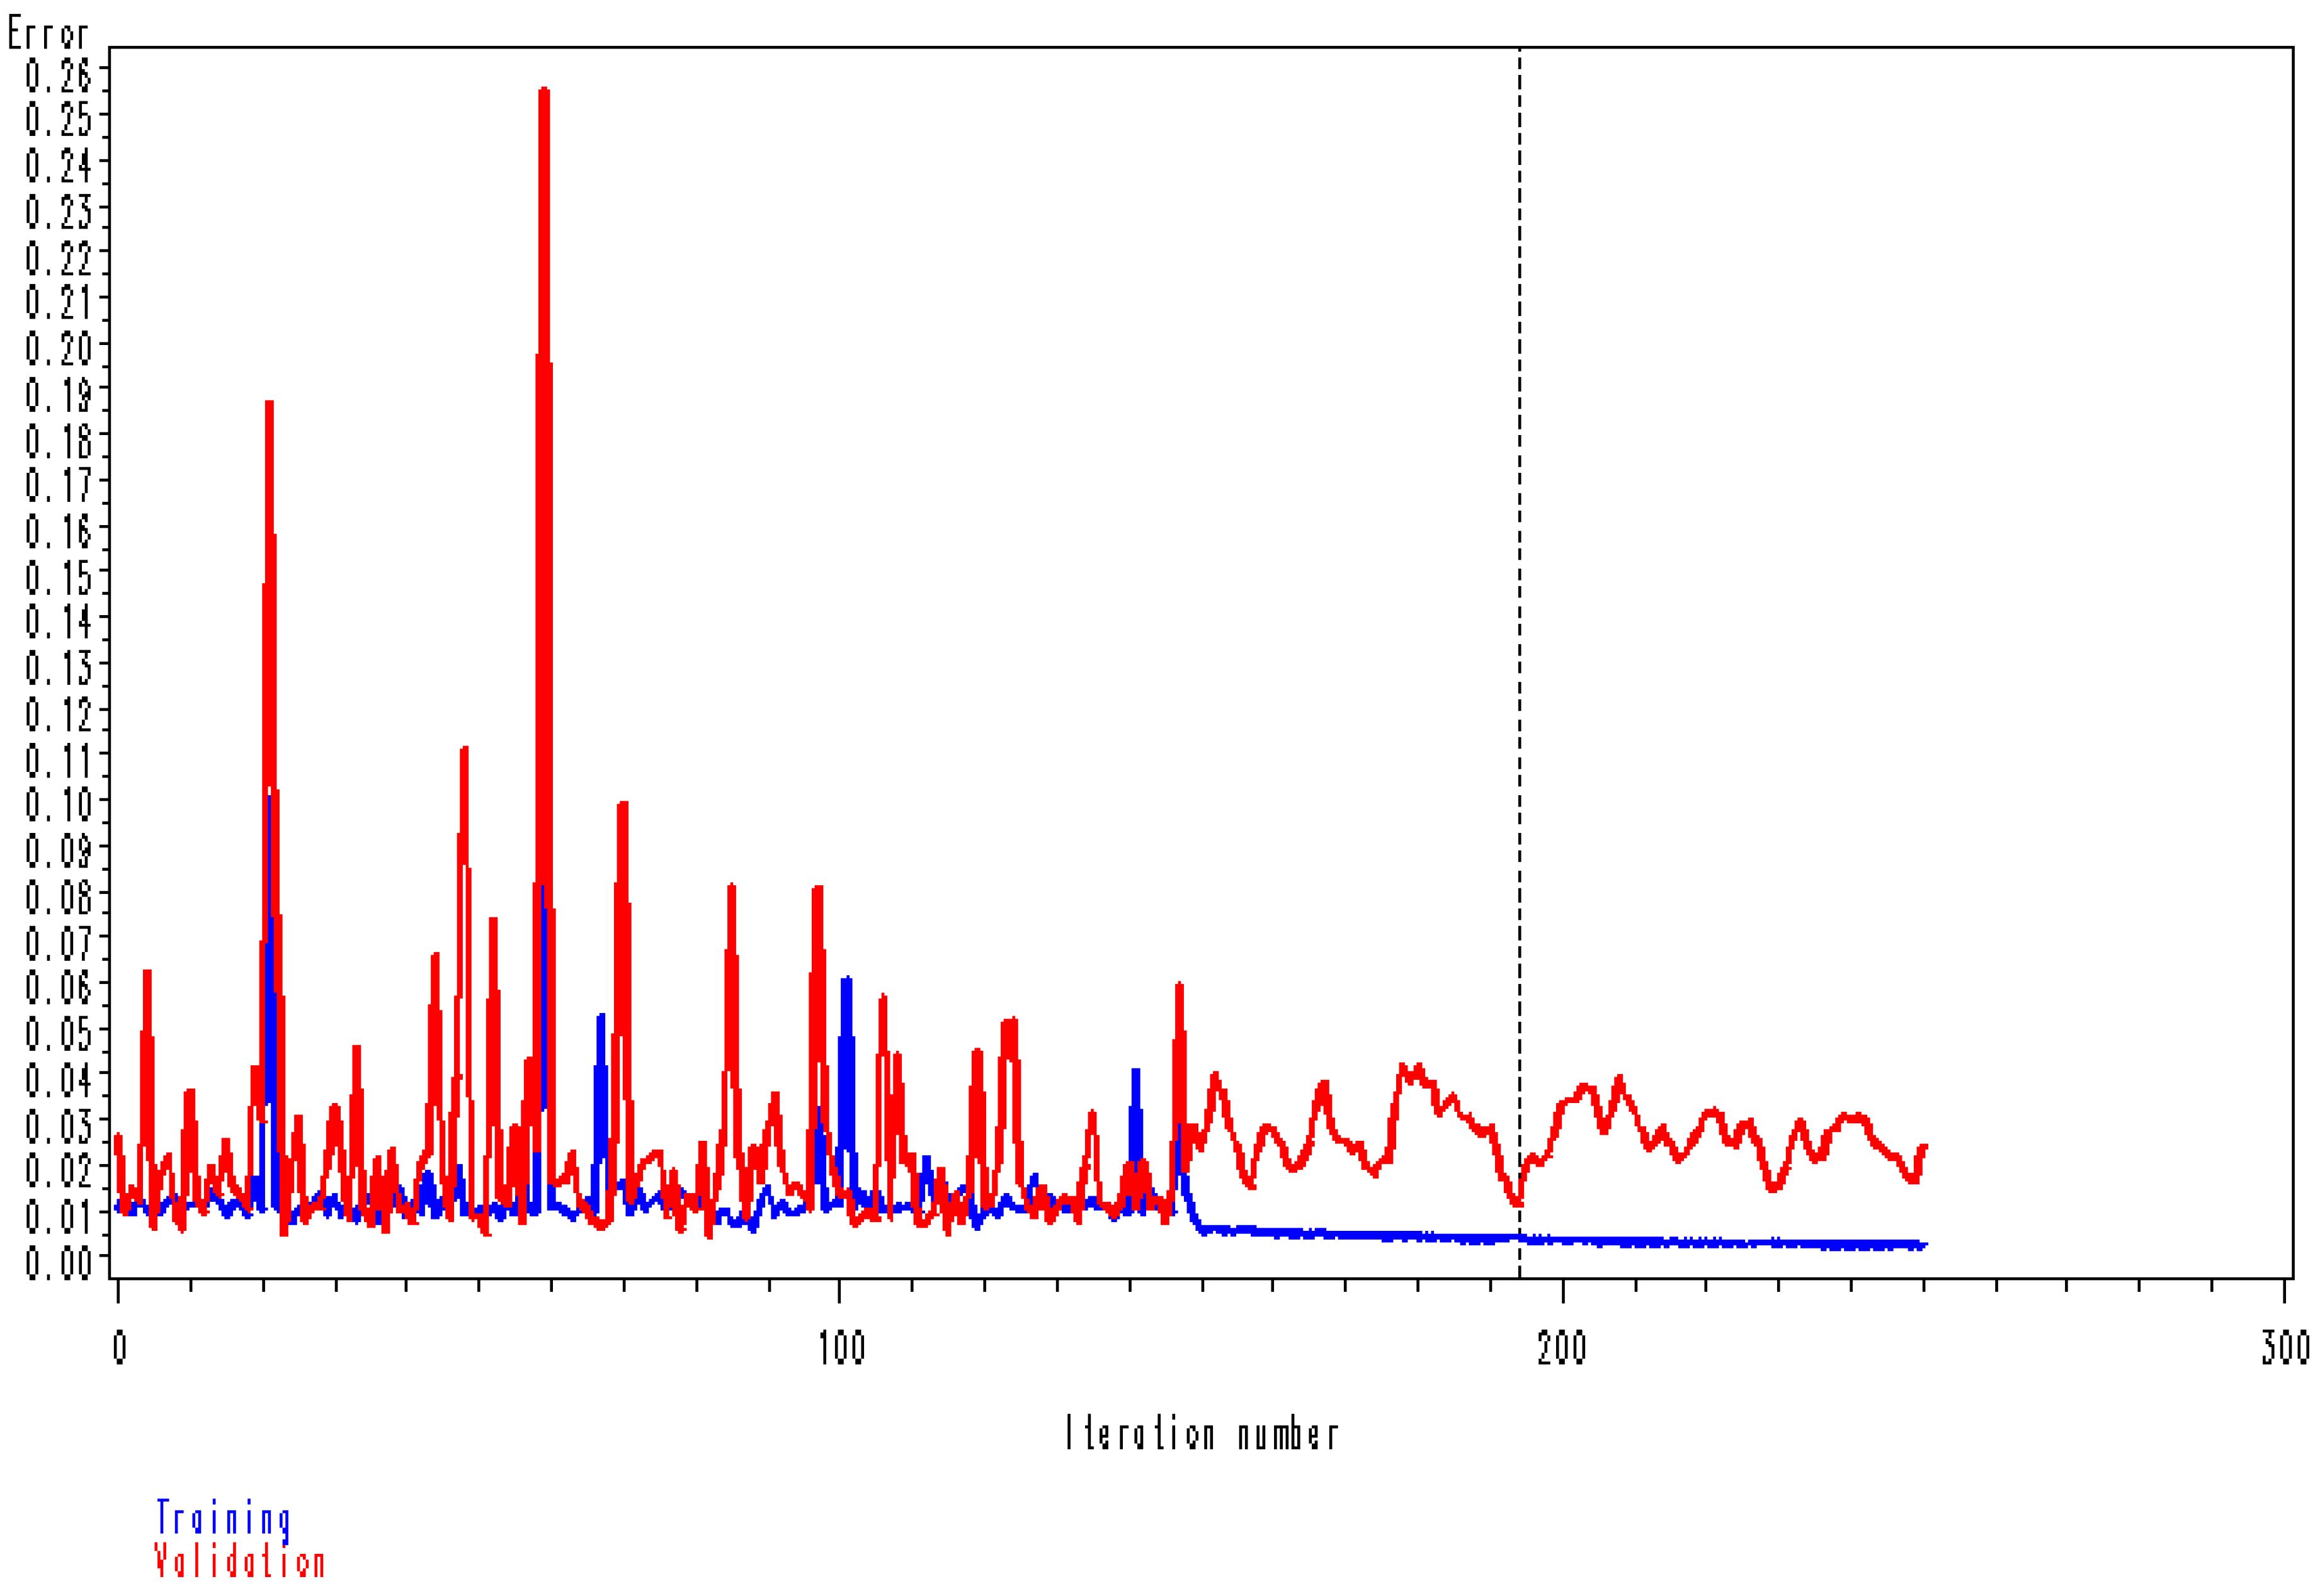
The objective function of the neural network is to minimize the non-membership of a country to a class. The data were randomly partitioned by simple random method as follows: 30% were training data, 40% were validation data, and 30% were network test data. Applying the backprop incremental algorithm, 251 iterations were necessary to train the network, with the error decreasing from 0.01 to 0.0027.
Before applying the chosen algorithm to the neural network, the following values of specific indicators were measured:
  • From the input to the hidden layer;
  • The weights from indicators to neuron 1 (H1): −0.016, −0.038, −0.092, −0.084, 0.028, 0.189, and −0.575;
  • The weights from indicators to neuron 2 (H2): 0.299, 0.216, 0.066, −0.546, 0.169, −0.243, and 0.642;
  • The weights from indicators to neuron 3 (H3): 0.013, 0.364, 0.229, 0.115, 0.323, 0.276, and 0.069;
  • The weights from indicators to neuron 4 (H4): 0.235, −0.389, 0.185, 0.557, 0.696, −0.427, and −0.588;
  • The weights from indicators to neuron 5 (H5): −0.521, −0.421, 0.138, −0.422, 0.191, −0.013, and −0.172;
  • Bias: −0.773, −0.788, −0.517, −0.522, and −0.549;
  • The weights from intermediate to final layer are initially zero;
  • Bias for the final layer is −0.405, 0, and −2.197.
After training the neural network, it can be observed that, in Figure 2, the training error converges linearly to zero. Instead, even if during the 251 iterations, the validation error oscillates, starting with iteration 200, it is stabilizing and starts to converge linearly to zero.
Also, the weights in the network underwent changes in their turn, and for a later utilization of the obtained results, without going through the whole network training process, the scoring functions have the following format:
  • Intermediate layer (Equations (3)–(7)):
H1 = 1.045 × I1 + 1.025 × I2 + 2.220 × I3 + 2.829 × I4 − 0.736 × I5 − 0.239 × I6 + 2.660 × I7;
H2 = 0.767 × I1 + 0.334 × I2 + 1.250 × I3 + 2.172 × I4 − 3.752 × I5 + 0.819 × I6 − 0.581 × I7;
H3 = −0.519 × I1 − 0.173 × I2 − 1.151 × I3 − 1.522 × I4 − 1.566 × I5 − 0.340 × I6 − 0.275 × I7;
H4 = −0.085 × I1 − 0.147 × I2 + 0.042 × I3 − 1.081 × I4 − 0.163 × I5 + 0.246 × I6 − 0.624 × I7;
H5 = 0.327 × I1 + 0.714 × I2 − 1.343 × I3 + 1.234 × I4 − 0.861 × I5 + 2.305 × I6 − 1.404 × I7;
  • Final layer (Equations (8)–(10)):
Class_1 = 3.897 × H1 + 2.092 × H2 + 3.252 × H3 + 1.532 × H4 − 2.806 × H5;
Class_2 = −4.029 × H1 − 3.334 × H2 − 2.629 × H3 + 1.273 × H4 + 2.125 × H5;
Class_3 = 0.032 × H1 + 1.998 × H2 − 1.896 × H3 − 2.988 × H4 + 0.137 × H5;
So, after the neural network training, the new classification of countries is as follows:
  • Class 1: Germany, France, and Spain (initially it was in Class 2).
  • Class 2: Belgium, Ireland, Italy, Austria, and Sweden (initially it was in Class 3).
  • Class 3: Bulgaria, Czechia, Denmark, Estonia, Greece, Croatia, Cyprus, Latvia, Lithuania, Hungary, Poland, Portugal, Romania, Slovenia, Slovakia, and Finland.
Because the classes were selected empirically by cutting the dendrogram in Figure 1, it was necessary to verify the selection using another algorithm. The authors chose to train a neural network classification model. The training process was completed successfully, resulting in a reduction in classification errors and a regrouping of the countries in the analysis. Consequently, Spain moved from Class 2 to Class 1, and Sweden moved from Class 3 to Class 2.

5. Discussion

Until this point, a pertinent classification of the countries in the European Union has been made according to the indicators considered by the authors to be important to characterize the production of milk and milk derivatives. Further on, in the next section, we will discuss Romania’s position within this classification and will suggest as a singular scenario for production recovery: the introduction of digitalization through the adoption of ERP-type solutions.
The analysis reveals that Class 1 is associated with the highest average indicator values. It is made up of highly developed, densely populated countries with expanding economies. The values of the indicators relating to milk and dairy production (I1–I6) are considered high, and the sustainability of these indicators at similar values in the future is given by I7–I10, which also have high values.
The mean indicator values of Class 2 are lower than those of Class 1. However, although Class 2 consists of countries with developed economies, the number of live births in 2023 was significantly lower than the number of children in Class 1 in that same year. These countries have a population that is growing older and that consumes milk and dairy products in a much more moderate way than the relatively younger generation populations in Class 1.
The third class consists of countries with emerging and underdeveloped economies in comparison to the countries classified in the preceding classes. Despite the higher consumption of milk and dairy products, as observed in Class 2 (Table 4), farmers encounter a range of challenges. These obstacles encompass financial, logistical, bureaucratic, and production-related issues, along with challenges related to digitization. The higher cost of these domestically produced goods relative to imported goods can be attributed to various factors, including production costs, shipping costs, and the consumer’s purchasing power, which is determined in part by the cost of goods.
The solution for Romania to improve its diary indicators is to move to a higher class and increase the number of head of milk producing cattle, thus expanding the activity. This will have the immediate consequence of increasing milk production.
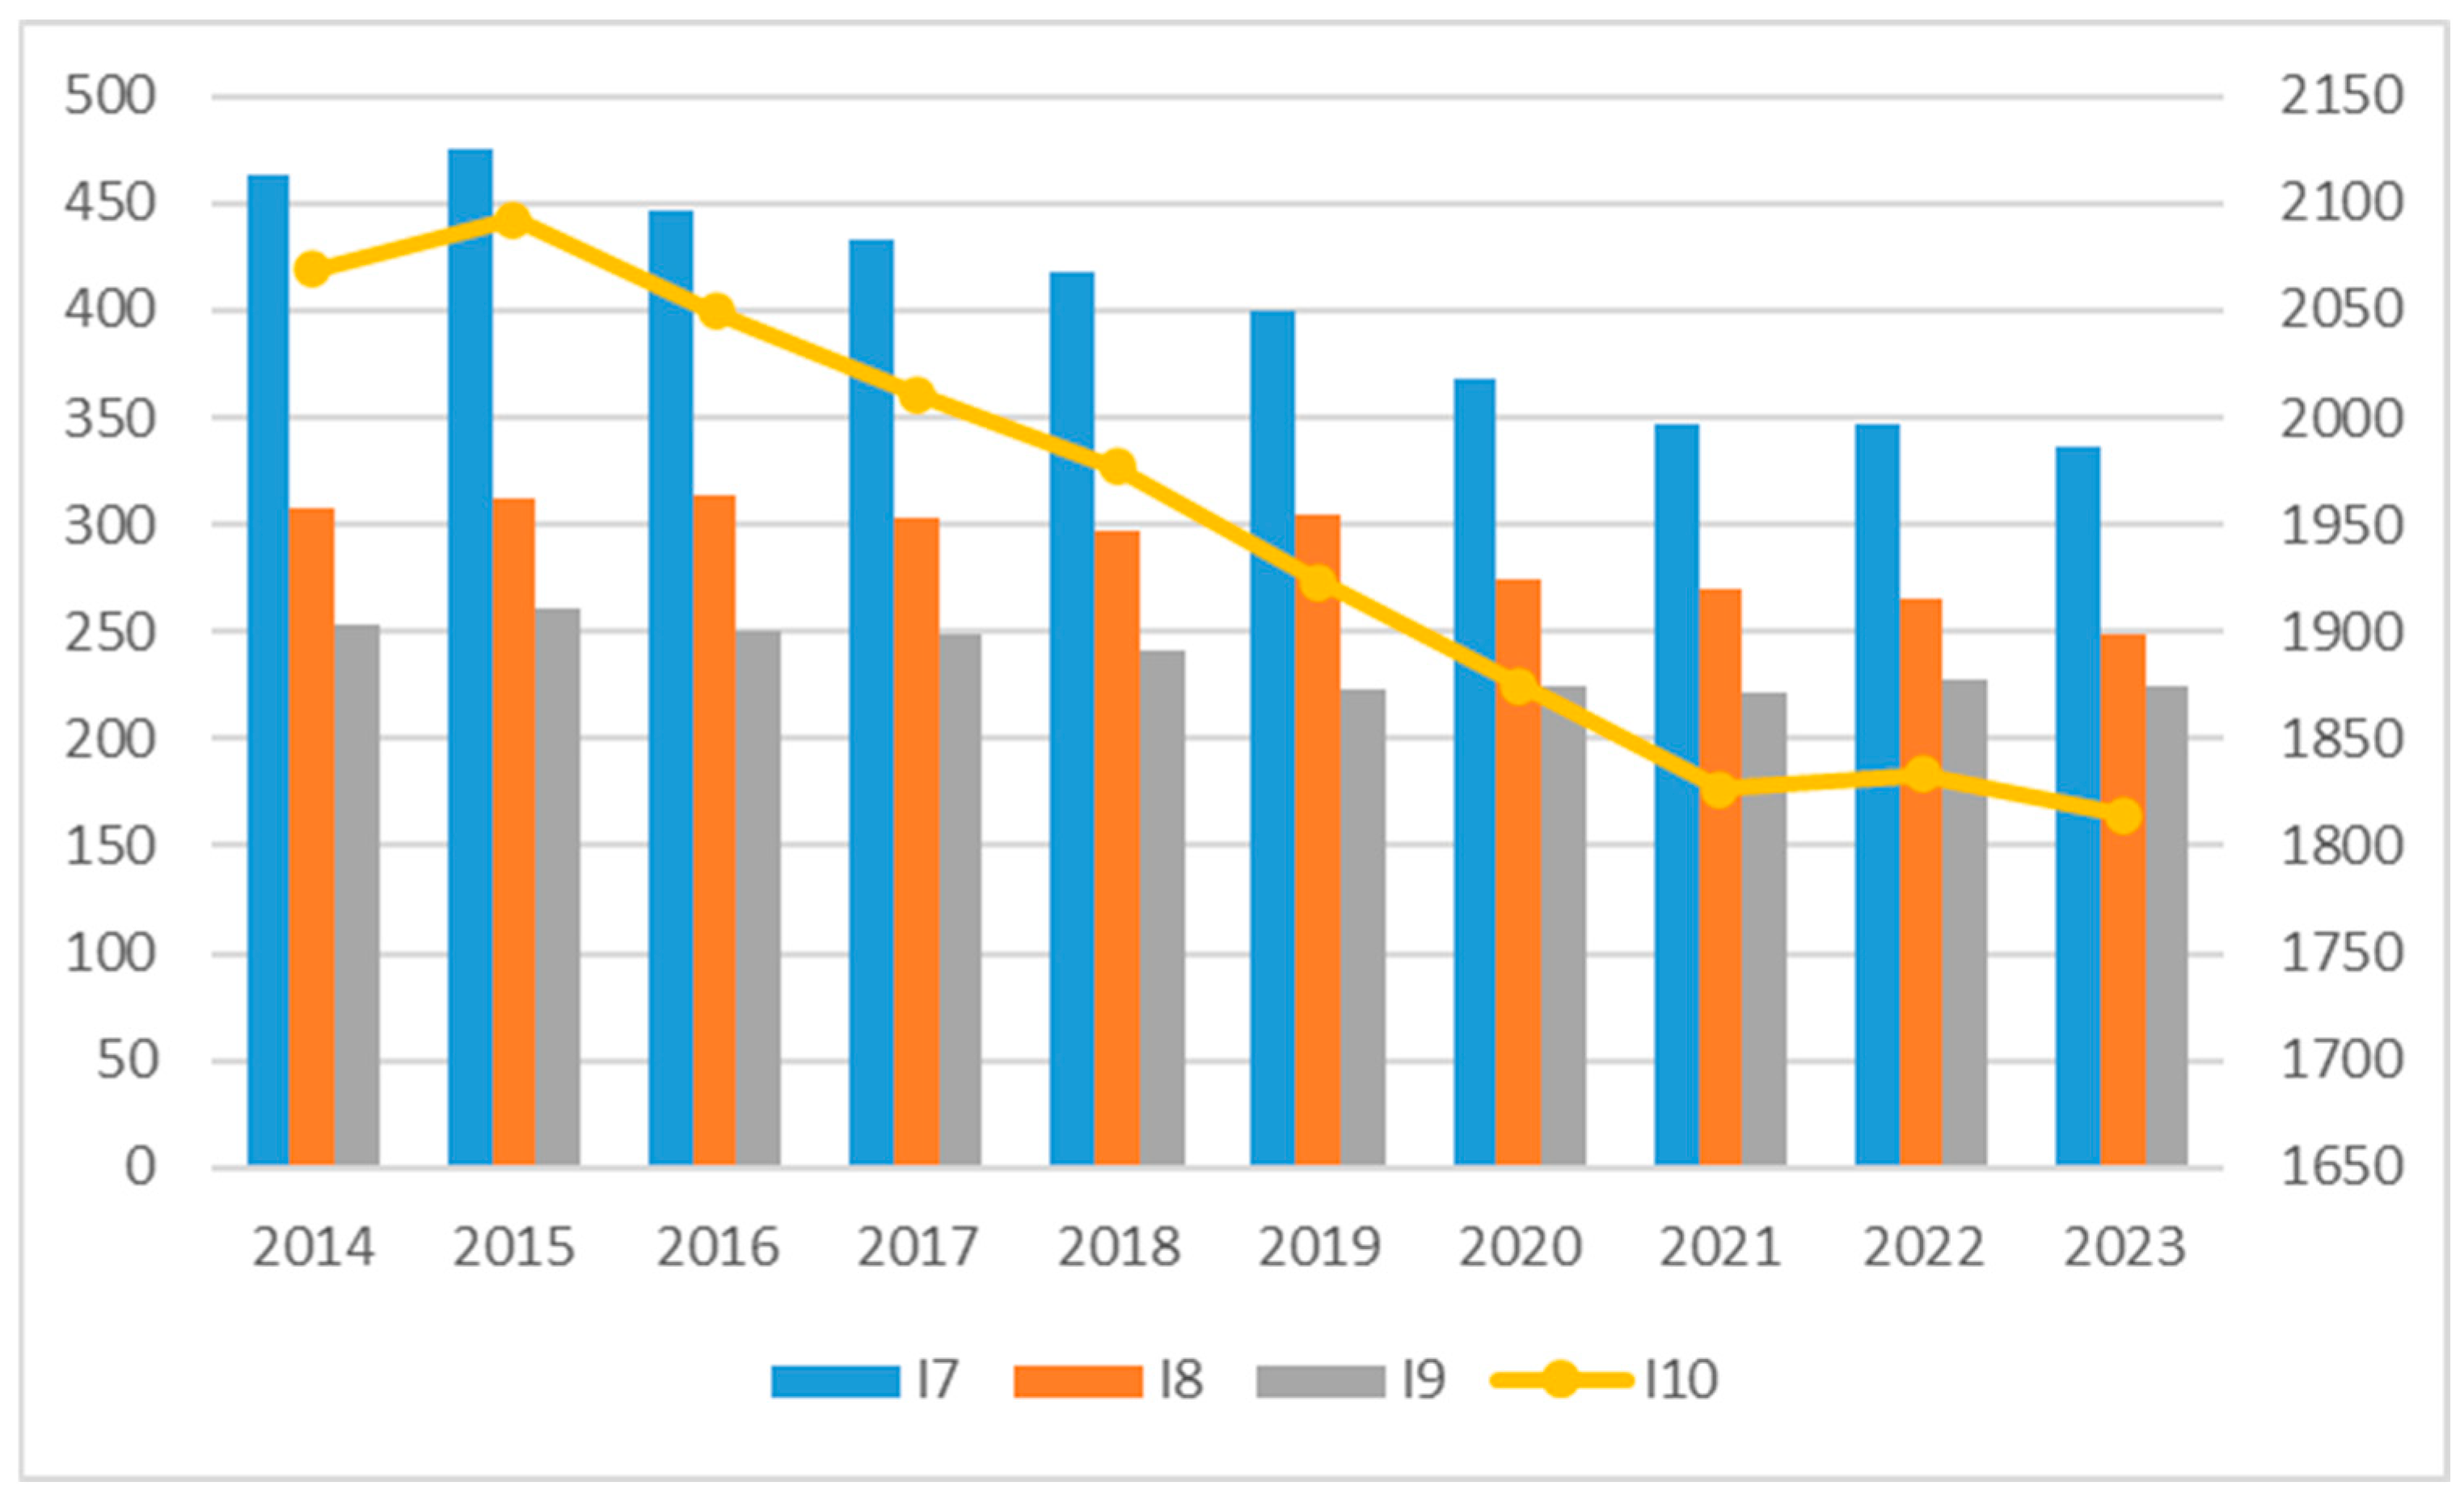
Upon meticulous scrutiny of the indices I7 (bovine population less than one year of age), I8 (bovine animals less than one year of age not designated for slaughter), I9 (bovine animals one to less than two years of age), and I10 (live bovine animals) for Romania, spanning the period from 2014 to 2023 (Table A2), it becomes evident that while a downward trend is evident in Figure 3, the prospects for dairy animals in the years ahead exhibit an upward trajectory in 2022 and 2023. Given the anticipated escalation in raw material costs, particularly milk, there is a concomitant expectation of a growth in the production of milk derivatives.
The increase in the indicators of processed milk products comes not only from the growth of the production capacity but also from the introduction of digitalization at the level of the existing producing companies. The solution that we propose to increase productivity at the company level is On Demand Open Object (ODOO) Enterprise Resources Planning (ERP).
In Romania, the National Tax Administration Agency (NTAA) has reported that there are 453 economic agents assigned to the code for milk and dairy product manufacturers. Seven of these agents are large companies with over 250 employees, while the rest are small- and medium-sized companies [55].
An ERP solution is characterized by the integration of multiple modules that together facilitate the effective management of a company’s entire operational activity. In the following presentation, we will offer a comprehensive overview of the Manufacturing Module from the ODOO product. This module was selected for its comprehensive coverage of the core activity (production) of manufacturing companies in the dairy industry. It should be noted that companies have the option to adopt the program in its entirety or only a portion of it, with the management of other functions being conducted by third-party entities.
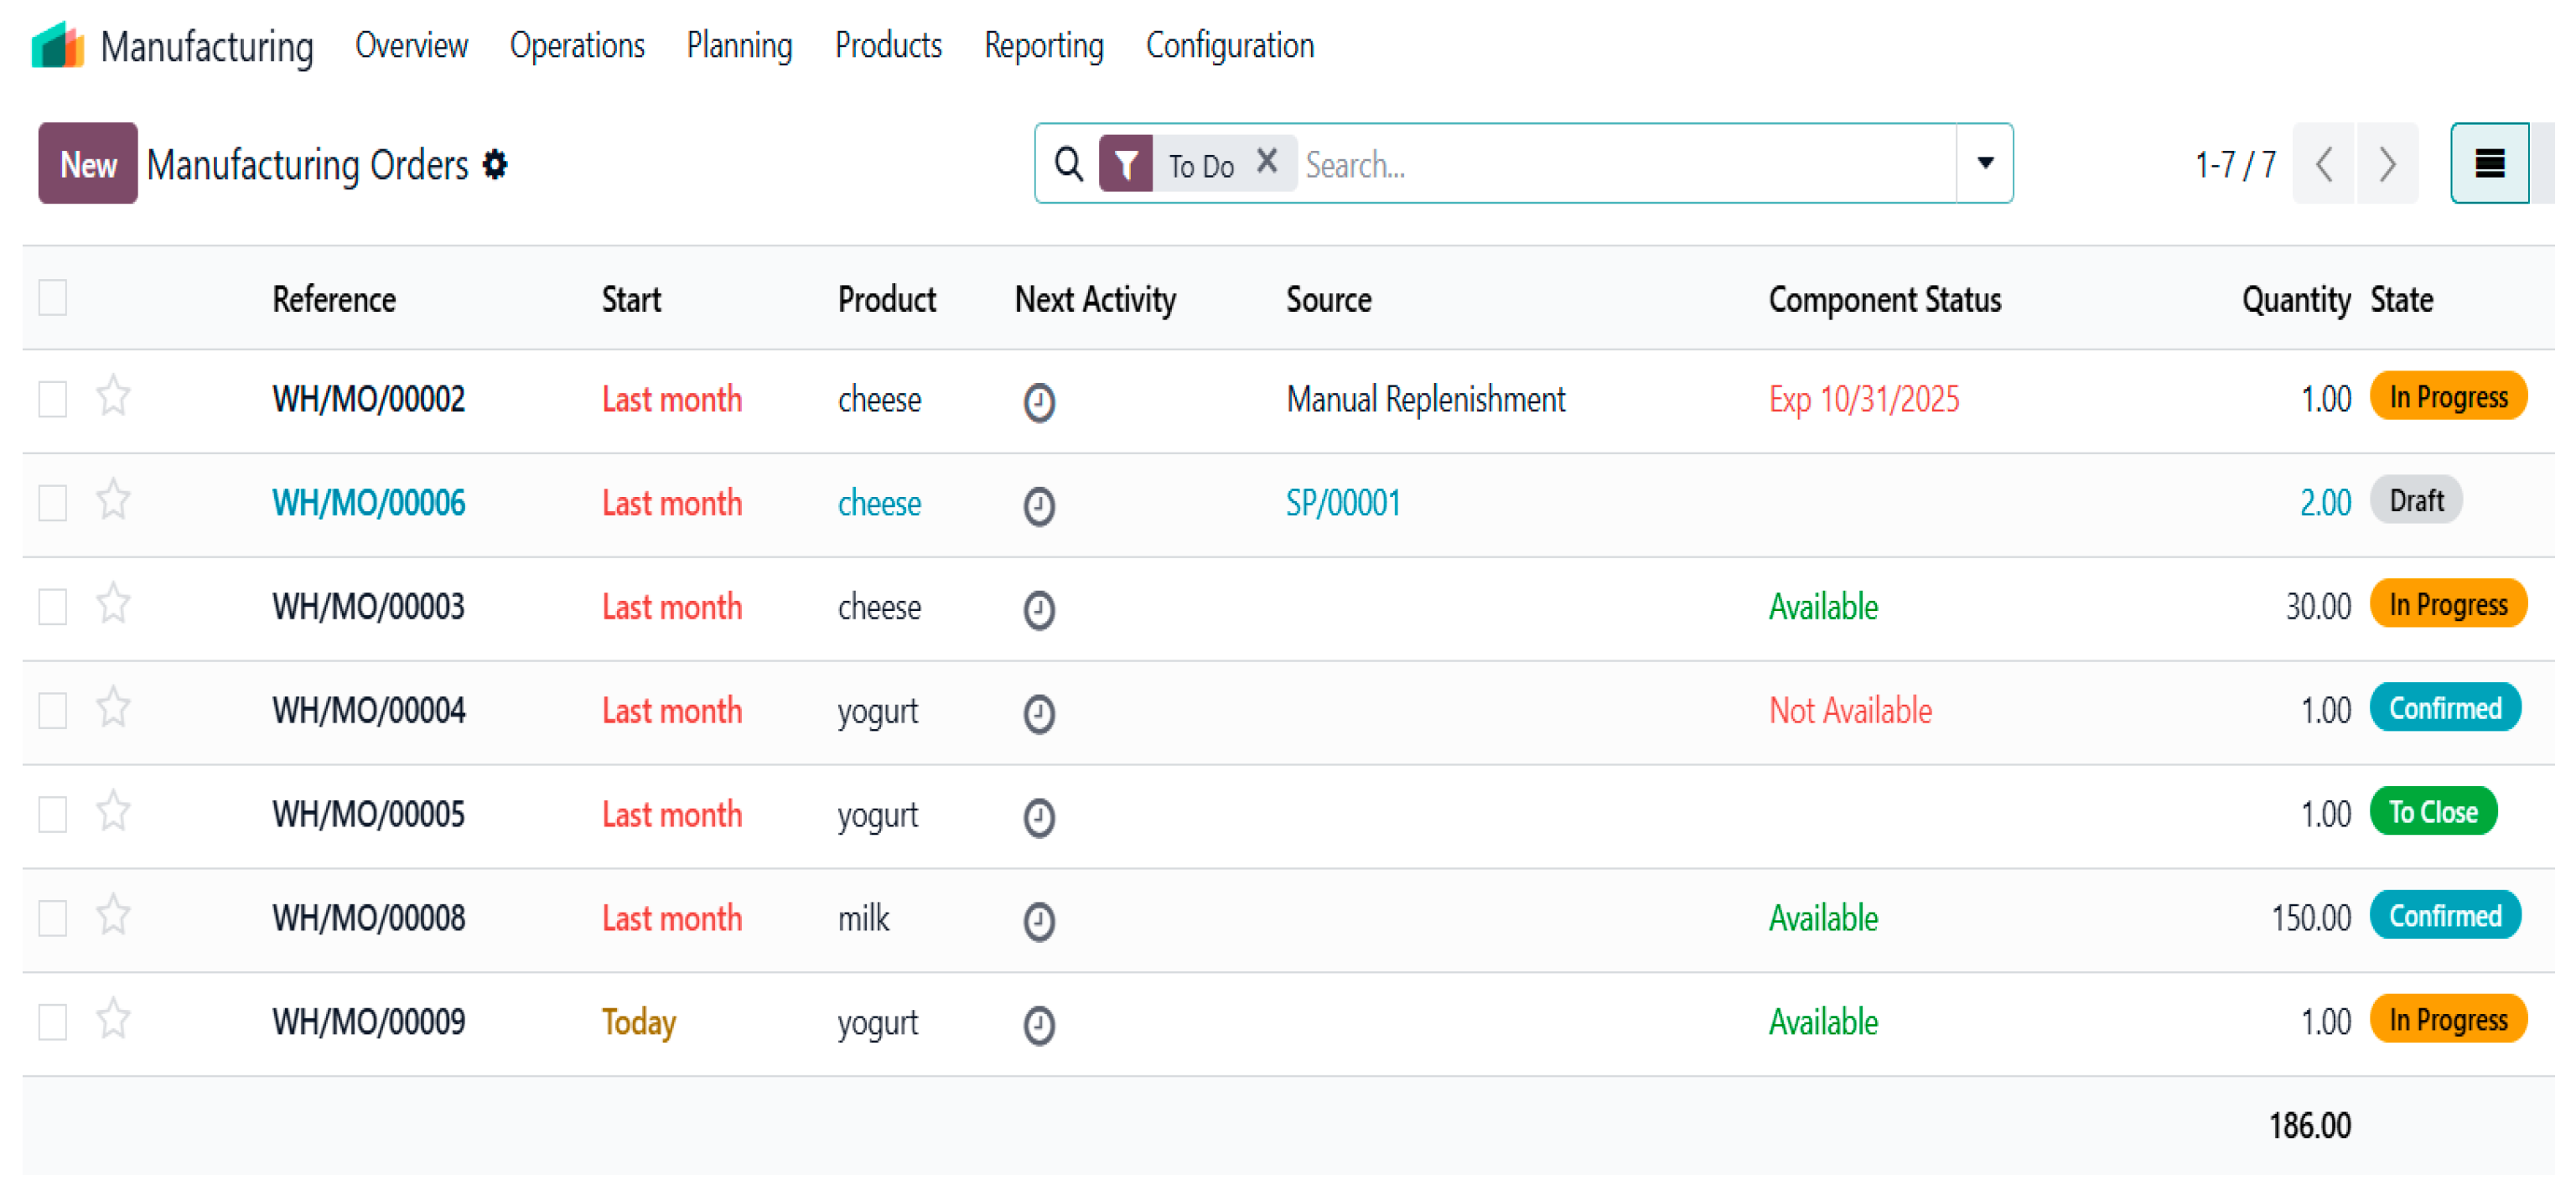
The Manufacturing Module has been developed for the purpose of overseeing production processes, planning resources, tracking inventories of raw materials, and managing factory operations. Its functionality encompasses the ability to create and manage production orders (Figure 4), thereby converting raw materials into finished products. It further enables the definition of manufacturing recipes, which specify the necessary materials and quantities requisite to produce a given product. In addition, production planning is facilitated through the utilization of tools such as the Gantt planner or Kanban board. The system also permits the management of work centers by defining production times, efficiency metrics, costs, and maintenance requirements. The present module facilitates integration with other pertinent modules, including but not limited to the Inventory, Sales, and Purchasing Modules. This integration enables the automation of the supply chain, with users having the capability to monitor the traceability of products by utilizing batches, serial numbers, quality, and preventive maintenance.
Integration of this module with other systems within a corporate environment has been demonstrated to markedly facilitate work processes and achieve the goal of fully automated production. Consequently, the inventory management system automatically deducts the requisite quantity of raw materials from the inventory and adds the finished products. Sales orders are automatically converted into production orders upon receipt from customers. In the absence of raw materials, purchases initiate supply orders. Accounting is responsible for calculating production costs and maintaining records in the company’s accounts.
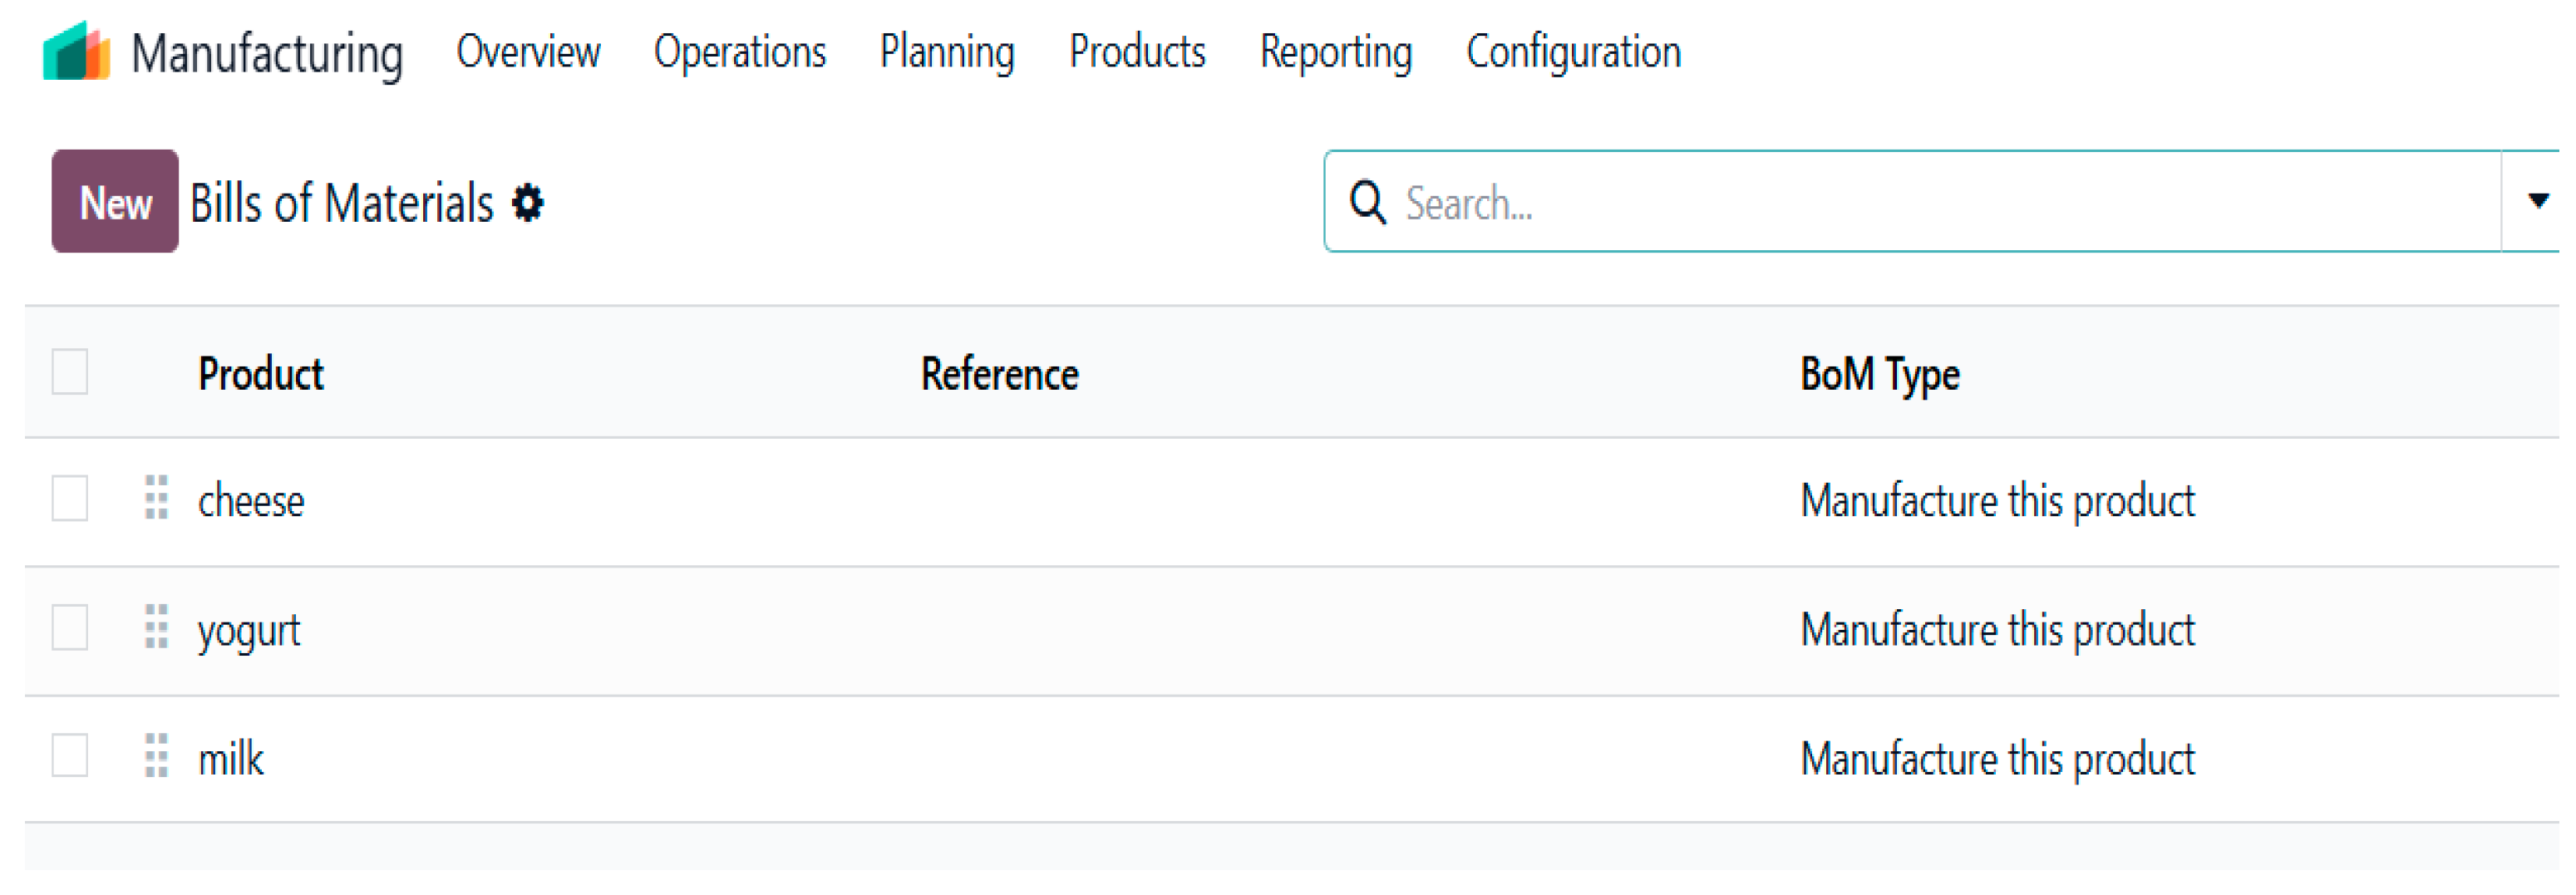
The following elements have been identified as integral to the production process for the given product: product definition (Figure 5), creation of the Bill of Materials (Figure 6), definition of raw materials and operations, creation of the Manufacturing Order, launch and execution of Work Orders, and execution of final production and quality control.
Building on digitization at the farm level, improvements throughout the supply chain are equally important for the efficiency of dairy production. Due to the perishable nature of dairy products, supply networks must be appropriately modified to minimize waste and maintain quality [56]. While optimization techniques streamline logistics, lowering costs and environmental impacts [57], modern approaches, like system dynamics modeling, are increasingly being used to analyze the entire dairy chain, helping to identify opportunities for improvements [58,59,60].
Likewise, by facilitating real-time monitoring and data exchange, information and communication technologies (ICTs) contribute significantly to supply chain traceability [61]. The increasing popularity of thermal and non-thermal IoT sensors that can monitor milk temperatures while in transit and guarantee that safety and quality standards are upheld is highlighted by bibliometric analyses [62]. While the broad adoption of these technologies might be restricted by several issues associated with logistics, successful implementation requires efforts across all supply chain stages to fully realize a more efficient, transparent, and sustainable dairy business [63].
Notwithstanding the vast potential of digital technologies in dairy farming, system complexity, high capital costs, and a lack of confidence in digital solutions remain major barriers to their widespread implementation [64]. Two of the most important factors are a continuing skills gap and high initial investment costs [65]. Smaller farms frequently lack the technical know-how and financial means necessary to deploy and maintain advanced digital systems [66].
Simultaneously, the necessity for farmers to learn new skills and adjust to information settings that are becoming more complicated is an imperative. According to German studies, digital farming systems need dairy farmers to acquire new occupational skills and engage in ongoing education, especially in the areas of data management and interpretation [67]. As such, digital transformation strategies must be tailored to reflect the heterogeneous structure of the industry, ensuring that adoption pathways are accessible to diverse categories of farmers.
Finally, digital transformation of the dairy sector is reshaping its ethical dimensions. Emerging debates around the agency of cows stress that technological interventions are not neutral, but instead actively shape human–animal relationships and the lived experiences of livestock [68]. Advances in genomic selection are also at the heart of debate, considering moral implications in forced breeding of high-yielding and resilient cattle [69]. For Romanian dairy farming, where traditional practices and close farmer–animal bonds are still culturally significant, this raises important questions about how digital tools might alter established social norms and ethical values.
Regardless of these challenges, the transition toward a more sustainable dairy sector remains a visible trend for the future of food production [70]. Sustainability in dairy farming encompasses environmental, economic, and social dimensions, requiring evaluation beyond simple production metrics [71,72]. Economic viability, often measured through indicators such as profitability and return on investment, is a critical component of sustainable dairy operations [73]. However, comparisons across farms and regions are complicated by the lack of standardized data and inconsistent measurement approaches [74]. To address these issues, decision support tools are increasingly aiding farmers in managing sustainability trade-offs, with productivity improvements serving as a key lever—particularly in low-income contexts—by boosting economic returns while reducing the environmental footprint per unit of milk [75]. These systems, known as ERP software, centralize business processes ranging from production planning and inventory control to financial management and sales [76].
Within the dairy industry, ERP platforms help by coordinating supply chain operations, enhancing product traceability, and reducing operational inefficiencies [77]. When integrated with data streams from smart devices, these systems can also contribute to minimizing waste and by-products, while ensuring the quality and safety of dairy products [78]. Adoption of ERP solutions in Romania might still be in its early stages, but the potential of such solutions remains considerable. Bridging the gap between fragmented small- and medium-scale producers, processors, and distributors could support compliance with EU market requirements and ultimately reinforce the competitiveness of Romanian dairy products on both domestic and international markets.

6. Conclusions

The objectives of this research paper were threefold: first, to classify European Union countries in terms of key indicators in the milk and milk products industry; second, to identify Romania’s position; and third, to propose the widespread adoption of digitization as a singular business solution. The objectives of the present research endeavor were successfully achieved in their totality, as evidenced by the positive responses to both research inquiries. Consequently, with respect to RQ1, Romania is classified among those exhibiting the most deficient performance indicators in relation to the dairy industry. In order to enhance the indicator levels and, implicitly, transition to a higher group, the authors’ proposal for Romania is to adopt digitization on a broad scale in this industry. Consequently, the response to RQ2 is affirmative.
Despite the comprehensive responses provided to the proposed objectives and research inquiries, it is acknowledged by the authors of the present study that certain limitations persist. The first limitation pertains to the year of study, specifically the year 2023. It is advised that subsequent analyses compare the findings with those from 2024 and 2025 as additional data become available. The second limitation pertains to the selection of indicators, which were chosen based on the available data at the time and subjectively by the authors, with the exclusion of only those deemed irrelevant. It is recommended that the study be expanded in its scope to include all indicators existing within the milk market.
In terms of future research, the authors propose the utilization of artificial intelligence in the dairy industry with the objective of fully automating existing processes. In addition, the findings from quantitative research indicate that alternative algorithms should be employed to minimize classification error.

Author Contributions

Conceptualization, C.C., A.M.M.I. and I.C.C.; methodology, C.C., A.M.M.I. and I.C.C.; software, C.C., A.M.M.I. and I.C.C.; validation, C.C., A.M.M.I. and I.C.C.; formal analysis, C.C., A.M.M.I. and I.C.C.; investigation, C.C., A.M.M.I. and I.C.C.; resources, C.C., A.M.M.I. and I.C.C.; data curation, C.C., A.M.M.I. and I.C.C.; writing—original draft preparation, C.C., A.M.M.I. and I.C.C.; writing—review and editing, C.C., A.M.M.I. and I.C.C.; visualization, C.C., A.M.M.I. and I.C.C.; supervision, C.C., A.M.M.I. and I.C.C.; project administration, C.C., A.M.M.I. and I.C.C.; funding acquisition, C.C., A.M.M.I. and I.C.C. All authors have read and agreed to the published version of the manuscript.

Funding

This research received no external funding.

Data Availability Statement

The original contributions presented in this study are included in the article. Further inquiries can be directed to the corresponding author(s).

Conflicts of Interest

The authors declare no conflicts of interest.

Appendix A

Table A1. The indicators used in the application (source: [1]).
CountryI1I2I3I4I5I6I7I8I9I10
Belgium3.222.8110.524.155.681.283.053.052.93.03
Bulgaria0.480.290.112.10.050.920.480.50.450.78
Czechia2.233.072.42.351.161.71.832.4221.86
Denmark3.931.91.531.634.545.172.221.511.841.95
Germany22.3917.7219.9922.0622.7625.5114.4618.0816.9714.7
Estonia0.590.461.080.470.220.540.30.380.310.33
Ireland6.022.251.21012.942.968.8511.5111.918.85
Greece0.431.590.592.340.110.290.60.360.980.84
Spain5.0620.18.7214.290.941.9210.473.785.58.54
France16.1811.7621.5317.4919.1217.8421.4425.1519.8222.79
Croatia0.260.911.221.160.180.340.650.750.760.56
Italy8.6811.035.793.694.6712.537.074.210.018.14
Cyprus0.210.230.160.1000.110.090.090.11
Latvia0.570.150.880.470.150.590.450.310.390.5
Lithuania0.930.280.560.950.661.010.740.640.860.85
Hungary1.142.290.471.40.40.881.170.970.991.18
Austria2.243.112.773.441.592.362.593.182.812.49
Poland8.998.4410.037.8112.5310.418.3510.4510.018.5
Portugal1.312.940.991.631.490.652.22.431.372.07
Romania0.831.582.542.640.520.981.511.481.482.46
Slovenia0.390.630.390.650.110.160.650.780.830.62
Slovakia0.561.061.320.650.430.390.540.60.560.58
Finland1.522.342.612.062.740.881.231.611.31.08
Sweden1.953.042.562.911.060.832.032.582.191.86
Table A2. The indicators I7 (bovine population less than one year of age), I8 (bovine animals less than one year of age not designated for slaughter), I9 (bovine animals one to less than two years of age), and I10 (live bovine animals) for Romania, spanning the period from 2014 to 2023 (source: [1]).
Indicator2014201520162017201820192020202120222023
I7462.8474.7446.9432.4417.8400.3368.8347.3346.9336.2
I8308.4312.9313.2303.9297.2304.8274.4270.5266.1248.9
I9253.7261.2250.6248.4241223.4225.3221.5227.6224.5
I102068.92092.42049.72011.11977.21923.31875.21826.81833.71814.7

References

  1. European Commission. EU Agriculture: Milk and Dairy Products. 2024. Available online: https://agriculture.ec.europa.eu/farming/animal-products/milk-and-dairy-products_en (accessed on 1 August 2025).
  2. USDA ERS. Dairy Data. 2023. Available online: https://www.ers.usda.gov/data-products/dairy-data/ (accessed on 1 August 2025).
  3. World Without Cows. Cows, Culture, Climate and Consumption—The Story of Milk Today. 2023. Available online: https://worldwithoutcows.com/cows-culture-climate-and-consumption-the-story-of-milk-today/ (accessed on 1 August 2025).
  4. Čechura, L.; Žáková Kroupová, Z.; Benešová, I. Productivity and Efficiency in European Milk Production: Can We Observe the Effects of Abolishing Milk Quotas? Agriculture 2021, 11, 835. [Google Scholar] [CrossRef]
  5. Poczta, W.; Średzińska, J.; Chenczke, M. Economic Situation of Dairy Farms in Identified Clusters of European Union Countries. Agriculture 2020, 10, 92. [Google Scholar] [CrossRef]
  6. Eurostat. Milk and Milk Product Statistics. 2024. Available online: https://ec.europa.eu/eurostat/statistics-explained/index.php?title=Milk_and_milk_product_statistics (accessed on 1 August 2025).
  7. Ilie, D.M.; Lădaru, G.-R.; Diaconeasa, M.C.; Stoian, M. Consumer Choice for Milk and Dairy in Romania: Does Income Really Have an Influence? Sustainability 2021, 13, 12204. [Google Scholar] [CrossRef]
  8. Neacşu, N.A.; Madar, A. Approaching Sustainable Development Practices and Quality Strategies in the Romanian Dairy Industry. Proc. Int. Conf. Bus. Excell. 2021, 15, 630–638. [Google Scholar] [CrossRef]
  9. Kryszak, Ł.; Guth, M.; Czyżewski, B. Determinants of Farm Profitability in the EU Regions. Does Farm Size Matter? Agric. Econ.-Czech 2021, 67, 90–100. [Google Scholar] [CrossRef]
  10. Bórawski, P.; Pawlewicz, A.; Parzonko, A.; Harper, J.K.; Holden, L. Factors Shaping Cow’s Milk Production in the EU. Sustainability 2020, 12, 420. [Google Scholar] [CrossRef]
  11. Parzonko, A.; Parzonko, A.J.; Bórawski, P. Economic Competitiveness of Dairy Farms from the Top Milk-Producing Countries in the EU: Assessment in 2014–2021. Agriculture 2024, 14, 123. [Google Scholar] [CrossRef]
  12. Parzonko, A.; Parzonko, A.J.; Bórawski, P.; Wicki, L. Return on Equity in Dairy Farms from Selected EU Countries: Assessment Based on the DuPont Model in Years 2004–2020. Agriculture 2023, 13, 1403. [Google Scholar] [CrossRef]
  13. Žáková Kroupová, Z.; Hálová, P.; Rumánková, L. Productivity of Czech Milk Production in European Comparison. AGRIS Line Pap. Econ. Inform. 2020, 12, 115–127. [Google Scholar] [CrossRef]
  14. Syrůček, J.; Bartoň, L.; Řehák, D.; Štolcová, M.; Burdych, J. Recent Development of Economic Indicators on Czech Dairy Farms. Agric. Econ. 2023, 69, 45–54. [Google Scholar] [CrossRef]
  15. Očić, V.; Šakić Bobić, B.; Grgić, Z. Economic Analysis of Specialized Dairy Farms in Croatia According to FADN. Mljekarstvo 2023, 73, 50–58. [Google Scholar] [CrossRef]
  16. Mihajlovic, M.; Dašić, T.; Mihić, S. Economic Analysis of the Possibilities for Business Processes Improvement in Serbian Dairy Industry. Ekon. Poljopr. 2025, 72, 33–44. [Google Scholar] [CrossRef]
  17. Timlin, M.; Tobin, J.T.; Brodkorb, A.; Murphy, E.G.; Dillon, P.; Hennessy, D.; O’Donovan, M.; Pierce, K.M.; O’Callaghan, T.F. The Impact of Seasonality in Pasture-Based Production Systems on Milk Composition and Functionality. Foods 2021, 10, 607. [Google Scholar] [CrossRef]
  18. Tedde, A.; Grelet, C.; Ho, P.N.; Pryce, J.E.; Hailemariam, D.; Wang, Z.; Plastow, G.; Gengler, N.; Froidmont, E.; Dehareng, F.; et al. Multiple Country Approach to Improve the Test-Day Prediction of Dairy Cows’ Dry Matter Intake. Animals 2021, 11, 1316. [Google Scholar] [CrossRef]
  19. Leliveld, L.M.C.; Provolo, G. A Review of Welfare Indicators of Indoor-Housed Dairy Cow as a Basis for Integrated Automatic Welfare Assessment Systems. Animals 2020, 10, 1430. [Google Scholar] [CrossRef]
  20. Nguyen, Q.T.; Fouchereau, R.; Frénod, E.; Gerard, C.; Sincholle, V. Comparison of Forecast Models of Production of Dairy Cows Combining Animal and Diet Parameters. Comput. Electron. Agric. 2020, 170, 105258. [Google Scholar] [CrossRef]
  21. Mor, R.S.; Bhardwaj, A.; Singh, S.; Khan, S.A.R. Modelling the Distribution Performance in Dairy Industry: A Predictive Analysis. LogForum 2021, 17, 3. [Google Scholar] [CrossRef]
  22. Shine, P.; Murphy, M.D. Over 20 Years of Machine Learning Applications on Dairy Farms: A Comprehensive Mapping Study. Sensors 2022, 22, 52. [Google Scholar] [CrossRef] [PubMed]
  23. Slob, N.; Catal, C.; Kassahun, A. Application of Machine Learning to Improve Dairy Farm Management: A Systematic Literature Review. Prev. Vet. Med. 2021, 187, 105237. [Google Scholar] [CrossRef]
  24. Neethirajan, S. The Role of Sensors, Big Data and Machine Learning in Modern Animal Farming. Sens. Bio-Sens. Res. 2020, 29, 100367. [Google Scholar] [CrossRef]
  25. Cockburn, M. Review: Application and Prospective Discussion of Machine Learning for the Management of Dairy Farms. Animals 2020, 10, 1690. [Google Scholar] [CrossRef]
  26. Riaboff, L.; Poggi, S.; Madouasse, A.; Couvreur, S.; Aubin, S.; Bédère, N.; Goumand, E.; Chauvin, A.; Plantier, G. Development of a Methodological Framework for a Robust Prediction of the Main Behaviours of Dairy Cows Using a Combination of Machine Learning Algorithms on Accelerometer Data. Comput. Electron. Agric. 2020, 169, 105179. [Google Scholar] [CrossRef]
  27. Bovo, M.; Agrusti, M.; Benni, S.; Torreggiani, D.; Tassinari, P. Random Forest Modelling of Milk Yield of Dairy Cows under Heat Stress Conditions. Animals 2021, 11, 1305. [Google Scholar] [CrossRef]
  28. Ji, B.; Banhazi, T.; Phillips, C.J.; Wang, C.; Li, B. A Machine Learning Framework to Predict the Next Month’s Daily Milk Yield, Milk Composition and Milking Frequency for Cows in a Robotic Dairy Farm. Biosyst. Eng. 2022, 216, 186–197. [Google Scholar] [CrossRef]
  29. Grzesiak, W.; Zaborski, D.; Szatkowska, I.; Królaczyk, K. Lactation Milk Yield Prediction in Primiparous Cows on a Farm Using the Seasonal Auto-Regressive Integrated Moving Average Model, Nonlinear Autoregressive Exogenous Artificial Neural Networks and Wood’s Model. Anim. Biosci. 2020, 34, 770. [Google Scholar] [CrossRef]
  30. Keceli, A.S.; Catal, C.; Kaya, A.; Tekinerdogan, B. Development of a Recurrent Neural Networks-Based Calving Prediction Model Using Activity and Behavioral Data. Comput. Electron. Agric. 2020, 170, 105285. [Google Scholar] [CrossRef]
  31. Chen, Z.; Cheng, X.; Wang, X.; Han, M. Recognition Method of Dairy Cow Feeding Behavior Based on Convolutional Neural Network. In Proceedings of the 2020 3rd International Conference on Computer Information Science and Artificial Intelligence (CISAI 2020), Hulunbuir, China, 25–27 September 2020; Journal of Physics: Conference Series. IOP Publishing: Bristol, UK, 2020; Volume 1693, p. 012166. [Google Scholar] [CrossRef]
  32. Liu, Y.; Ma, X.; Shu, L.; Hancke, G.P.; Abu-Mahfouz, A.M. From Industry 4.0 to Agriculture 4.0: Current Status, Enabling Technologies, and Research Challenges. IEEE Trans. Ind. Inform. 2021, 17, 4322–4334. [Google Scholar] [CrossRef]
  33. Dayıoğlu, M.A.; Turker, U. Digital Transformation for Sustainable Future-Agriculture 4.0: A Review. J. Agric. Sci. 2021, 27, 373–399. [Google Scholar] [CrossRef]
  34. Bigliardi, B.; Bottani, E.; Casella, G.; Filippelli, S.; Petroni, A.; Pini, B.; Gianatti, E. Industry 4.0 in the Agrifood Supply Chain: A Review. Procedia Comput. Sci. 2023, 217, 1755–1764. [Google Scholar] [CrossRef]
  35. Bai, C.; Dallasega, P.; Orzes, G.; Sarkis, J. Industry 4.0 Technologies Assessment: A Sustainability Perspective. Int. J. Prod. Econ. 2020, 229, 107776. [Google Scholar] [CrossRef]
  36. Abbate, S.; Centobelli, P.; Cerchione, R. The Digital and Sustainable Transition of the Agri-Food Sector. Technol. Forecast. Soc. Change 2023, 187, 122222. [Google Scholar] [CrossRef]
  37. Cabrera, V.E.; Barrientos-Blanco, J.A.; Delgado, H.; Fadul-Pacheco, L. Symposium Review: Real-Time Continuous Decision Making Using Big Data on Dairy Farms. J. Dairy Sci. 2020, 103, 3856–3866. [Google Scholar] [CrossRef] [PubMed]
  38. Cabrera, V.E.; Fadul-Pacheco, L. Future of Dairy Farming from the Dairy Brain Perspective: Data Integration, Analytics, and Applications. Int. Dairy J. 2021, 121, 105069. [Google Scholar] [CrossRef]
  39. Ferris, M.C.; Christensen, A.; Wangen, S.R. Symposium Review: Dairy Brain—Informing Decisions on Dairy Farms Using Data Analytics. J. Dairy Sci. 2020, 103, 3874–3881. [Google Scholar] [CrossRef]
  40. Burke, N.; Zacharski, K.; Adley, C.C.; Southern, M. A Comparison of Analytical Test Methods in Dairy Processing. Food Control 2021, 121, 107637. [Google Scholar] [CrossRef]
  41. Fuentes, S.; Gonzalez Viejo, C.; Cullen, B.; Tongson, E.; Chauhan, S.S.; Dunshea, F.R. Artificial Intelligence Applied to a Robotic Dairy Farm to Model Milk Productivity and Quality based on Cow Data and Daily Environmental Parameters. Sensors 2020, 20, 2975. [Google Scholar] [CrossRef]
  42. Shahsavari-Pour, N.; Rahimi-Ashjerdi, S.; Heydari, A.; Fekih, A. A System Dynamics Approach to Optimize Milk Production in an Industrial Ranch. Appl. Sci. 2023, 13, 1662. [Google Scholar] [CrossRef]
  43. Kleen, J.L.; Guatteo, R. Precision Livestock Farming: What Does It Contain and What Are the Perspectives? Animals 2023, 13, 779. [Google Scholar] [CrossRef]
  44. Kaunkid, S.; Aurasopon, A.; Chantiratiku, A. Automatic Milk Quantity Recording System for Small-Scale Dairy Farms Based on Internet of Things. Agriculture 2022, 12, 1877. [Google Scholar] [CrossRef]
  45. Balaine, L.; Dillon, E.J.; Läpple, D.; Lynch, J. Can Technology Help Achieve Sustainable Intensification? Evidence from Milk Recording on Irish Dairy Farms. Land Use Policy 2020, 92, 104437. [Google Scholar] [CrossRef]
  46. Righi, R.R.; Goldschmidt, G.; Kunst, R.; Deon, C.; Costa, C.A.d. Towards Combining Data Prediction and Internet of Things to Manage Milk Production on Dairy Cows. Comput. Electron. Agric. 2020, 169, 105156. [Google Scholar] [CrossRef]
  47. Džermeikaitė, K.; Bačėninaitė, D.; Antanaitis, R. Innovations in Cattle Farming: Application of Innovative Technologies and Sensors in the Diagnosis of Diseases. Animals 2023, 13, 780. [Google Scholar] [CrossRef]
  48. Herlin, A.; Brunberg, E.; Hultgren, J.; Högberg, N.; Rydberg, A.; Skarin, A. Animal Welfare Implications of Digital Tools for Monitoring and Management of Cattle and Sheep on Pasture. Animals 2021, 11, 829. [Google Scholar] [CrossRef] [PubMed]
  49. Hofstra, G.; Roelofs, J.; Rutter, S.M.; van Erp-van der Kooij, E.; de Vlieg, J. Mapping Welfare: Location Determining Techniques and Their Potential for Managing Cattle Welfare—A Review. Dairy 2022, 3, 776–788. [Google Scholar] [CrossRef]
  50. Fielding, H.R.; Silk, M.J.; McKinley, T.J.; Delahay, R.J.; Wilson-Aggarwal, J.K.; Gauvin, L.; Ozella, L.; Cattuto, C.; McDonald, R.A. Spatial and Temporal Variation in Proximity Networks of Commercial Dairy Cattle in Great Britain. Prev. Vet. Med. 2021, 194, 105443. [Google Scholar] [CrossRef]
  51. Morrone, S.; Dimauro, C.; Gambella, F.; Cappai, M.G. Industry 4.0 and Precision Livestock Farming (PLF): An up to Date Overview across Animal Productions. Sensors 2022, 22, 4319. [Google Scholar] [CrossRef]
  52. Fuentes, S.; Gonzalez Viejo, C.; Tongson, E.; Dunshea, F.R. The Livestock Farming Digital Transformation: Implementation of New and Emerging Technologies Using Artificial Intelligence. Anim. Health Res. Rev. 2022, 23, 59–71. [Google Scholar] [CrossRef]
  53. Saraçli, S.; Doğan, N.; Doğan, İ. Comparison of hierarchical cluster analysis methods by cophenetic correlation. J. Inequal. Appl. 2013, 2013, 203. [Google Scholar] [CrossRef]
  54. Fu, L.; Hsu, H.-H.; Principe, J.C. Incremental backpropagation learning networks. IEEE Trans. Neural Netw. 1996, 7, 757–761. [Google Scholar] [CrossRef]
  55. National Tax Administration Agency. Available online: https://www.topfirme.com/caen/1051/numar-angajati/ (accessed on 10 December 2025).
  56. Jouzdani, J.; Govindan, K. On the Sustainable Perishable Food Supply Chain Network Design: A Dairy Products Case to Achieve Sustainable Development Goals. J. Clean. Prod. 2021, 278, 123060. [Google Scholar] [CrossRef]
  57. Malik, M.; Kumar, V.; Mor, R.; Dahiya, V.; Yadav, M. Application of Optimization Techniques in the Dairy Supply Chain: A Systematic Review. Logistics 2022, 6, 74. [Google Scholar] [CrossRef]
  58. Shamsuddoha, M.; Nasir, T.; Hossain, N.U.I. A Sustainable Supply Chain Framework for Dairy Farming Operations: A System Dynamics Approach. Sustainability 2023, 15, 8417. [Google Scholar] [CrossRef]
  59. Malik, M.; Gahlawat, V.K.; Mor, R.S.; Singh, M.K. Unlocking Dairy Traceability: Current Trends, Applications, and Future Opportunities. Future Foods 2024, 10, 100426. [Google Scholar] [CrossRef]
  60. Varavallo, G.; Caragnano, G.; Bertone, F.; Vernetti-Prot, L.; Terzo, O. Traceability Platform Based on Green Blockchain: An Application Case Study in Dairy Supply Chain. Sustainability 2022, 14, 3321. [Google Scholar] [CrossRef]
  61. Jachimczyk, B.; Tkaczyk, R.; Piotrowski, T.; Johansson, S.; Kulesza, W. IoT-Based Dairy Supply Chain-An Ontological Approach. Elektron. Elektrotechnika 2021, 27, 71–83. [Google Scholar] [CrossRef]
  62. Ribeiro, N.G.; Xavier-Santos, D.; Campelo, P.H.; Guimarães, J.T.; Pimentel, T.C.; Duarte, M.C.K.H.; Freitas, M.Q.; Esmerino, E.A.; Silva, M.C.; Cruz, A.G. Dairy Foods and Novel Thermal and Non-Thermal Processing: A Bibliometric Analysis. Innov. Food Sci. Emerg. Technol. 2022, 76, 102934. [Google Scholar] [CrossRef]
  63. Vernier, C.; Loeillet, D.; Thomopoulos, R.; Macombe, C. Adoption of ICTs in Agri-Food Logistics: Potential and Limitations for Supply Chain Sustainability. Sustainability 2021, 13, 6702. [Google Scholar] [CrossRef]
  64. Groher, T.; Heitkämper, K.; Umstätter, C. Digital Technology Adoption in Livestock Production with a Special Focus on Ruminant Farming. Animal 2020, 14, 2404–2413. [Google Scholar] [CrossRef]
  65. Zhai, Z.; Martínez, J.F.; Beltran, V.; Martínez, N.L. Decision Support Systems for Agriculture 4.0: Survey and Challenges. Comput. Electron. Agric. 2020, 170, 105256. [Google Scholar] [CrossRef]
  66. Lovarelli, D.; Bacenetti, J.; Guarino, M. A Review on Dairy Cattle Farming: Is Precision Livestock Farming the Compromise for an Environmental, Economic and Social Sustainable Production? J. Clean. Prod. 2020, 262, 121409. [Google Scholar] [CrossRef]
  67. Goller, M.; Caruso, C.; Harteis, C. Digitalisation in Agriculture: Knowledge and Learning Requirements of German Dairy Farmers. Int. J. Res. Vocat. Educ. Train. 2021, 8, 208–223. [Google Scholar] [CrossRef]
  68. Kramer, K.; Bovenkerk, B. Dairy Farming Technologies and the Agency of Cows. Animal 2024, 18, 101191. [Google Scholar] [CrossRef]
  69. Brito, L.F.; Bedere, N.; Douhard, F.; Oliveira, H.R.; Arnal, M.; Peñagaricano, F.; Schinckel, A.P.; Baes, C.F.; Miglior, F. Review: Genetic Selection of High-Yielding Dairy Cattle Toward Sustainable Farming Systems in a Rapidly Changing World. Animal 2021, 15, 100292. [Google Scholar] [CrossRef]
  70. Psarommatis, F.; Sousa, J.; Mendonça, J.P.; Kiritsis, D. Zero-Defect Manufacturing the Approach for Higher Manufacturing Sustainability in the Era of Industry 4.0: A Position Paper. Int. J. Prod. Res. 2021, 60, 73–91. [Google Scholar] [CrossRef]
  71. Díaz de Otálora, X.; del Prado, A.; Dragoni, F.; Estellés, F.; Amon, B. Evaluating Three-Pillar Sustainability Modelling Approaches for Dairy Cattle Production Systems. Sustainability 2021, 13, 6332. [Google Scholar] [CrossRef]
  72. Arulnathan, V.; Heidari, M.D.; Doyon, M.; Li, E.; Pelletier, N. Farm-Level Decision Support Tools: A Review of Methodological Choices and Their Consistency with Principles of Sustainability Assessment. J. Clean. Prod. 2020, 256, 120410. [Google Scholar] [CrossRef]
  73. Fiorillo, V.; Amico, B.M. Milk Quality and Economic Sustainability in Dairy Farming: A Systematic Review of Performance Indicators. Dairy 2024, 5, 384–402. [Google Scholar] [CrossRef]
  74. Robling, H.; Abu Hatab, A.; Säll, S.; Hansson, H. Measuring Sustainability at Farm Level–A Critical View on Data and Indicators. Environ. Sustain. Indic. 2023, 18, 100258. [Google Scholar] [CrossRef]
  75. Tricarico, J.M.; Kebreab, E.; Wattiaux, M.A. MILK Symposium Review: Sustainability of Dairy Production and Consumption in Low-Income Countries with Emphasis on Productivity and Environmental Impact. J. Dairy Sci. 2020, 103, 9791–9802. [Google Scholar] [CrossRef]
  76. Hassoun, A.; Garcia-Garcia, G.; Trollman, H.; Jagtap, S.; Parra-López, C.; Cropotova, J.; Bhat, Z.; Centobelli, P.; Aït-Kaddour, A. Birth of Dairy 4.0: Opportunities and Challenges in Adoption of Fourth Industrial Revolution Technologies in the Production of Milk and Its Derivatives. Curr. Res. Food Sci. 2023, 7, 100535. [Google Scholar] [CrossRef]
  77. Konstantinidis, F.K.; Balaska, V.; Symeonidis, S.; Tsilis, D.; Mouroutsos, S.G.; Bampis, L.; Psomoulis, A.; Gasteratos, A. Automating Dairy Production Lines with the Yoghurt Cups Recognition and Detection Process in the Industry 4.0 Era. Procedia Comput. Sci. 2023, 217, 918–927. [Google Scholar] [CrossRef]
  78. Hassoun, A.; Tarchi, I.; Aït-Kaddour, A. Leveraging the Potential of Fourth Industrial Revolution Technologies to Reduce and Valorize Waste and By-Products in the Dairy Sector. Curr. Opin. Green Sustain. Chem. 2024, 47, 100927. [Google Scholar] [CrossRef]
Figure 1. The resulting dendrogram from the cluster analysis showing the classes of countries. Source: Output from SAS Enterprise Guide.
Processes 14 00109 g001
Figure 2. The training error graph of the classification neural network. Source: Output from SAS Enterprise Miner.
Processes 14 00109 g002
Figure 3. The evolution of I7–I10 indicators (thousand heads—animals) between 2014 and 2023 in Romania. Source: Authors’ own elaboration using Microsoft Excel 365. Data source: [1].
Processes 14 00109 g003
Figure 4. The manufacturing orders. Source: Manufacturing Module, ODOO ERP.
Processes 14 00109 g004
Figure 5. The definition of the products. Source: Manufacturing Module, ODOO ERP.
Processes 14 00109 g005
Figure 6. Bills of Materials. Source: Manufacturing Module, ODOO ERP.
Processes 14 00109 g006
Table 1. The indicators used in the research. Source: Authors’ own elaboration.
IndicatorDescription
I1Raw cows’ milk delivered to dairies
I2Drinking milk
I3Cream for direct consumption
I4Acidified milk (yoghurts and other)
I5Butter, incl. dehydrated butter and ghee, and other fats and oils derived from milk; dairy spreads
I6Cheese from cows’ milk (pure)
I7Bovine population less than 1 year old
I8Bovine animals, less than 1 year old, not for slaughter
I9Bovine animals, 1 to less than 2 years old
I10Live bovine animals
Table 2. Description statistics for the variables used in analysis. Source: Output from SAS Enterprise Guide.
VariableMeanStandard DeviationSkewnessKurtosisBimodality
I13.7555.4812.3825.7660.725
I24.1665.5361.9292.9240.742
I34.1655.9412.0853.7590.743
I44.0185.7442.2624.4310.778
I53.9196.3622.0143.2450.757
I63.7566.4322.4195.5610.762
I73.8755.3452.0854.3220.689
Table 3. Eigenvalues of the covariance matrix of the variables used in research. Source: Output from SAS Enterprise Guide.
EigenvalueDifferenceProportionCumulative
1208.565191.6100.8710.871
216.95410.6990.0710.942
36.2551.7140.0260.968
44.5412.7090.0190.987
51.8330.6690.0080.995
61.1641.0830.0050.999
70.081 0.0011.000
Table 4. The aggregated indicators (Min—minimum; Avg—average; and Max—maximum) for each class, year 2023. Min, Max, and Avg have the same unit measures as the indicators (percentages). Source: Authors’ own elaboration using Microsoft Excel 365.
I1I2I3I4I5I6I7I8I9I10
Min5.0611.768.7214.290.941.9210.473.785.58.54
Class 1Avg14.5416.5316.7517.9514.2715.0915.4615.6714.115.34
Max22.3920.121.5322.0622.7625.5121.4425.1519.8222.79
Min1.952.251.2101.060.832.032.582.191.86
Class 2Avg4.424.454.572.845.193.994.724.95.964.87
Max8.6811.0310.524.1512.9412.538.8511.5111.918.85
Min0.210.150.110.1000.110.090.090.11
Class 3Avg1.521.761.681.781.581.561.441.581.511.52
Max8.998.4410.037.8112.5310.418.3510.4510.018.5
Disclaimer/Publisher’s Note: The statements, opinions and data contained in all publications are solely those of the individual author(s) and contributor(s) and not of MDPI and/or the editor(s). MDPI and/or the editor(s) disclaim responsibility for any injury to people or property resulting from any ideas, methods, instructions or products referred to in the content.