Article

Enhancing the Reliability and Durability of Micro-Sensors Using the Taguchi Method

Department of Mechanical Engineering, Yuan Ze Fuel Cell Center, Yuan Ze University, Taoyuan 32003, Taiwan
*
Author to whom correspondence should be addressed.
Processes 2025, 13(9), 2852; https://doi.org/10.3390/pr13092852
Submission received: 6 August 2025 / Revised: 29 August 2025 / Accepted: 3 September 2025 / Published: 5 September 2025

Abstract

This study presents the development and optimization of a flexible integrated three-in-one micro-sensor using Micro-Electro-Mechanical Systems (MEMS) technology. To enhance its reliability and performance, the Taguchi Method was employed to analyze and optimize key fabrication parameters, including the electrode area, electrode thickness, and protective layer thickness. An L4 orthogonal array design enabled efficient experimentation with minimal runs. Experimental results demonstrate that optimized parameter combinations significantly improve sensor linearity, sensitivity, and reproducibility. Comparative analysis with commercial sensors shows the superior reliability of the self-fabricated sensor, particularly in airflow velocity detection. The findings validate the use of the Taguchi Method for robust MEMS sensor design and highlight its potential for industrial heating, ventilation, and air conditioning (HVAC) applications.

1. Introduction

In the 1920s, Ronald Fisher introduced the concept of Design of Experiments (DOE) in agriculture. Today, DOE is not only used in agriculture but is also applied across various industries, such as medical, biotechnology, pharmaceuticals, and high-tech manufacturing. In the 1950s, Genichi Taguchi introduced the Taguchi Method, incorporating orthogonal arrays [1]. Although opinions in the scientific community are divided, the Taguchi design gained popularity due to its practical applicability, making it one of the most widely adopted experimental designs in both industry and scientific research. Its advantage comes from the use of effective orthogonal matrices, ensuring a balanced distribution of factor levels and minimizing the number of experimental runs needed. While most orthogonal arrays emphasize main effects, certain designs also enable the estimation of specific interactions [2].
DOE involves designing experiments by selecting experimental conditions and minimizing external factors to mitigate their influence on the experiment. Its key feature is the ability to efficiently collect data or identify correlations and issues between factors through fewer experiments, with reduced cost and time. DOE is widely applicable and is used to create conditions that can prove whether a hypothesis is correct or incorrect. Proper experimental design requires controlling all variables that may influence the results and allows for measuring variables that change due to controlled factors. The former is usually referred to as the independent variable, while the latter is called the dependent or response variable. If the experiment is well-controlled, the results will allow for a reliable and effective distinction between the relationships of independent and dependent variables [3].
This article differs from the previously submitted article in that the Taguchi Method is used to improve the design of a three-in-one micro-sensor and compared with commercial sensors. The results show that sensors of different designs have different accuracies and reliabilities, which proves that the Taguchi Method can improve the performance of the sensor.

1.1. Micro-Velocity Sensor

Wang et al. [4] developed an analytical model and evaluated a velocity sensor, built on a ceramic substrate and enclosed in a plastic casing, within a wind tunnel. The experimental results revealed that the sensor’s output exhibited high sensitivity and exceptional linearity. Agrawal et al. [5] designed a velocity sensor based on a coiled cantilever structure made of silicon nitride, utilizing platinum resistors as the resistive element, which demonstrated remarkably high sensitivity. Xu et al. [6] proposed a novel velocity sensor system based on a self-powered triboelectric sensor and optoelectronic technology for simultaneous velocity and direction sensing. Yi et al. [7] examined the effect of dust on MEMS-based hot-wire velocity sensors. The measurement results indicated that at the same wind speed, the sensor’s output voltage with dust on its surface was slightly lower than that of a clean, dust-free sensor, leading to reduced measurement sensitivity and accuracy. Yi et al. [8] introduced a newly designed velocity sensor featuring a dual-layer inductor, marking the first instance of enhanced sensitivity. Two identical inductors were constructed on the front and back of a flexible substrate. When wind flows over the substrate, both inductors bend in response to the wind pressure. Consequently, the mutual inductance effect significantly amplifies the overall change in inductance, serving as a measurement of velocity. Mu et al. [9] established a velocity model for a damper torque sensor through analysis of resistive characteristics and investigated the sensor’s coefficient using Computational Fluid Dynamics (CFD) simulations and experiments. The results demonstrated that under consistent intake static pressure, as the damper opening angle increases, wind velocity escalates, while the torque variation range remains limited. Ligeza et al. [10] examined the static and dynamic characteristics of hot-wire sensors with different filament diameters. Their findings revealed that the sensitivity, represented by the slope of the characteristic curve (dI/dV), increased significantly as the filament diameter grew. Additionally, it was observed that the dI/dV slope decreased with increasing velocity.

1.2. Micro-Temperature Sensor

Hao et al. [11], by utilizing optimized electron beam parameters, demonstrated that the temperature coefficient of resistance in the range of 30 °C to 80 °C was 1.18%/°C, with a response time of 0.17 s. Their investigation into the effect of electron beam dosage on sensor performance revealed that the temperature sensors produced through this technique exhibited high sensitivity, rapid response, excellent linearity, and minimal hysteresis. Miao et al. [12] presented a wireless, chipless radio frequency identification sensor that incorporates a composite material of Fe2O3-Co3O4, SnO2, and rGO for accurate temperature measurement. The sensor exhibited sensitivities of −0.293 MHz/°C and −2.12 dB/°C (temperature variation from 10 °C to 85 °C), with a temperature response duration of 15.3 s and a recovery duration of 21.7 s. Lin et al. [13] constructed and validated an ultra-high-sensitivity optical fiber temperature sensor using polydimethylsiloxane (PDMS) and the vinyl effect. The results revealed an extraordinarily high sensitivity of −4.08658 nm/°C and outstanding linearity of 0.99972, with experiments confirming its stability and reliability in micro-vibrational environments. Xu et al. [14] presented a relative humidity (RH) and temperature sensor that employs forward Brillouin scattering (FBS) in a single-mode optical fiber coated with polyimide (PI). The measured temperature values showed a strong correlation with RH fluctuations within the 35–85% range. Pan et al. [15] introduced a flexible temperature sensor that utilizes a combination of polyaniline/graphene (GPANI) and polyvinyl butyral (PVB) film, supported by a substrate made of Indium tin oxide (ITO) and Polyethylene Terephthalate (PET). The GPANI particles embedded within the PVB film not only facilitate temperature measurement but also respond to external pressure due to their slight deformation. Tursunniyaz et al. [16] designed a resistive temperature sensor using aerosol jet printing, employing nano-material inks to form simple, cost-effective, and environmentally friendly patterns on the film. Their findings demonstrated that the sensor’s resistance varies linearly with temperature between 22 °C and 150 °C, throughout both heating and cooling cycles. Tursunniyaz et al. [17] also introduced a resistive temperature sensor fabricated via aerosol jet technology, utilizing a mixture of nickel–copper–silver nanoparticle ink. The results showed that the sensitivity improved by 300% with a 40% silver and copper/nickel toluene ink blend.

1.3. Micro-Humidity Sensor

Liu et al. [18] presented a novel high-performance Film Bulk Acoustic Resonator (FBAR) design that incorporated a polyimide (PI) film. The PI film provided structural support while also enabling humidity sensing functions, marking its first application in back-slot FBARs. Mu et al. [19] enhanced a MEMS capacitive relative humidity sensor by integrating HNTs-NH2 into the sensing layer using polyimide (PI). The findings demonstrated that the modified nanotubes substantially improved the sensor’s humidity sensing capabilities. Additionally, the introduction of hydrophilic additives within the nanotube structure significantly increased its sensitivity. Li et al. [20] introduced a highly sensitive optical fiber grating humidity sensor featuring coatings of polyimide (PI) and graphene layers. Experimental results revealed that this sensor had a humidity sensitivity 1.8 times greater than that of the sensor coated solely with PI film. Zhu et al. [21] developed a resistive humidity sensor utilizing an ultrathin graphene oxide (GO) film, composed of stacked monolayers of GO. The sensor demonstrated response and recovery times of under 1 s across the relative humidity (RH) range of 10% to 95%. Che et al. [22] designed a flexible device for moisture detection based on a precisely engineered Thermoplastic Polyamide Elastomer (TPAE). The resistance of the TPAE moisture sensor decreased as the relative humidity (RH) increased, demonstrating negative moisture sensitivity. Zhang et al. [23] developed modified MXene composites through PEI/AgNO3 crosslinking, showcasing remarkable physicochemical stability and moisture sensitivity, which makes them ideal for real-time humidity monitoring applications. The optimized PEI/AgNO3 crosslinking improved the interlayer structure of the MXene nanosheets, strengthening the composite’s structural stability and promoting the movement of water molecules.

2. Research Methods

2.1. Integration of a Three-in-One Micro-Sensor with the Taguchi Method

This study employs Design of Experiments (DOE) to develop an orthogonal array (OA), dividing it into three factors—electrode area, electrode thickness, and protective layer thickness—each with two levels (parameter values). The two parameter levels for the three control factors were determined based on laboratory experience and existing literature, with size selection guided by past research findings from our laboratory [24]. Following the Taguchi Method, an L4 orthogonal array was constructed, as shown in Table 1, featuring four different designs of the integrated three-in-one micro-sensor. By analyzing the process parameters, we aim to optimize a high-accuracy integrated three-in-one micro-sensor, as illustrated in Figure 1.

2.2. Design and Principle of the Integrated 3-in-1 Micro-Sensor

This study developed a compact three-in-one micro-sensor utilizing MEMS technology, with gold (Au) selected as the sensing element due to its excellent physical and chemical properties, as well as with its straightforward fabrication process. To minimize thermal interference between sensing elements, a spacing of 400 μm was maintained between the hot-wire anemometer and the RTD, and a PI protective layer (LTC® 9320) (Fujifilm, Tokyo, Japan) was applied to provide thermal insulation. As the applied voltage was very small, localized heating was negligible.

2.3. Micro-Velocity Sensor

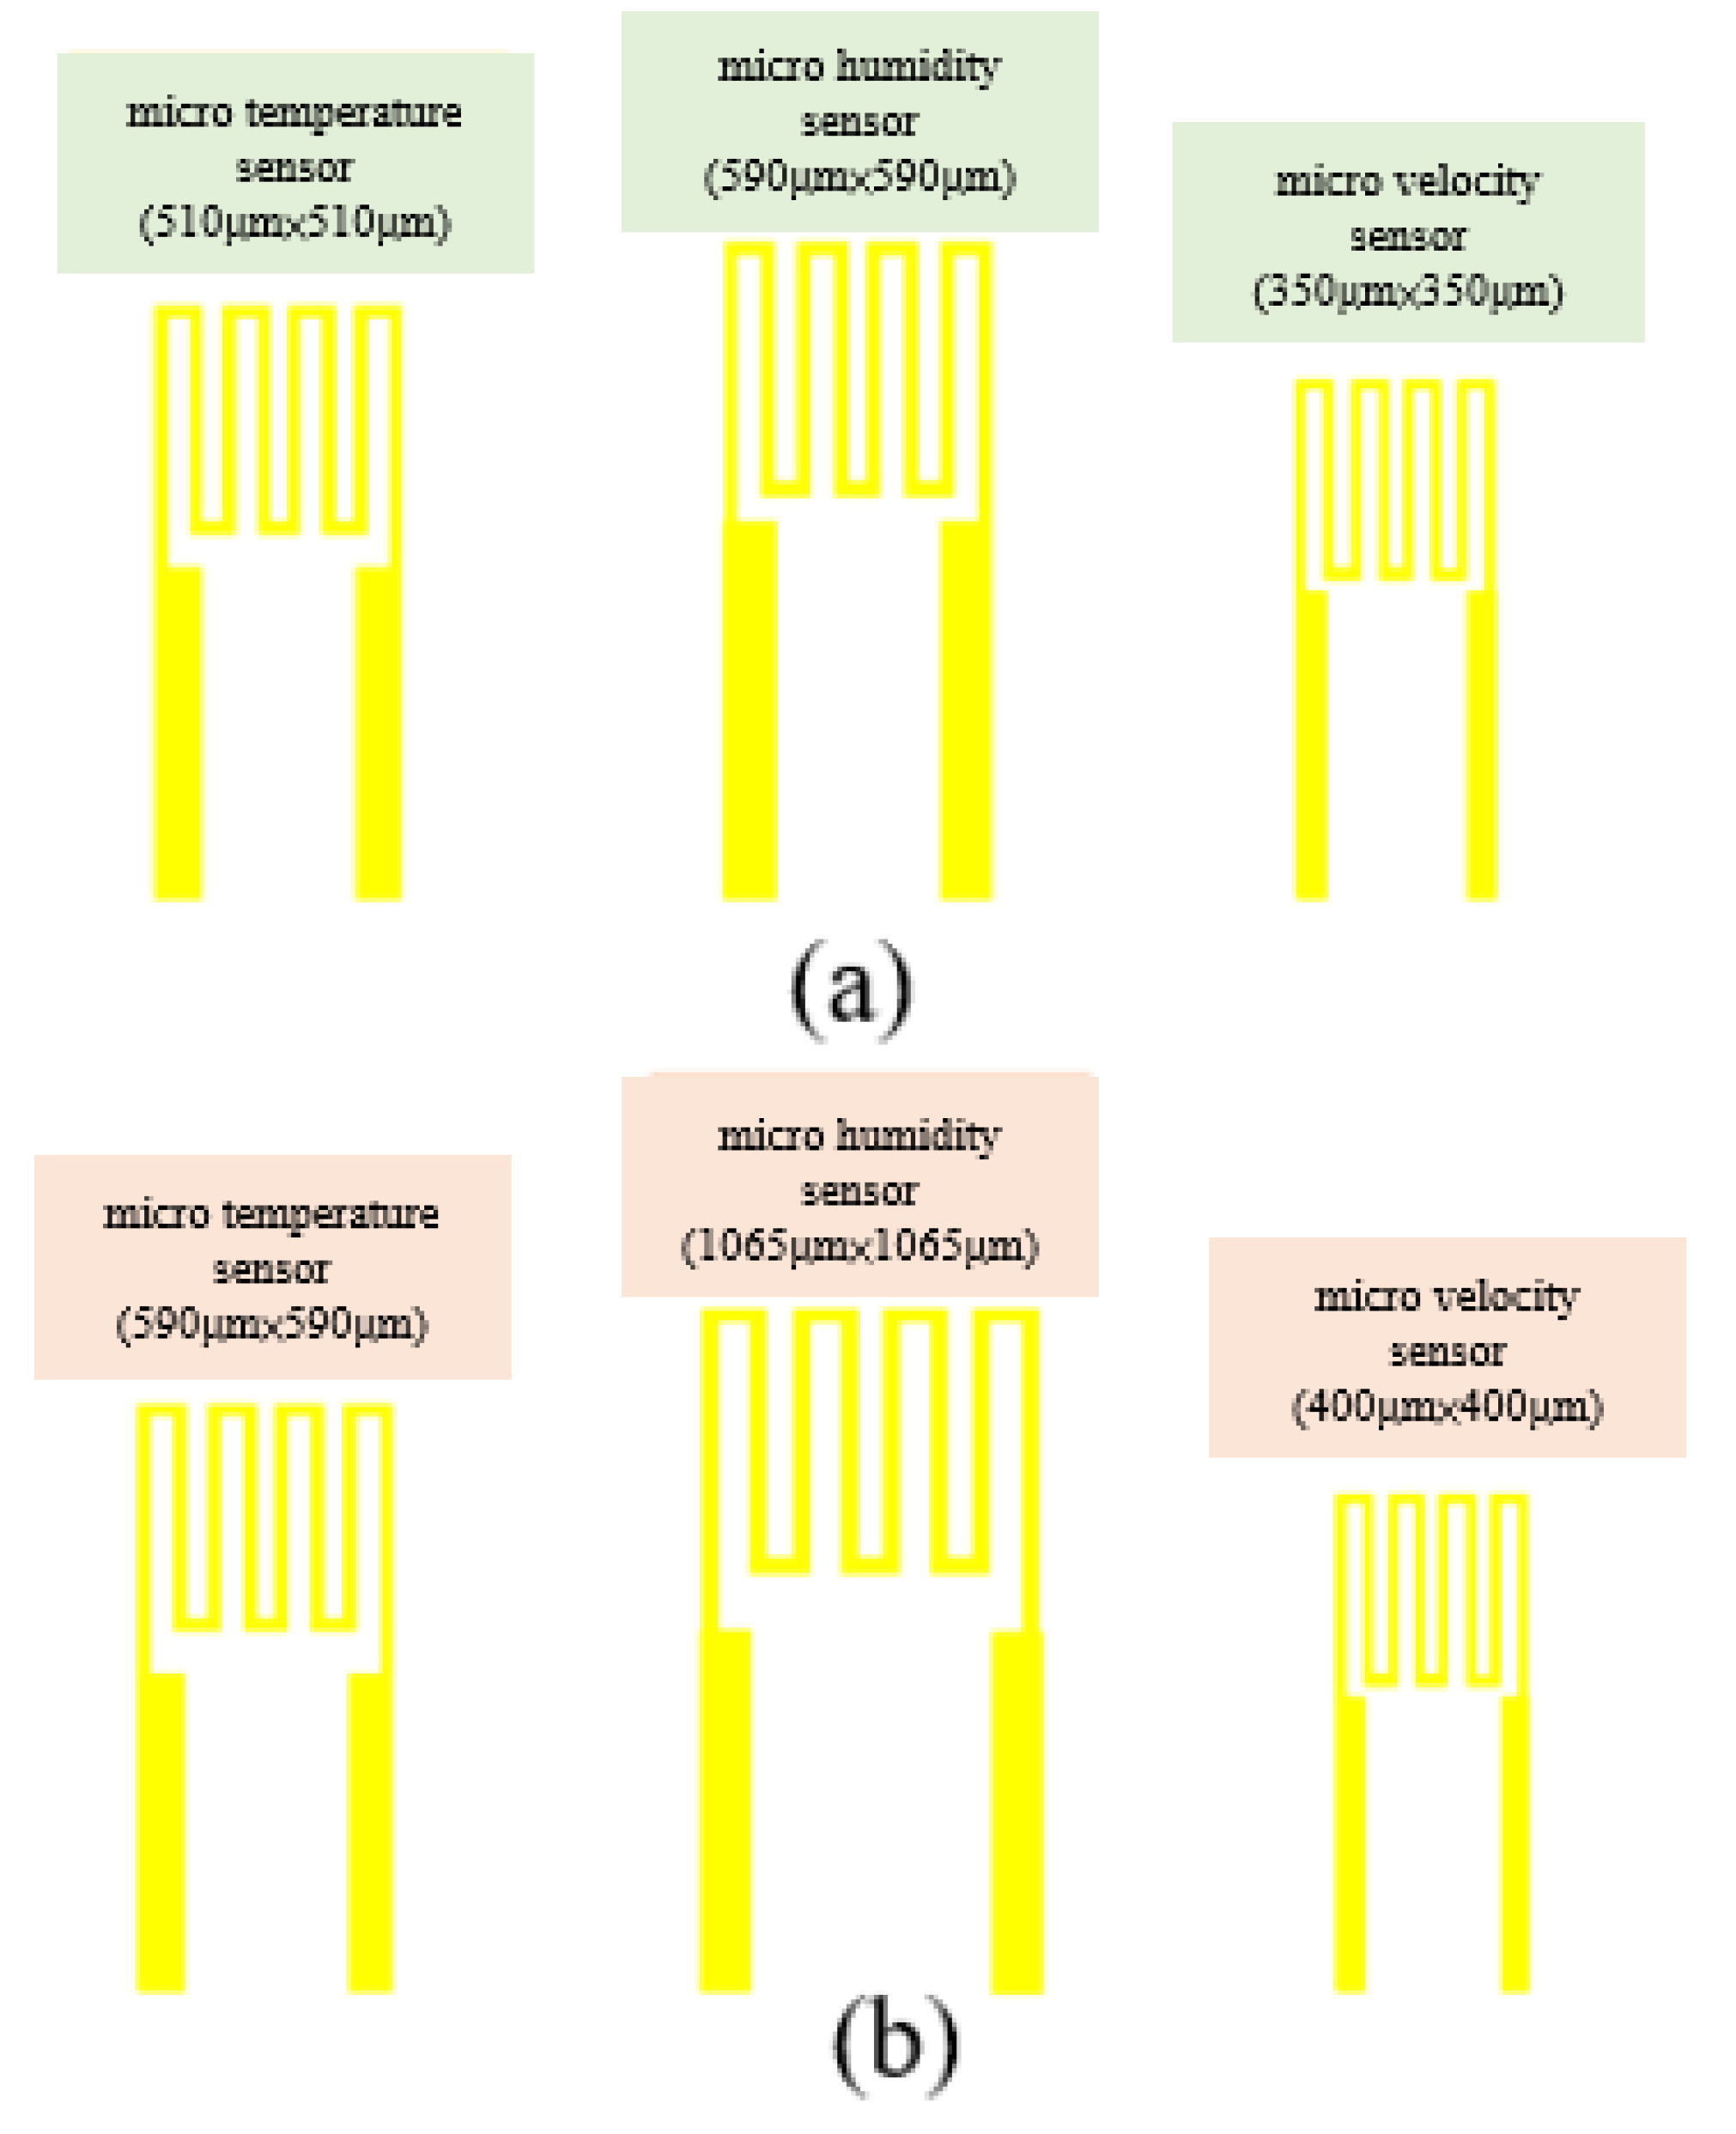
Currently, several types of micro-velocity sensors have been created using MEMS technology. These sensors are generally classified into two primary categories: hot-wire type and calorimetric type. Among these, hot-wire micro-velocity sensors are particularly suited for this research due to their compact size, low energy consumption, high sensitivity, and accuracy, as well as the simplicity of fabrication, driving, and signal output circuit design. Velocity sensing methods can be further categorized into three types: constant temperature (CT), constant voltage (CV), and constant current (CC). Given that the Arduino microprocessor used in this study can only output and read voltage, incorporating a current-to-voltage module would increase costs. Therefore, this study adopts the Constant Voltage method and employs a custom-designed circuit to monitor voltage changes. The circuit includes a Wheatstone bridge and a voltage signal amplifier. The micro-velocity sensor’s electrode dimensions are 350 µm × 350 µm and 400 µm × 400 µm, with a minimum line width and spacing of 10 µm.

2.4. Micro-Temperature Sensor

In this study the micro-temperature sensor falls under the category of Resistance Temperature Detectors (RTD), using gold (Au) as the electrode material. Metals exhibit thermal expansion and contraction with temperature variations, causing their electrical resistivity to change with temperature. The electrodes are designed in a serpentine structure to enhance resistance, with electrode areas of 510 µm × 400 µm and 590 µm × 450 µm and a minimum line width and spacing of 10 µm.

2.5. Micro-Humidity Sensor

The micro-humidity sensor employed in this research is a resistive micro-humidity sensor that incorporates a novel type of negative photoresist (Fujifilm LTC® PI 9305, Fujifilm, Tokyo, Japan) as the dielectric layer. This material is noted for its high durability, resistance to acids and bases, corrosion resistance, and moisture-absorbing characteristics, and it must generally remain non-conductive. As the moisture absorbed by the sensing material increases, its volume also expands, resulting in an increase in circuit resistance. The electrode dimensions are 590 µm × 500 µm and 1065 µm × 1050 µm, with a minimum line width and spacing of 10 µm.

2.6. Integration of the Three-in-One Micro-Sensor

Figure 2 illustrates the integrated design diagram of the three-in-one micro-sensor, and Table 2 outlines the principle and design of the three types of sensors. The sizes of the micro-velocity sensors are 350 µm × 350 µm and 400 µm × 400 µm; the micro-temperature sensors measure 510 µm × 400 µm and 590 µm × 450 µm; and the micro-humidity sensors have dimensions of 590 µm × 500 µm and 1065 µm × 1050 µm. Both the minimum line width and spacing are 10 µm, and the separation between the micro-sensors is 400 µm. Given the close arrangement of the micro-sensors, they can be treated as a single point for measuring wind speed, temperature, and humidity on a macroscopic scale, facilitating the simultaneous real-time monitoring of these three physical parameters. Potential electrical and structural interference effects were mitigated during mask design by optimizing sensor placement and spacing, while independent Wheatstone bridge circuits were employed to isolate electrical signals.

2.7. Fabrication Process of the Integrated Three-in-One Micro-Sensor

This study employs MEMS technology to combine three sensing structures: velocity, temperature, and humidity. To ensure that the integrated three-in-one micro-sensor can provide flexibility, long-lasting durability, and sustained measurement within the HVAC cold air duct, this study selects a polyimide (PI) film as the substrate for the integrated sensor. The chosen PI film has a thickness of 50 µm, and the protective layer as well as the dielectric layer utilize liquid polyimides LTC® 9320 and 9305 both from Fujifilm, Tokyo, Japan. To prevent any damage, surface micromachining techniques [25] from the MEMS process are employed. The fabrication process mainly includes deposition, lithography, and lift-off methods. In previous experiments, our laboratory employed wet etching to create micro-sensors, which frequently led to excessive etching of line widths, complicating adherence to specifications for back-end circuit integration. Consequently, this study adopts the lift-off technique to improve the stability of micro-sensor quality, with the overall fabrication workflow illustrated in Figure 3.

2.8. Calibration of the Integrated Three-in-One Micro-Sensor

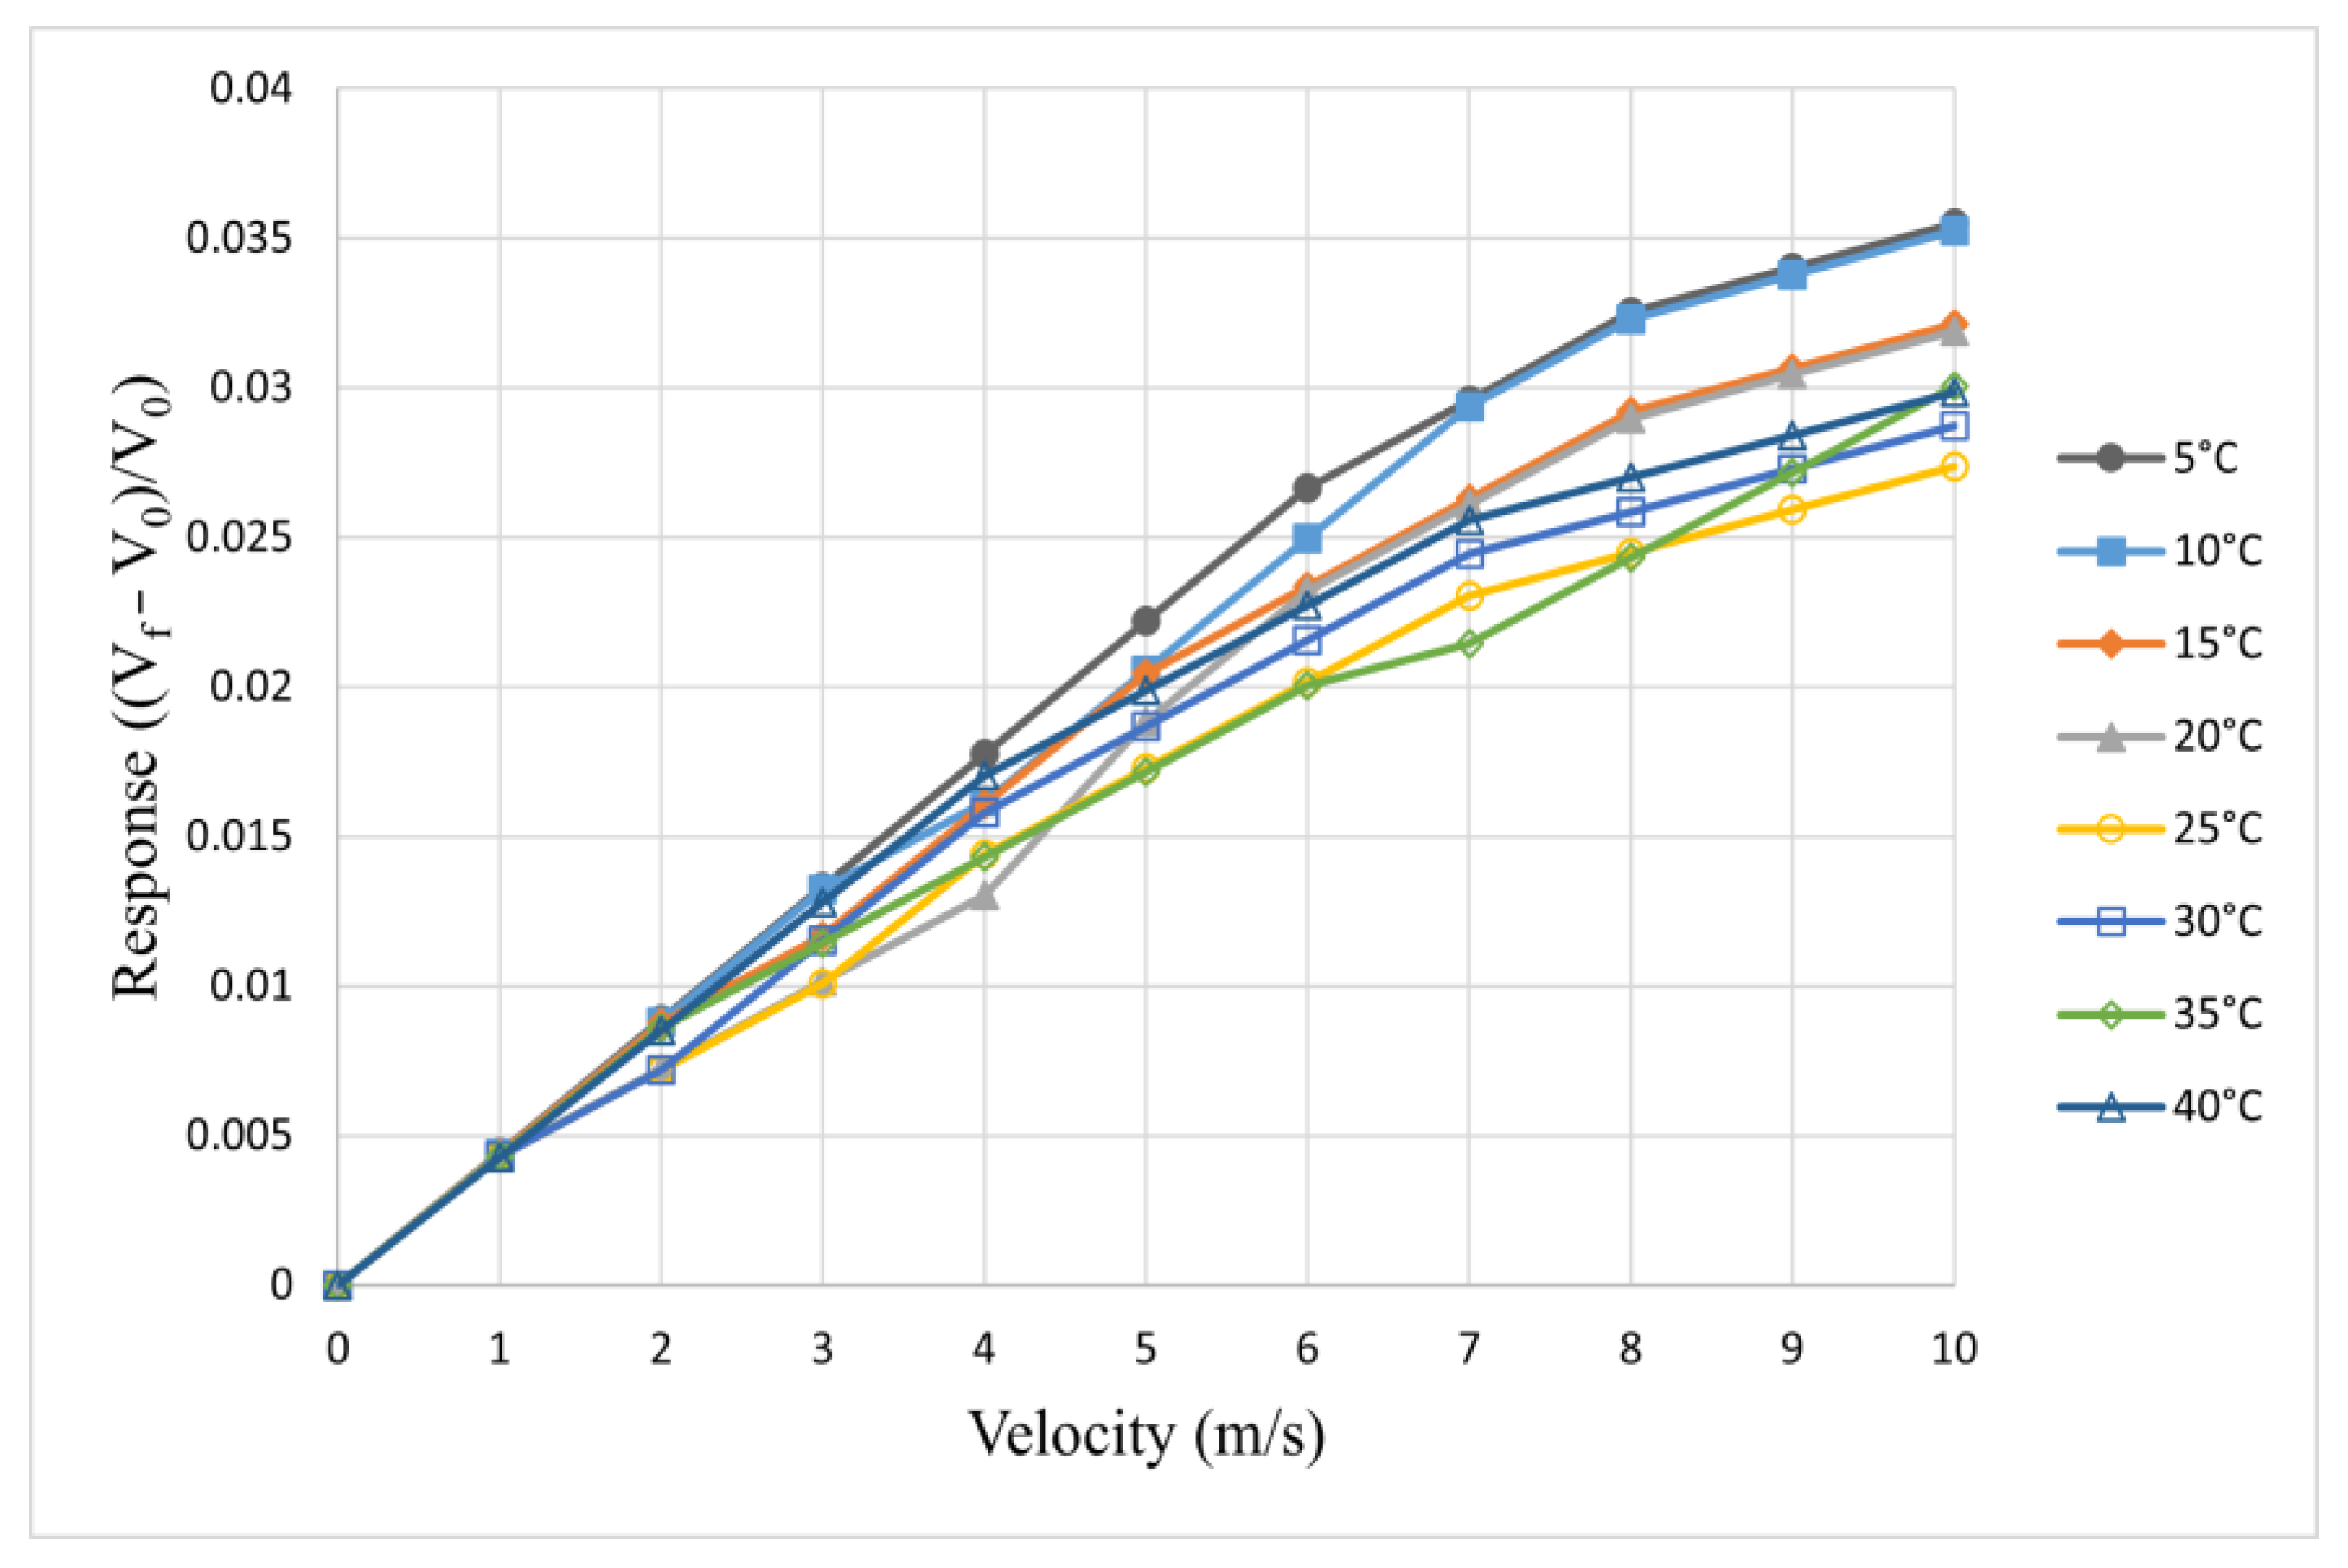
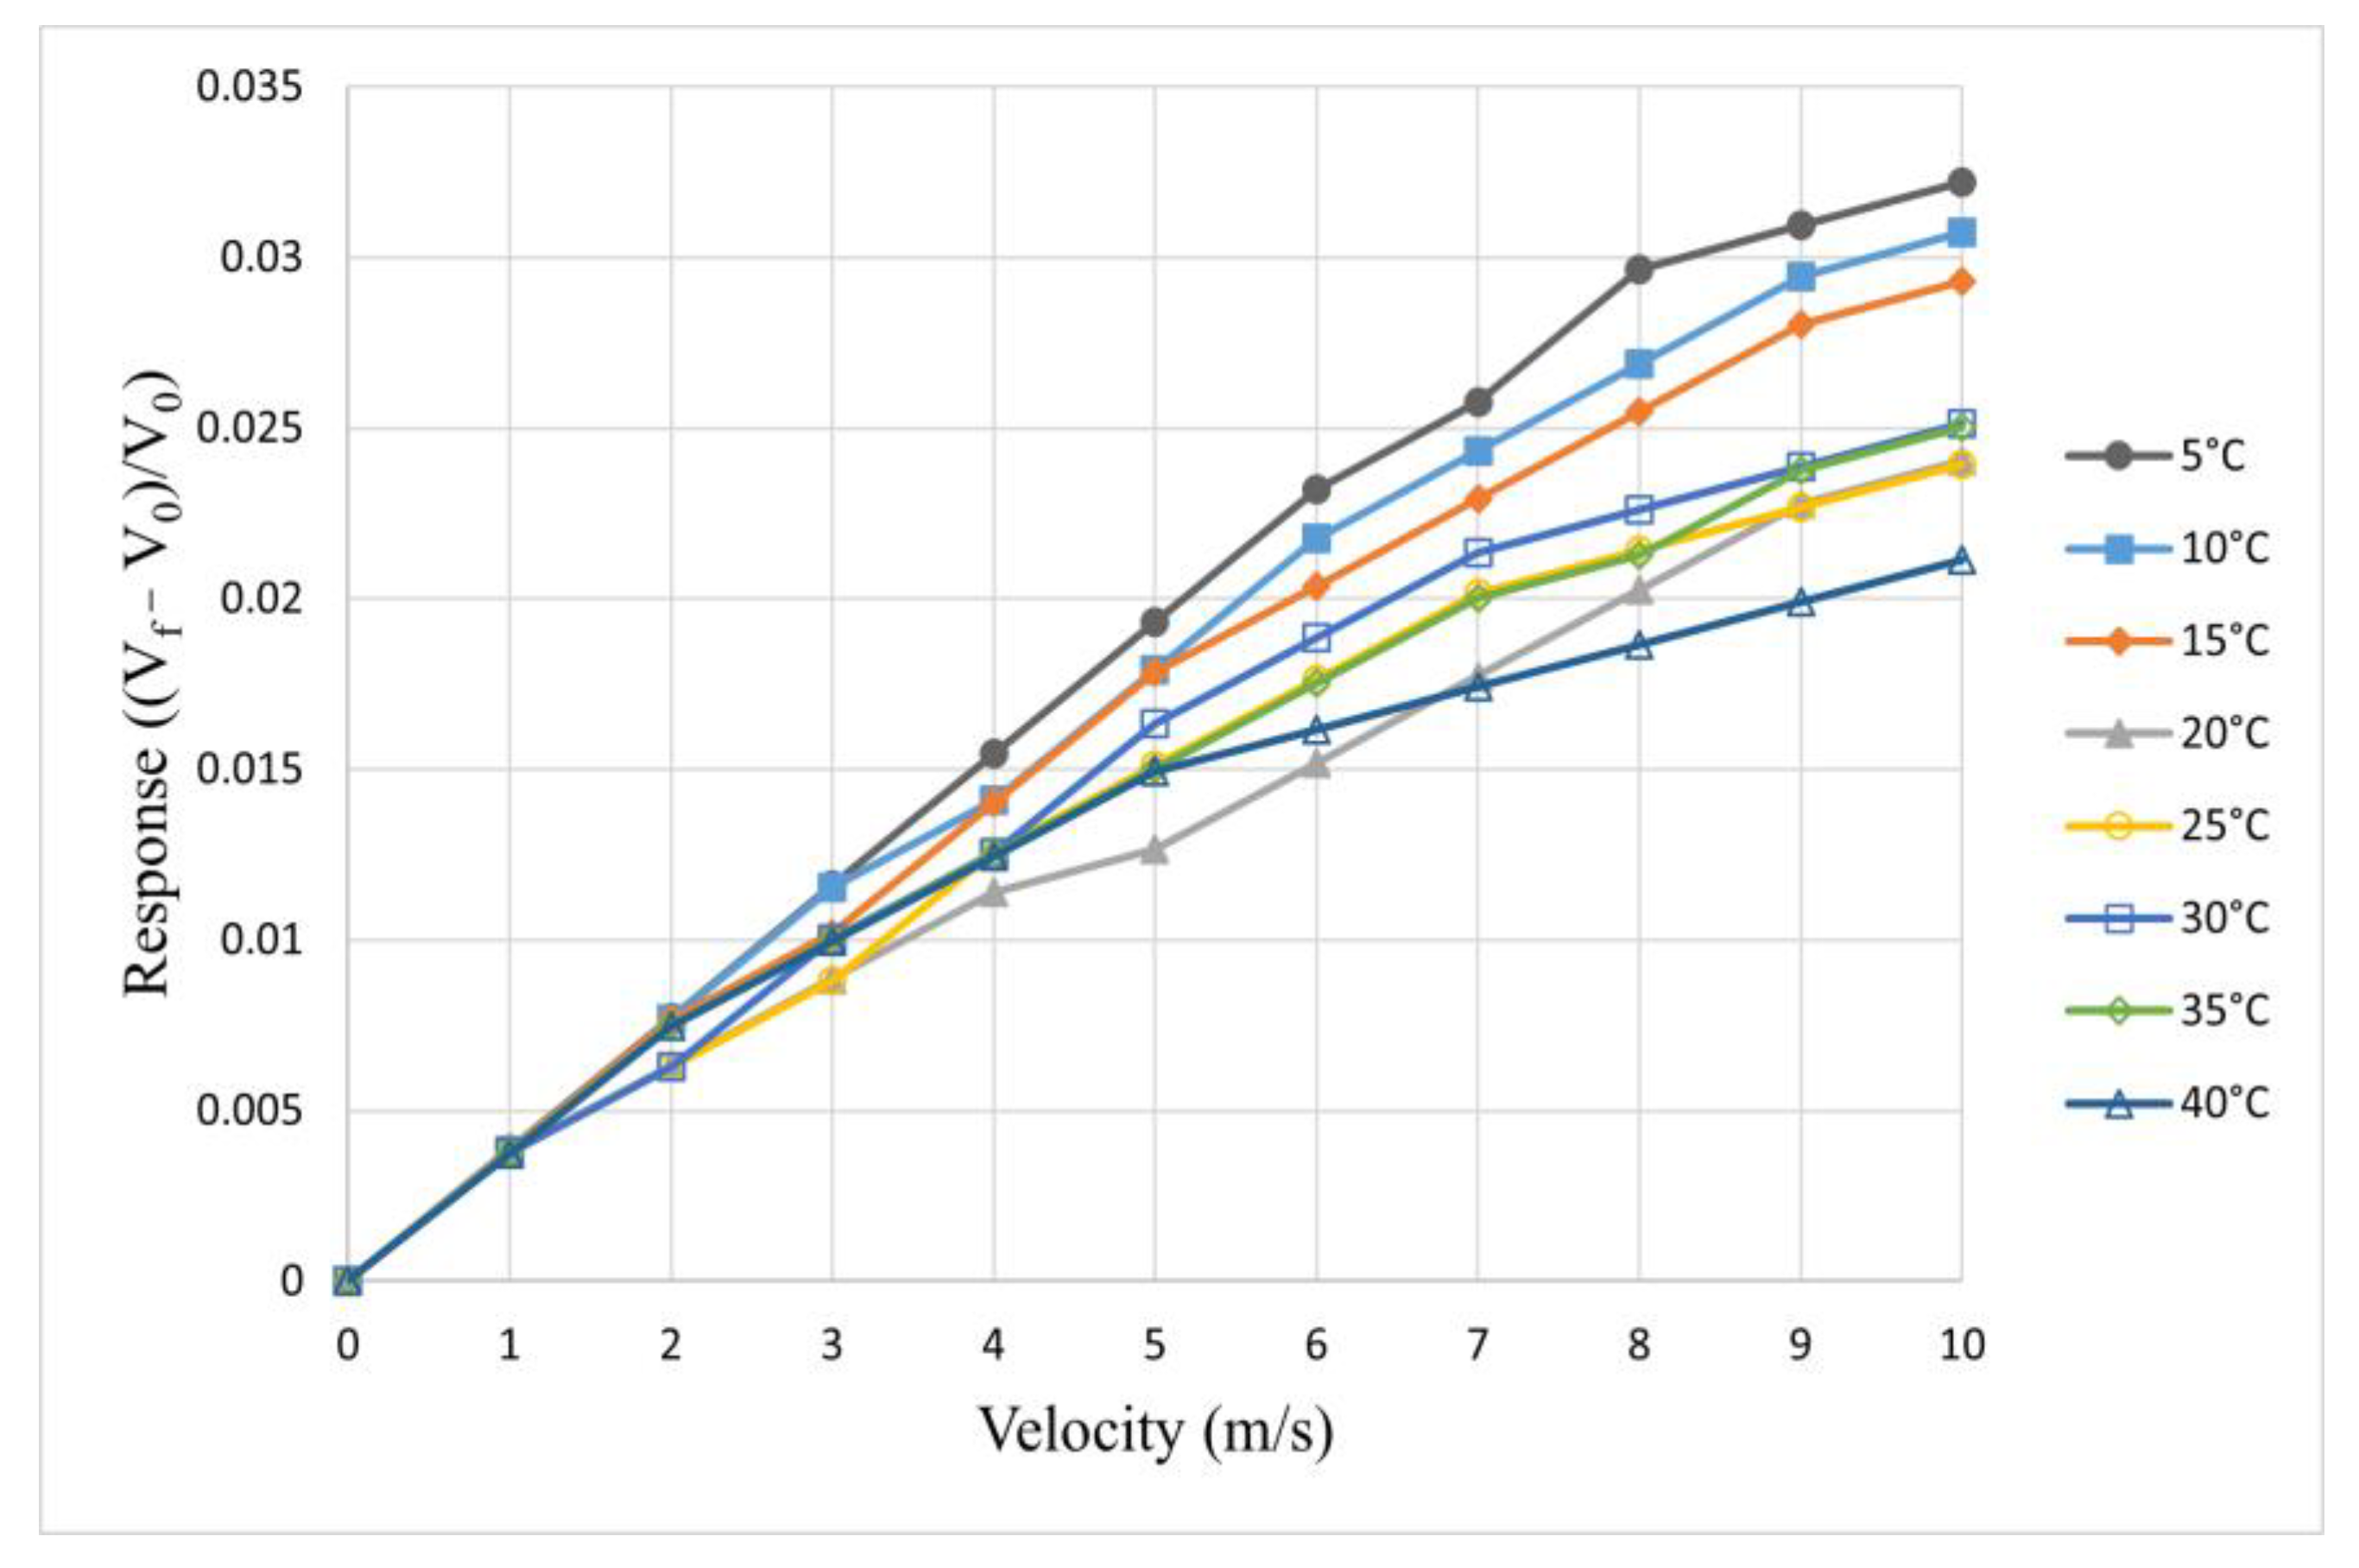
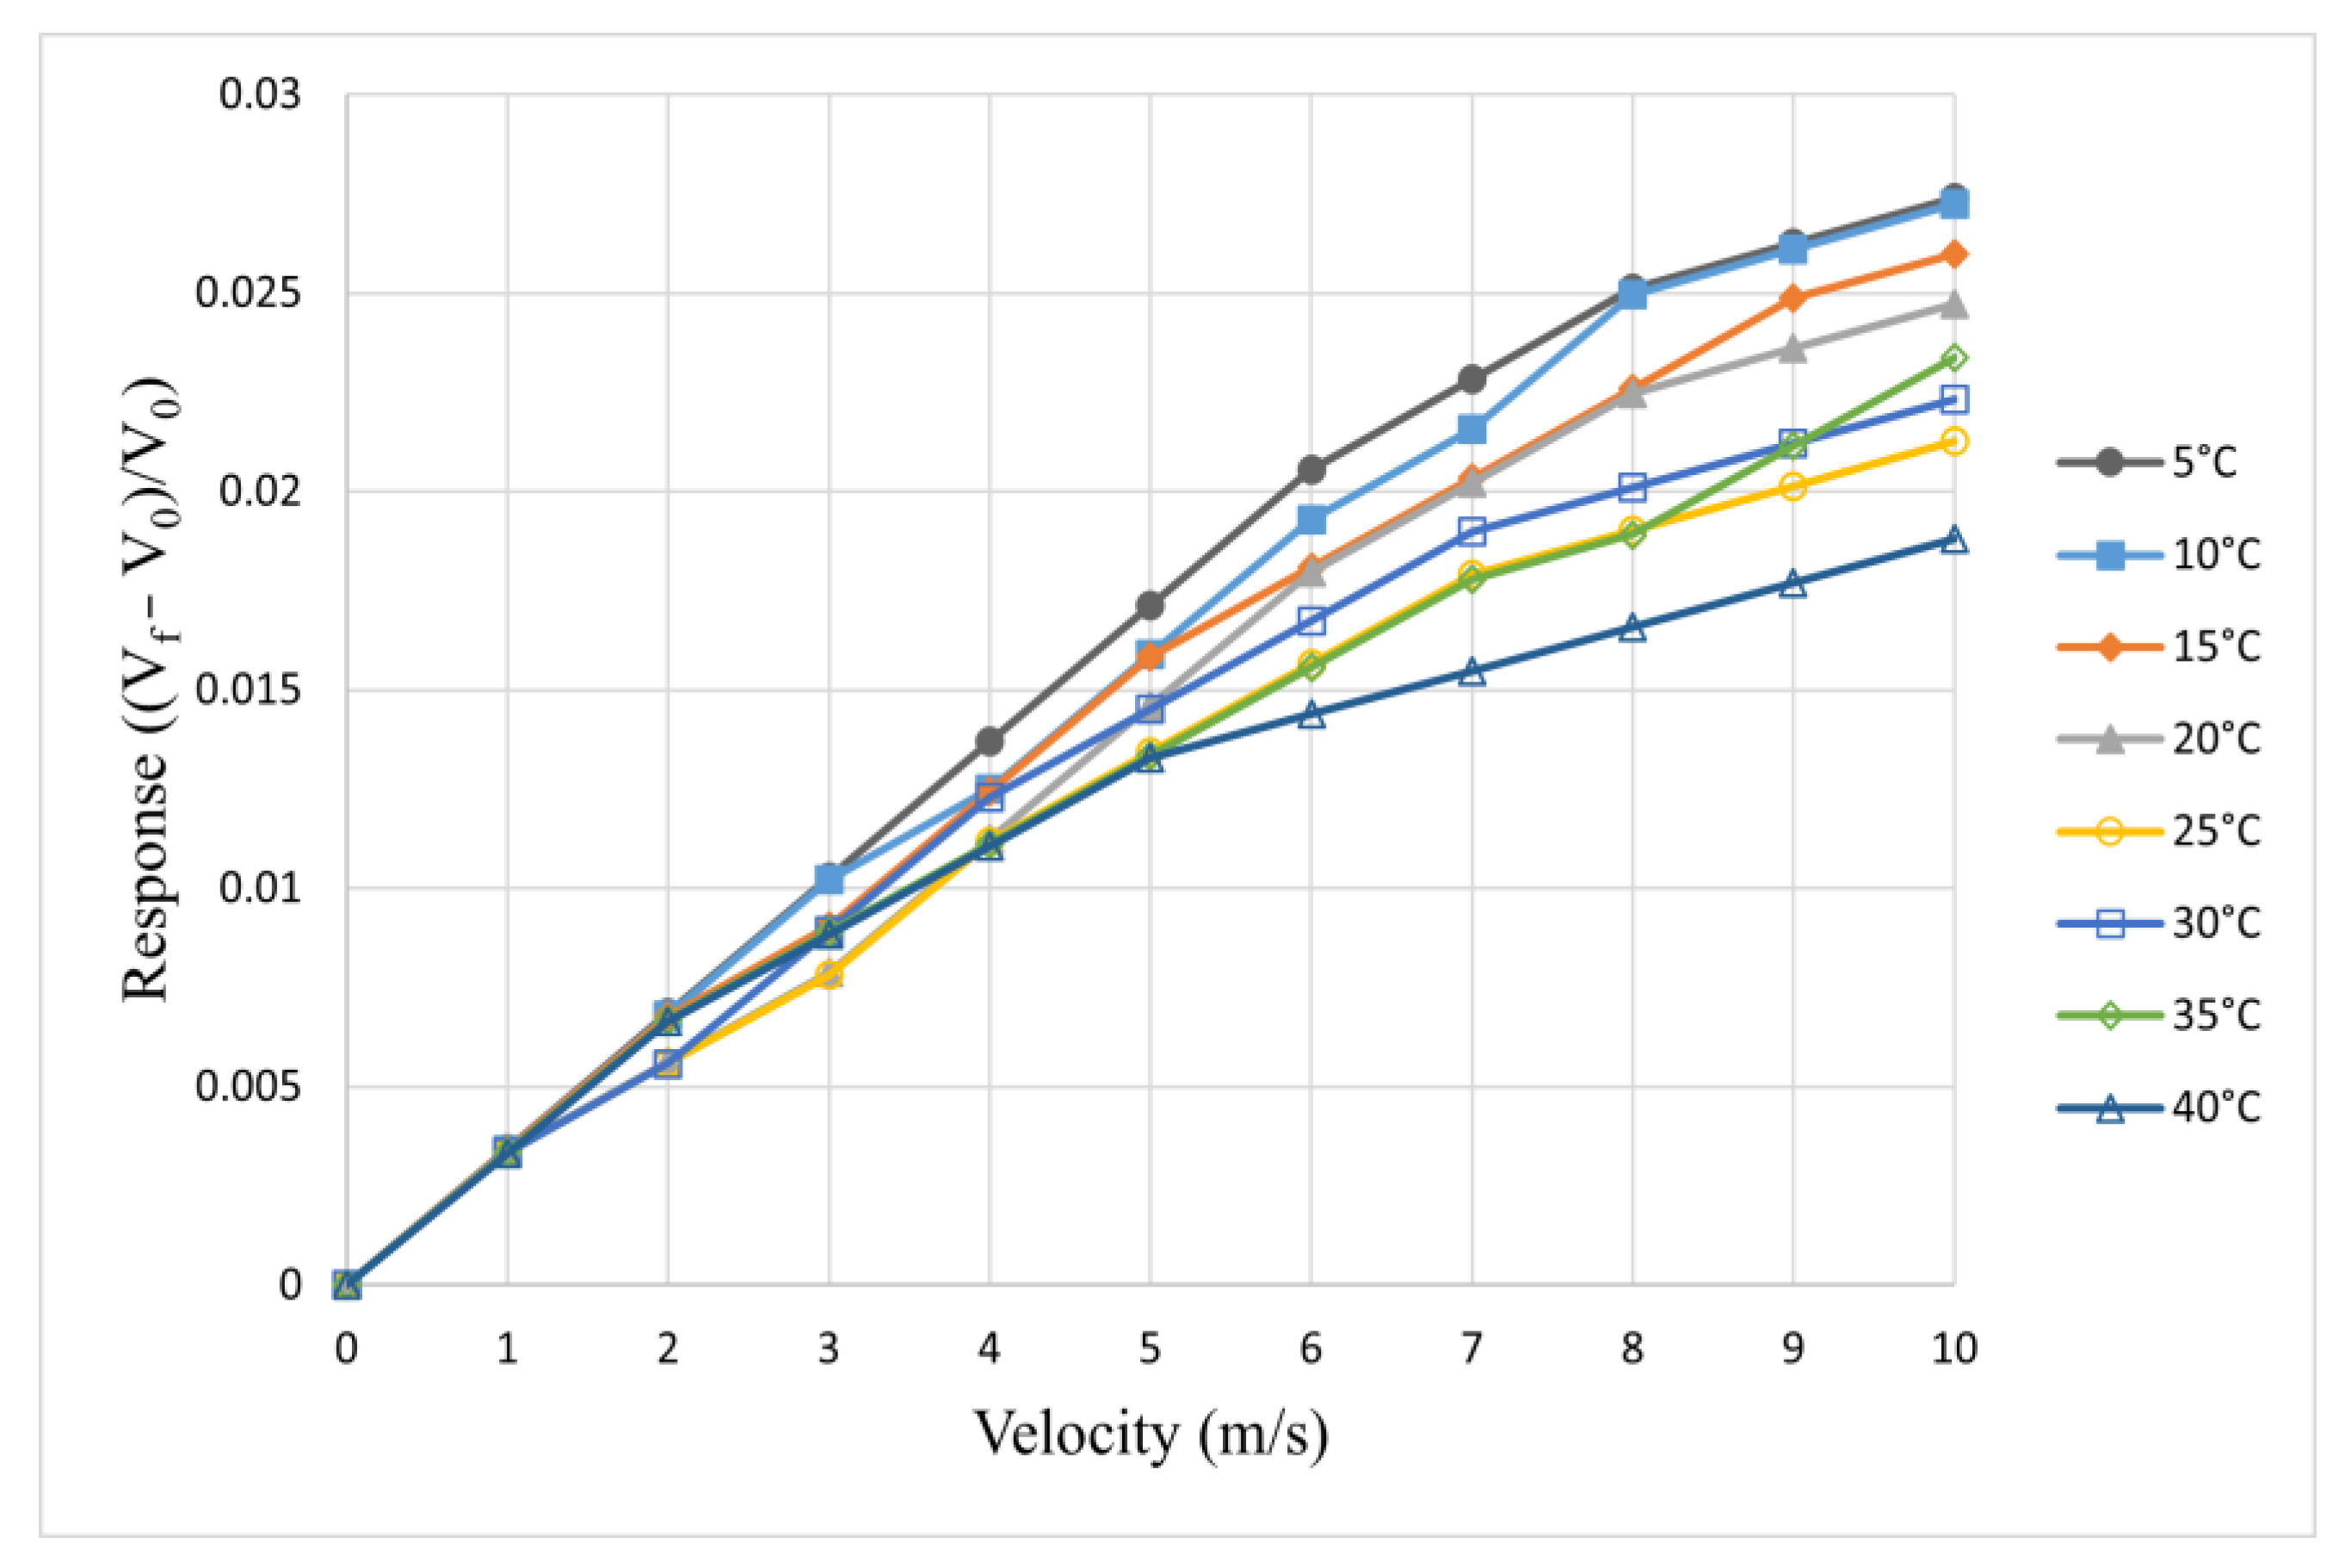
Four sets of micro-velocity sensors were positioned in a programmable constant temperature and humidity testing apparatus. The calibration curve demonstrates that the sensor and calibration instrument are highly accurate. The calibration range for the custom micro-velocity sensor spanned from 0 m/s to 10 m/s, with data collected at intervals of 1 m/s. Since temperature affects the micro-velocity sensor, the environmental temperature during calibration varied from 5 °C to 40 °C, with increments of 5 °C. This enabled the collection of the relationship curve between velocity and the corresponding raw voltage readings from the Arduino microprocessor, leading to the calibration curve, which was subsequently normalized. As illustrated in Figure 4, Figure 5, Figure 6 and Figure 7, Vf denotes the voltage reading at the current velocity, while V0 signifies the voltage reading at 0 m/s. The y-axis unit ((Vf − V0)/V0) indicates the dimensionless change in the voltage reading.
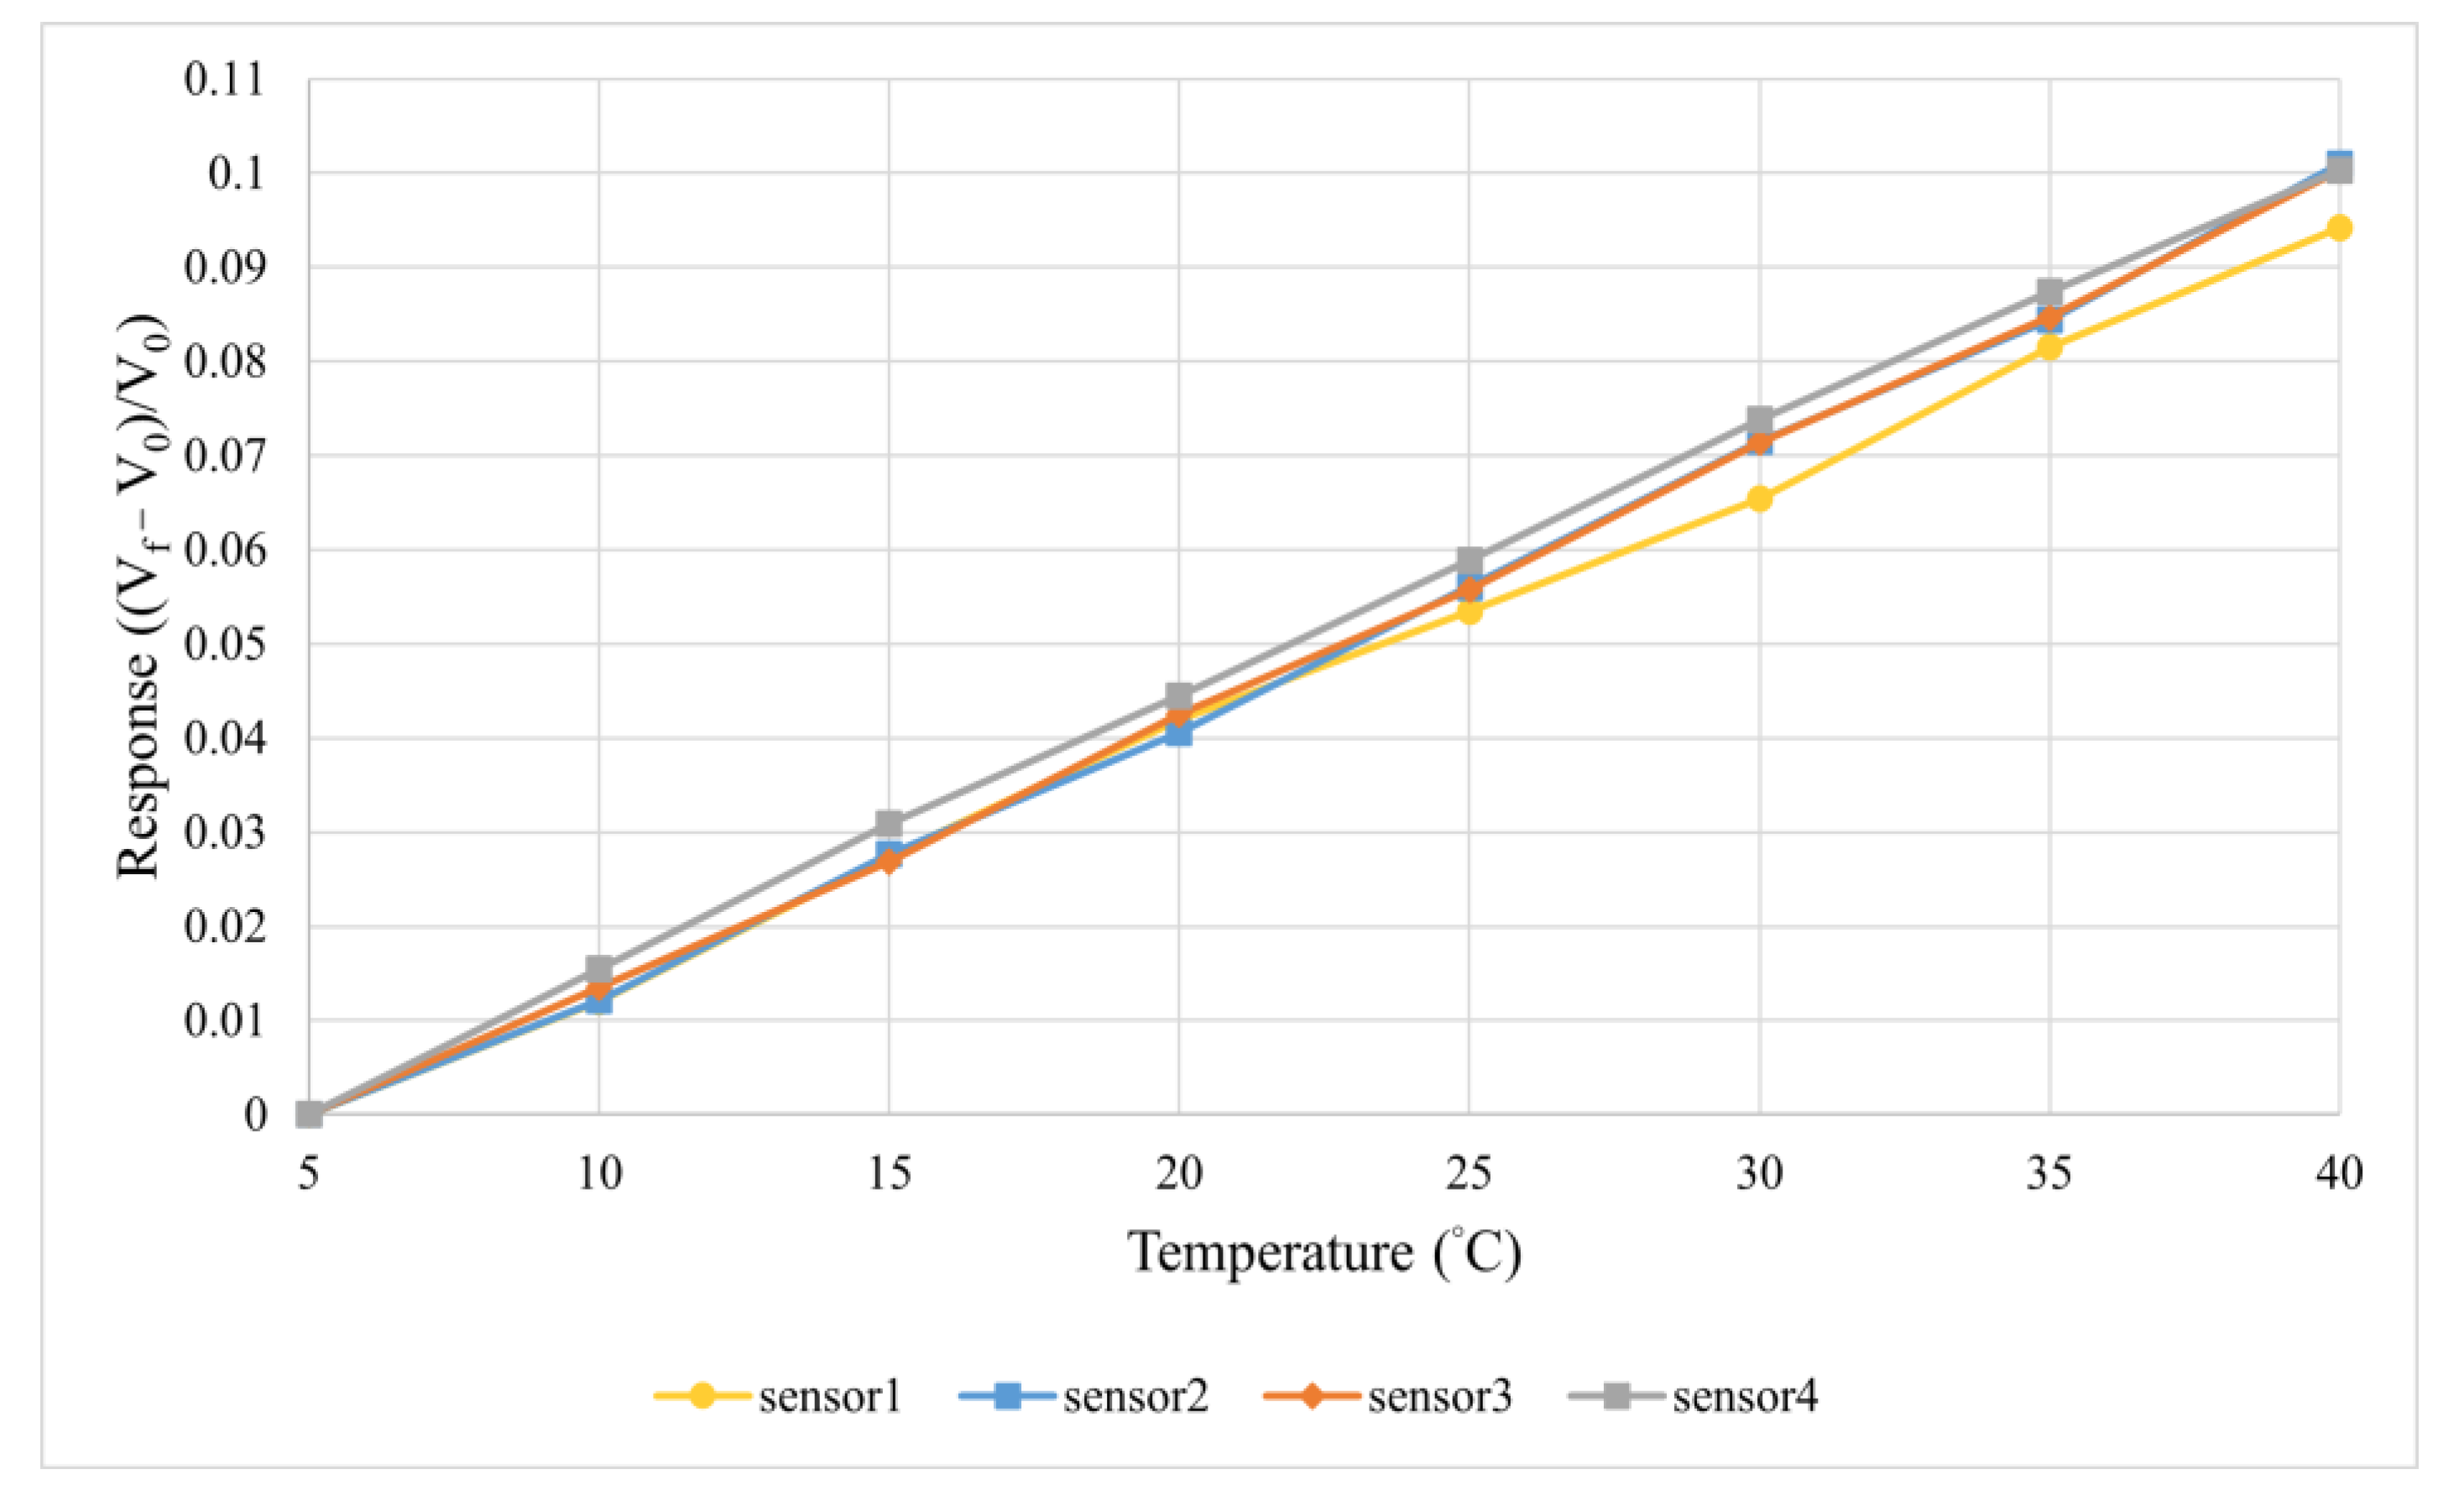
Four sets of micro-temperature sensors were positioned in a programmable constant temperature and humidity testing apparatus. The calibration curve demonstrates that both the sensor and the calibration instrument exhibit high accuracy. The calibration range for the micro-temperature sensors spanned from 5 °C to 40 °C, with data collected at 5 °C intervals. This allowed the establishment of the relationship between temperature and the corresponding raw voltage readings from the Arduino microprocessor, resulting in the calibration curve. The data were then normalized for analysis. As shown in Figure 8, Vf represents the voltage reading at the current temperature, and V0 represents the voltage reading at 5 °C. The y-axis, expressed as ((Vf − V0)/V0), illustrates the dimensionless variation in the voltage reading, indicating how the sensor’s output changes with temperature.
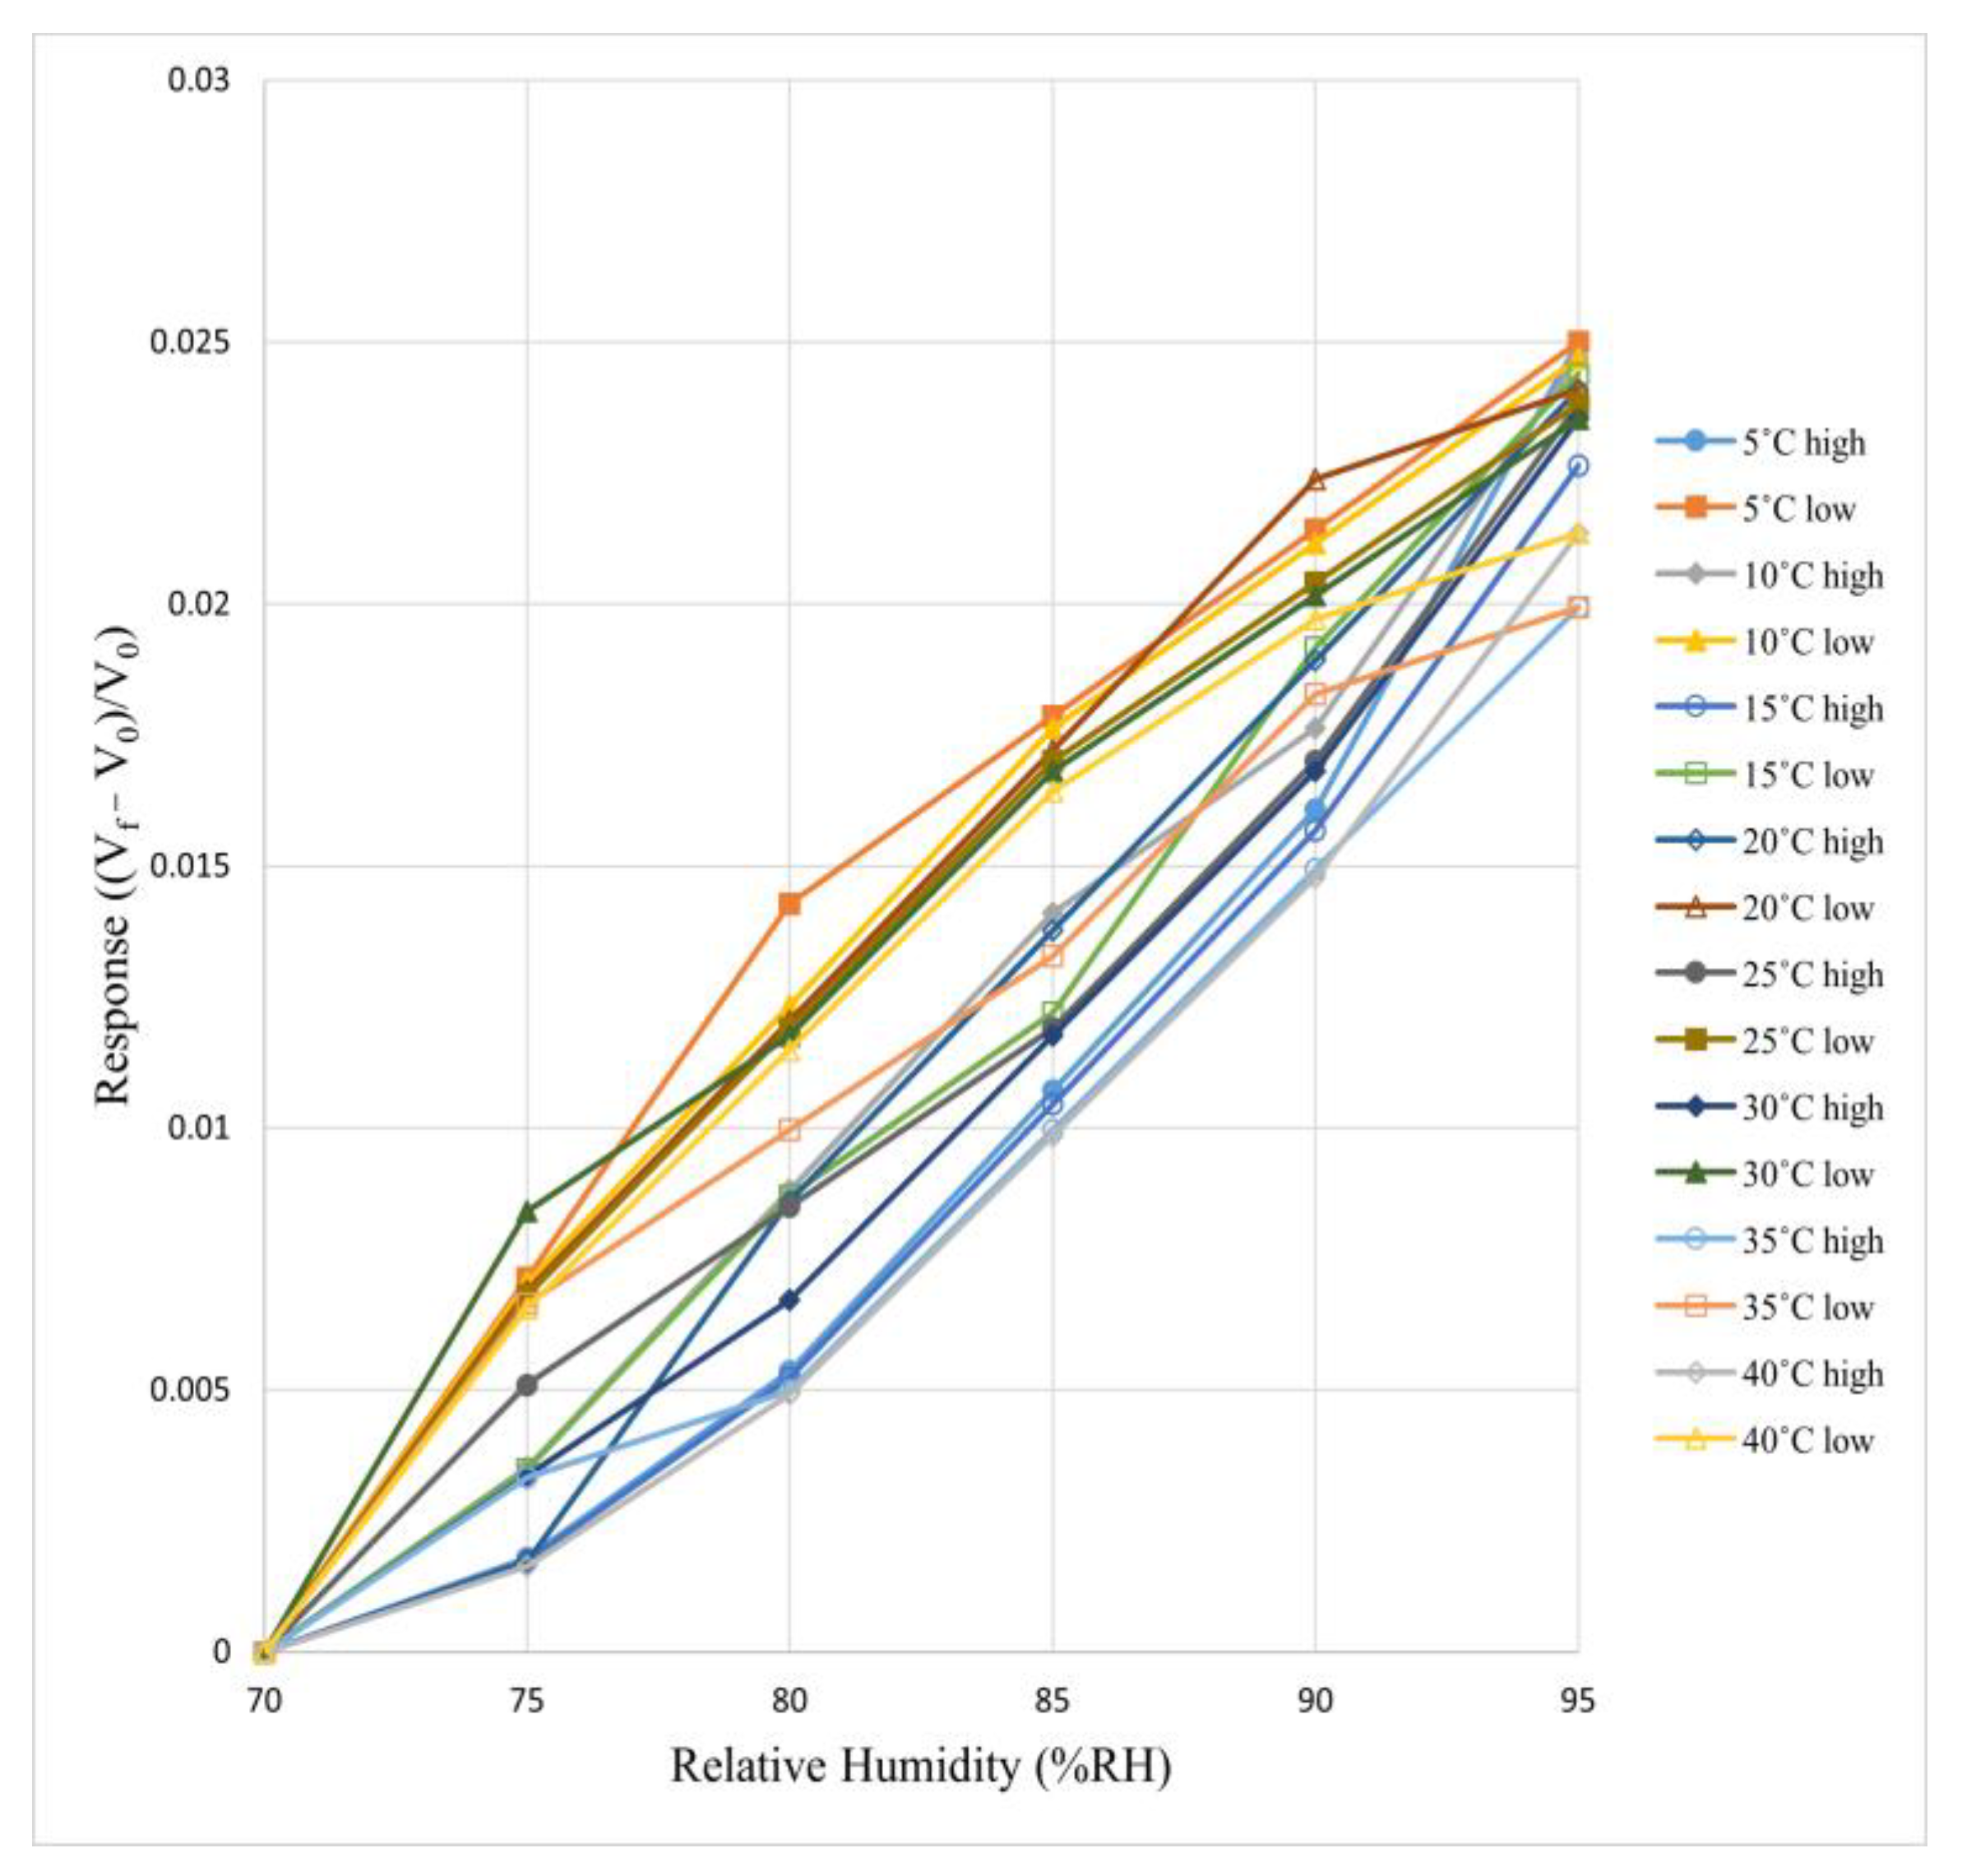
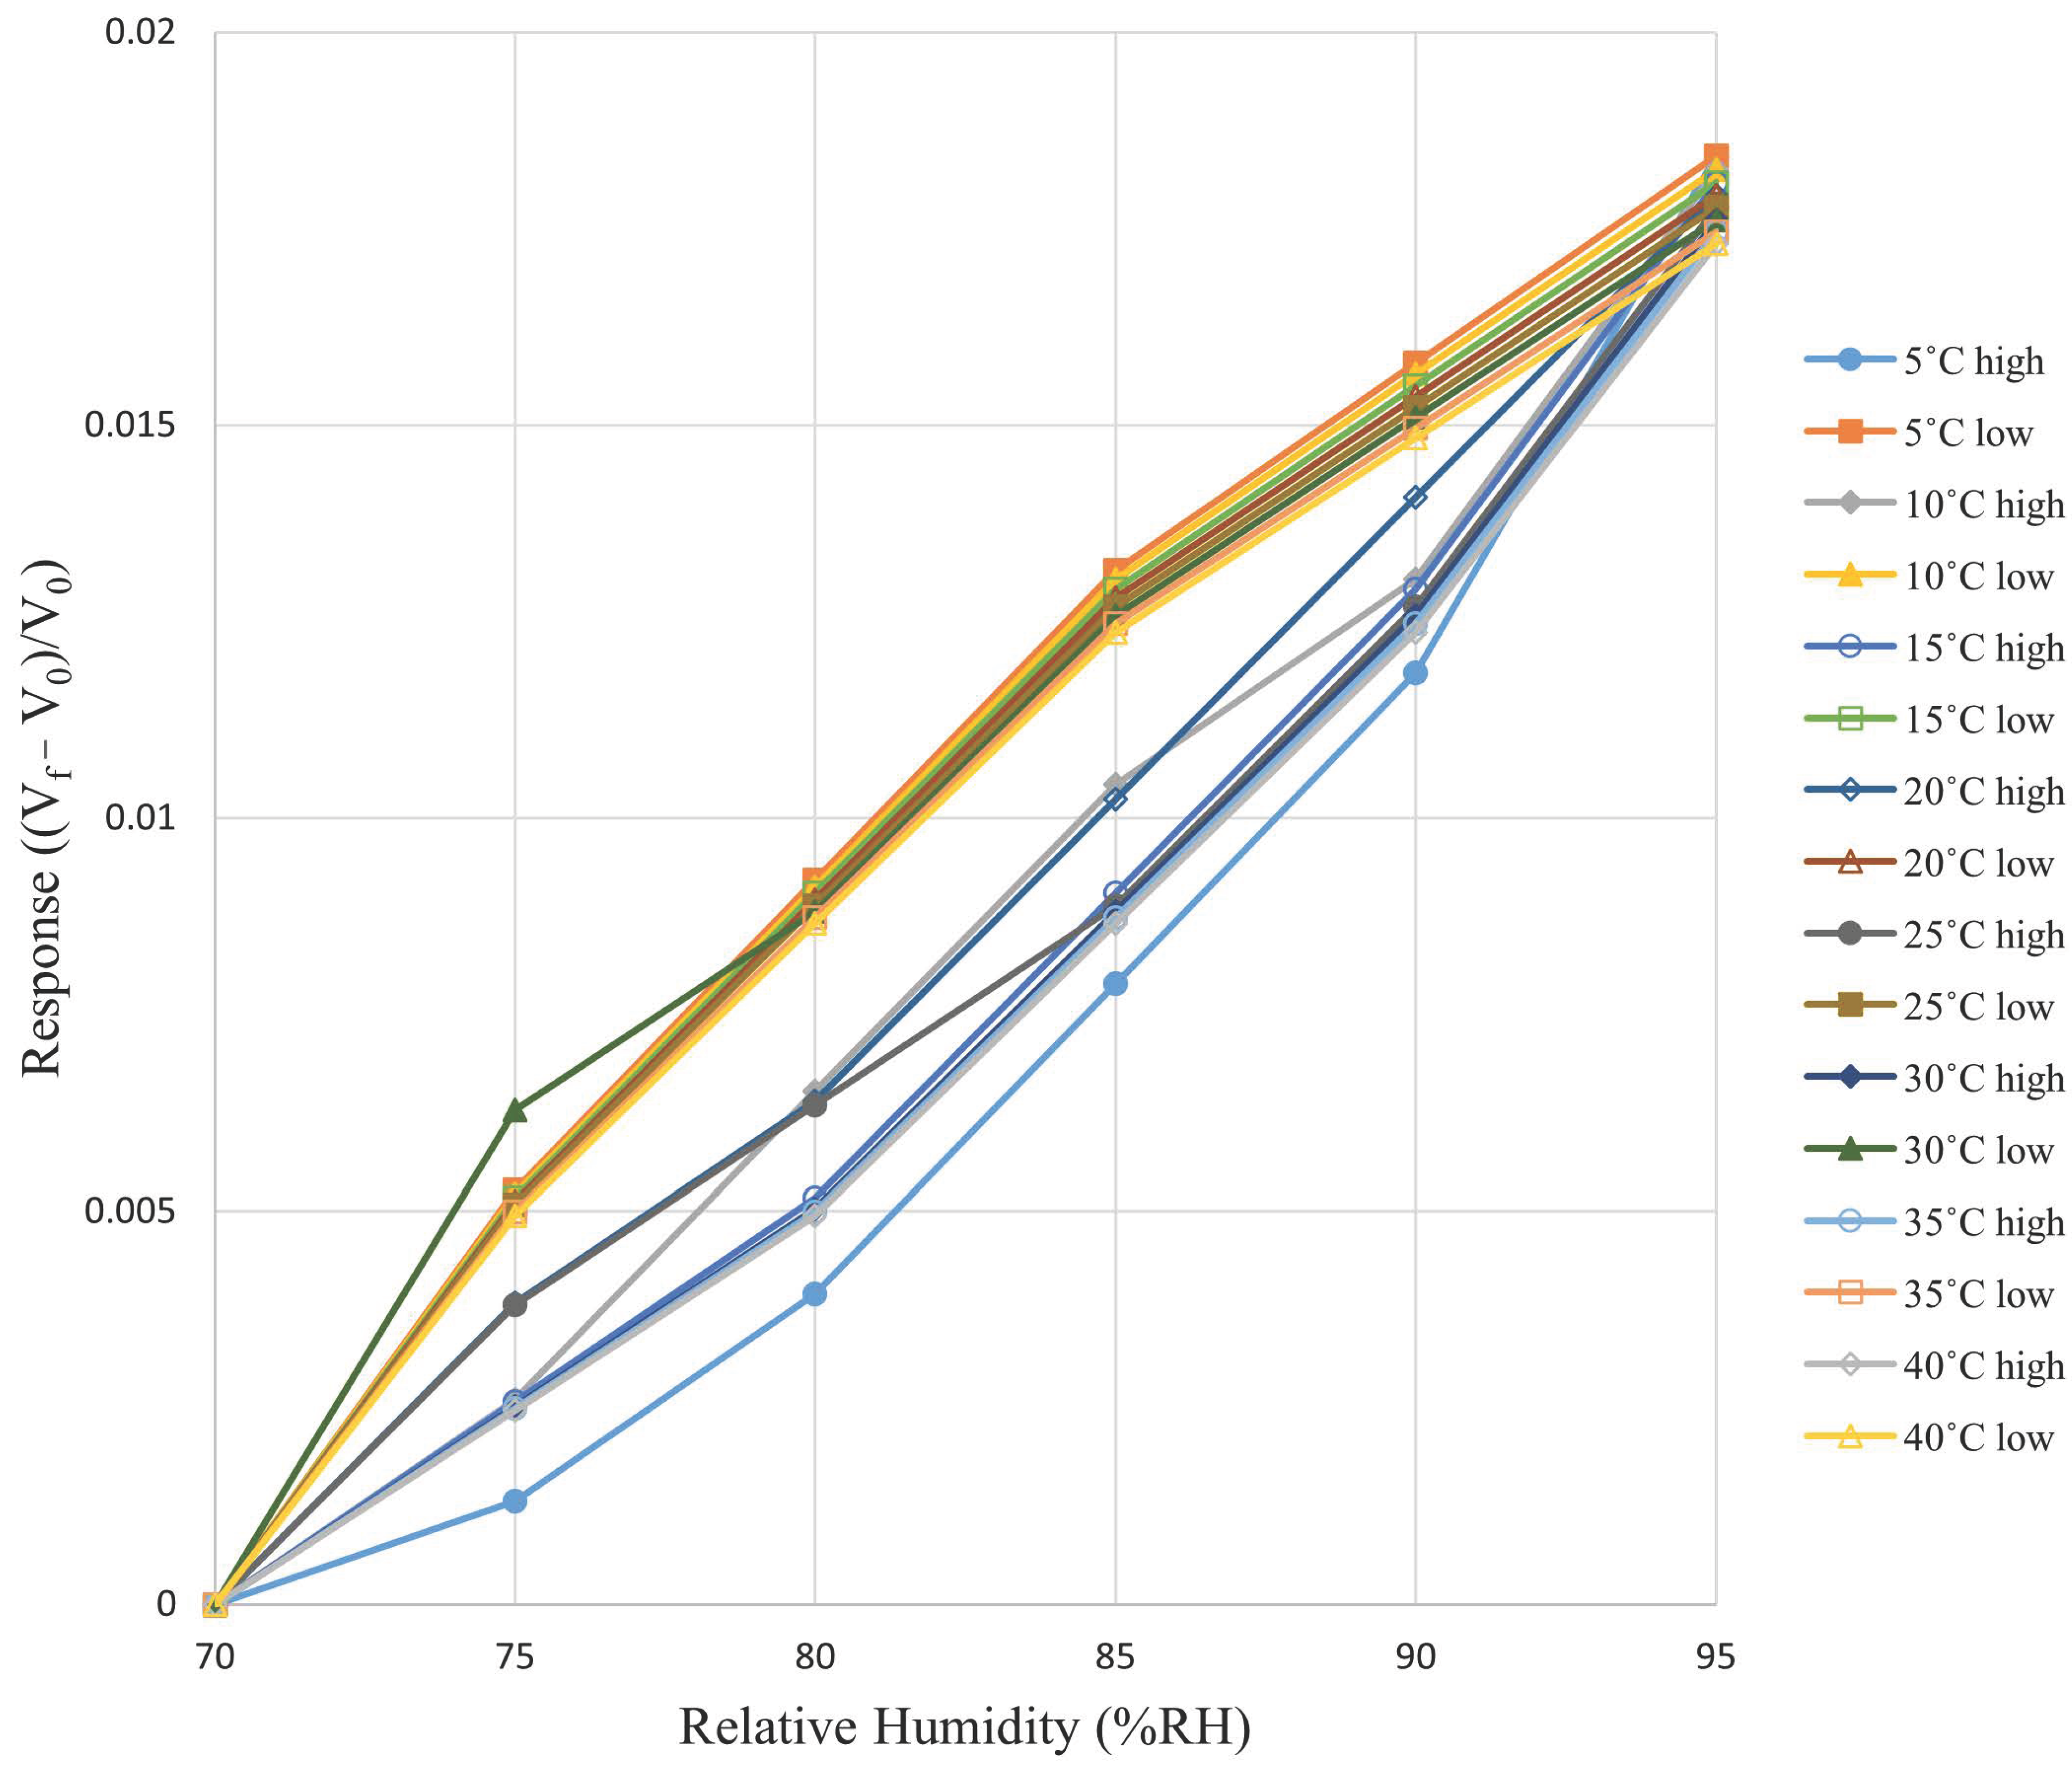
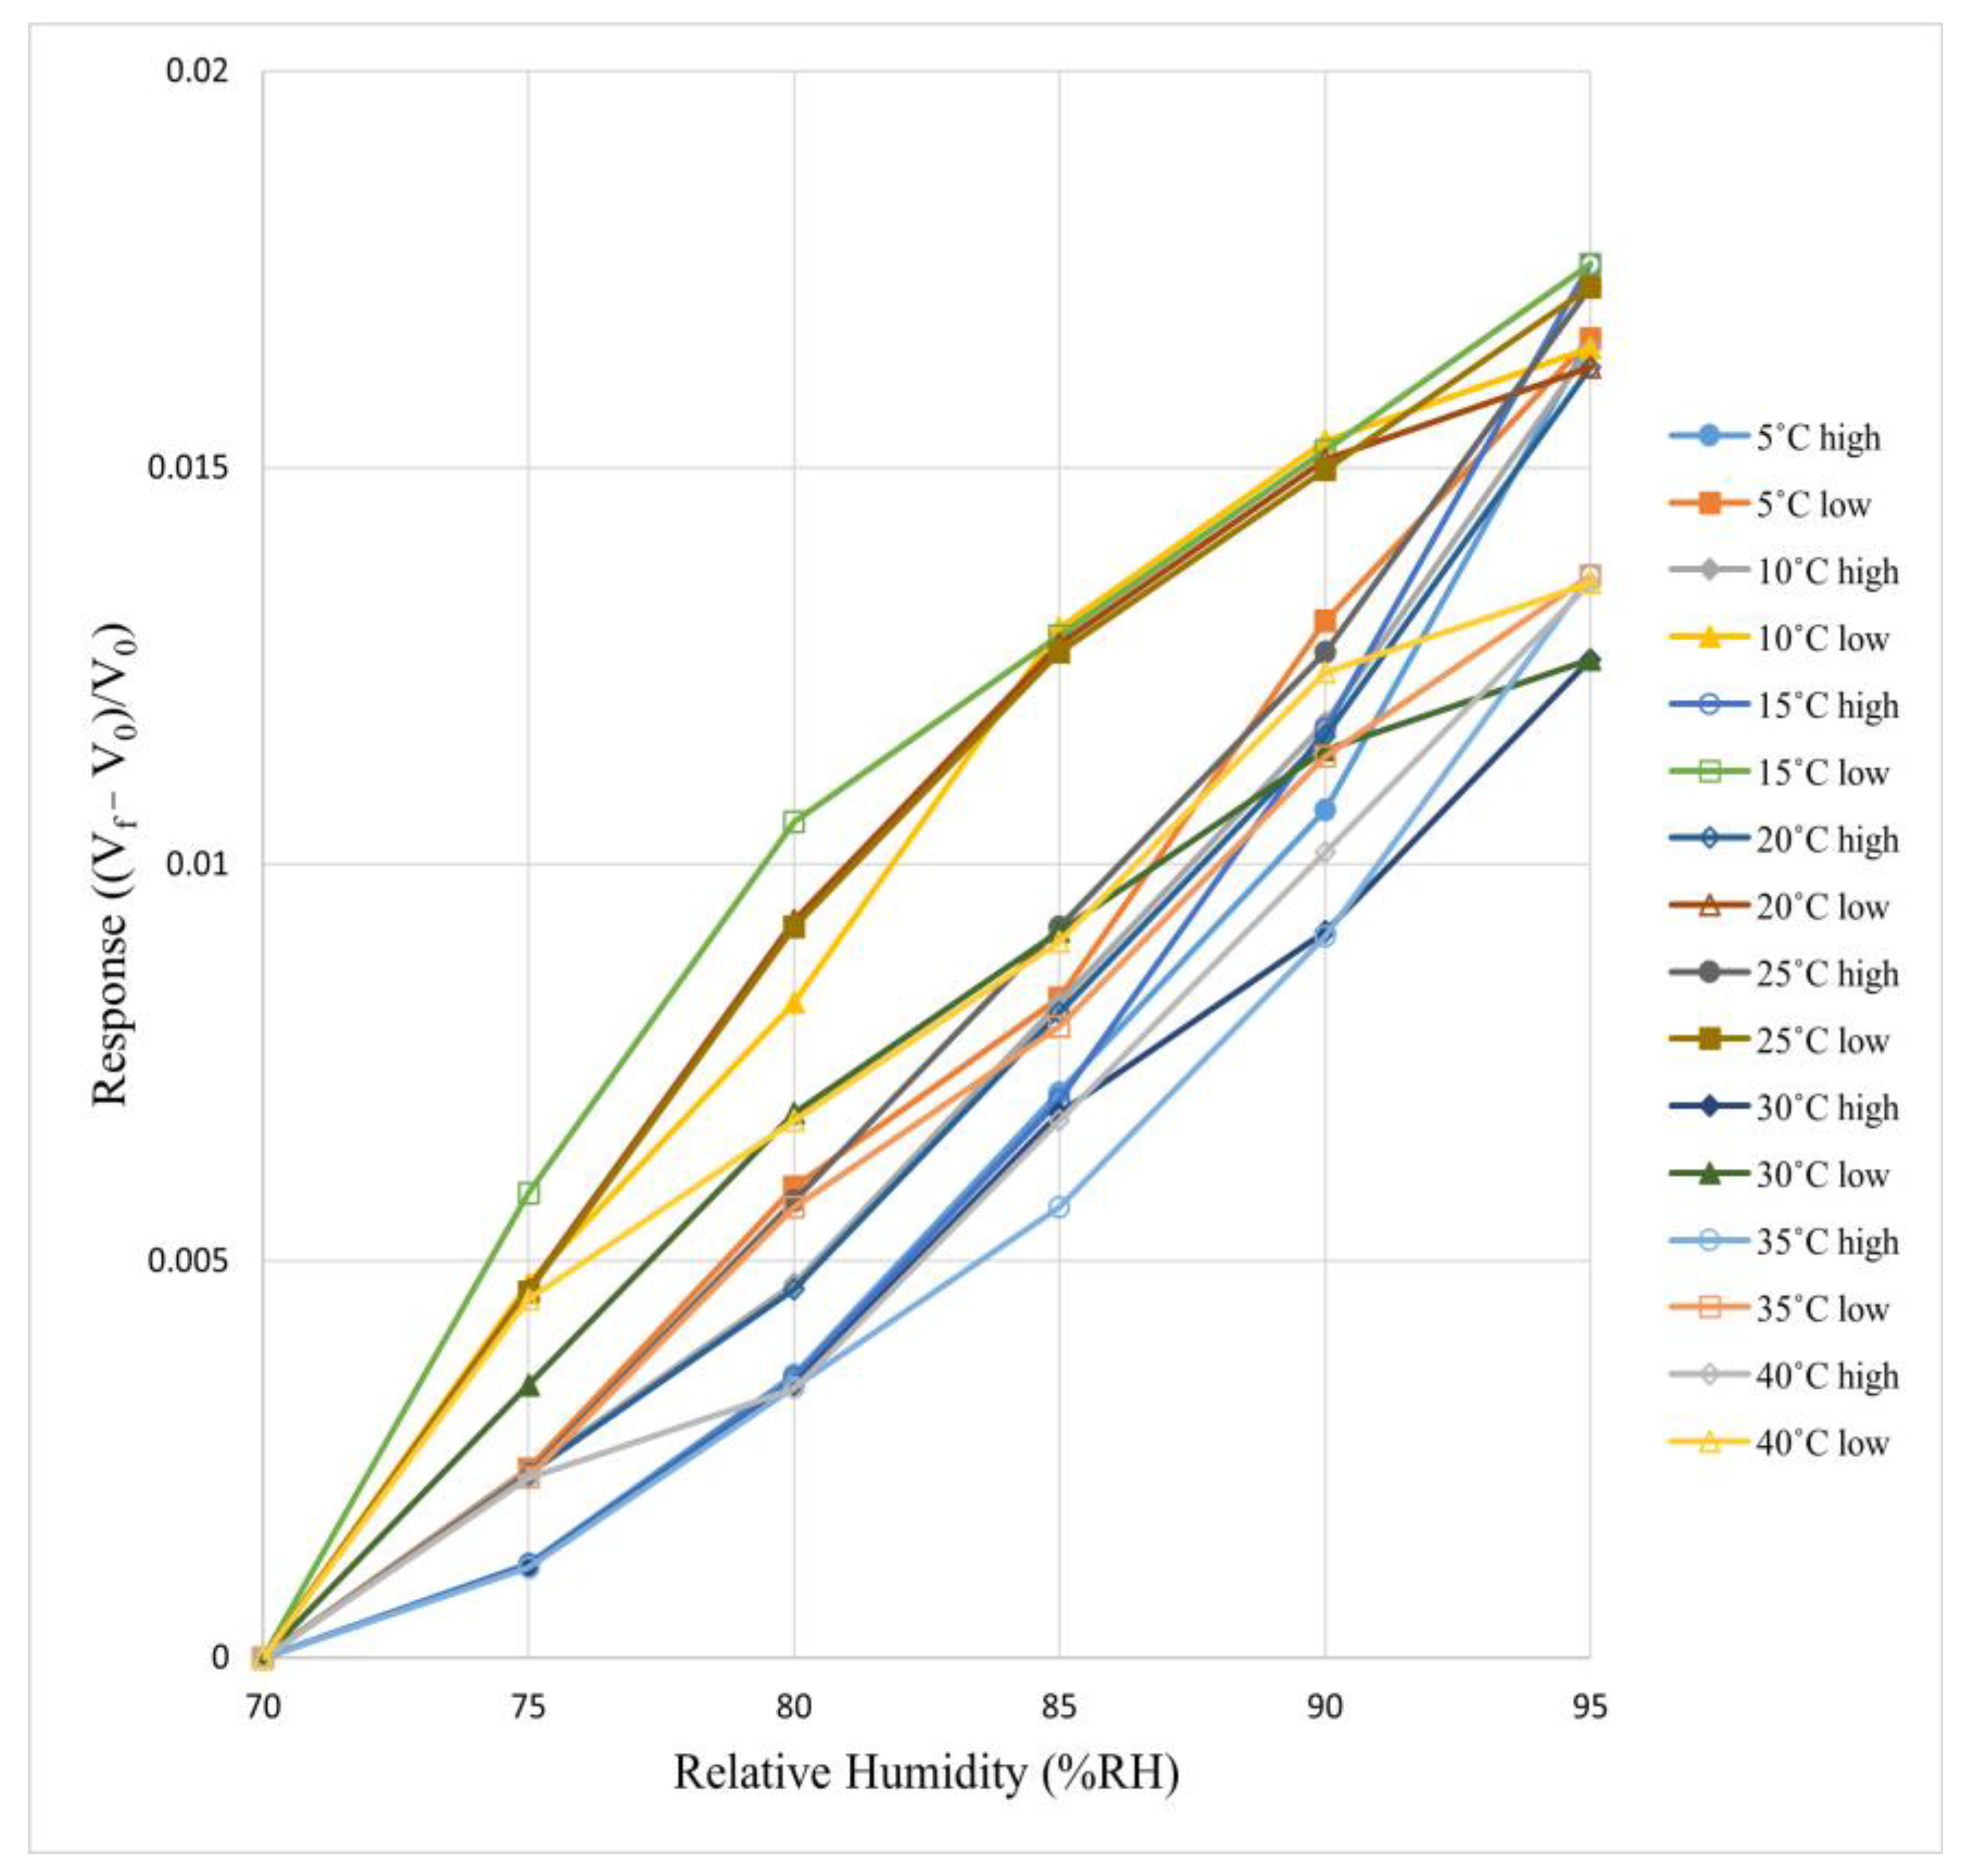
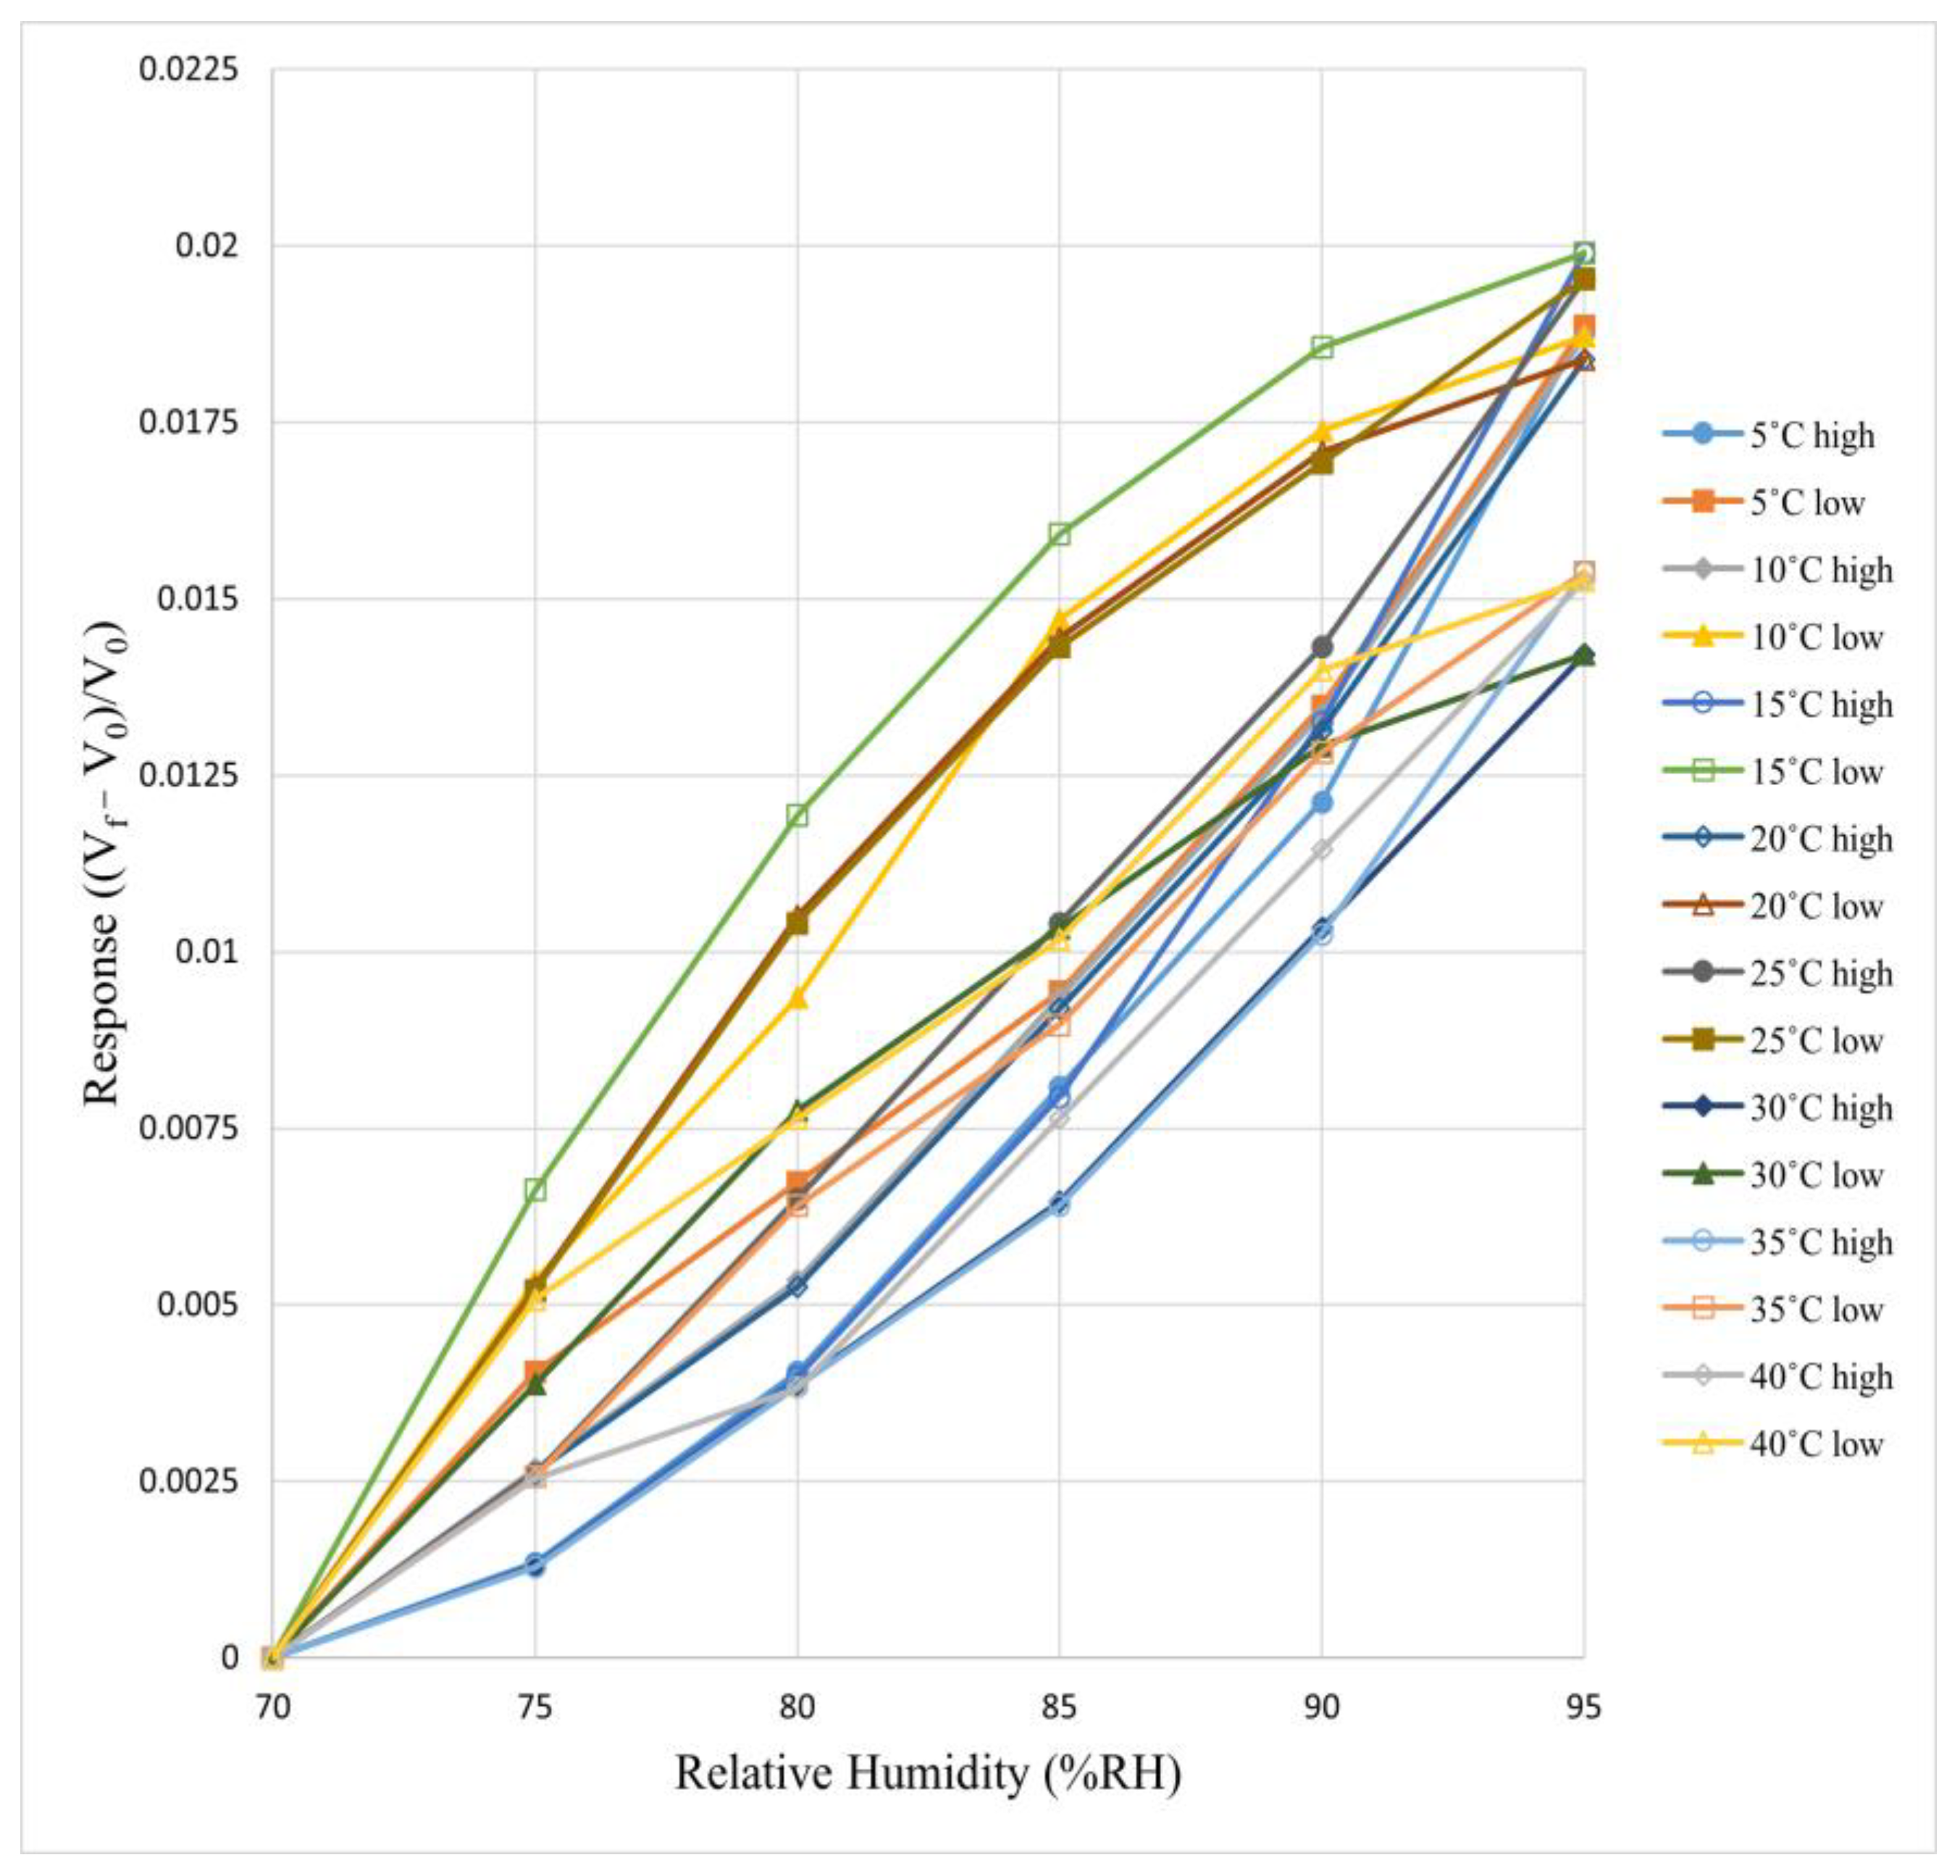
Four sets of micro-humidity sensors were placed within a programmable constant temperature and humidity testing system. The calibration curve demonstrates that the sensor and calibration instrument are highly accurate. The calibration range for the micro-humidity sensors spanned from 70% RH to 95% RH, with data gathered at intervals of 5% RH. Since temperature affects the resistance values of the micro-humidity sensors, this experiment calibrated the sensors at temperatures from 5 °C to 40 °C, with increments of 5 °C. Moreover, due to the hysteresis effect of hygroscopic materials, the resistance values at the same humidity level may exhibit slight variations during the humidification and dehumidification processes. Consequently, this experiment calibrated the micro-humidity sensors by transitioning from low humidity to high humidity and vice versa. After stabilizing for 30 min each time, the relationship curve between humidity and the corresponding raw voltage readings from the Arduino was documented, resulting in the calibration curve, which was subsequently normalized. As illustrated in Figure 9, Figure 10, Figure 11 and Figure 12, Vf denotes the voltage reading at the current humidity, while V0 indicates the voltage reading at 70% RH. The y-axis unit ((Vf − V0)/V0) signifies the dimensionless change in the voltage reading.
The calibration curve demonstrates that the three-in-one micro-sensor developed in this study exhibits a strong linear relationship and high sensitivity. A well-defined linear relationship ensures that the sensor can consistently and accurately reflect the correlation between input and output, minimizing the impact of nonlinear errors on data accuracy. High sensitivity enables the sensor to effectively detect small changes, improving measurement precision and reducing signal acquisition limitations, thereby showcasing its excellent performance. By analyzing the linear variations in the calibration plots, we can determine which of the four different-sized sensors performs best in terms of accuracy and overall performance. The results indicate that sensor 1 achieves the best performance in velocity measurements, while all four sensors exhibit excellent accuracy in temperature measurements. For humidity sensing, sensor 2 demonstrates superior performance. The exact reasons for these differences remain unclear. However, we speculate that variations in sensor dimensions, electrode thickness, or protective layer thickness during the manufacturing process may influence the sensing of physical quantities. This observation provides valuable insight for future research directions.
Experimental comparisons indicate that even with a ±5% deviation in electrode thickness, the calibration curves retain high linearity and stable sensitivity (within ±5%), and the overall response trend remains unaffected. This robustness is consistent with MEMS design tolerance rules and confirms the optimization results of the Taguchi Method. Normalized dimensionless calibration curves ((Vf − V0)/V0) were used instead of absolute voltage responses to eliminate baseline offsets among different sensor batches, providing a clearer comparison of linearity and sensitivity. Each sensor was calibrated three times, with an average measurement error of approximately 3%, ensuring that repeatability and sensitivity could be effectively demonstrated without excessive redundancy in the plots.

3. Results and Discussion

3.1. Back-End Integration of Integrated Three-in-One Micro-Sensor with FPC

In previous implementations, micro-sensors mounted on ceramic circuit boards were prone to mechanical stress due to the rigidity and weight of both the ceramic substrate and the attached conductive wires. When embedded into confined spaces, this often led to bending of the assembly, which caused delamination of the adhesive layer, resulting in damage to the conductive gel and silver paste interconnects—ultimately compromising the sensor’s performance.
To address this issue, a flexible printed circuit (FPC) was developed as an alternative solution. The FPC uses polyimide (PI) as its substrate, offering excellent flexibility, chemical resistance, and thermal stability. The integrated three-in-one micro-sensor was carefully trimmed to a minimal footprint and then bonded onto the FPC to ensure a compact and robust connection. This integration approach significantly improves mechanical compliance and durability during installation and long-term operation. The completed back-end integration is illustrated in Figure 13.

3.2. Integrated Three-in-One Micro-Sensor Packaging

To ensure secure installation and long-term operation within the HVAC cold air duct, the sensor packaging was designed to interface with the manufacturer’s existing mounting mechanism. Additionally, the packaging needed to withstand the oil-contaminated environment typically found inside such ducts. To meet these requirements, a customized package was fabricated using 3D printing technology.
The selected packaging material is poly(ethylene terephthalate-co-1,4-cyclohexylenedimethylene terephthalate), known for its excellent chemical resistance and mechanical strength [23]. The design allows the integrated three-in-one micro-sensor to be firmly fixed within the duct mechanism while protecting it from mechanical and chemical degradation. After assembly, the microsensor is inserted into the 3D-printed housing and securely locked in place, as illustrated in Figure 14.

3.3. Performance Comparison of the Four Sets of Self-Made Integrated Three-in-One Micro-Sensors

Prior to installation, the self-fabricated integrated three-in-one micro-sensor and the two commercially available velocity sensors underwent preliminary performance and oil-resistance tests to ensure suitability for the HVAC environment. To enhance protection against oil contamination, a layer of epoxy resin was applied to both the front and back sides of each sensor’s solder joints. Once fully cured in ambient conditions, the epoxy formed a protective barrier against oil penetration.
After epoxy coating, the terminal blocks of all sensors were wired to a shared power supply, enabling simultaneous operation. The full circuit was then interfaced with an Arduino microcontroller for data acquisition. Finally, the sensors were installed into the cold air duct of the HVAC system, as illustrated in Figure 15.
The monitoring data can be collected after the overall installation is completed. The wireless monitoring data communication protocol uses Message Queuing Telemetry Transport (MQTT) to connect the server installed in the factory and the internal network of the factory. Node-RED is used to connect the intranet to read data. The receiving time is set as collecting once every 15 s, as required by the manufacturer.
To evaluate the reliability of the four sets of custom-built integrated three-in-one micro-sensors, a comparison of the monitoring data from the four sets of micro-velocity sensors was conducted. Table 3 shows a comparison of specifications between the integrated three-in-one micro-sensor and the commercial sensor. As illustrated in Figure 16, the variation for the custom micro-velocity sensor (sensor 1) was ±300 mm/s, while for sensor 2, it was ±400 mm/s; for sensor 3, it was ±450 mm/s; for sensor 4, it was ±500 mm/s; for the F660 commercial velocity sensor, it was ±800 mm/s; and for the FS7.0.1L.195 commercial velocity sensor, it was ±1000 mm/s. Notably, the FS7.0.1L.195 commercial velocity sensor can only measure velocity, while the F660 commercial velocity sensor can only measure velocity and temperature. The self-made integrated three-in-one micro-sensor accounts for ambient temperature and humidity, utilizing different calibration curves to determine wind speed, which enhances its accuracy compared to commercial wind speed sensors. These results indicate that the precision of the custom micro-velocity sensor (sensor 1) exceeds that of the other three sets, demonstrating stable performance that enables more accurate real-time monitoring of data within HVAC cold air ducts. This improvement leads to better environmental management, increasing the quality and reliability of processed materials, thus confirming that the Taguchi Method effectively enhances the reliability of the custom-integrated three-in-one micro-sensor.
Although long-term durability testing, such as thermal cycling or environmental aging, was not conducted in this study, the application of the Taguchi Method has contributed to the enhancement of the sensor’s durability through process robustness. Specifically, by identifying optimal fabrication parameters—such as electrode area, electrode thickness, and protective layer thickness—the method reduces the influence of structural defects and material inconsistencies that often lead to failure over time. This process-level optimization minimizes internal stress, delamination, and degradation caused by environmental variations such as temperature or humidity changes. As a result, although indirect, the improved stability and consistency of sensor output under different test conditions suggest that the Taguchi Method strengthens the underlying durability of the fabricated micro-sensors.

4. Conclusions

Currently, research on utilizing the Taguchi Method as a tool for optimizing sensor manufacturing processes remains limited. Therefore, this study applies the Taguchi Method to fine-tune the process parameters of sensor fabrication. Compared to previous research results, the method has demonstrated significant improvements in reliability and durability. Additionally, the reduction in sensor size not only lowers manufacturing costs but also facilitates sensor deployment in various locations. This proves that the Taguchi Method is highly effective in enhancing sensor manufacturing processes.
To enhance the quality and reliability of process materials, it is essential to monitor key environmental factors in real time within the cold air duct, such as wind speed, temperature, and humidity. Analyzing these three critical physical parameters enables the determination of optimal internal environment control settings.
This research successfully achieved real-time wireless monitoring of wind speed, temperature, and humidity within HVAC cold air ducts while also establishing a comprehensive database. A systematic approach was employed to identify the necessary sensors for monitoring the cold air duct’s internal environment, including their optimal locations and quantities. Additionally, an evaluation and procurement process for commercially available wireless sensors with varying specifications was carried out. A wireless integrated three-in-one micro-sensor (measuring wind speed, temperature, and humidity) was developed, and both software and hardware were integrated to optimize the deployment and data collection of both commercially available wireless sensors and the self-developed three-in-one micro-sensors. Finally, joint field verification and data comparison were conducted to refine the internal environment control of HVAC cold air ducts, ultimately improving the quality and reliability of process materials.

Author Contributions

Methodology, J.-S.S.; data curation, G.-Q.H., C.-K.L., N.C. and C.-H.C.; writing—original draft, C.-Y.L. All authors have read and agreed to the published version of the manuscript.

Funding

The authors would like to thank the National Science and Technology Council of R.O.C. for its financial support through the grants MOST 110-2221-E-155-061 and 111-2221-E-155-048. The authors also would like to thank the Far Eastern Fibertech Co., Ltd. and YZU Fuel Cell Center and NENS Common Lab for providing access to their research facilities.

Data Availability Statement

The original contributions presented in this study are included in the article. Further inquiries can be directed to the corresponding author.

Conflicts of Interest

The authors declare no conflicts of interest. The funders had no role in the design of the study; in the collection, analyses, or interpretation of data; in the writing of the manuscript; or in the decision to publish the results.

References

  1. JMP. Introduction to Design of Experiments (DOE): Classic Screening Design and Full Factorial Design. 2021. Available online: https://community.jmp.com/t5/JMP-Blog/%E5%AF%A6%E9%A9%97%E8%A8%AD%E8%A8%88-DOE-%E5%85%A5%E9%96%80%E7%B6%93%E5%85%B8%E7%AF%A9%E9%81%B8%E8%A8%AD%E8%A8%88%E8%88%87%E5%85%A8%E5%9B%A0%E5%AD%90%E8%A8%AD%E8%A8%88/ba-p/423195 (accessed on 8 October 2021).
  2. Jankovic, A.; Chaudhary, G.; Goia, F. Designing the design of experiments (DOE)—An investigation on the influence of different factorial designs on the characterization of complex systems. Energy Build. 2021, 250, 111298. [Google Scholar] [CrossRef]
  3. Bell, S. Experimental design. Int. Encycl. Hum. Geogr. 2009, 10, 672–675. [Google Scholar] [CrossRef]
  4. Wang, Z.; Yi, Z.; Qin, M.; Huang, Q.-A.; Zhou, Z.-F. Linearity and sensitivity analysis of MEMS thermal wind sensor via analytical model. IEEE Trans. Instrum. Meas. 2023, 72, 1109–1118. [Google Scholar] [CrossRef]
  5. Agrawal, V.K.; Patel, R.; Boolchandani, D.; Varma, T.; Rangra, K. Sensitivity and reliability enhancement of a MEMS based wind speed sensor. Microelectron. Reliab. 2020, 104, 2714–2720. [Google Scholar] [CrossRef]
  6. Xu, Q.; Lu, Y.; Zhao, S.; Hu, N.; Jiang, Y.; Li, H.; Wang, Y.; Gao, H.; Li, Y.; Yuan, M.; et al. A wind vector detecting system based on triboelectric and photoelectric sensors for simultaneously monitoring wind speed and direction. Nano Energy 2021, 89, 106382. [Google Scholar] [CrossRef]
  7. Yi, Z.; Wang, Y.; Qin, M.; Huang, Q. Research on dust effect for mems thermal wind sensors. Sensors 2023, 23, 5533. [Google Scholar] [CrossRef] [PubMed]
  8. Yi, Z.; Wan, Y.; Qin, M.; Huang, Q.-A. Quadruple sensitivity improvement for wind speed sensor using dual-layer bended inductors. Sens. Actuators A Phys. 2020, 303, 111786. [Google Scholar] [CrossRef]
  9. Mu, Y.; Liu, M.; Ma, Z.; Zhang, J. Resistance characteristic analysis based study on a novel damper torque airflow sensor for VAV terminals. Build. Environ. 2020, 175, 106813. [Google Scholar] [CrossRef]
  10. Ligęza, P. Static and dynamic parameters of hot-wire sensors in a wide range of filament diameters as a criterion for optimal sensor selection in measurement process. Measurement 2020, 151, 107177. [Google Scholar] [CrossRef]
  11. Hao, L.; Xiao, X.; Wu, Y.; Zhang, K.; Li, R.; Tian, H.; Ma, Y.; Ma, L. Fast response temperature sensor based on reduced graphene oxide through electron beam direct writing. Sens. Actuators A Phys. 2024, 376, 115669. [Google Scholar] [CrossRef]
  12. Miao, F.; Zhang, X.; Tao, B.; Zhang, P. Wireless chipless RFID temperature and humidity sensor based on Fe2O3-Co3O4/SnO2/rGO composites. Mater. Sci. Eng. B 2024, 307, 117549. [Google Scholar] [CrossRef]
  13. Lin, S.; Wang, F.; Qu, Y.; Han, X.; Zhang, Y. Discharge splicing-free ultra-highly sensitive fiber-optic temperature sensor based on PDMS and the Vernier effect. Sens. Actuators A Phys. 2024, 376, 115653. [Google Scholar] [CrossRef]
  14. Xu, Y.; Zhao, X.; Li, Y.; Qin, Z.; Pang, Y.; Liu, Z. Simultaneous measurement of relative humidity and temperature based on forward Brillouin scattering in polyimide-overlaid fiber. Sens. Actuators B Chem. 2021, 348, 130702. [Google Scholar] [CrossRef]
  15. Pan, J.; Liu, S.; Zhang, H.; Lu, J. A flexible temperature sensor array with polyaniline/graphene–polyvinyl butyral thin film. Sensors 2019, 19, 4105. [Google Scholar] [CrossRef] [PubMed]
  16. Tursunniyaz, M.; Meredith, A.; Andrews, J. Aerosol jet printed resistive temperature sensors with high sensitivity. Sens. Actuators A Phys. 2023, 364, 114777. [Google Scholar] [CrossRef]
  17. Tursunniyaz, M.; Agarwal, V.; Meredith, A.; Andrews, J. Hybrid nanomaterial inks for printed resistive temperature sensors with tunable properties to maximize sensitivity. Nanoscale 2023, 1, 166118–166129. [Google Scholar] [CrossRef] [PubMed]
  18. Liu, J.; Zhao, Z.; Fang, Z.; Liu, Z.; Zhu, Y.; Du, L. High-performance FBAR humidity sensor based on the PI film as the multifunctional layer. Sens. Actuators B Chem. 2020, 308, 127694. [Google Scholar] [CrossRef]
  19. Mu, Y.; Jin, P.; Zheng, L.; Wang, C.; Hou, Y.; Liu, W.; Si, L.; Liu, Z. An enhanced MEMS-based polyimide capacitive-type relative-humidity sensor with halloysite nanotube as a modifier. Microchem. J. 2023, 191, 108934. [Google Scholar] [CrossRef]
  20. Li, Z.; Dong, B.; Chen, E.; Li, Y.; Zhao, W.; Wang, Y.; Gao, C. High sensitivity FBG humidity sensor coated with graphene and polyimide films. Opt. Fiber Technol. 2021, 66, 102635. [Google Scholar] [CrossRef]
  21. Zhu, J.; Cao, Y.; Chen, H.; Fan, B.; Zou, X.; Cheng, J.; Zhang, C. Rapid-response humidity sensors based on ultra-thin films stacked with single-layer graphene oxide. Results Chem. 2024, 7, 101444. [Google Scholar] [CrossRef]
  22. Che, X.Y.; Mei, S.X.; Zhao, W.; Zhang, Y.C.; Zhang, X.M.; Cui, Z.; Fu, P.; Pang, X.C.; Liu, M.Y.; Ye, Y. Thermoplastic polyamide elastomer based flexible humidity sensor for breath monitoring. Mater. Des. 2023, 235, 112438. [Google Scholar] [CrossRef]
  23. Zhang, H.-W.; Xu, X.; Huang, M.-L.; Wang, Y.-S.; Xu, Z.-Q.; Feng, Z.-S.; Zhang, Y. Interlayer cross-linked MXene enables ultra-stable printed paper-based flexible sensor for real-time humidity monitoring. Chem. Eng. J. 2024, 495, 153343. [Google Scholar] [CrossRef]
  24. Lee, C.-Y.; Shieh, J.-S.; Chen, J.; Wang, X.-W.; Liu, C.-K.; Wei, C.-H. The application of a self-made integrated three-in-one microsensor and commercially available wind speed sensor to the cold air pipe of the heating, ventilation, and air conditioning in a factory for real-time wireless measurement. Sensors 2023, 23, 4471. [Google Scholar] [CrossRef] [PubMed]
  25. Keshavarzi, M.; Hasani, J.Y. Design and optimization of fully differential capacitive MEMS accelerometer based on surface micromachining. Microsyst. Technol. 2019, 25, 1369–1377. [Google Scholar] [CrossRef]
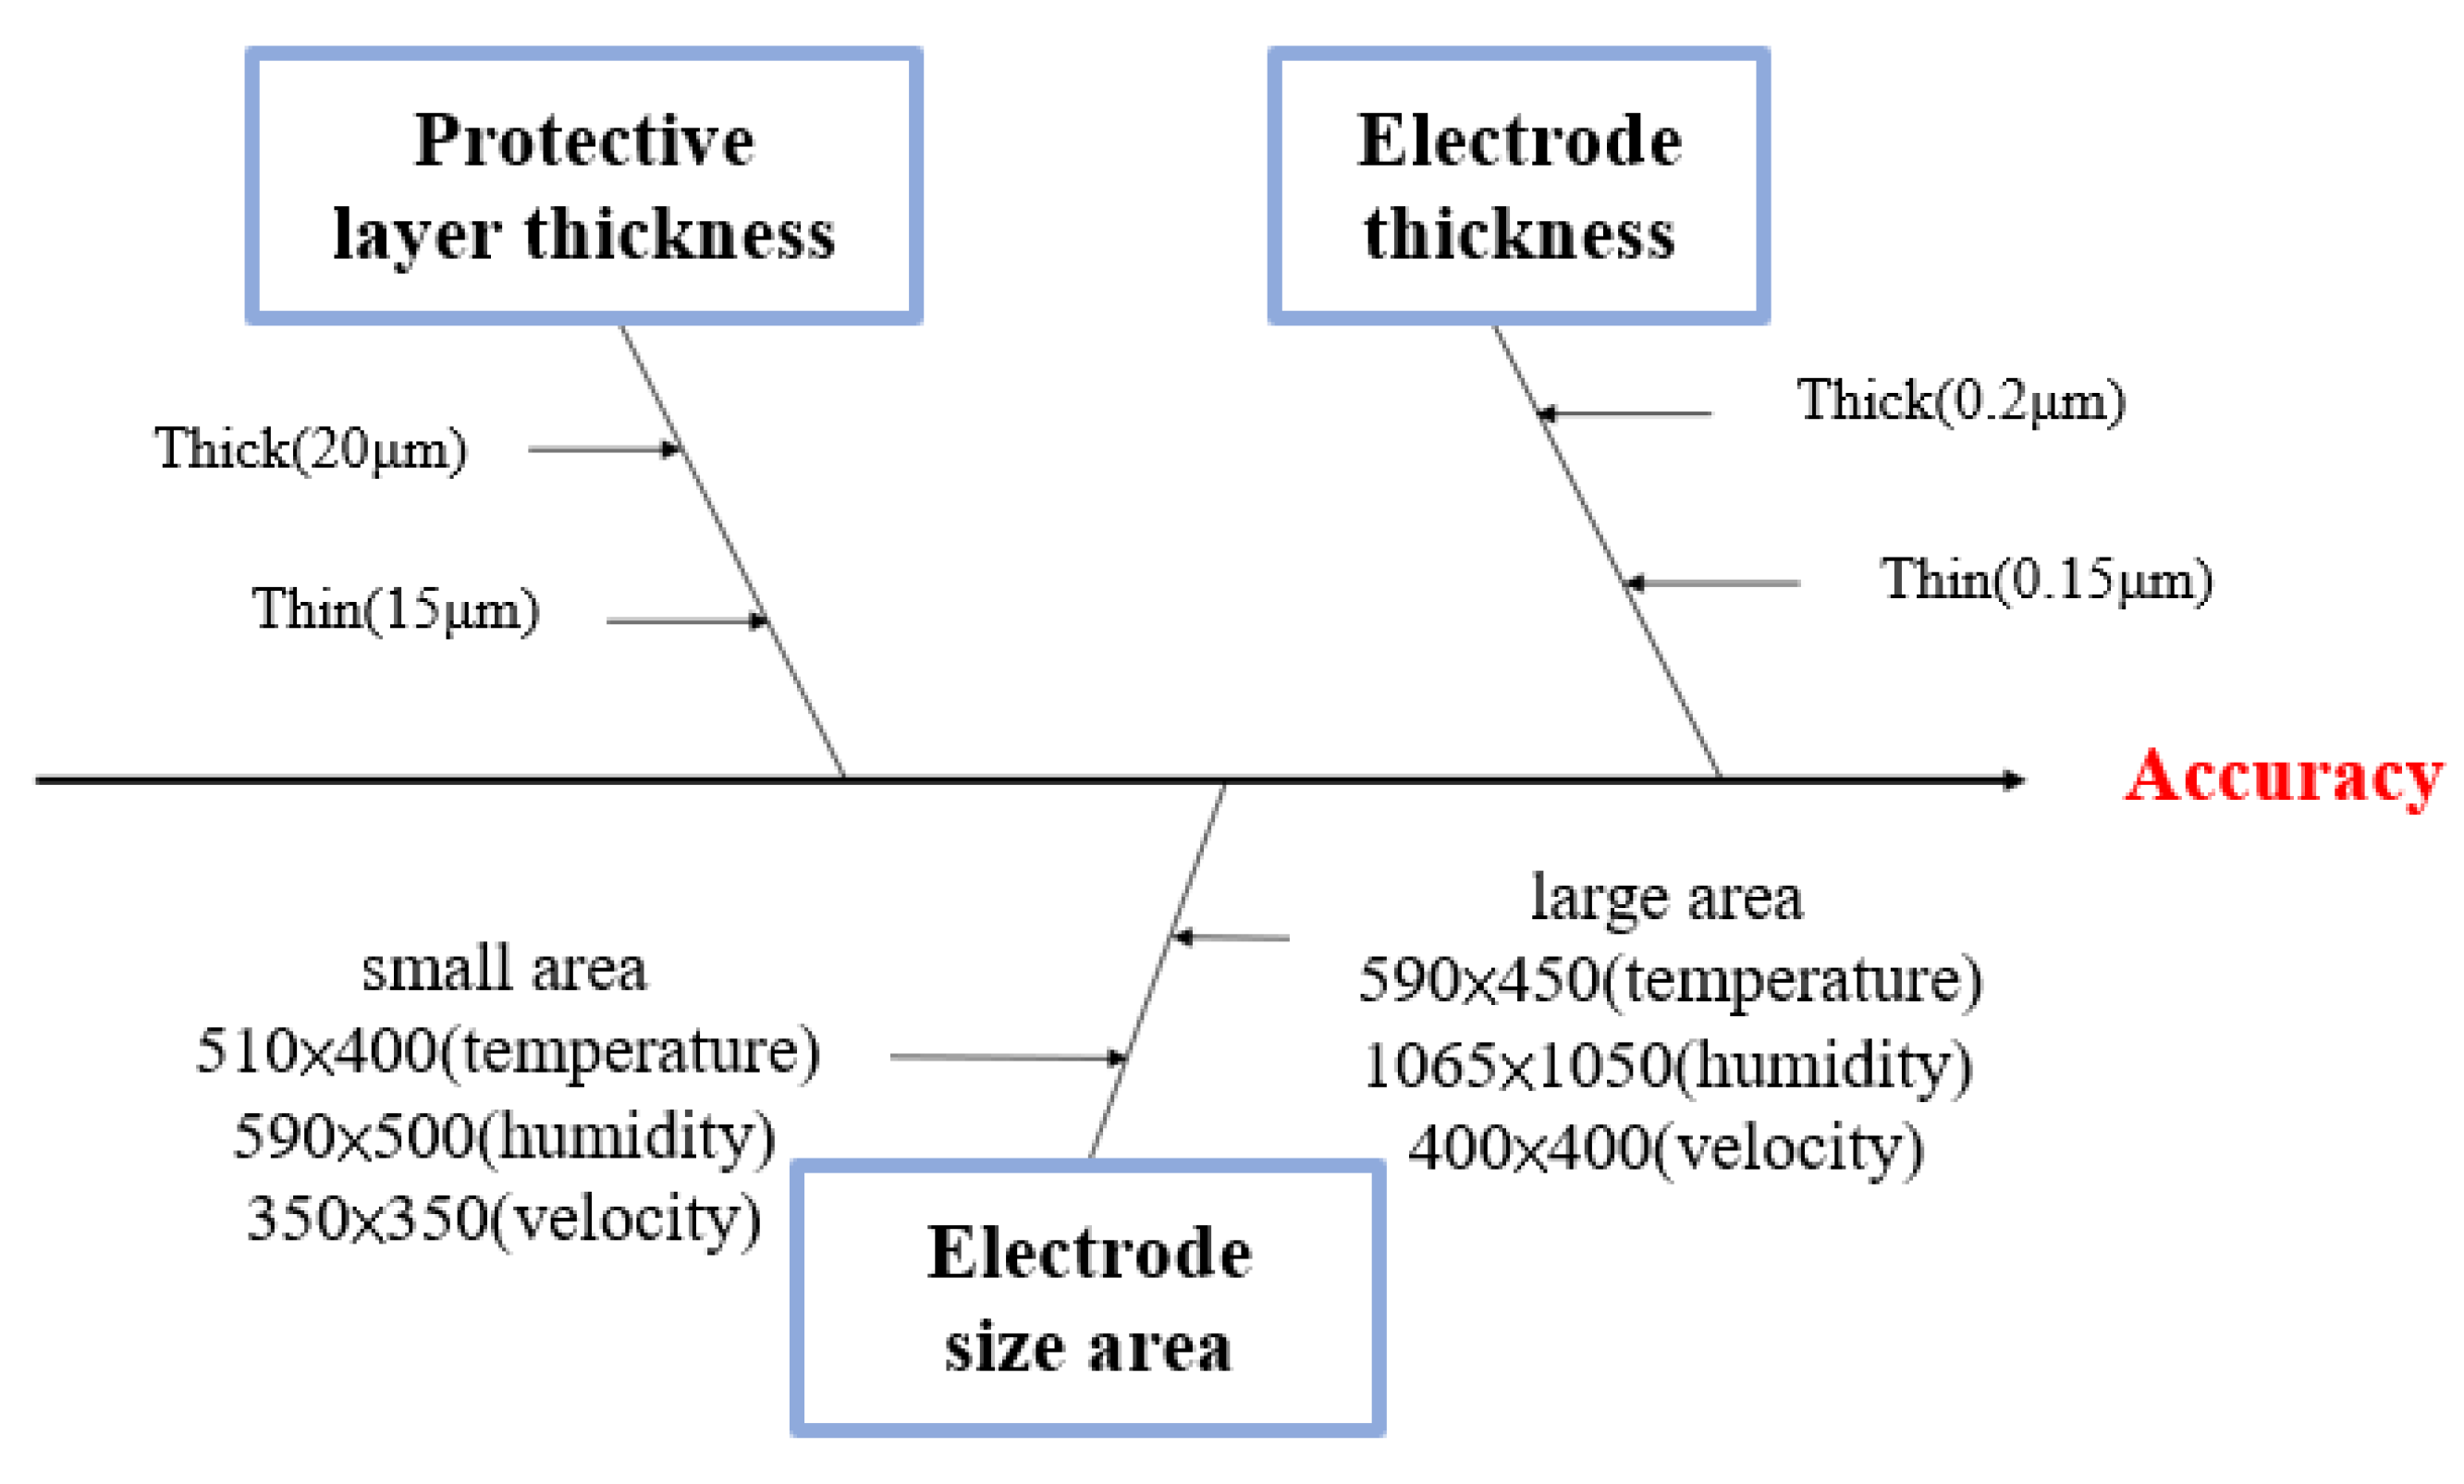
Figure 1. Process parameter factor analysis chart.
Processes 13 02852 g001
Figure 2. Two design diagrams of the integrated three-in-one micro-sensor: (a) first type; (b) second type.
Processes 13 02852 g002
Figure 3. Flowchart for the fabrication process of an integrated three-in-one micro-sensor: (a) cleaning and fixing of polyimide film; (b) coating; (c) exposure; (d) evaporation; (e) lift off; (f) protective layer fabrication; (g) dielectric layer fabrication.
Processes 13 02852 g003
Figure 4. Calibration curve of the micro-velocity sensor (dimensionless) (sensor 1).
Processes 13 02852 g004
Figure 5. Calibration curve of the micro-velocity sensor (dimensionless) (sensor 2).
Processes 13 02852 g005
Figure 6. Calibration curve of the micro-velocity sensor (dimensionless) (sensor 3).
Processes 13 02852 g006
Figure 7. Calibration curve of the micro-velocity sensor (dimensionless) (sensor 4).
Processes 13 02852 g007
Figure 8. Calibration curve of the micro-temperature sensor (dimensionless).
Processes 13 02852 g008
Figure 9. Calibration curve of the micro-humidity sensor (dimensionless) (sensor 1).
Processes 13 02852 g009
Figure 10. Calibration curve of the micro-humidity sensor (dimensionless) (sensor 2).
Processes 13 02852 g010
Figure 11. Calibration curve of the micro-humidity sensor (dimensionless) (sensor 3).
Processes 13 02852 g011
Figure 12. Calibration curve of the micro-humidity sensor (dimensionless) (sensor 4).
Processes 13 02852 g012
Figure 13. Back-end integration of integrated three-in-one micro-sensor with FPC.
Processes 13 02852 g013
Figure 14. Packaging of integrated three-in-one micro-sensor.
Processes 13 02852 g014
Figure 15. Installing sensors in the HVAC cold air duct.
Processes 13 02852 g015
Figure 16. The 624 h monitoring data of commercial velocity sensors FS7.0.1L.195 and F660 and four sets of self-made micro-velocity sensors.
Processes 13 02852 g016
Table 1. L4 orthogonal array.
Electrode Area (μm)Electrode Thickness (μm)Protective Layer Thickness (μm)
Sensor 1510 × 400 (temperature)
590 × 500 (humidity)
350 × 350 (velocity)
0.220
Sensor 2510 × 400 (temperature)
590 × 500 (humidity)
350 × 350 (velocity)
0.1515
Sensor 3590 × 450 (temperature)
1065 × 1050 (humidity)
400 × 400 (velocity)
0.215
Sensor 4590 × 450 (temperature)
1065 × 1050 (humidity)
400 × 400 (velocity)
0.1520
Table 2. Sensing principle of flexible three-in-one micro-sensor.
Micro-temperature sensorProcesses 13 02852 i001This study uses a Resistance Temperature Detector (RTD) with a snake-shaped electrode to increase resistance. The temperature-sensitive resistance material is gold (Au), which has stable chemical properties, a simple manufacturing process, and high linearity.
Micro-humidity sensorProcesses 13 02852 i002This study uses a resistive humidity sensor. Its electrode type is an interdigitated electrode structure. There is a moisture-sensing material film (PI 9305, Fujifilm, Tokyo, Japan) above the electrode. When the moisture absorbed by the moisture-sensing film increases, its dielectric constant It will also increase as the ambient humidity increases. The moisture-sensitive film material is PI 9305, which has stable chemical properties and high linearity in moisture-sensing characteristics.
Micro-velocity sensorProcesses 13 02852 i003This study uses a snake-shaped hot-wire micro-velocity sensor. The main measurement structure of the hot-wire micro-velocity sensor is a resistance heater. The power supply is used to provide a constant voltage input to generate a heat source so that the electrode becomes a resistance heater, generating stable temperature field. When the gas increases with the wind speed and the heat is taken away, the resistance value of the heater will decrease accordingly. The resistance material is gold (Au), which has stable chemical properties, a simple manufacturing process, and high linearity.
Table 3. A comparison of specifications between two commercially available velocity sensors and the integrated three-in-one micro-sensor.
F660FS7.0.1L.195Integrated
Three-in-One
Micro-Sensor
Sensing range0.15~20 m/s0~100 m/s0.15~20 m/s
Accuracy±5%<3%±3%
Response time400 ms200 ms1 ms
Measuring physical quantitiesVelocity and temperatureVelocityVelocity, temperature, and humidity
priceNT4000NT560NT535
Disclaimer/Publisher’s Note: The statements, opinions and data contained in all publications are solely those of the individual author(s) and contributor(s) and not of MDPI and/or the editor(s). MDPI and/or the editor(s) disclaim responsibility for any injury to people or property resulting from any ideas, methods, instructions or products referred to in the content.