Article

Energy Management for Integrated Energy System Based on Coordinated Optimization of Electric–Thermal Multi-Energy Retention and Reinforcement Learning

State Grid Shandong Electric Power Company, Electric Power Science Research Institute, Jinan 250003, China
*
Author to whom correspondence should be addressed.
Processes 2025, 13(9), 2693; https://doi.org/10.3390/pr13092693
Submission received: 12 May 2025 / Revised: 1 June 2025 / Accepted: 5 June 2025 / Published: 24 August 2025

Abstract

With the large-scale access to a large number of distributed electric and thermal flexible resources and multiple loads on the user side, the energy management of the integrated energy system (IES) has become an effective way for the efficient and low-carbon economic operation of energy systems. In order to explore a new mode of IES energy management with the participation of energy service providers (ESPs) and user clusters (UCs), this paper puts forward an energy management method for electric–thermal microgrids, considering the optimization of user energy consumption characteristics. Firstly, an energy management framework with multi-agent participation of ESP and user cluster is proposed, and a user energy preference model is established considering the user’s electricity and heat consumption preferences. Secondly, considering the operation benefit of ESP and user cluster, based on the reinforcement learning (RL) framework, an energy management model between ESPs and users is established, and a distributed solution algorithm combining Q-learning and quadratic programming is proposed. Finally, the IESs with different user scales and energy units are taken as the test system, and the optimal energy management strategy of the system, considering the user’s energy preference, is analyzed. The simulation results demonstrate that the energy management model proposed enhances the economic efficiency of IES operations and reduces emissions. In a test system with two UCs, the optimized system achieves a 5.05% reduction in carbon emissions. The RL-based distributed solution algorithm efficiently solves the energy management model for systems with varying UC scales, requiring only 6.55 s for systems with two UCs and 13.26 s for systems with six UCs.

1. Introduction

Amid growing environmental pressures and advancements in renewable energy technologies, countries worldwide are restructuring their energy mix to reduce dependence on conventional fossil fuels. Integrated energy systems (IESs) present an innovative solution to promote large-scale renewable energy adoption, leverage the complementary advantages of diverse energy sources, and ensure cost-effective, efficient energy network operations [1,2]. Within the IES framework, energy service providers (ESPs) and users serve as the primary stakeholders in energy transactions. ESP pricing strategies directly shape user consumption patterns, while users, in turn, respond dynamically to these pricing mechanisms. Since ESPs and users represent distinct stakeholders with differing interests, IES energy management involves complex benefit distribution and multi-stakeholder optimization challenges [3,4]. Consequently, establishing a fair energy pricing mechanism and system operation strategy—one that fully considers the interests of all stakeholders—has become a critical issue requiring urgent resolution.
In integrated energy systems (IES), users’ independent energy optimization behavior, known as integrated demand response (IDR), enables them to adjust multi-energy demand to achieve peak shaving and cost-saving effects [5,6]. Recent studies have explored various aspects of IDR in IES. For instance, the literature [7] proposes a two-stage optimization model of “open source and reducing expenditure” to give full play to the potential of multiple energy sources on the load side to participate in demand response (DR) to realize the low-carbon economic operation of the comprehensive energy system. Meanwhile, the literature [8] establishes low-carbon economic scheduling of integrated energy systems considering flexible supply–demand response and diversified utilization of hydrogen. In the literature [9], optimal hierarchical energy management in an integrated energy system is introduced, considering the variabilities associated with renewable energy resources, uncertain loads like electric vehicles, energy market interaction uncertainties, and a demand response program that relies on a robust optimization technique. The literature [10] provides a multi-objective solution that includes demand response scheduling and optimizes factors such as PV and WT capacities, energy storage strategies, battery usage, power exchange with the grid, and overall costs and environmental impacts. The literature [11] addresses these challenges by proposing a three-level demand response model for integrated energy systems structured to align grid and integrated energy system objectives through a hierarchical incentive system using a Stackelberg game framework. The literature [12] establishes a data center cluster framework composed of a DCC operator and data center prosumers. Furthermore, a two-stage energy-sharing model is developed, incorporating the IDR across multiple loads. In summary, the exploration of IDR in IES has demonstrated its significant potential to enhance energy efficiency, reduce operational costs, and promote sustainable energy utilization through diverse optimization strategies and models.
The effective management of integrated energy systems (IESs) depends on two crucial factors: (1) formulating optimal pricing strategies for energy service providers (ESPs) to maintain a balance between supply and demand and (2) achieving operational optimization to improve efficiency, cost-effectiveness, and reliability. These challenges become more intricate with the integration of distributed energy resources (DERs), demand-side management (DSM) strategies, and multi-energy coupling within contemporary smart grids. The literature [13] presents a real-time monitoring approach to electric vehicle (EV) charging dynamics with battery storage support over a 24 h period. By simulating EV demand, state of charge (SOC), and charging/discharging events, this study provides insights into operational strategies for energy storage systems to maximize the charging simultaneity factor through internal power enhancement. The literature [14] investigates the practical impact of price-based demand-side management (DSM) for occupants in an office building connected to a renewable energy microgrid. It analyzes occupant reactions in terms of perceived practicality regarding DSM implementation, considering factors such as renewable energy generation, load shifting, and energy costs. The literature [15] proposes a blockchain-based smart solution for DSM in residential buildings within a neighborhood, aiming to improve the peak-to-average ratio (PAR) of power load, reduce energy consumption, and enhance occupant thermal comfort by modeling heating, illumination, and appliance systems. The literature [16] focuses on designing and operating a standalone hybrid renewable energy system (HRES) for residential building loads. The proposed HRES integrates photovoltaic panels and wind turbines as energy sources, coupled with a hydrogen subsystem and battery bank for energy storage. The literature [17] introduces a grey-box model-based DSM method for rooftop photovoltaics (PVs) in buildings to achieve peak shaving, thermal comfort, and mechanical cost savings. The literature [18] employs an archetype-based approach to model generic building clusters, targeting diverse building types, compositions, and sizes, and applies this approach to a case study of 54 buildings. The literature [19] designs a decentralized transactive energy management framework for a real-world hybrid building cluster, capturing strategic interactions between distributed energy resource owners and consumers via a multi-leader–multi-follower Stackelberg game. The literature [20] integrates a multi-stage reinforcement learning algorithm with imitation learning within the MAPPO framework to optimize system energy performance, enhancing solar PV self-consumption, reducing energy costs, and maintaining indoor thermal comfort. The literature [21] explores the benefits of deep reinforcement learning, a hybrid method combining RL and deep learning, for online optimization of building energy management system schedules, marking the first such application in the smart grid context. The literature [22] proposes a machine learning-driven robust model predictive control framework for sustainable multi-zone buildings using renewable energies, addressing weather forecast uncertainties in energy management, reducing overall electricity expenses, and ensuring occupant thermal comfort. The literature [23] introduces a novel energy management framework, deep–fuzzy logic control (Deep-FLC), which combines predictive modeling using long short-term memory (LSTM) networks with adaptive fuzzy logic to optimize energy allocation, minimize grid dependency, and preserve battery health in grid-connected microgrid (MG) systems. The literature [24] designs an efficient energy management system for smart homes with battery electric vehicles (BEVs) and bidirectional chargers, addressing the optimal control problem of determining battery charging/discharging strategies to minimize energy expenditure and costs. Generally speaking, these studies show a development trend from single technology application to multi-technology integration, from single system optimization to cluster collaborative management and deterministic control to uncertain response and work together to improve the consumption efficiency of renewable energy, reduce energy consumption costs, and ensure user comfort, which provides theoretical support and practical reference for smart grid and comprehensive energy management.
As artificial intelligence technology advances, reinforcement learning (RL) has gained significant attention and found applications in various power system domains, including power generation control, market competition, and load response [25]. RL, a pivotal machine learning technique, centers on enabling agents to take actions within an environment to maximize their cumulative rewards [26,27]. This aligns seamlessly with the objective of dynamic economic scheduling in integrated energy systems (IESs), which aims to optimize scheduling decisions for minimizing operational costs [28,29]. Several studies have explored real-time pricing strategies and demand response optimization in smart grids using advanced computational frameworks. The literature [30] proposes a deep reinforcement learning method to enhance network flexibility in an integrated energy system scheduling with demand response. The literature [31] proposes an energy management optimization method based on RL for an integrated electric–thermal energy system based on the improved proximal policy optimization algorithm, which effectively mitigates the problems of the traditional heuristic algorithms. Meanwhile, the literature [32] formulates the three-stage energy management problem as a Markov Decision Process and establishes a hierarchical energy management framework for virtual power plants based on deep RL techniques. The literature [33] introduces a collaborative bidding decision framework that leverages a multi-agent deep deterministic policy gradient algorithm, specifically targeting the optimization of decision-making in multi-market coupling scenarios for thermal power suppliers. The literature [34] proposes an adaptive personalized federated reinforcement learning (FRL) for multiple ESS optimal dispatch in various electricity markets with electric vehicles and renewable energy, achieving both the joint optimization of multiple ESSs and avoiding the degraded performance of FRL’s local model. In summary, the integration of RL techniques into IES management showcases remarkable potential for enhancing operational efficiency, reducing costs, and promoting sustainable energy practices across diverse applications.
While substantial advancements have been made in IES management, particularly in demand response, distributed energy integration, and multi-energy optimization, several critical research gaps persist. First, current studies predominantly address single-agent optimization (e.g., ESP pricing or user response) while neglecting the dynamic interplay between energy service providers and consumers, particularly the influence of user energy preferences on system decarbonization. Second, the two-stage energy transaction process (pricing–response) remains underexplored regarding its holistic impacts on economic performance and carbon emissions. Third, despite reinforcement learning’s demonstrated potential in IES scheduling, existing approaches largely focus on single-objective optimization (e.g., cost reduction) without effectively balancing user preferences with ESP benefits or developing robust distributed algorithms. This study addresses these limitations by introducing an innovative energy management framework integrating user preference modeling with reinforcement learning optimization to simultaneously enhance economic efficiency and environmental sustainability in IES operations. The comparison between this article and the other state-of-the-art literature contributions is shown in Appendix A. The main innovations of this paper are as follows.
(1) A quantitative model for users’ electricity and thermal consumption preferences is established to capture their dynamic response behaviors to prices and services. Through a multi-agent (ESP and user clusters) participation framework, user preferences are integrated into energy management decision-making.
(2) An energy management model based on reinforcement learning (RL) is established. Within the RL framework, a game-theoretic model between the ESP and users is constructed to collaboratively optimize the ESP’s revenue and user satisfaction. A distributed solution algorithm combining Q-learning and quadratic programming is proposed to achieve efficient two-stage interactive decision-making.
(3) By filling the gap in the interaction mechanism between the ESP and users, this paper provides a novel approach for low-carbon economic scheduling in IES. The proposed method not only enhances the economic efficiency of the system but also reduces carbon emissions through user preference guidance, offering theoretical support and practical references for the collaborative optimization of future smart grids and multi-energy systems.
The remainder of this paper is organized as follows: Section 2 introduces the energy management framework and user preference model. Section 3 establishes the energy service provider and user benefit model. Section 4 details the energy management model based on reinforcement learning. Section 5 discusses the simulation results. Finally, Section 6 presents the conclusions.

2. Energy Management Framework and User Preference Model

2.1. Energy Management Framework

The subjects involved in the IES include the power grid, ESP, and user cluster. Figure 1 is a system structure with the ESP and multi-users.
On the energy supply side, the ESP has an independent energy management center, which purchases electricity from the power grid and guides various IESs to participate in energy management by optimizing internal electric and thermal prices and multi-energy unit operation strategies. The multi-energy units of the ESP include combined heat and power (CHP), gas boiler (GB), electricity storage (ES), and heat storage (HS).
On the energy demand side, each user cluster optimizes its internal energy consumption mode by integrating load optimization, unit operation optimization, and the purchasing of electric and thermal power. Specifically, user clusters adjust their electric and thermal load demand response based on the electric and thermal prices set by the ESP, aiming to minimize costs while meeting energy needs. This involves dynamically shifting or reducing loads during peak price periods and increasing consumption during off-peak times. Additionally, user clusters optimize the operation of their internal energy units, such as distributed photovoltaics (PVs) for electricity generation, heat pumps (HPs) for heating and cooling, and ES systems for load balancing. By strategically charging and discharging the ES systems, user clusters can further reduce their reliance on grid power and manage energy costs. Finally, user clusters decide on the optimal amount of electric and thermal power to purchase from ESP and the power grid, considering both price signals and their own energy production capabilities, thereby achieving a cost-effective and efficient energy management strategy.
Based on the above energy interaction characteristics, this section establishes an ESP–multi-user energy management framework based on reinforcement learning, as shown in Figure 2.
The established energy management framework of the IES takes the ESP as Agent, the electricity and heat price of the ESP as Action, multiple user clusters as Environment, and user clusters’ demand for electric and thermal transaction of the ESP as State. By iterative optimization of the RL framework, the optimal electric and thermal prices of the ESP and unit operation strategy are optimized, and the energy consumption strategy and unit output power of the user cluster are optimized so as to improve the system operation economy and reduce the system carbon emission.

2.2. User Energy Preference Model

2.2.1. Electricity Energy Preference Model

As can be seen from Figure 1, users can trade electricity with the ESP and power grid at the same time. For users’ electric load demand, the main external power supply sources include the ESP and power grid, and it is proposed to use the price reduction ratio to reflect the probability of users choosing electric energy suppliers [5,6,7,35]. Based on this, considering the user’s electric energy preference, a user’s electric load source selection model is proposed. The probability that the user chooses the ESP or power grid as the power load source at time t in a day can be expressed as
ρ ESP , t e , buy = μ grid , t e , sell μ ESP , t e , sell μ grid , t e , sell μ grid , t e , buy
ρ grid , t e , buy = 1 ρ ESP , t e , sell
where ρ ESP , t e , buy is the probability that the user chooses the ESP as the electricity source at time t; ρ grid , t e , buy is the probability that the user chooses the power grid as the electricity source at time t; μ grid , t e , sell is the selling electric price of the power grid; μ ESP , t e , sell is the selling electric price of the ESP; μ grid , t e , buy is the purchasing electric price of the power grid.
According to the importance priority of electric load, user’s electric load can be divided into non-adjustable electric load and adjustable electric load. When users choose different power supply sources, they will adjust the demand response of the adjustable electric load according to their selling price [36,37,38].
P i , t eload = P i , t eload , cr + P i , t eload , ad
Δ P i , t , ESP eload , ad = ρ ESP , t e , buy P i , t eload , ad 1 μ grid , t e , sell μ ESP , t e , sell μ grid , t e , sell
Δ P i , t , grid eload , ad = ρ grid , t e , buy P i , t eload , ad 1 μ grid , t 1 e , sell μ grid , t e , sell μ grid , t 1 e , sell
Δ P i , t e l o a d , DR = Δ P i , t , ESP eload , ad + Δ P i , t , grid eload , ad
where P i , t eload is the user’s electric load; P i , t eload , cr is the non-adjustable electric load; P i , t eload , ad is the adjustable electric load; Δ P i , t e l o a d , DR is the actual electric load adjustment; Δ P i , t , ESP eload , ad is the adjusted electric load according to the ESP electricity price; Δ P i , t , grid eload , ad is the adjusted electric load according to the electricity price of the power grid.

2.2.2. Thermal Energy Preference Model

For the user’s thermal load in the traditional IES operation mode, it is generally believed that the user’s thermal load is only supplied by the ESP. In the IES framework, the user’s thermal load can not only come from the ESP but also from the user’s self-built heat pump system. Furthermore, based on the user’s thermal preference, this section puts forward the user’s thermal mode selection model.
Due to the psychological threshold of users’ acceptance of thermal prices, this paper takes the urban energy system market thermal price as the psychological threshold of users’ acceptance of thermal prices. When the selling price of ESP exceeds the threshold, users will no longer purchase thermal from the ESP; when the threshold is lower, the lower the thermal price set by the ESP, the greater the probability that users will choose the ESP as their thermal source. Based on this, considering user thermal preferences, a user thermal source selection model is proposed. The probability of users choosing the ESP or their own heat pump as the thermal source at time t within a day can be expressed as
ρ ESP , t h , buy = max ( μ grid , t h , sell μ ESP , t h , sell , 0 ) μ grid , t h , sell μ ESP , t h , sell , min
ρ HP , t h , buy = 1 ρ ESP , t h , buy
where ρ ESP , t h , buy is the probability that the user chooses the ESP as the thermal source at time t; ρ HP , t h , buy is the probability that the user chooses the heat pump as the thermal source at time t; μ grid , t h , sell is the market thermal price of urban energy system; μ ESP , t h , sell is the selling thermal price of ESP; μ ESP , t h , sell , min is the minimum selling thermal price of the ESP.
According to the importance priority of thermal load, user thermal load can be divided into non-adjustable thermal load and adjustable thermal load. When users choose the ESP as the thermal source, the adjustable heat load demand response will be according to the thermal price of ESP [36,37,38].
P i , t hload = P i , t hload , cr + P i , t hload , ad
Δ P i , t hload , ad = P i , t hload , ad 1 μ grid , t h , sell μ ESP , t h , sell μ grid , t h , sell
where P i , t hload is the user’s thermal load; P i , t hload , cr is the non-adjustable thermal load; P i , t hload , ad is the adjustable thermal load; Δ P i , t hload , DR is the user’s actual thermal load adjustment.

3. ESP and User Benefit Model

3.1. ESP Benefit Model

The ESP is the energy manager of the IES, which optimizes the price of electric and thermal transactions with users according to the power grid price and guides users to participate in the energy management of the system. The benefit model of the ESP takes the maximization of operation benefit as the objective function, and its operation benefit includes transaction benefit with the power grid, interaction benefit with users, operation cost, and environmental cost [15,16,17,18,19,20,39,40].
max   R t ESP = R t grid + R t users + C t op + C t en
where R t ESP is the operation benefit of the ESP; R t grid is the transaction income between the ESP and power grid; R t users is the transaction income between the ESP and users; C t op is the operating cost of the ESP; C t en is the environmental cost.
The transaction income between ESP and the power grid takes into account the cost of ESP purchasing electricity from the power grid and the income of selling electricity to the power grid.
R t grid = μ grid , t e , buy P grid , t e , buy μ grid , t e , sell P grid , t e , sell
where μ grid , t e , buy is the price of electricity purchased by the power grid from the ESP; μ grid , t e , sell is the price of electricity sold by the power grid to the ESP; P grid , t e , buy is the electric power sold by the ESP to the power grid; P grid , t e , sell is the electric power purchased by the ESP from the power grid.
The transaction income between the ESP and users takes into account the cost of purchasing electricity from users and the income of supplying electricity and thermal to users [41].
R t users = i = 1 I ( μ ESP , t e , sell ρ ESP , t e , buy P i , t e , sell + μ ESP , t h , sell ρ ESP , t h , buy P i , t h , sell ) i = 1 I ρ ESP , t e , sell P i , t e , buy
where I is the number of users; μ ESP , t e , sell and μ ESP , t h , sell are the prices of electricity and thermal supplied by the ESP to users; μ ESP , t e , buy is the price of electricity purchased by the ESP from users; P i , t e , sell and P i , t h , sell are the electricity and thermal purchased by users; P i , t e , buy is the electricity sold by users.
The operation cost of the ESP mainly includes natural gas costs and equipment operation and maintenance costs.
C t op = μ ng ( P t CHP η CHP L H V ng + P t G B η GB L H V ng ) + n = 1 N c n P t n
where μ ng is the price of natural gas; P t CHP and P t G B are the power of CHP and GB; η CHP and η GB are the thermal efficiency of CHP and GB; L H V ng is the low calorific value of natural gas; c n is the maintenance cost coefficient of equipment n; P t n is the output power of equipment n.
The environmental cost of ESP is the environmental cost caused by GB and CHP consuming natural gas and emitting carbon dioxide.
C t en = μ t co 2 ϖ ng μ ng ( P t CHP η CHP L H V ng + P t G B η GB L H V ng )
where μ t co 2 is the carbon emission price; ϖ ng is the carbon emission intensity of natural gas.
Formulas (16)–(24) define the operation constraints of the ESP, including power balance constraints, interactive power constraints, energy storage constraints, and pricing decision constraints [15,16,17,18,19,20,21,22,23,24].
P t CHP + P grid , t e , sell + i = 1 I ρ E S P e , sell P i , t e , buy i = 1 I ρ E S P e P i , t e , sell P grid , t e , buy + P t ees , c P t ees , d = 0
P t CHP θ i CHP + P t GB + P t hes , c P t hes , d = 0
P grid , max e , sell P grid , t e , sell P grid , max e , sell
E t ees = E t 1 ees + η ees , c P t ees , c P t ees , d / η ees , c
10 % E ees E t ees 90 % E ees
E t h e s = E t 1 hes + η hes , c P t h e s , c P t h e s , d / η hes , c
10 % E hes E t h e s 90 % E hes
0 μ ESP , t e , sell μ grid , t e , sell
0 μ ESP , t h , sell μ grid , t h , sell
where E t ees and E t h e s are the electricity and thermal stored by the ES and HS; P t ees , c and P t h e s , c are the charging power of the ES and HS; P t ees , d and P t h e s , d are the discharge power of the ES and HS; η ees , c and η hes , c are the charging efficiency of the ES and HS; η ees , d and η hes , d are the discharge efficiency of the ES and HS; E ees and E hes are the capacity of the ES and HS; P grid , max e , sell is the maximum transmission power of electric energy transaction between the ESP and power grid.

3.2. User Benefit Model

According to the ESP’s price strategy, users in the IES optimize their own energy consumption strategy, and its benefit model aims at the minimum comprehensive operation cost. The comprehensive operation cost of users includes transaction costs with the power grid, electric and thermal transaction costs with the ESP, equipment operation costs, and satisfaction loss costs [42,43].
min   C i , t user =   C i , t e , grid + C i , t eh , ESP + C i , t user , op + C i , t user , uti
where   C i , t user is the comprehensive cost of users; C i , t e , grid is the transaction cost between the user and the power grid; C i , t eh , ESP is the transaction cost between the user and the ESP; C i , t user , op is the operation cost of the equipment.
The transaction cost between users and the power grid takes into account the cost of purchasing electricity from the power grid and the income of selling electricity to the power grid.
  C i , t e , grid = μ grid , t e , sell ρ grid , t e , buy P i , t e , sell ρ grid , t e , sell P grid , t e , buy
The transaction cost between users and the ESP takes into account the cost of purchasing electric thermal from the ESP and the income of selling electricity to the ESP.
C i , t eh , ESP = i = 1 I ( μ ESP , t e , sell ρ ESP , t e , buy P i , t e , sell + μ ESP , t h , sell ρ ESP , t h , buy P i , t h , sell ) i = 1 I ρ ESP , t e , sell P i , t e , buy
The operation cost of equipment is mainly the operation cost of the user heat pump and energy storage.
C i , t user , op = c HP η HP P i , t HP + c ES P i , t ES
where η HP is the thermal efficiency of the HP; c HP is the maintenance cost coefficient of the HP; P i , t HP is the electric output power of the HP; c ES is the maintenance cost coefficient of energy storage; P i , t ES is the output power of energy storage.
The loss of customer satisfaction is caused by the user’s optimization and adjustment of the electric and thermal load according to the ESP price.
C i , t user , uti = α e , i ( Δ P i , t e l o a d ) + 1 2 β e , i ( Δ P i , t e l o a d ) 2 + α h , i ( Δ P i , t hload ) + 1 2 β h , i ( Δ P i , t hload ) 2
where α e , i and β e , i are the loss coefficient of user’s electric load satisfaction; α h , i and β h , i are the loss coefficient of user’s heat load satisfaction.
Formulas (30)–(33) define user’s operation constraints, including power balance constraints and equipment operation constraints [42,43].
P i , t e , sell P i , t e , buy + P i , t PV + P i , t ES P i , t HP = P i , t e l o a d Δ P i , t e l o a d , DR
P i , t h , sell + η HP P i , t HP = P i , t hload Δ P i , t hload , ad
P i , t h , sell = ρ ESP , t e , sell P i , t hload , DR
η HP P i , t HP = ρ HP , t e , sell P i , t hload , DR
where P i , t PV is the photovoltaic power of users.

4. Energy Management Model Based on Reinforcement Learning

Based on reinforcement learning theory, this section establishes an energy management model of reinforcement learning between the ESP and users and optimizes the electricity and thermal price of ESP and the electricity and thermal demand strategy of users [31,32,33,34].

4.1. Energy Management Model

4.1.1. Action Space Model

In the reinforcement learning model established in this paper, the action space is the electricity price and hot price of the ESP. In the process of electric heating transaction between the ESP and users, the ESP is in a dominant position and obtains the maximum benefit by adjusting the electric heating price strategy. For the ESP, the action space can be defined as
μ t = μ ESP , t e , sell , μ ESP , t h , sell , μ ESP , t e , buy , t
At each trading moment, the ESP will calculate the reward function, update the price of electric heating, and then update the action space according to the demand of electric heating trading fed back by users.

4.1.2. State Space Model

In the energy management model of reinforcement learning established in this paper, the state space is the electricity and thermal energy transaction between the ESP and users. Under the guidance of the ESP electricity and thermal price, users will optimize their electricity and thermal energy consumption strategy and feed back the optimized electricity and thermal energy trading demand to the ESP. The state space can be defined as
P i , t = P i , t e , sell , P i , t e , buy , P i , t h , sell , t
At each trading moment, the user will optimize the trading strategy according to the ESP electricity and thermal energy pricing information and then update the state space.

4.1.3. Reward Function Model

The energy trading interaction between ESPs and users resembles a game-theoretic scenario, where both parties’ interests must be considered in energy management decisions. To address this, the study establishes a weighted reward function that incorporates dual benefit objectives: the ESP’s profit function and the user benefit function.
R t = max ( r R t E S P ( 1 r ) i = 1 I C i , t user )
Here, r represents the weight coefficient between ESP and the target of user benefit function, where r [ 0 , 1 ] .

4.2. Model Solving Method Based on Q-Learning–QP

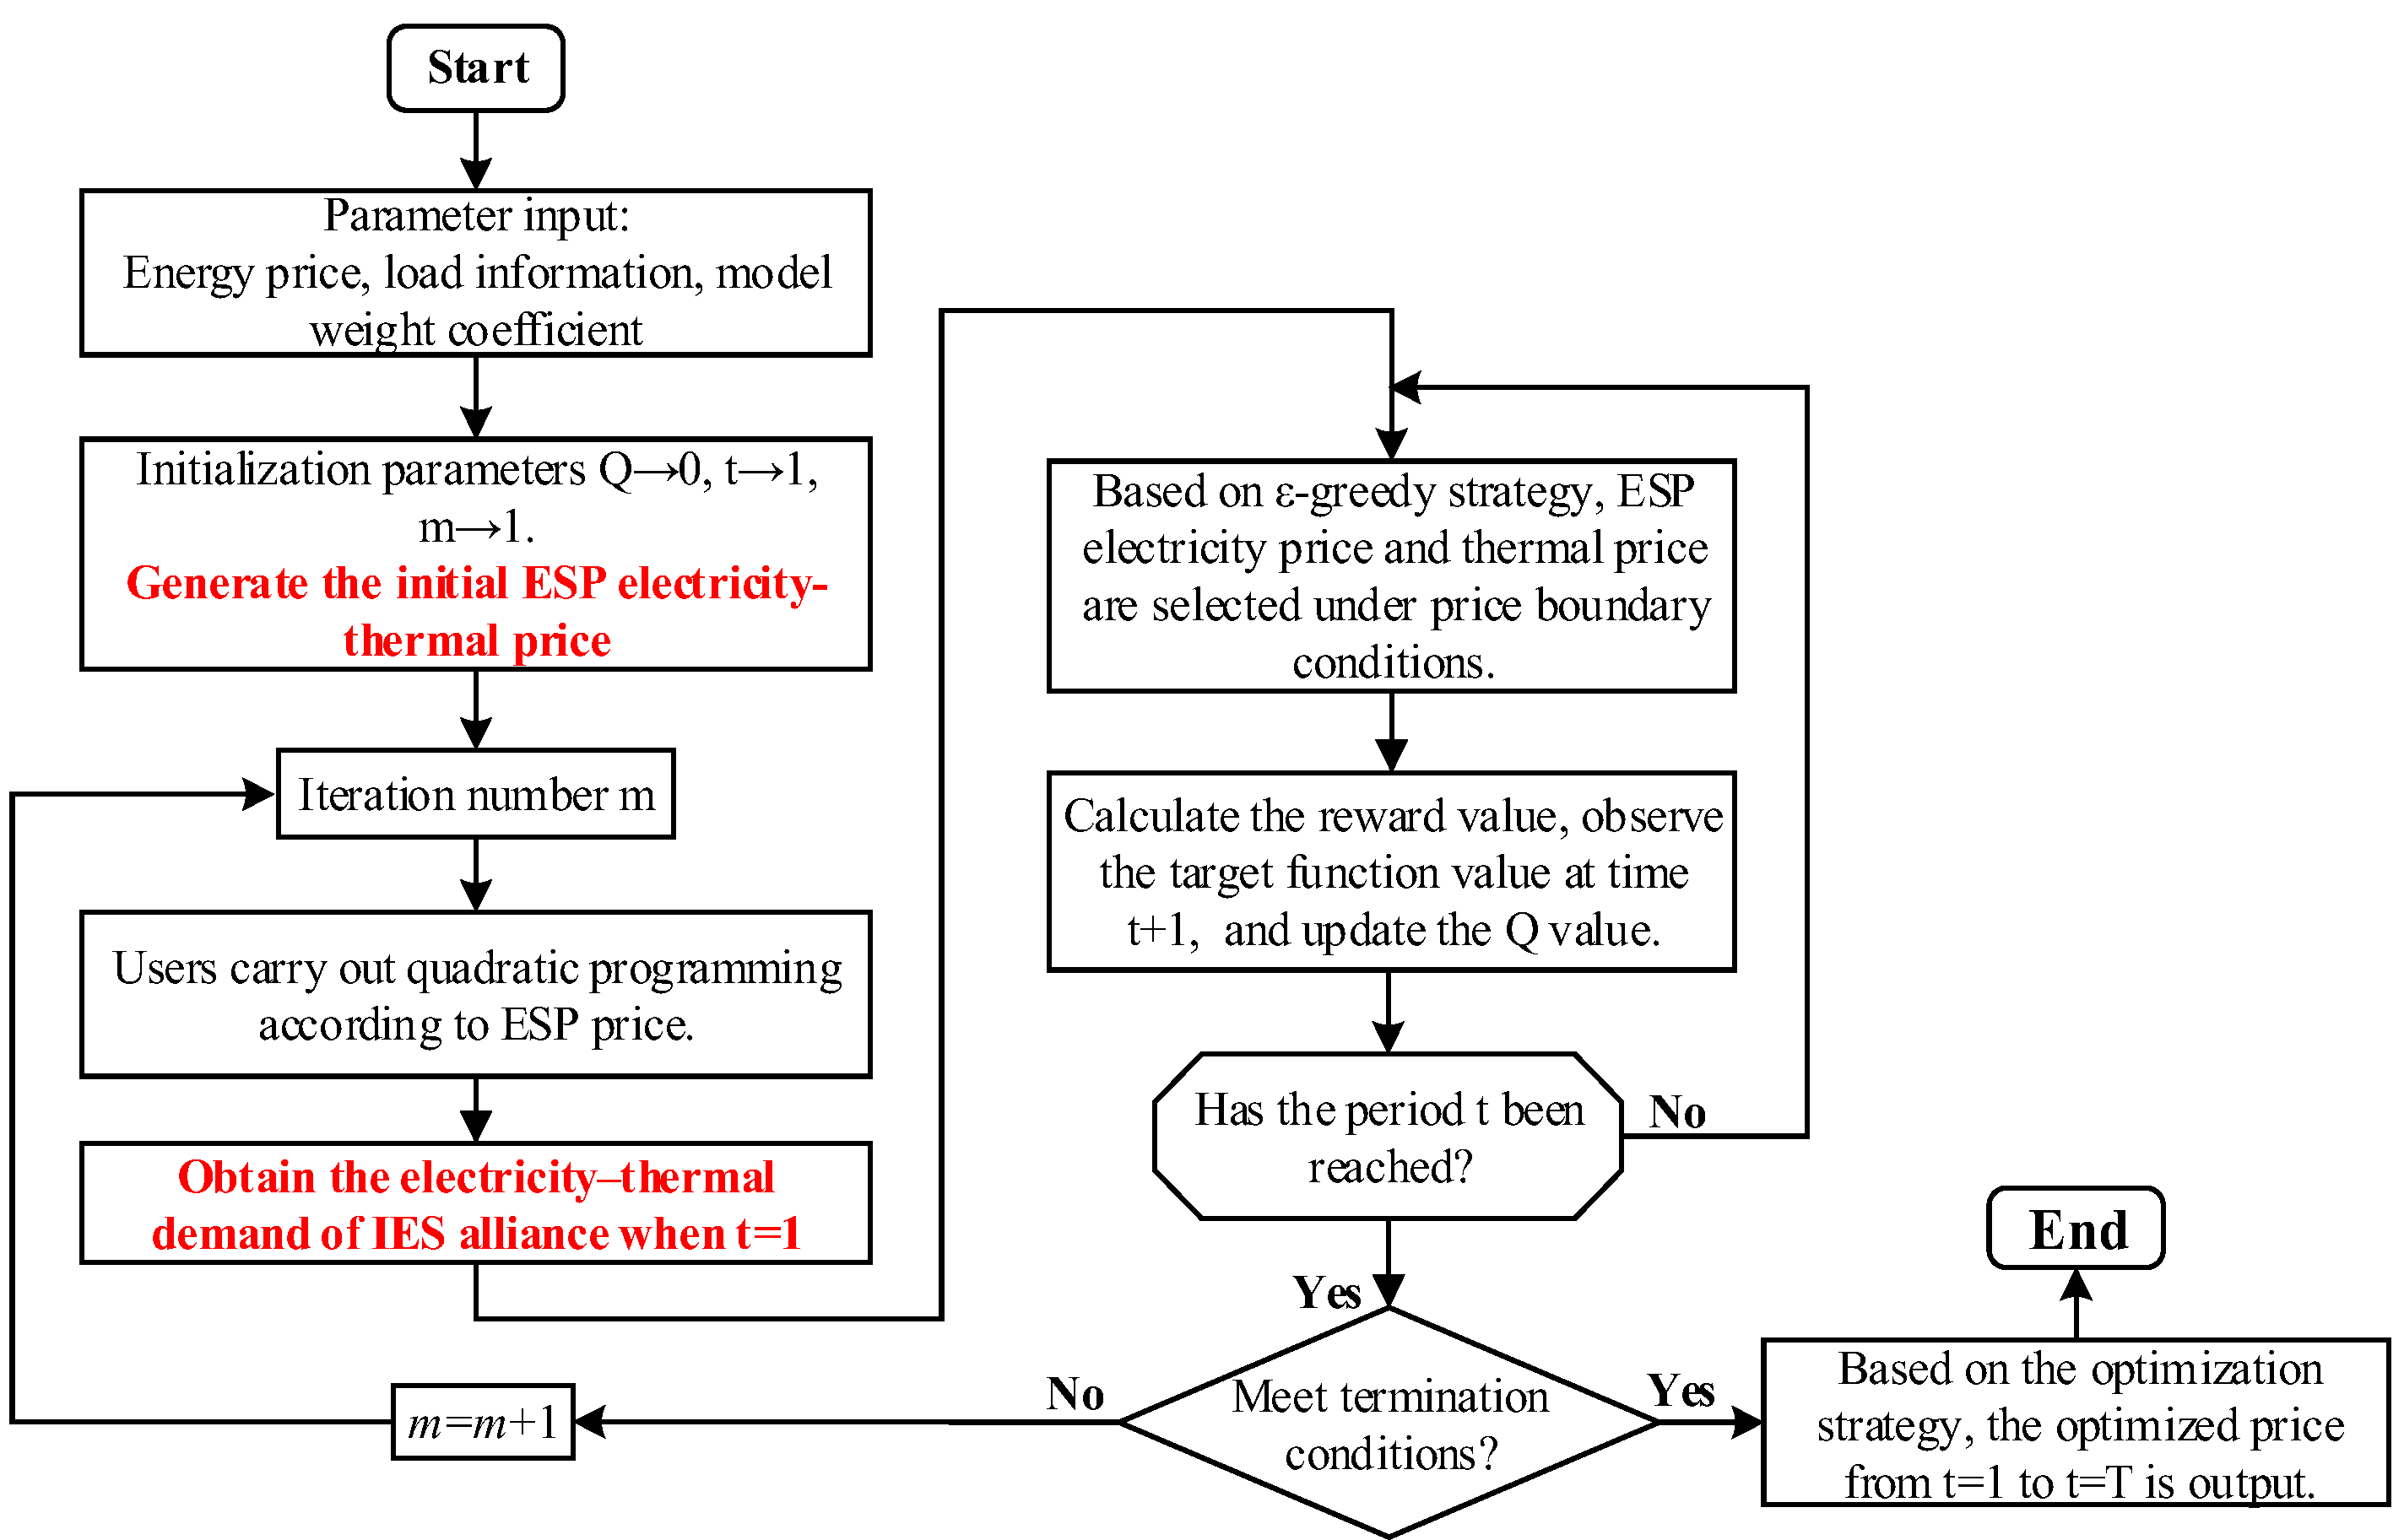
In conventional centralized optimization approaches, comprehensive data from all participants—including equipment specifications and energy consumption preferences—must be obtained. However, in today’s competitive electricity market, such information is often non-transparent, necessitating independent optimization by each stakeholder. To address this challenge, this paper proposes a distributed equilibrium solution framework that integrates Q-learning with quadratic programming (Q-learning–QP) [31,32,33,34,36,44]. The computational workflow of this algorithm is illustrated in Figure 3.
The decision-making process of ESP, as the leader in integrated energy system management, involves a large-scale nonlinear optimization problem. The Q-learning algorithm can effectively address this by reducing computational complexity and enhancing optimization performance. Since the user’s optimization objective is formulated as a quadratic function, quadratic programming can be employed to improve solution speed and accuracy. By integrating quadratic programming into the Q-learning iterative process, users only need to respond to the ESP’s price signals by providing their electric trading power feedback. This approach not only safeguards against information leakage but also ensures the privacy of all participating parties.

5. Case Study

5.1. Basic Data

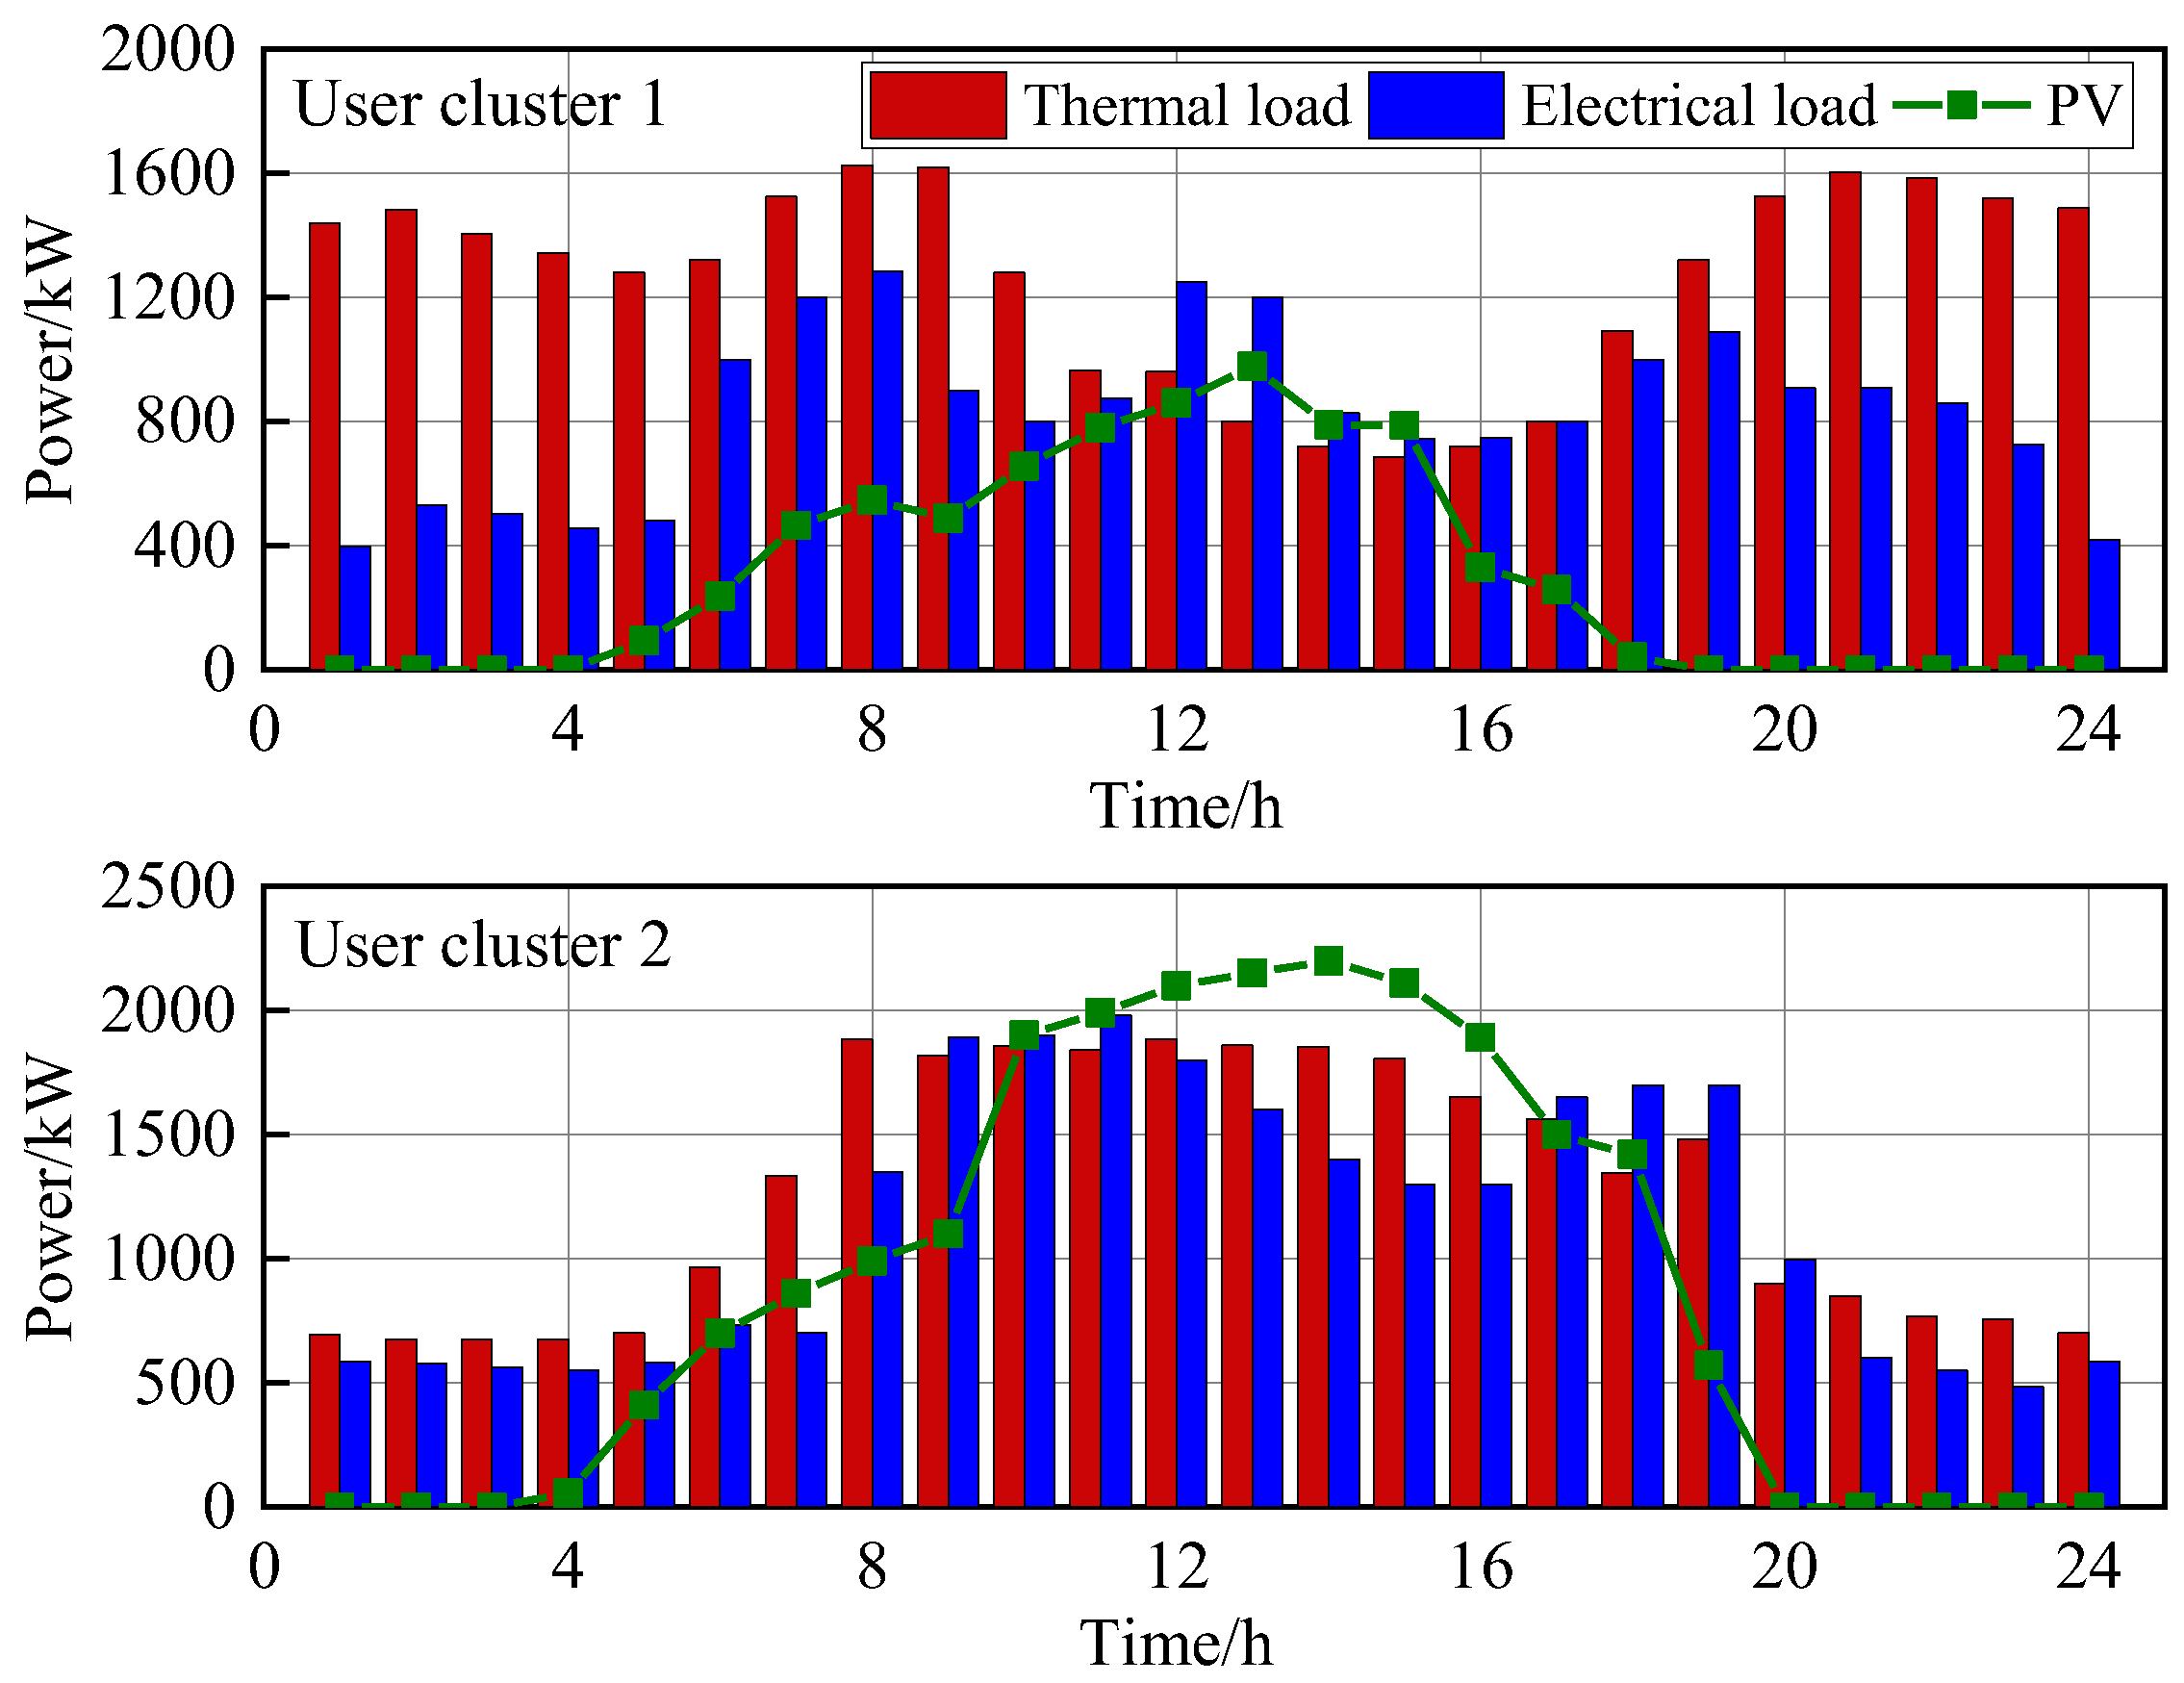
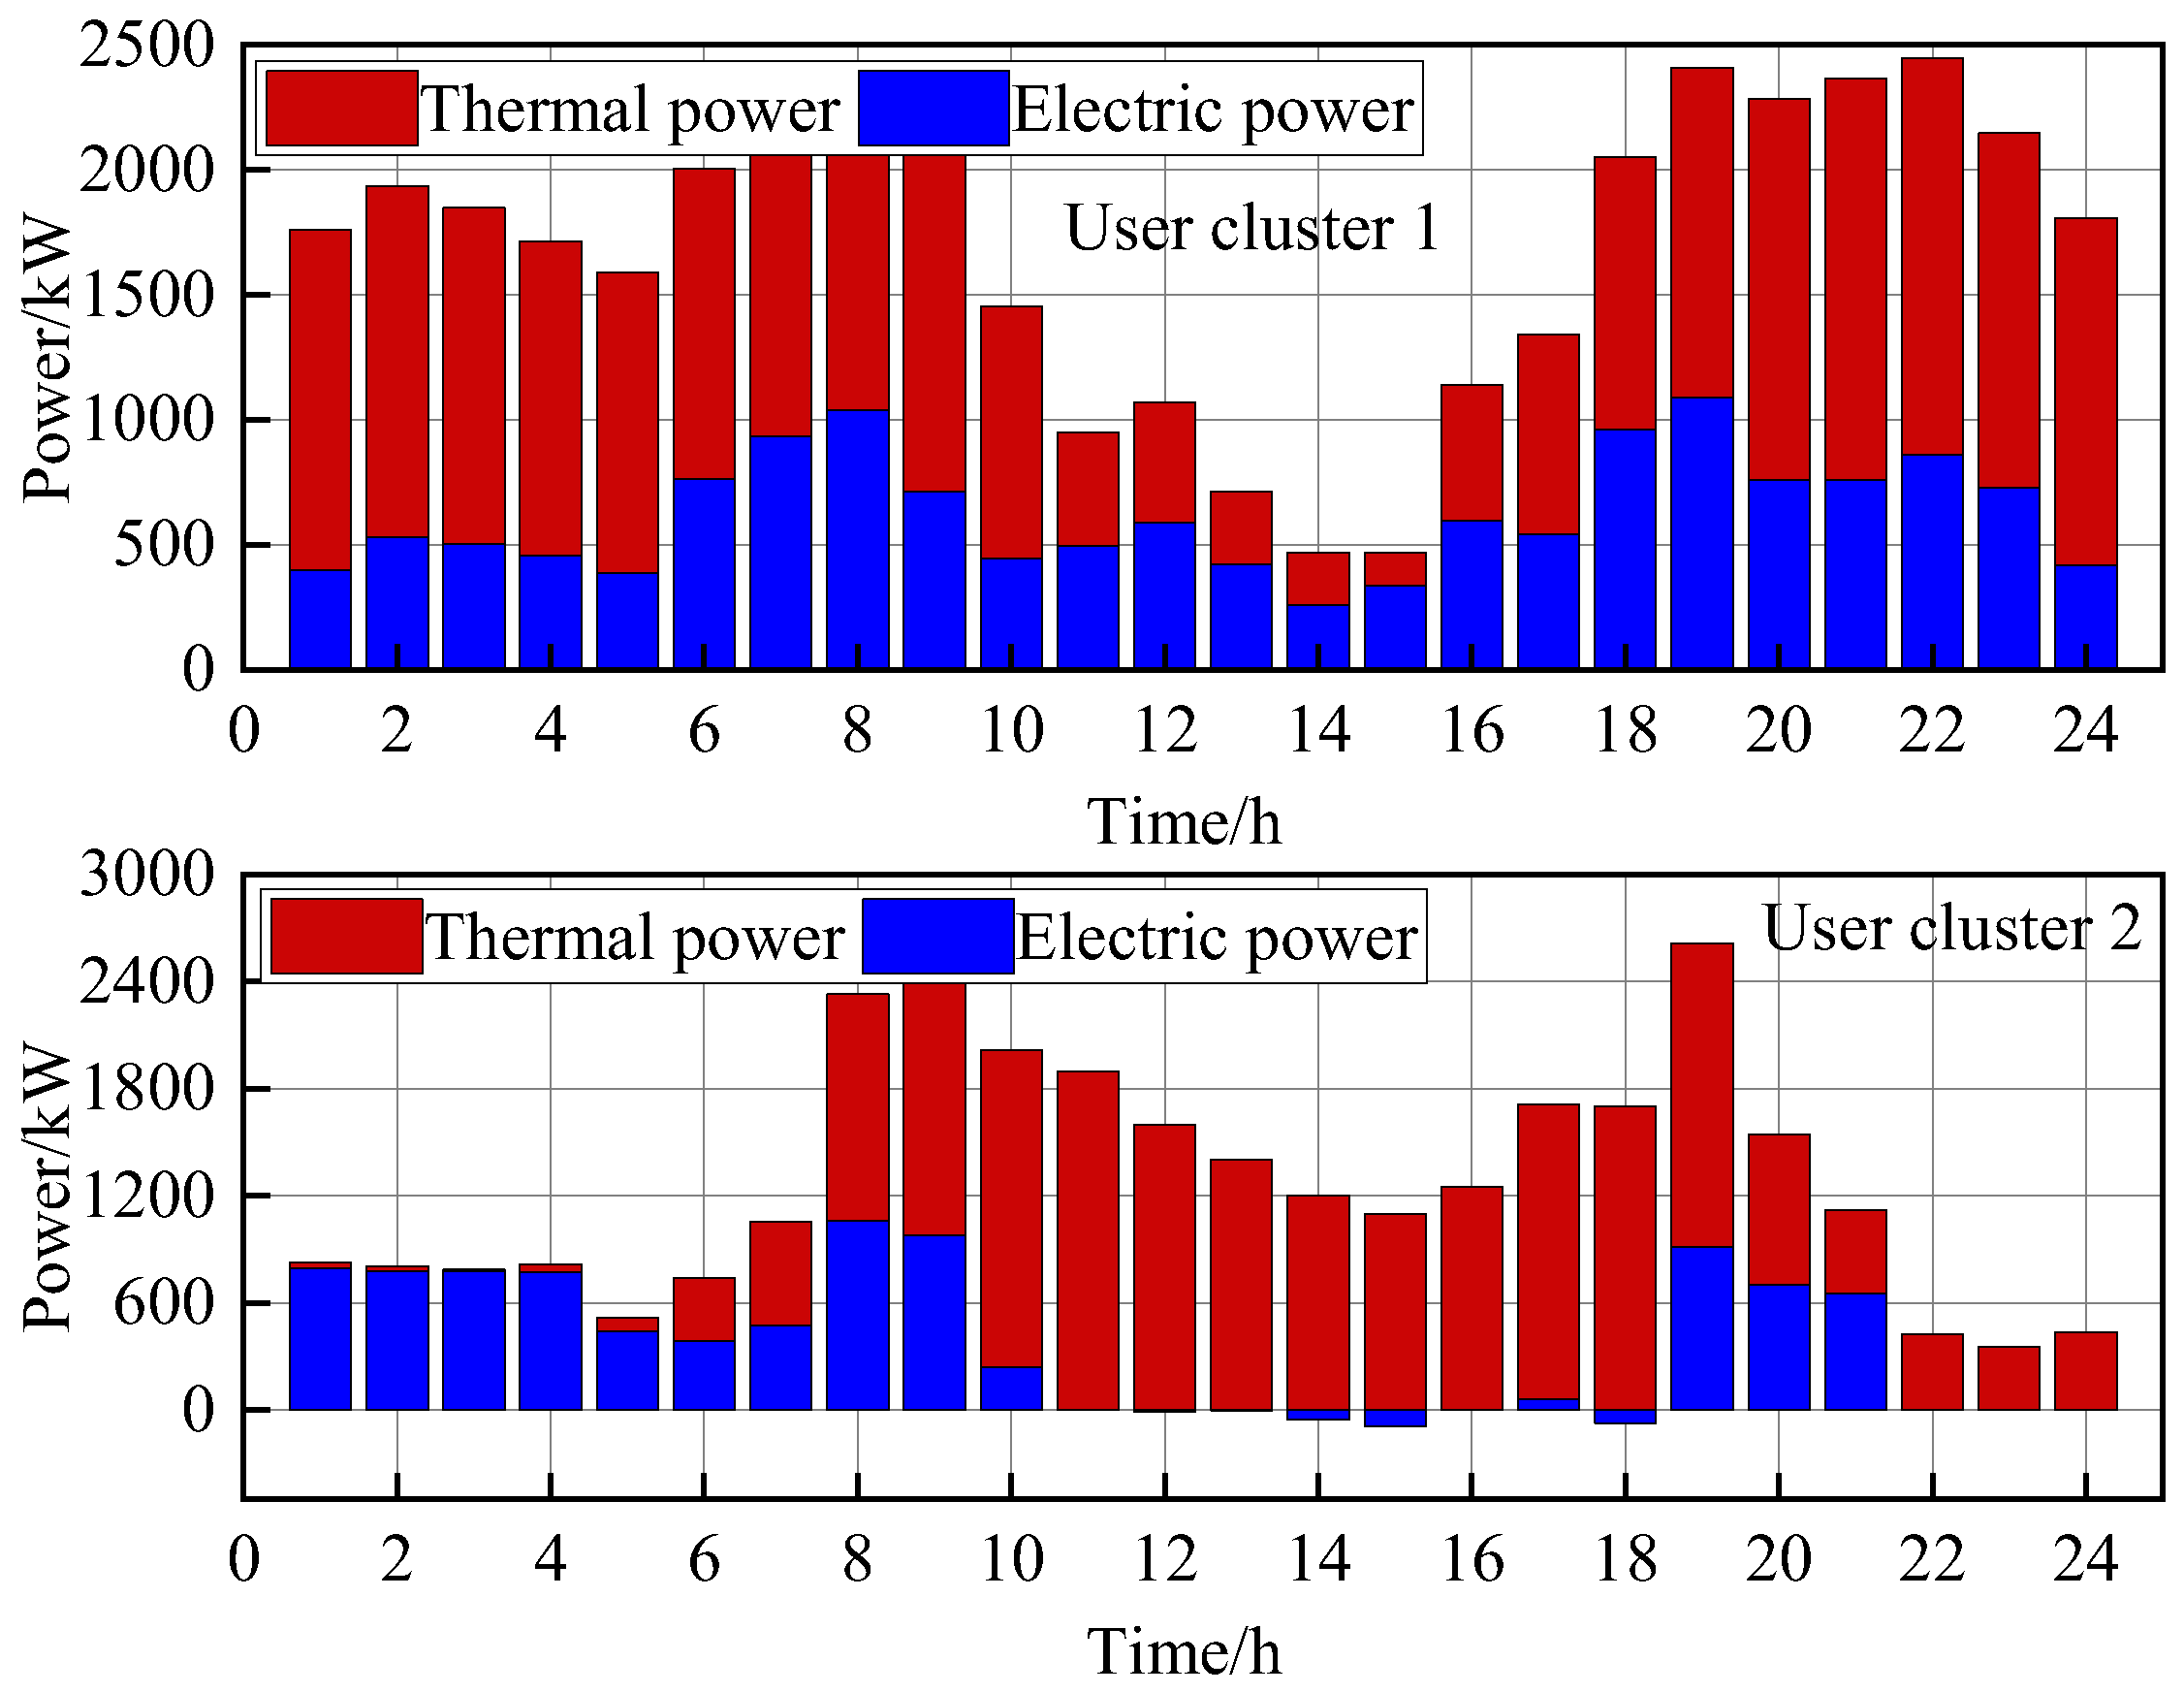
In this paper, the electricity–thermal integrated energy system composed of the ESP and two user clusters, as shown in Figure 1, is selected for simulation analysis. In this example, the given optimal scheduling period is 24 h. IES unit parameters [1,4,39,45] are shown in Table 1. The price of natural gas is 3.25 CNY/m3, the low calorific value of natural gas is 38 MJ/m3, the carbon emission intensity of natural gas is 1.885 kg/m3, the environmental cost coefficient is 0.25 CNY/kg [39], and the time-of-use electricity price [39,46] of the power grid is shown in Table 2. The weight coefficient between the ESP and user benefit function target is 0.5. The electricity, thermal load, and photovoltaic power of each user cluster are shown in Figure 4. The maximum adjustable capacity of power load and thermal load of user cluster 1 are 15% and 10%, respectively, and those of user cluster 2 are 8% and 10%, respectively.
Based on the above basic parameters and the established energy management model of a comprehensive energy system considering users’ energy preferences, this paper carries out a simulation test on a computer with i5-9400F CPU, 32 GB memory, and a Windows 64-bit system.

5.2. Simulation Results

5.2.1. Optimization Result of ESP Pricing and Operation Strategy

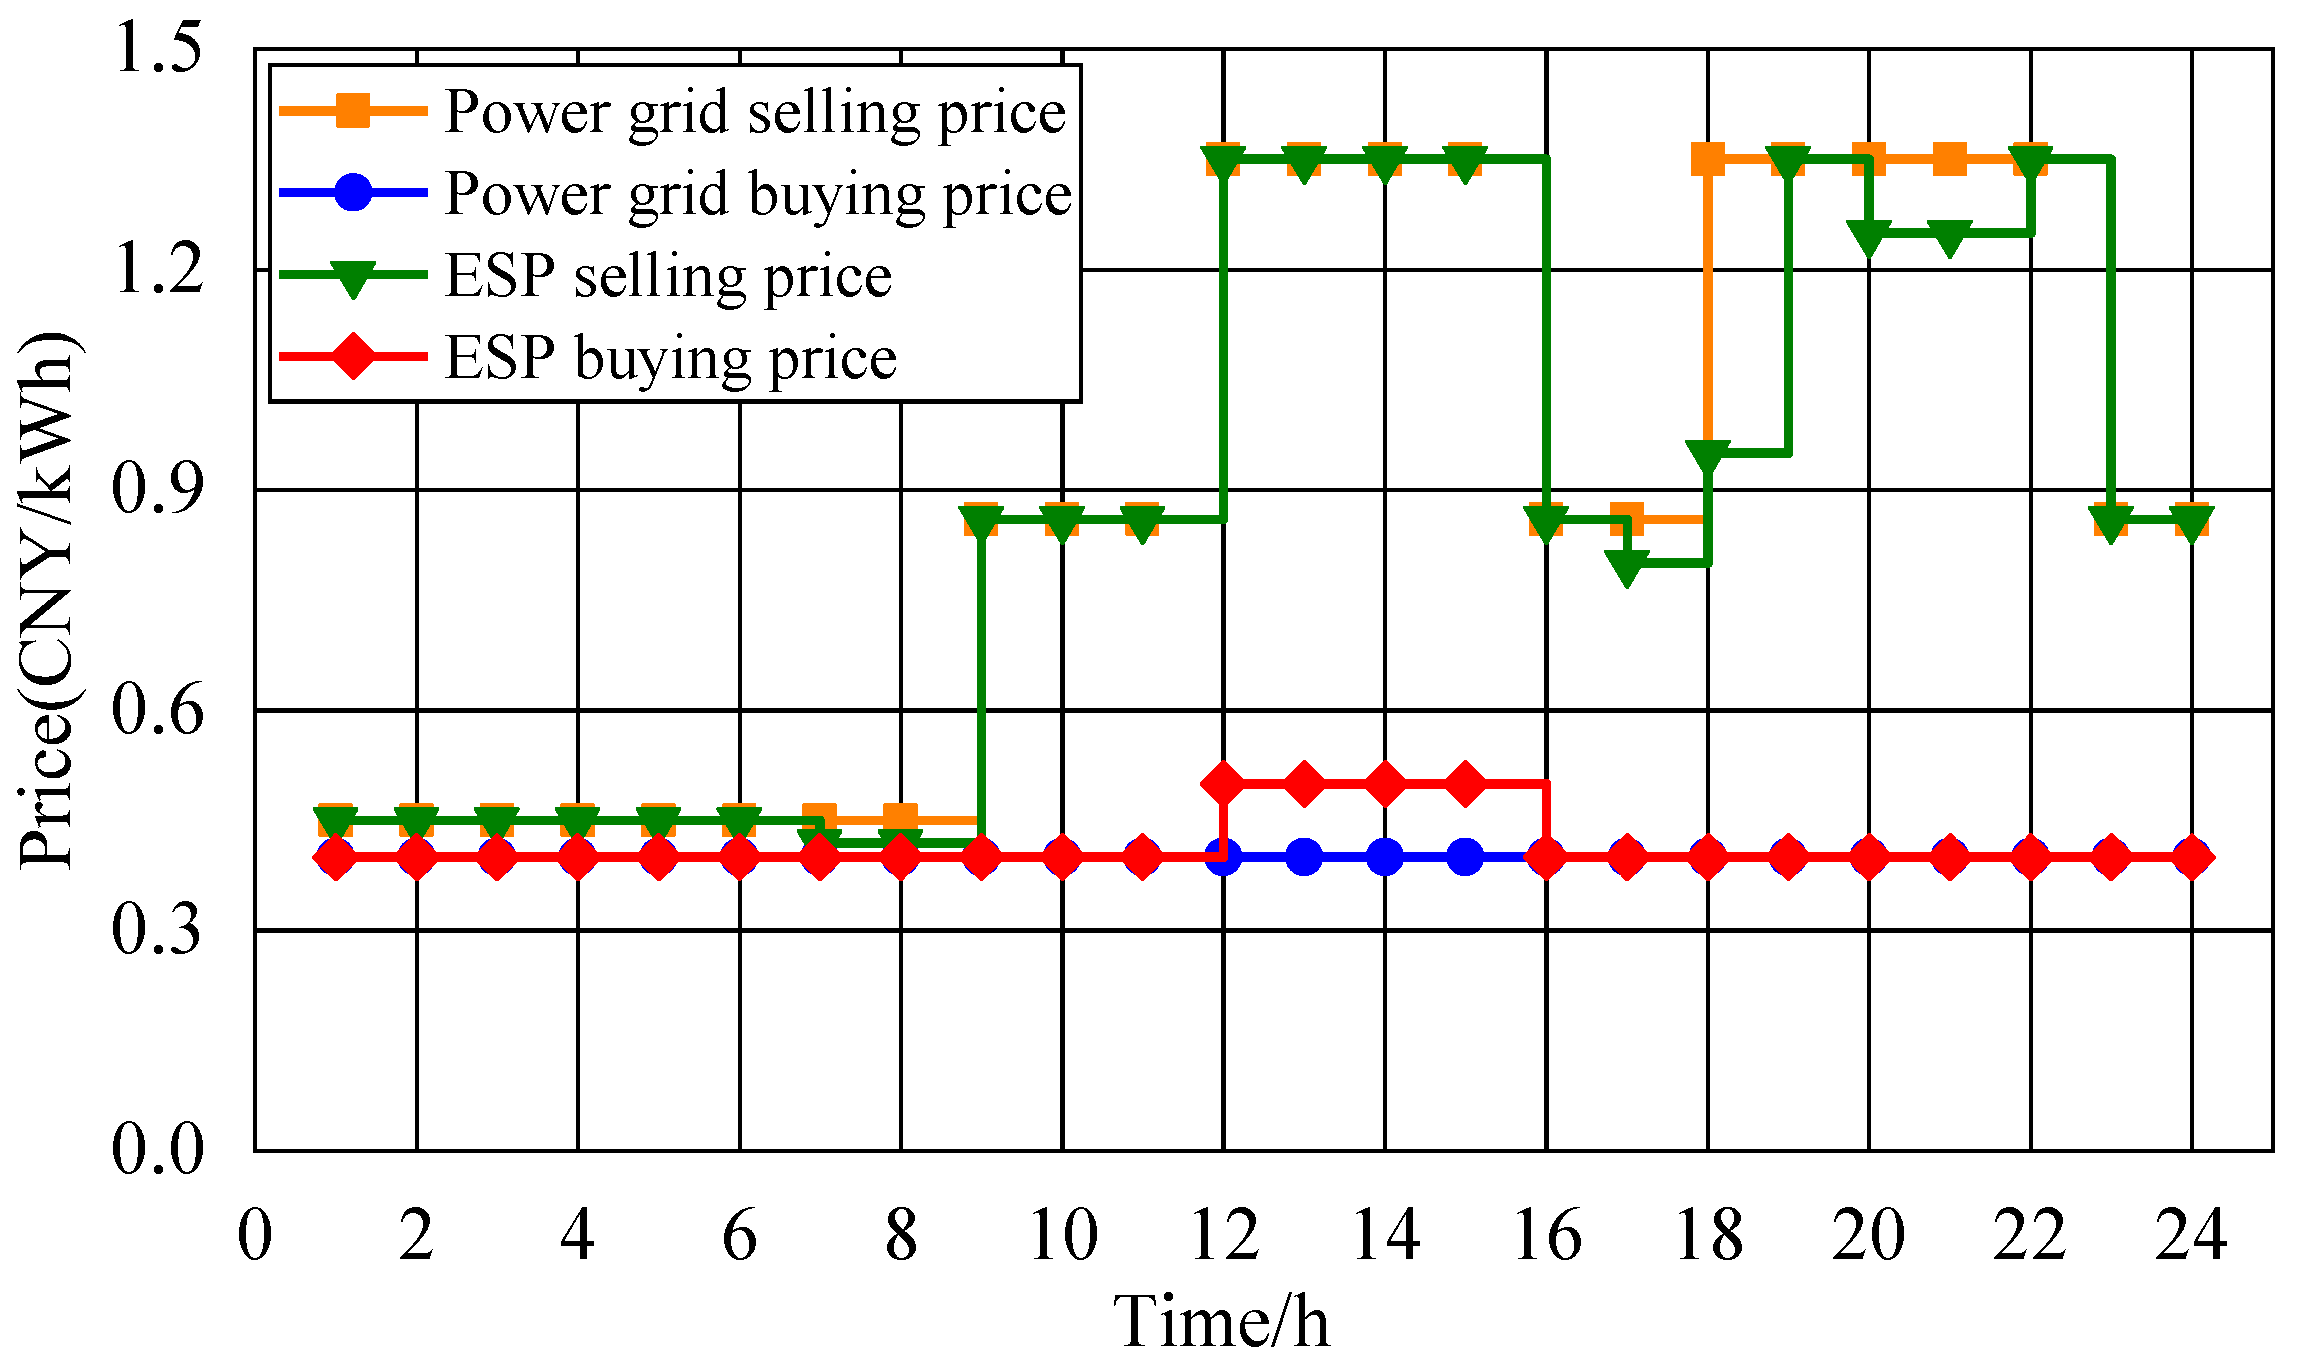
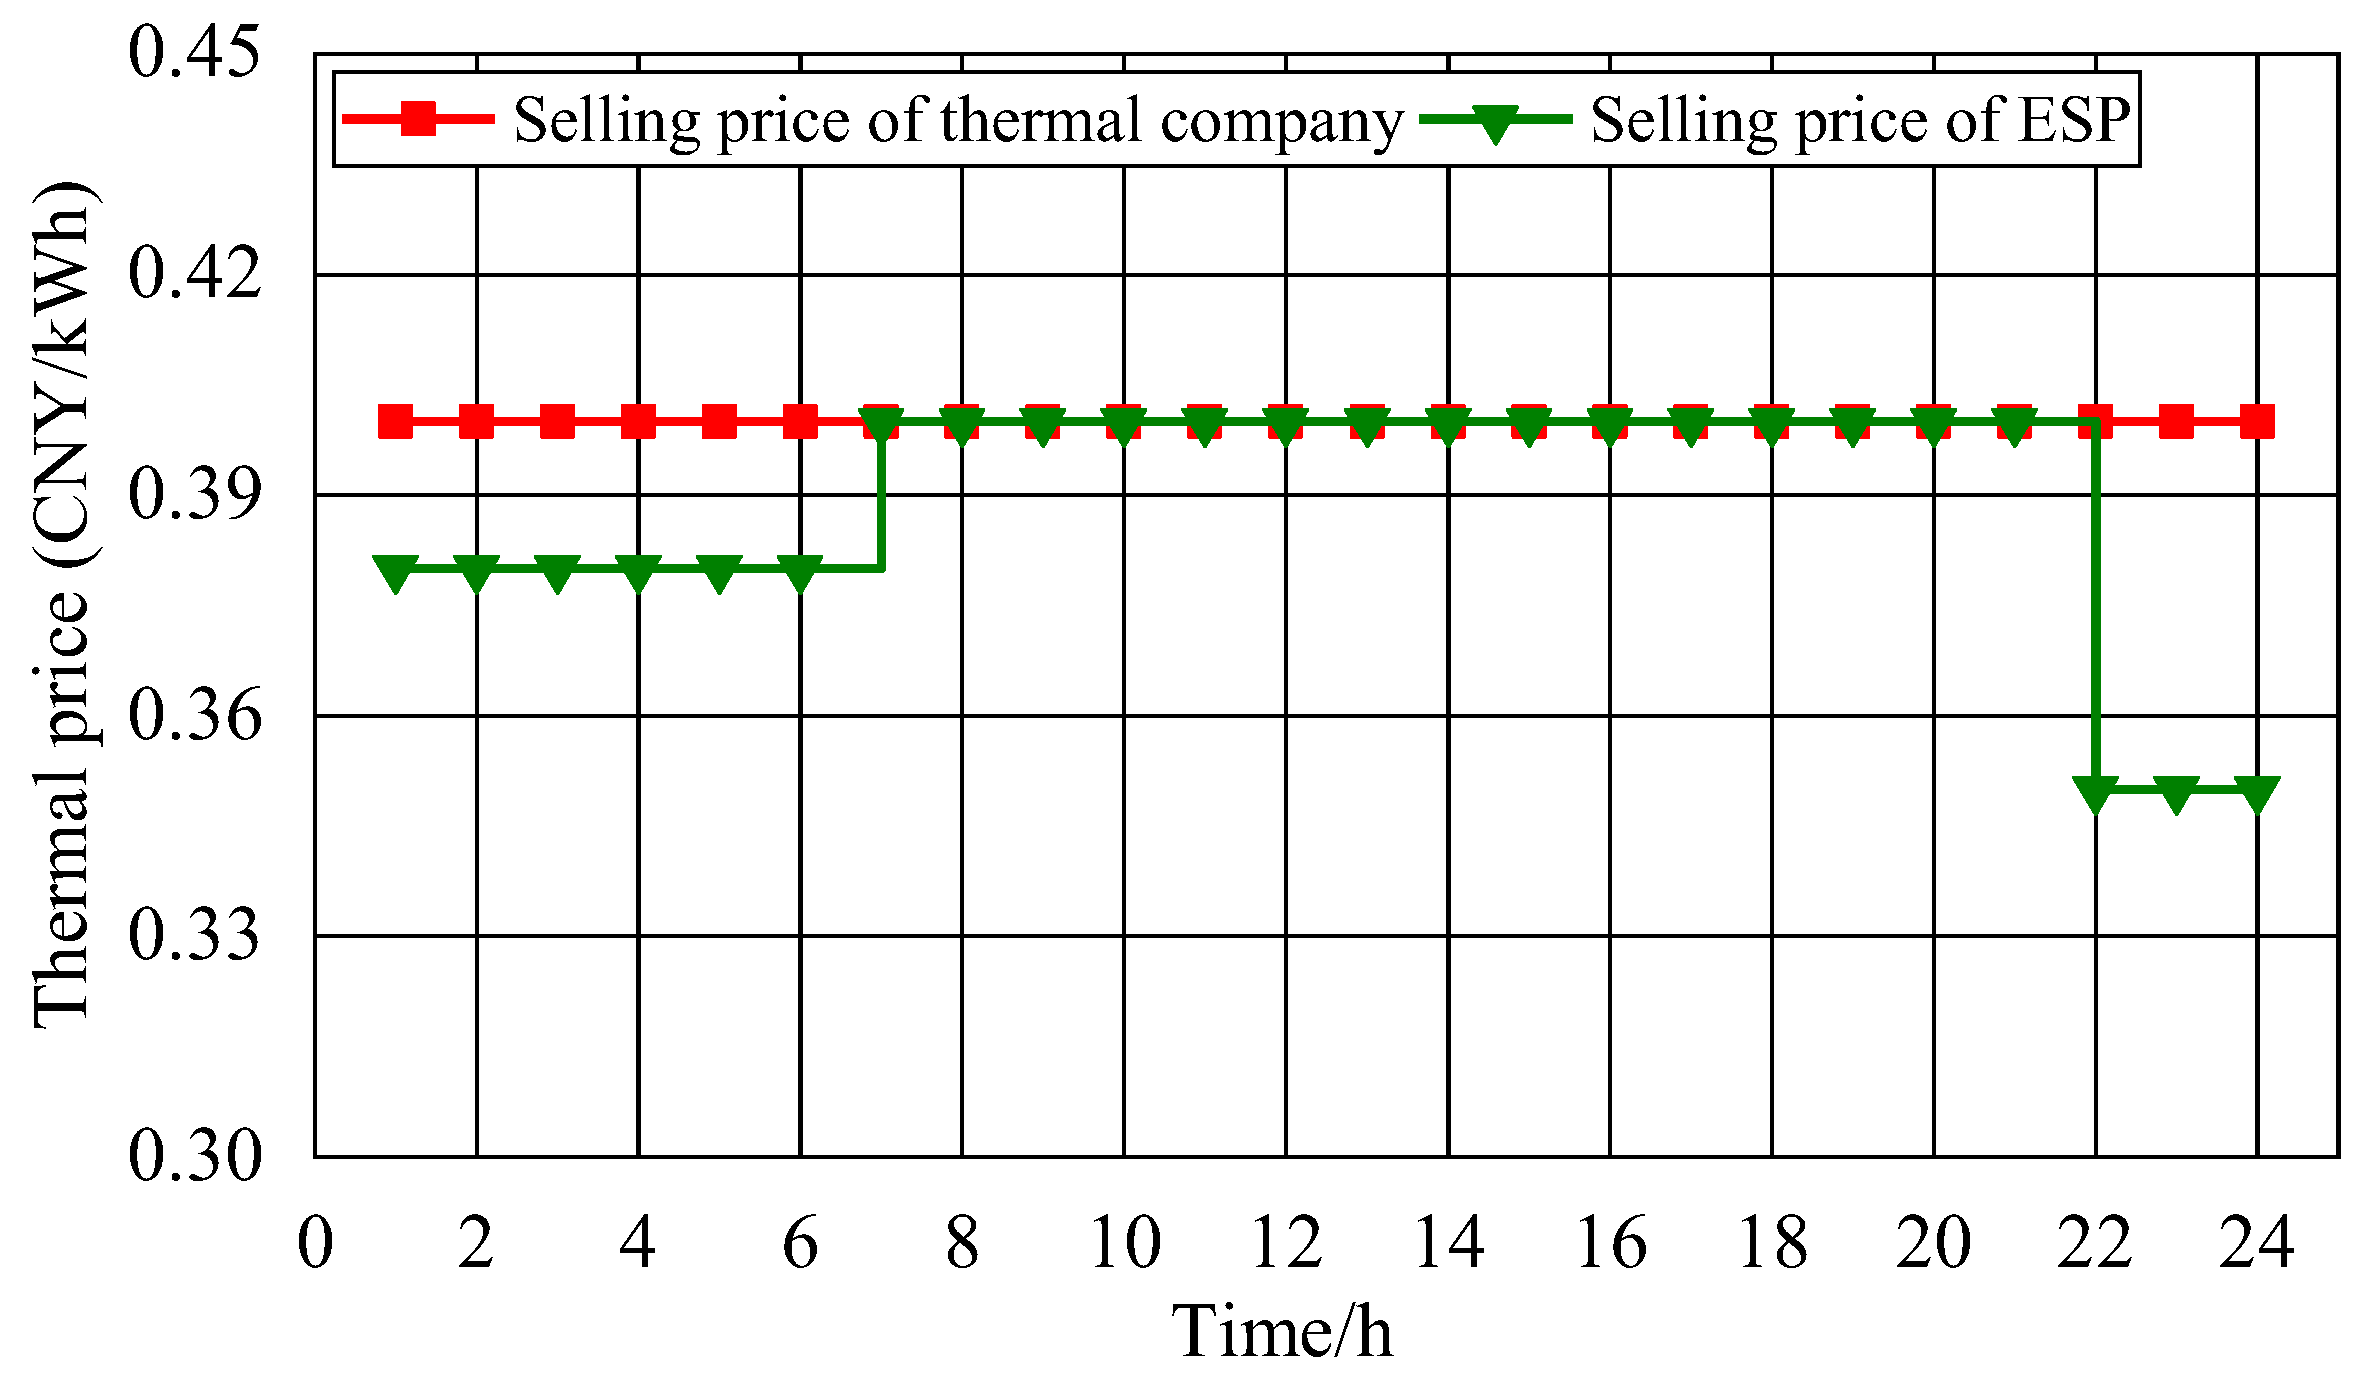
Figure 5 shows the optimal electricity price strategy of the ESP, and Figure 6 shows the optimal heating price strategy of the ESP. Figure 7 shows the optimal electric and thermal energy interaction strategy between the ESP and user cluster.
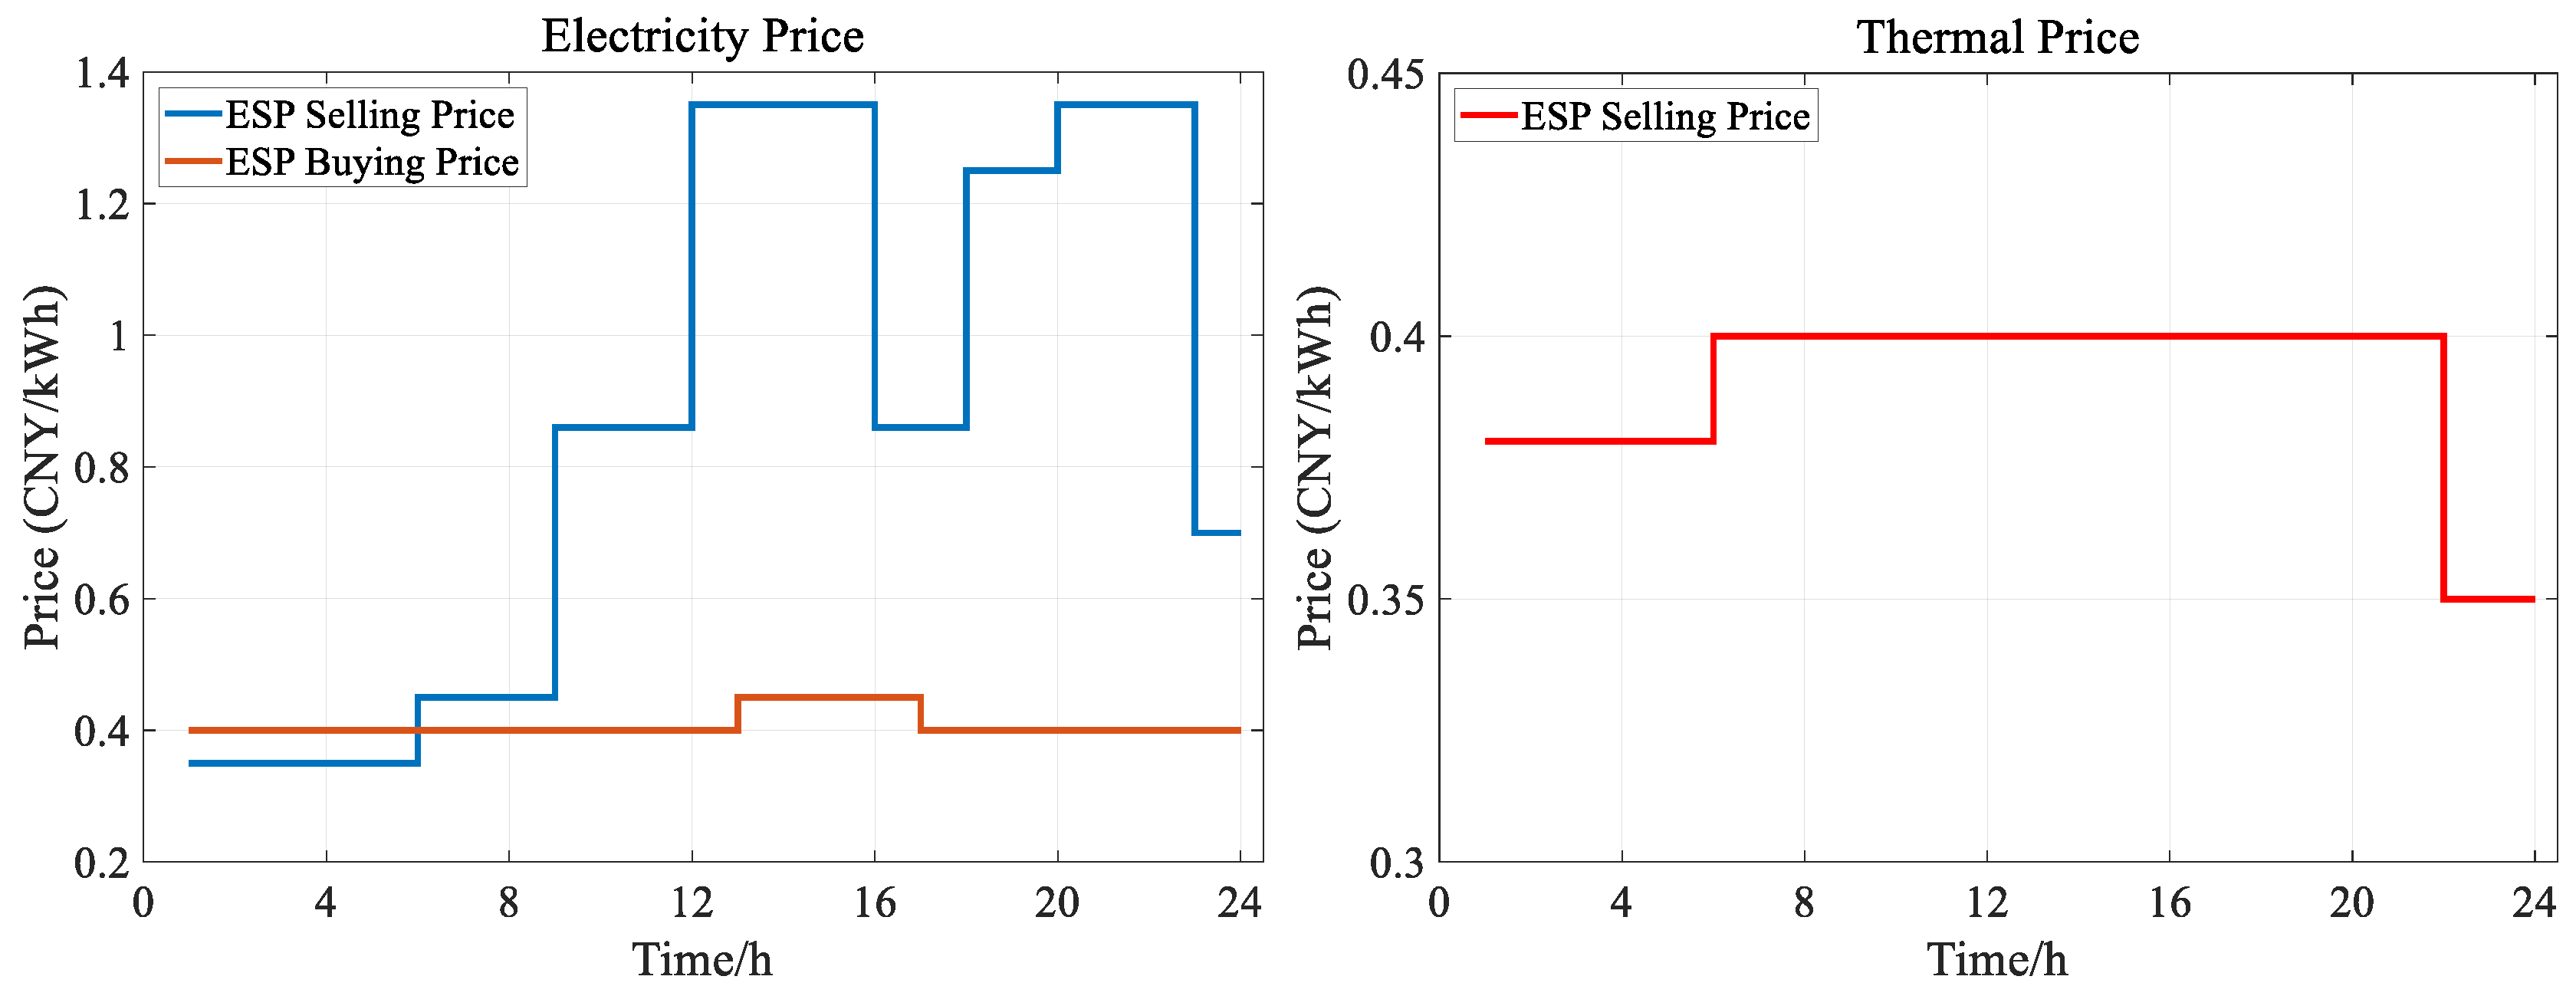
From the optimal electricity and heat price curves of the ESP in Figure 5 and Figure 6, it can be seen that the optimal electricity and heat prices of the ESP are always within the constraints of power grid electricity price and heat market price. In most time periods, the ESP adopts the same pricing strategy as the grid electricity price and thermal market price in order to ensure its own operating efficiency, while in some time periods, the ESP adopts a pricing strategy lower than the thermal market price in order to guide users to participate in the ESP electricity–thermal transactions.
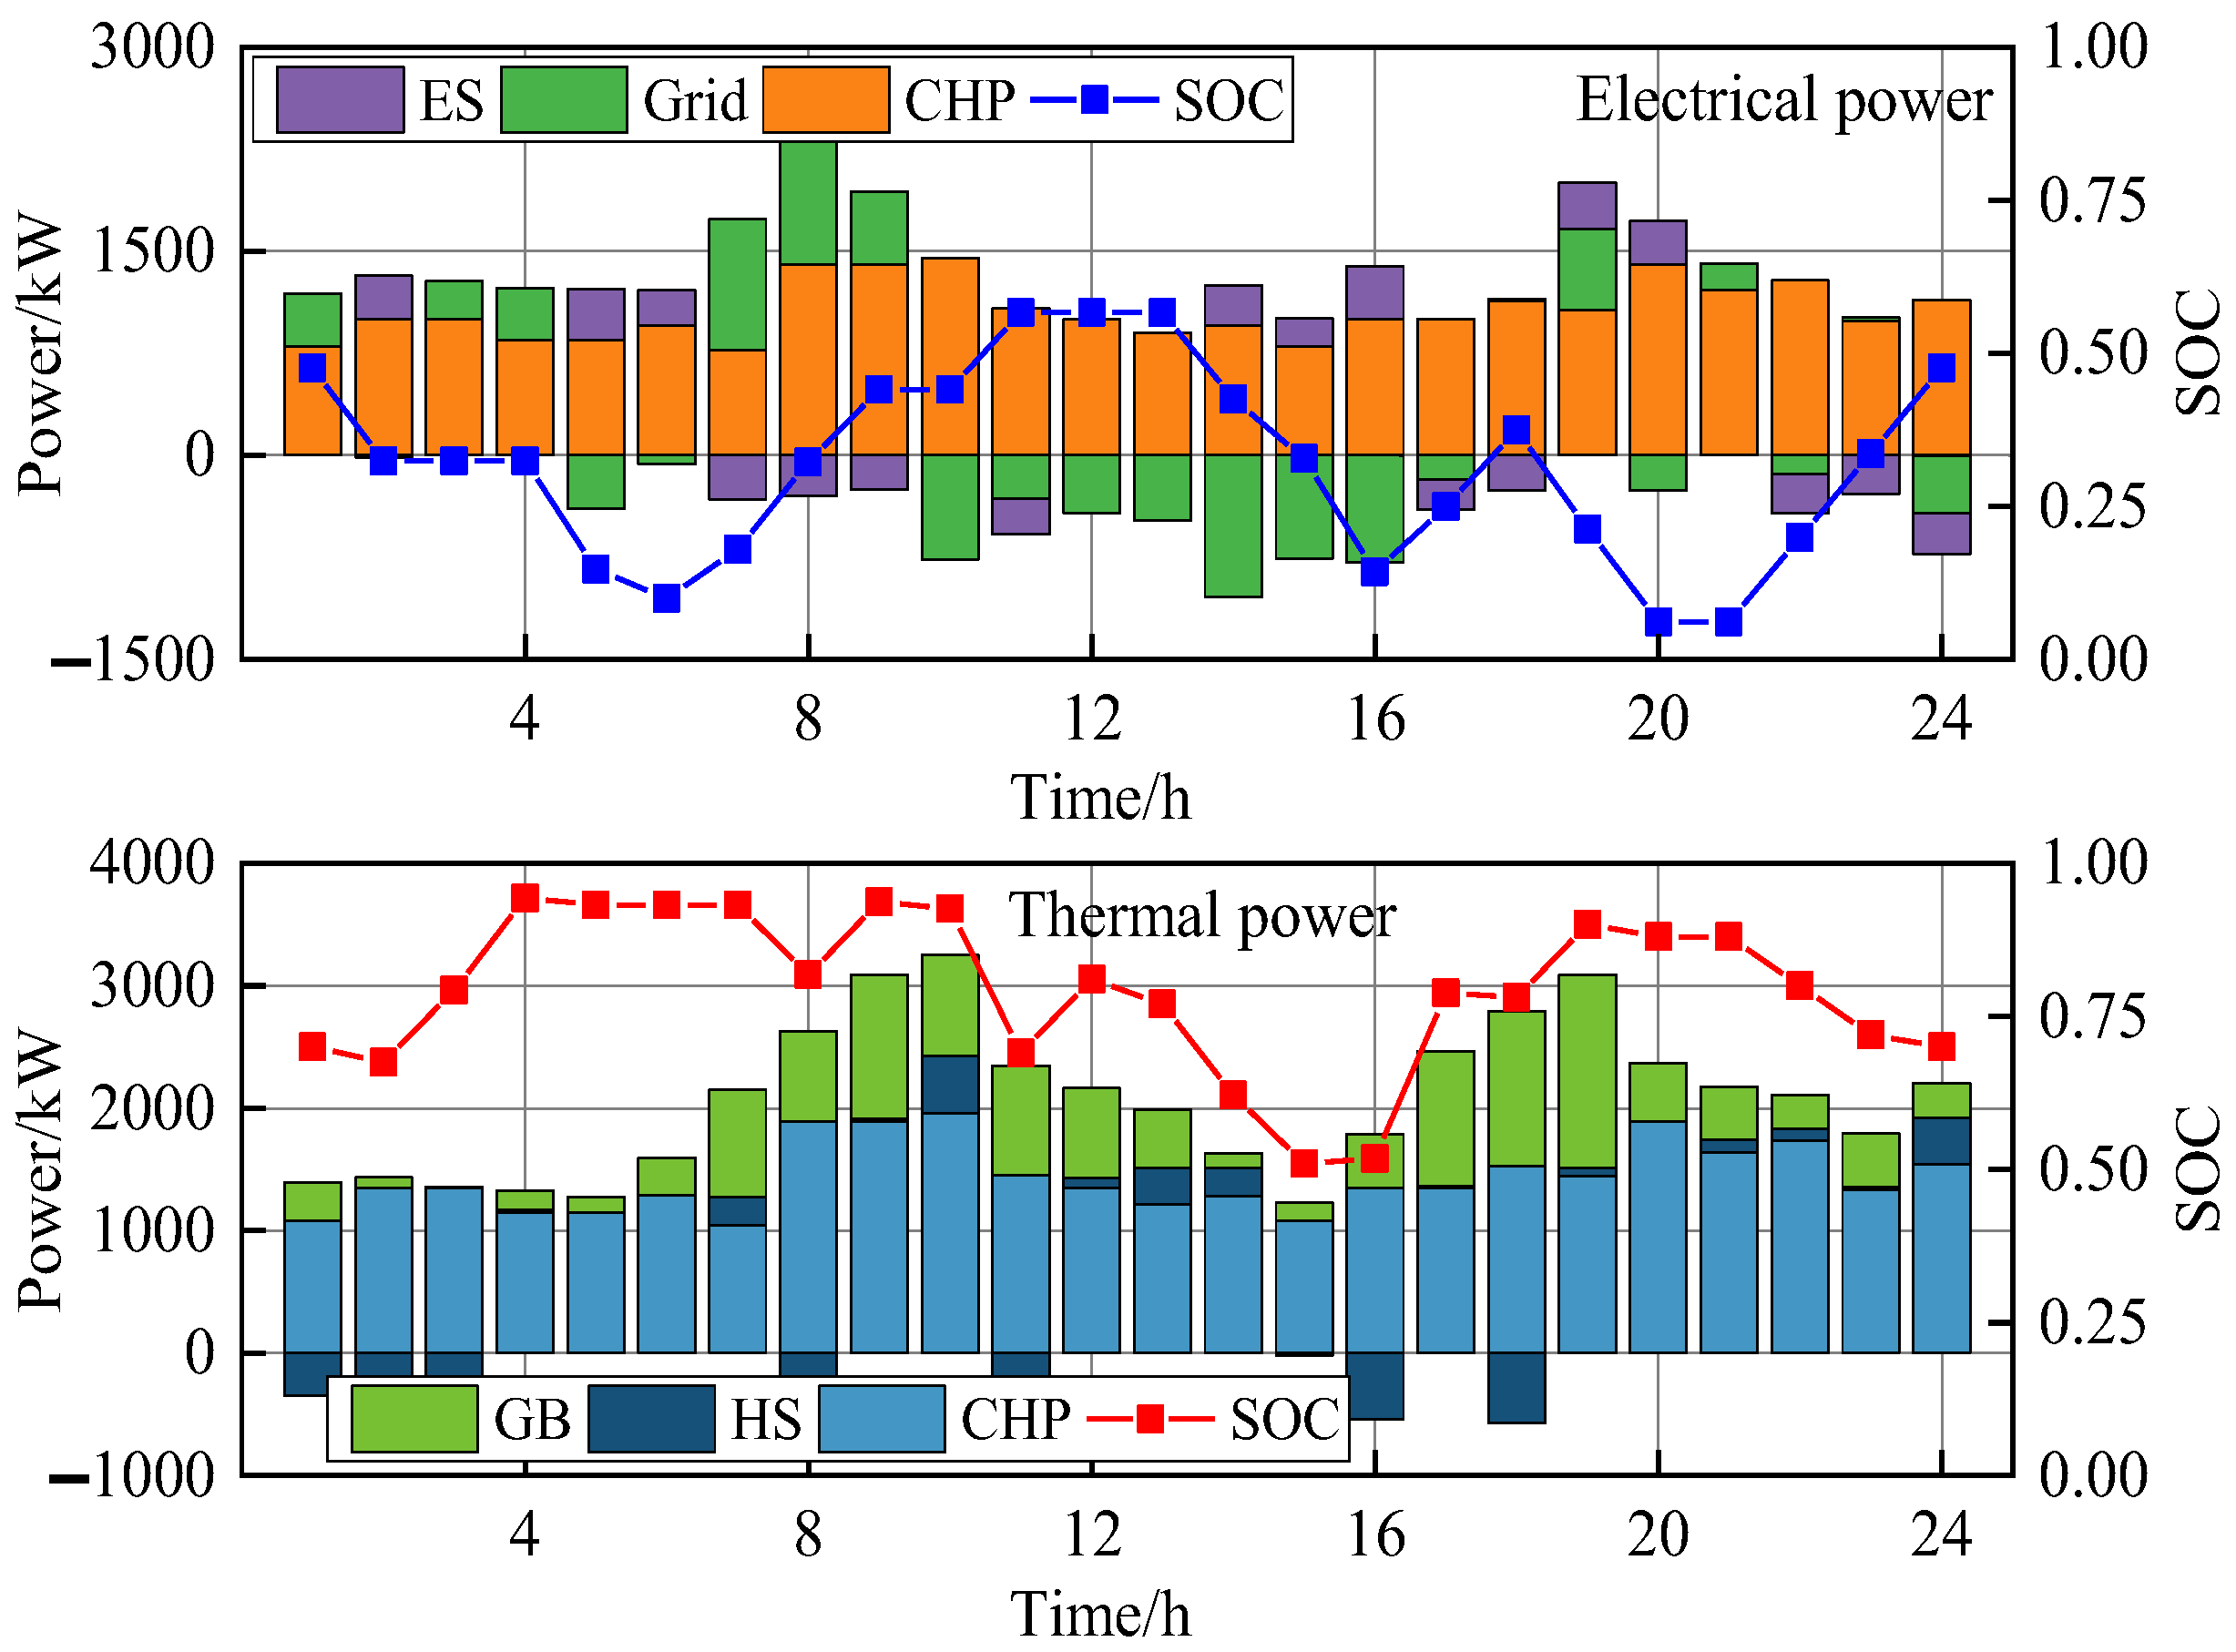
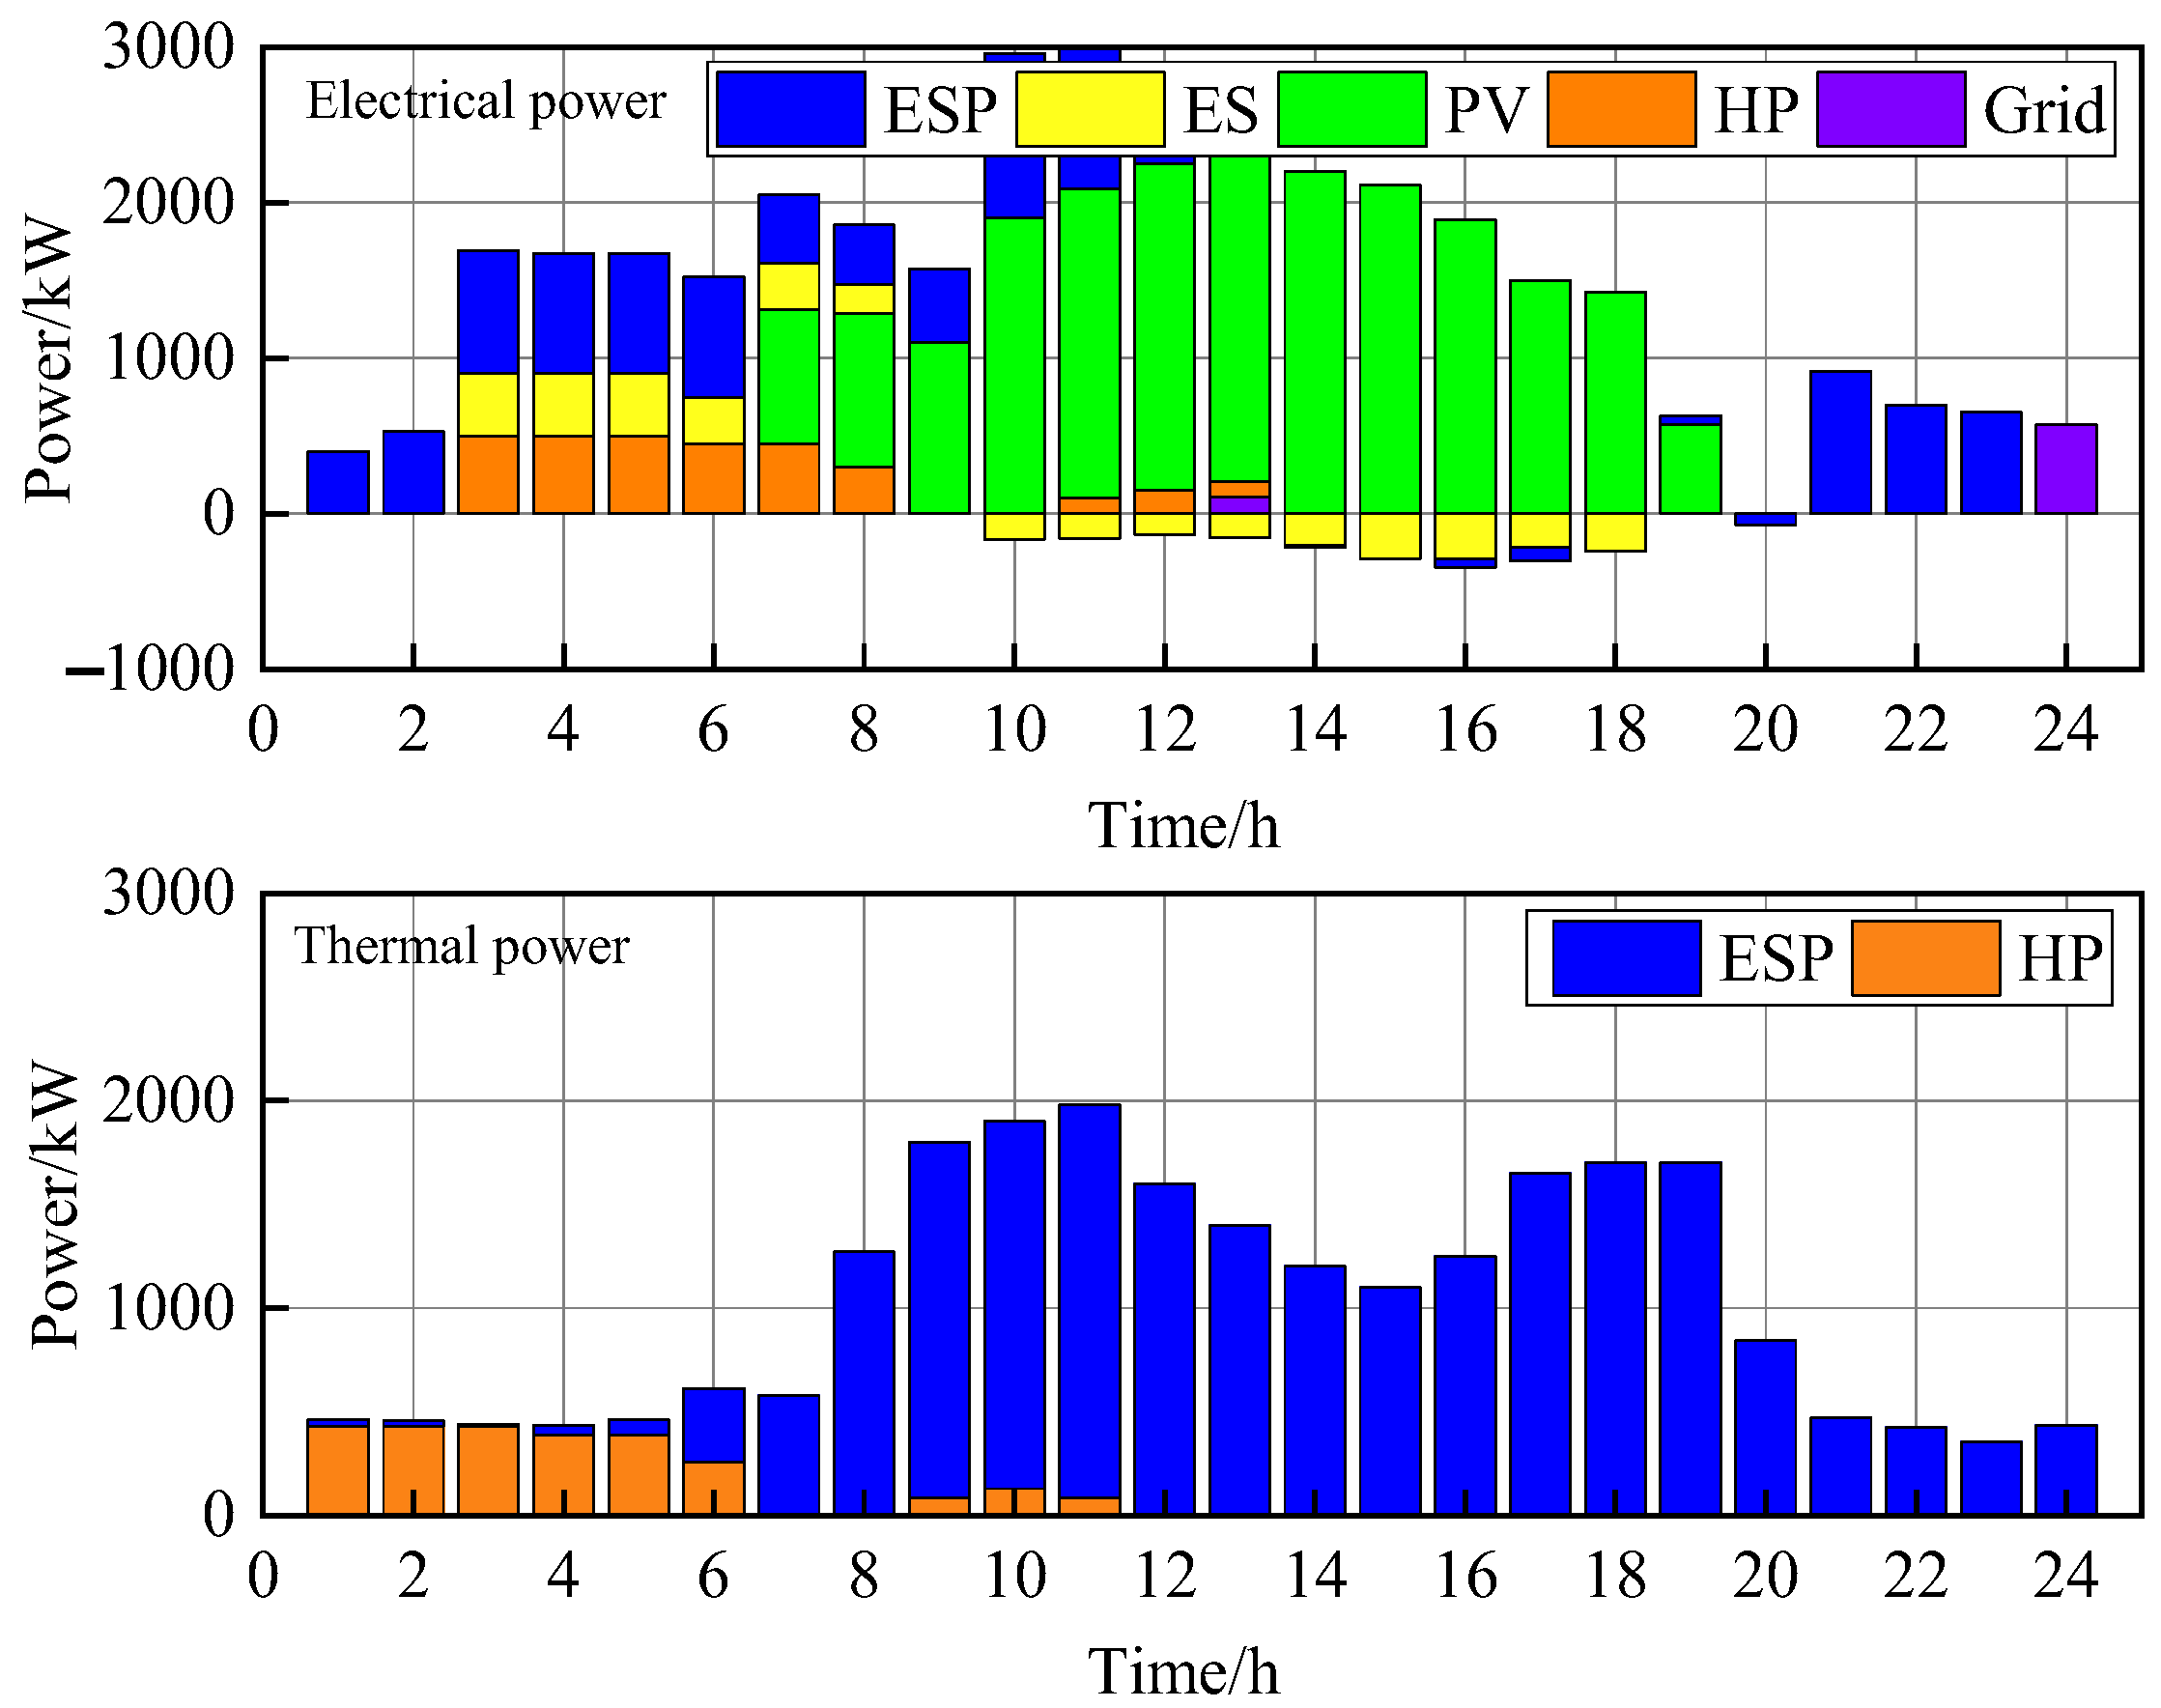
Since the ESP is the only external thermal supply source for users, the optimization of ESP operation should first meet the heating needs of user cluster 1 and user cluster 2 in Figure 7 by optimizing the cooperative heating strategy of the CHP, GB, and HE. On this basis, the ES charging and discharging strategy and the power interaction strategy with the power grid are further optimized to meet the needs of its own low-carbon economic operation. Figure 8 shows the optimal unit operation strategy of the ESP.

5.2.2. Optimization Result of User Energy Management

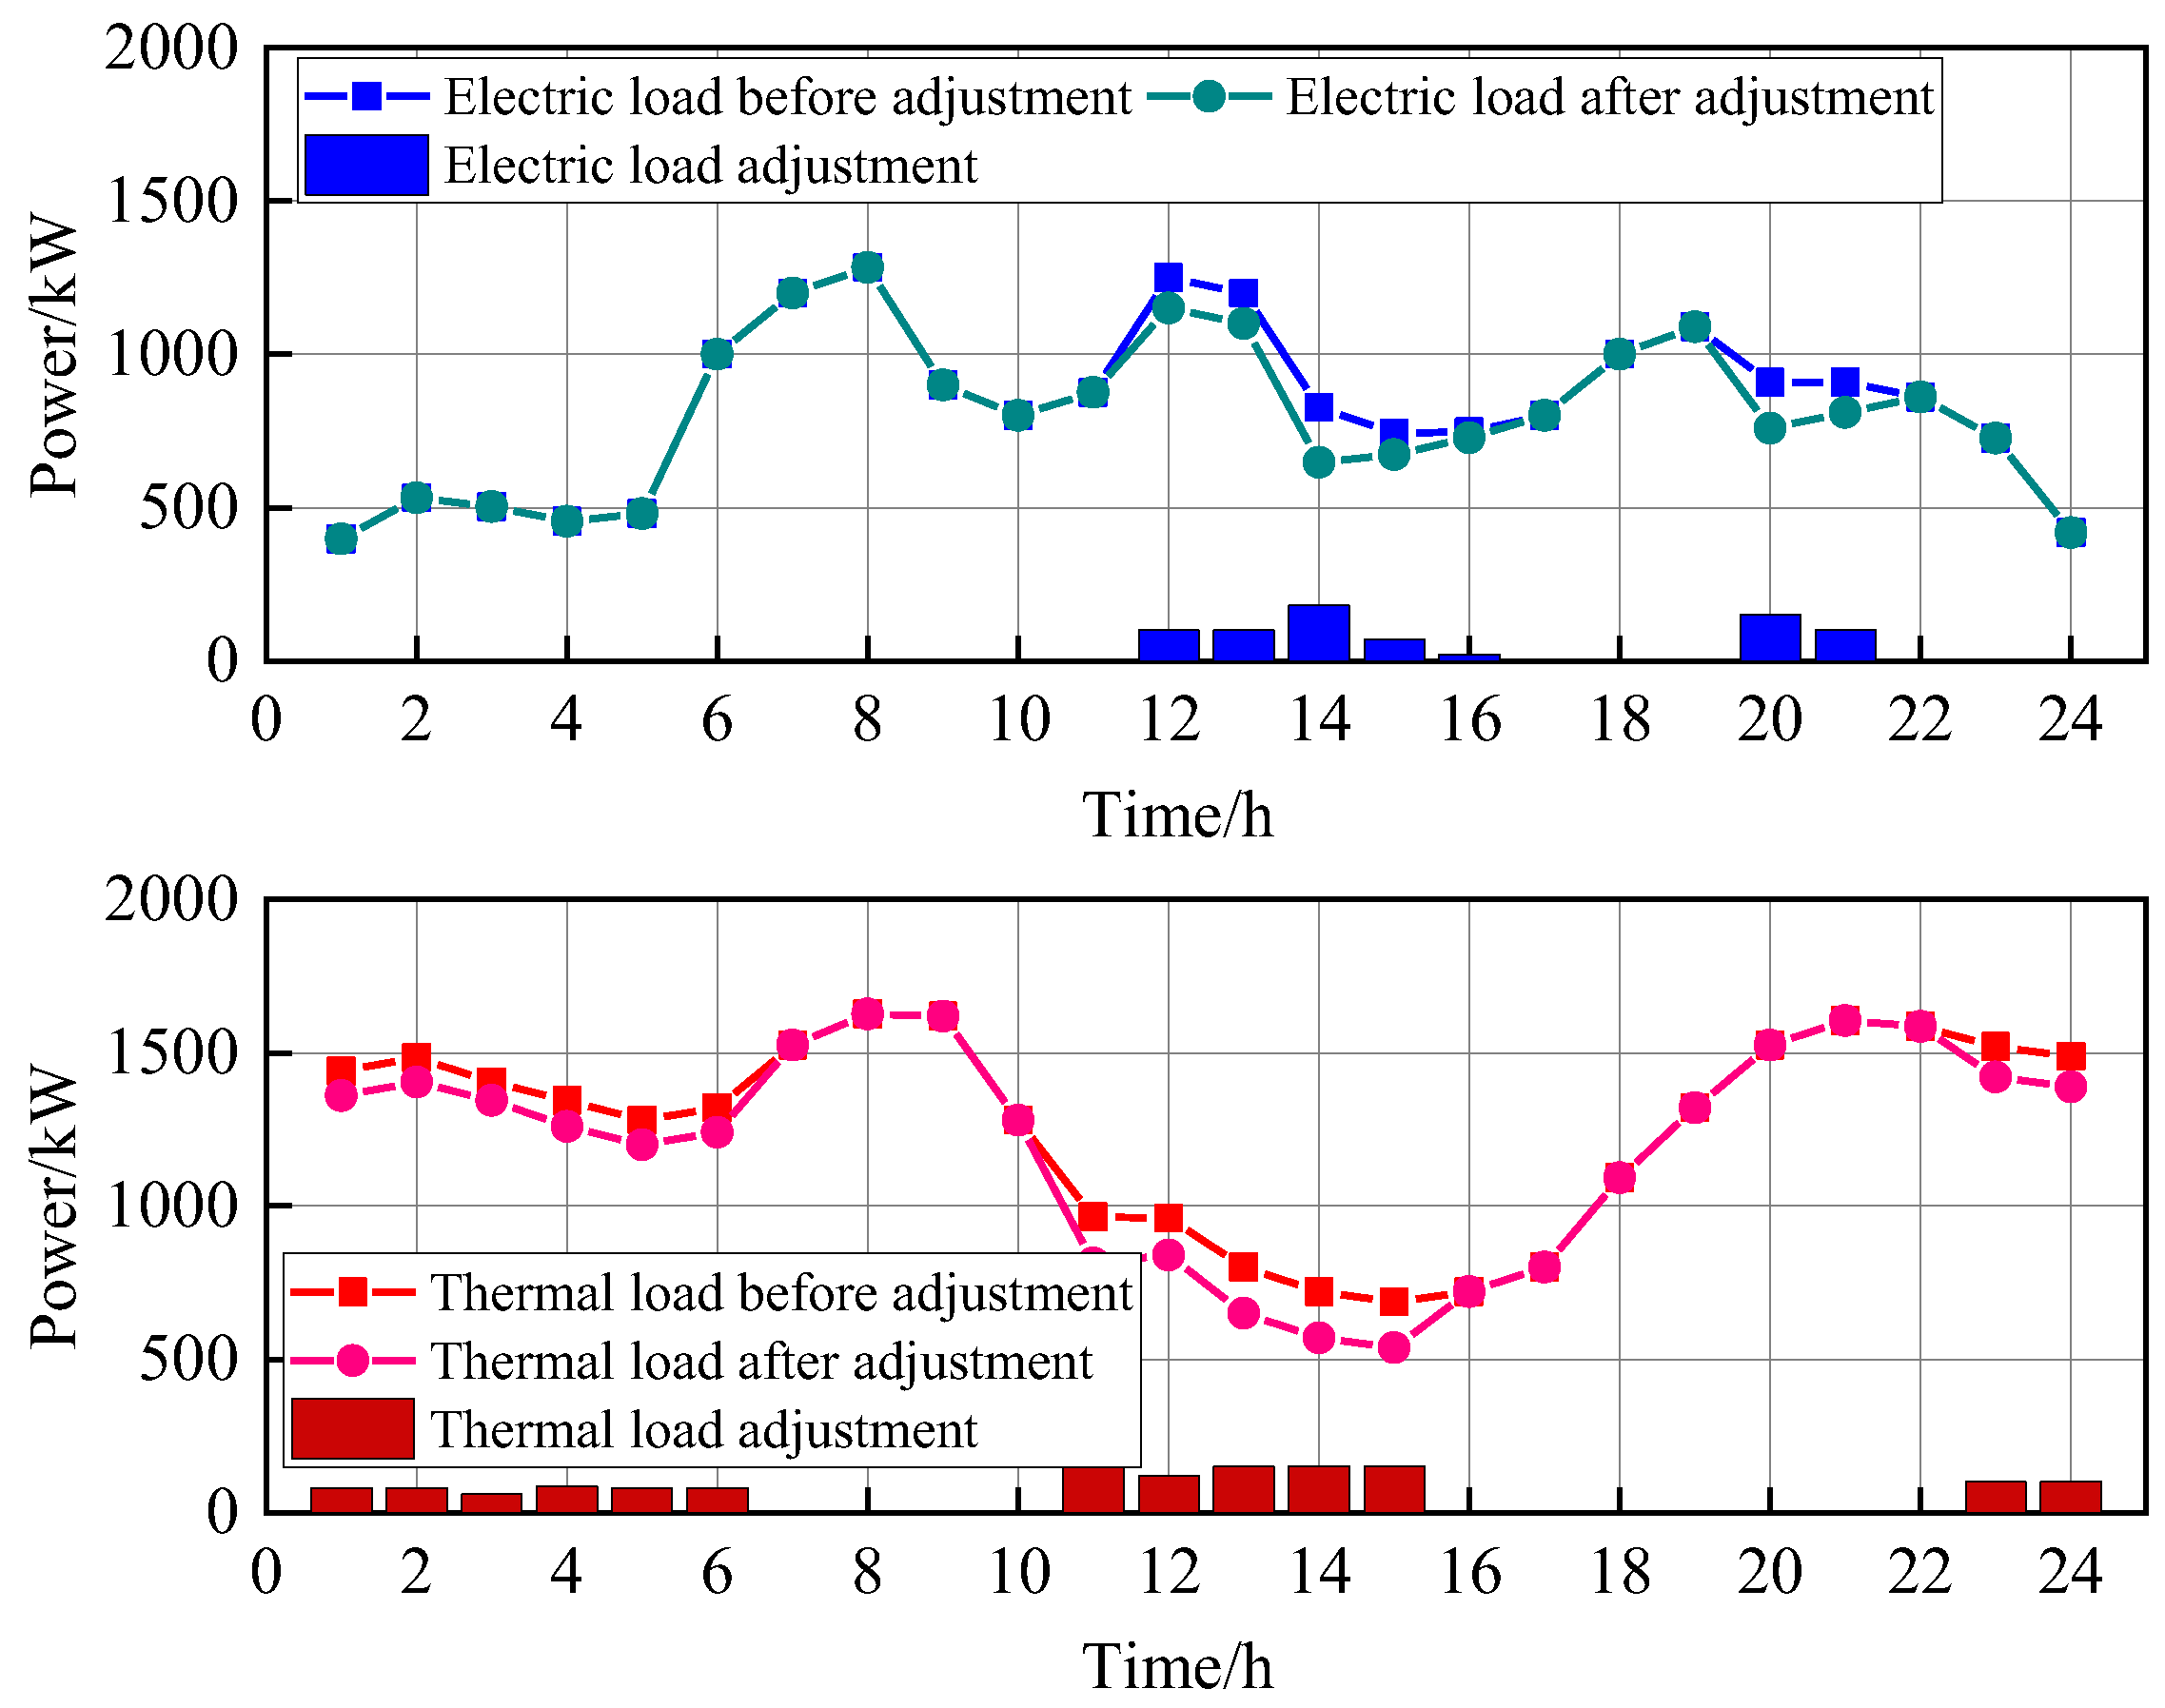
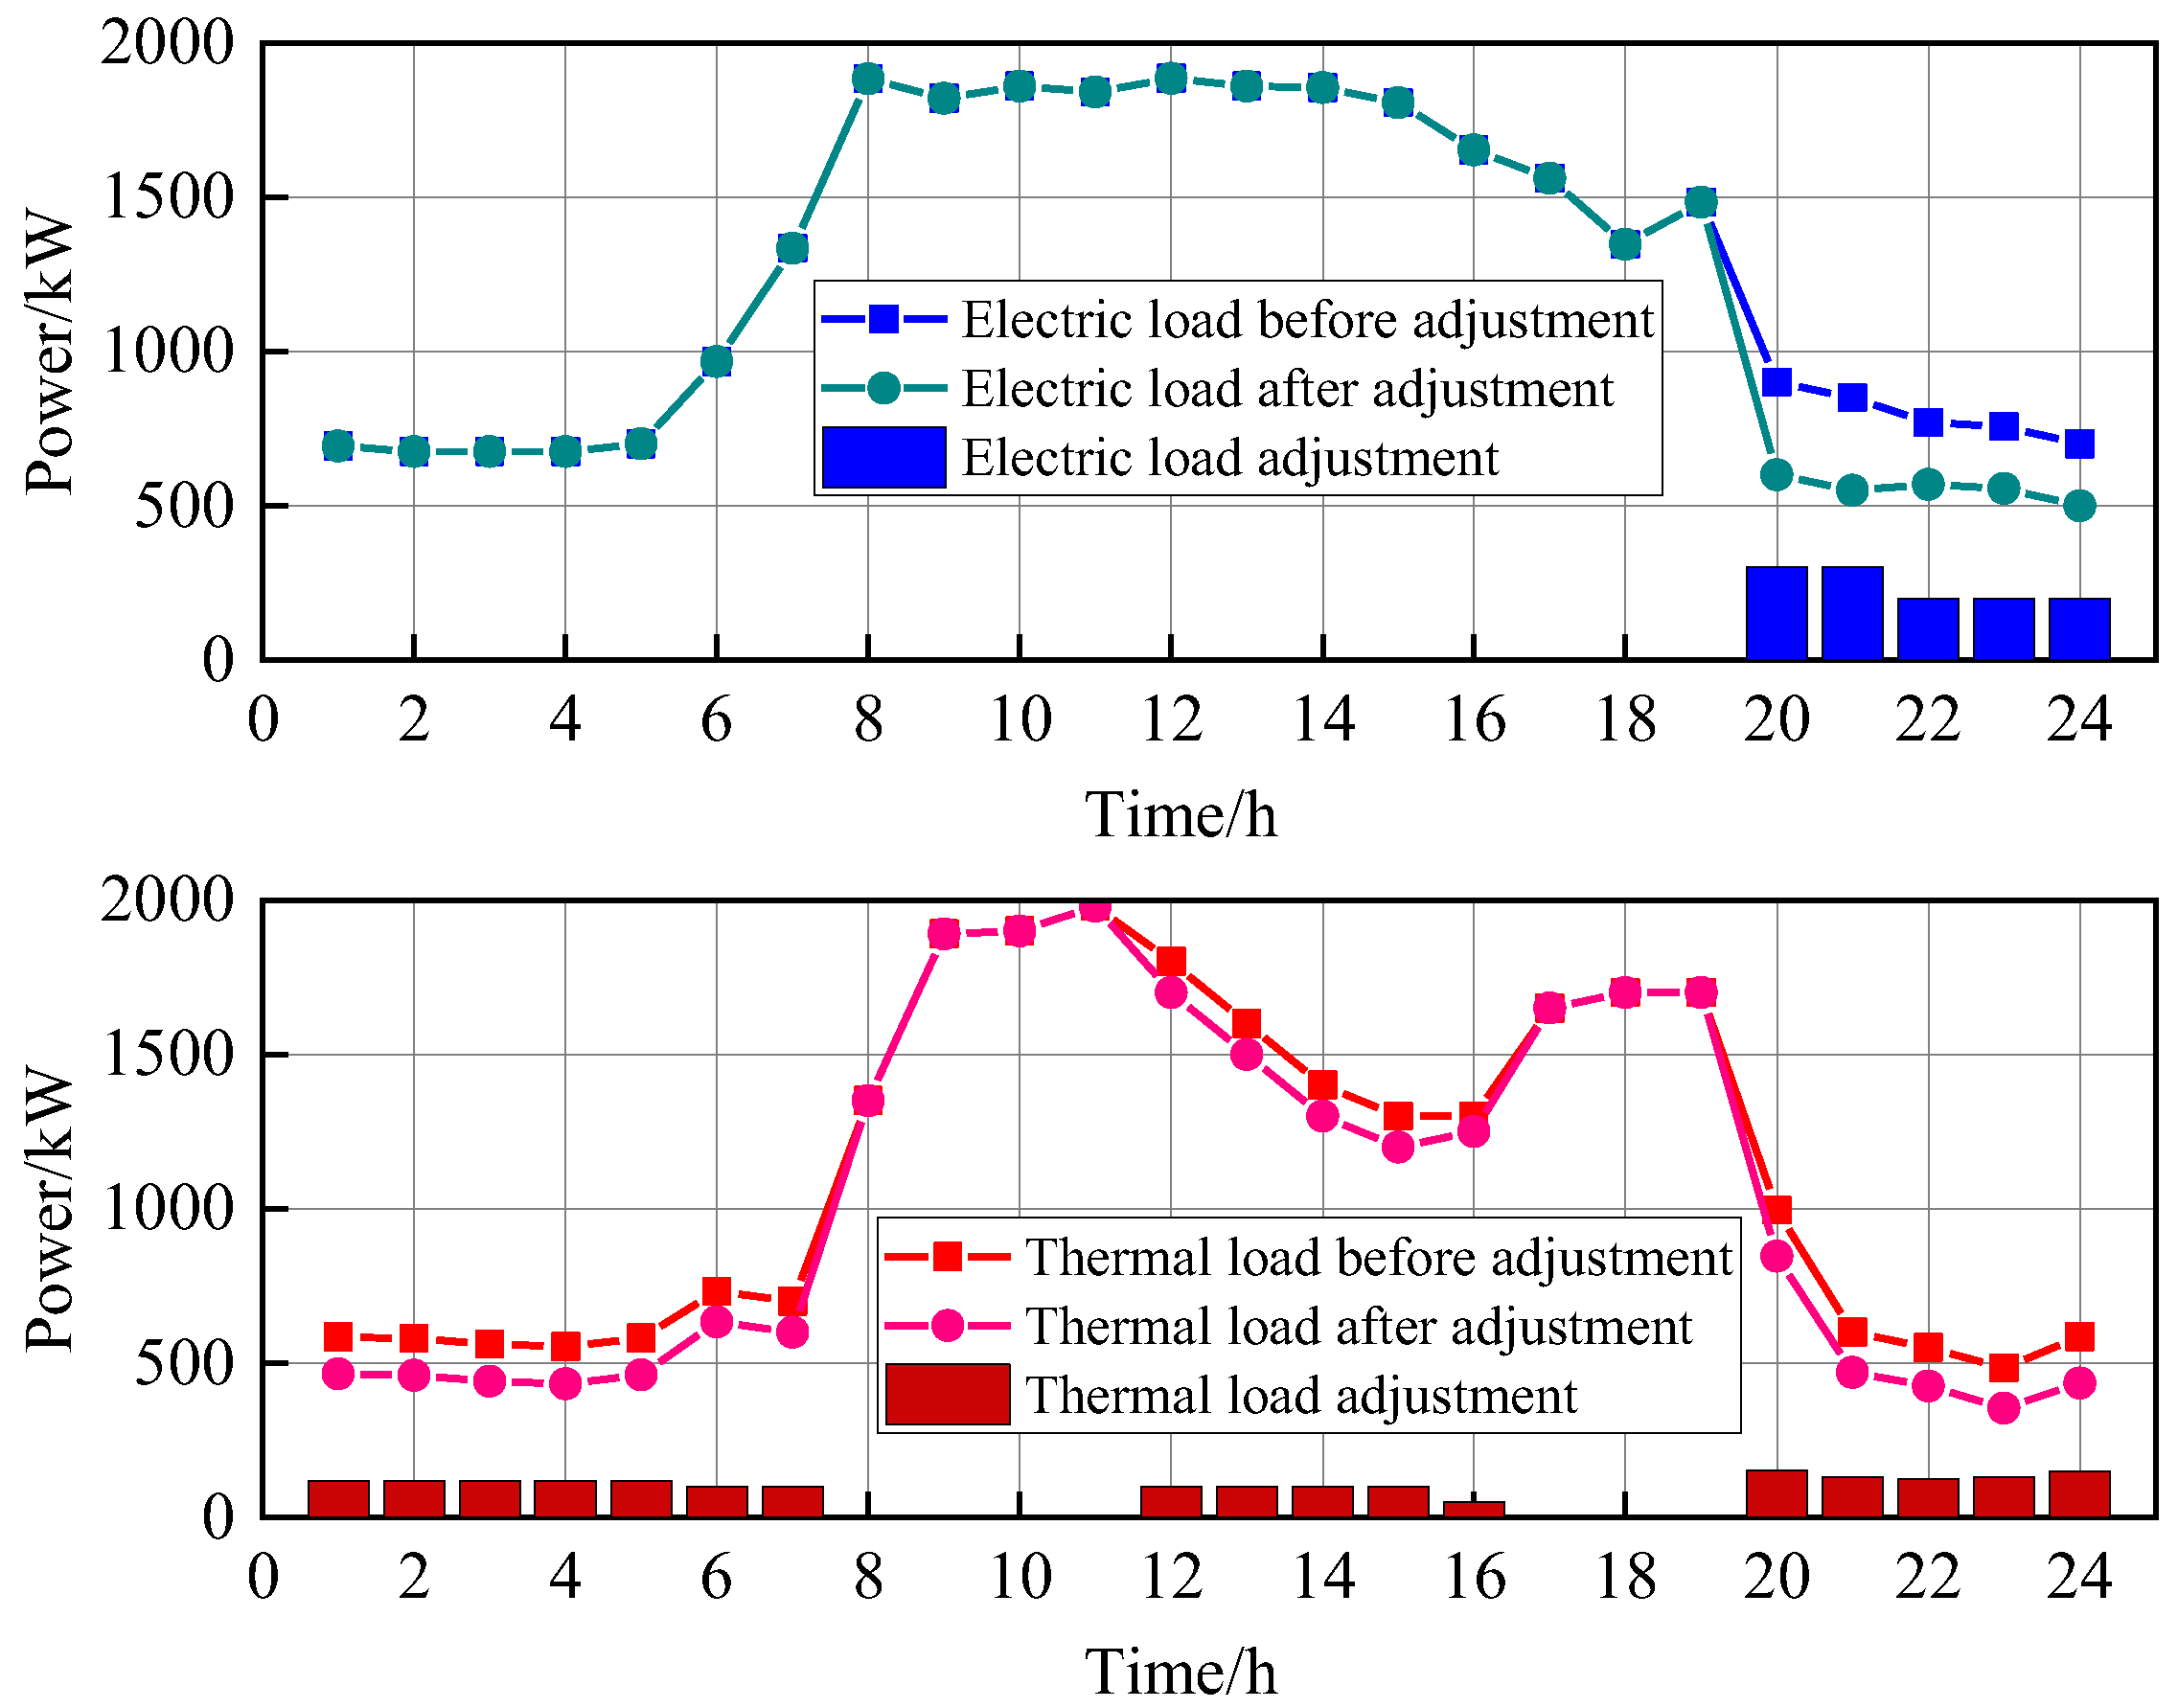
In the process of energy management, after receiving the electricity–thermal price signal of the ESP, the user cluster will optimize its energy consumption strategy with the goal of minimizing its own operating cost, including optimizing ES and HP operating strategies and optimizing the electricity–thermal load according to the electricity–thermal energy preference. Figure 9 and Figure 10 show the load optimization results and optimal operation strategy of user cluster 1, and Figure 11 and Figure 12 show the load optimization results and optimal operation strategy of user cluster 2, respectively.
As can be seen from Figure 9, the load curve of user cluster 1 shows obvious residents’ load characteristics. The electric load peaks at 7:00–9:00, 11:00–13:00, and 18:00–20:00, and the heat load is relatively high at 1:00–10:00 and 1:00–24:00. Therefore, the user cluster 1 loads during the off-load peak period during load optimization.
Under the dual constraints of ESP price strategy and user energy preference, user cluster 1 simultaneously optimizes PV, HP equipment operation strategy, and interaction power with the ESP. As can be seen from Figure 10, user cluster 1 starts the HP for heating from 7:00 to 16:00, gives priority to its own heating through PV power generation, and provides heating through the ESP at night.
As can be seen from Figure 11, the load curve of user cluster 2 shows obvious commercial/office load characteristics. The electric load and heat load both peak at 8:00–20:00, and the above load characteristics show the characteristics changing according to business hours/office hours. Compared with the load regulation characteristics of user cluster 1, user cluster 2 has almost no load regulation during the peak hours of electricity load but has greatly reduced the load during non-business/non-office hours, and the thermal load regulation also shows similar regulation characteristics as the electric load regulation.
Compared with user cluster 1, user cluster 2 shows obvious differences in its operation optimization strategy because of its ES configuration and different load characteristics. User cluster 2 gives priority to PV power generation to meet the power supply demand during the peak hours of 8:00–20:00 and stores the surplus power in the ES to meet the power demand of the HP heating at night. However, in the peak period of thermal load, considering the economy, user cluster 2 mainly supplies thermal through the ESP in addition to reducing part of the thermal load to ensure the basic thermal load demand.

5.3. Discussion and Analysis

5.3.1. Analysis of Operation Economy and Carbon Emission

Figure 13 is the convergence curve of each user and ESP objective function. According to the calculation data in Figure 13, the algorithm converges after 14 iterations, which takes 6.55 s; when the algorithm converges, the objective function values of user cluster 1, user cluster 2, and ESP are 24,758.50 CNY, 21,182.61 CNY, and 3103.72 CNY, respectively.
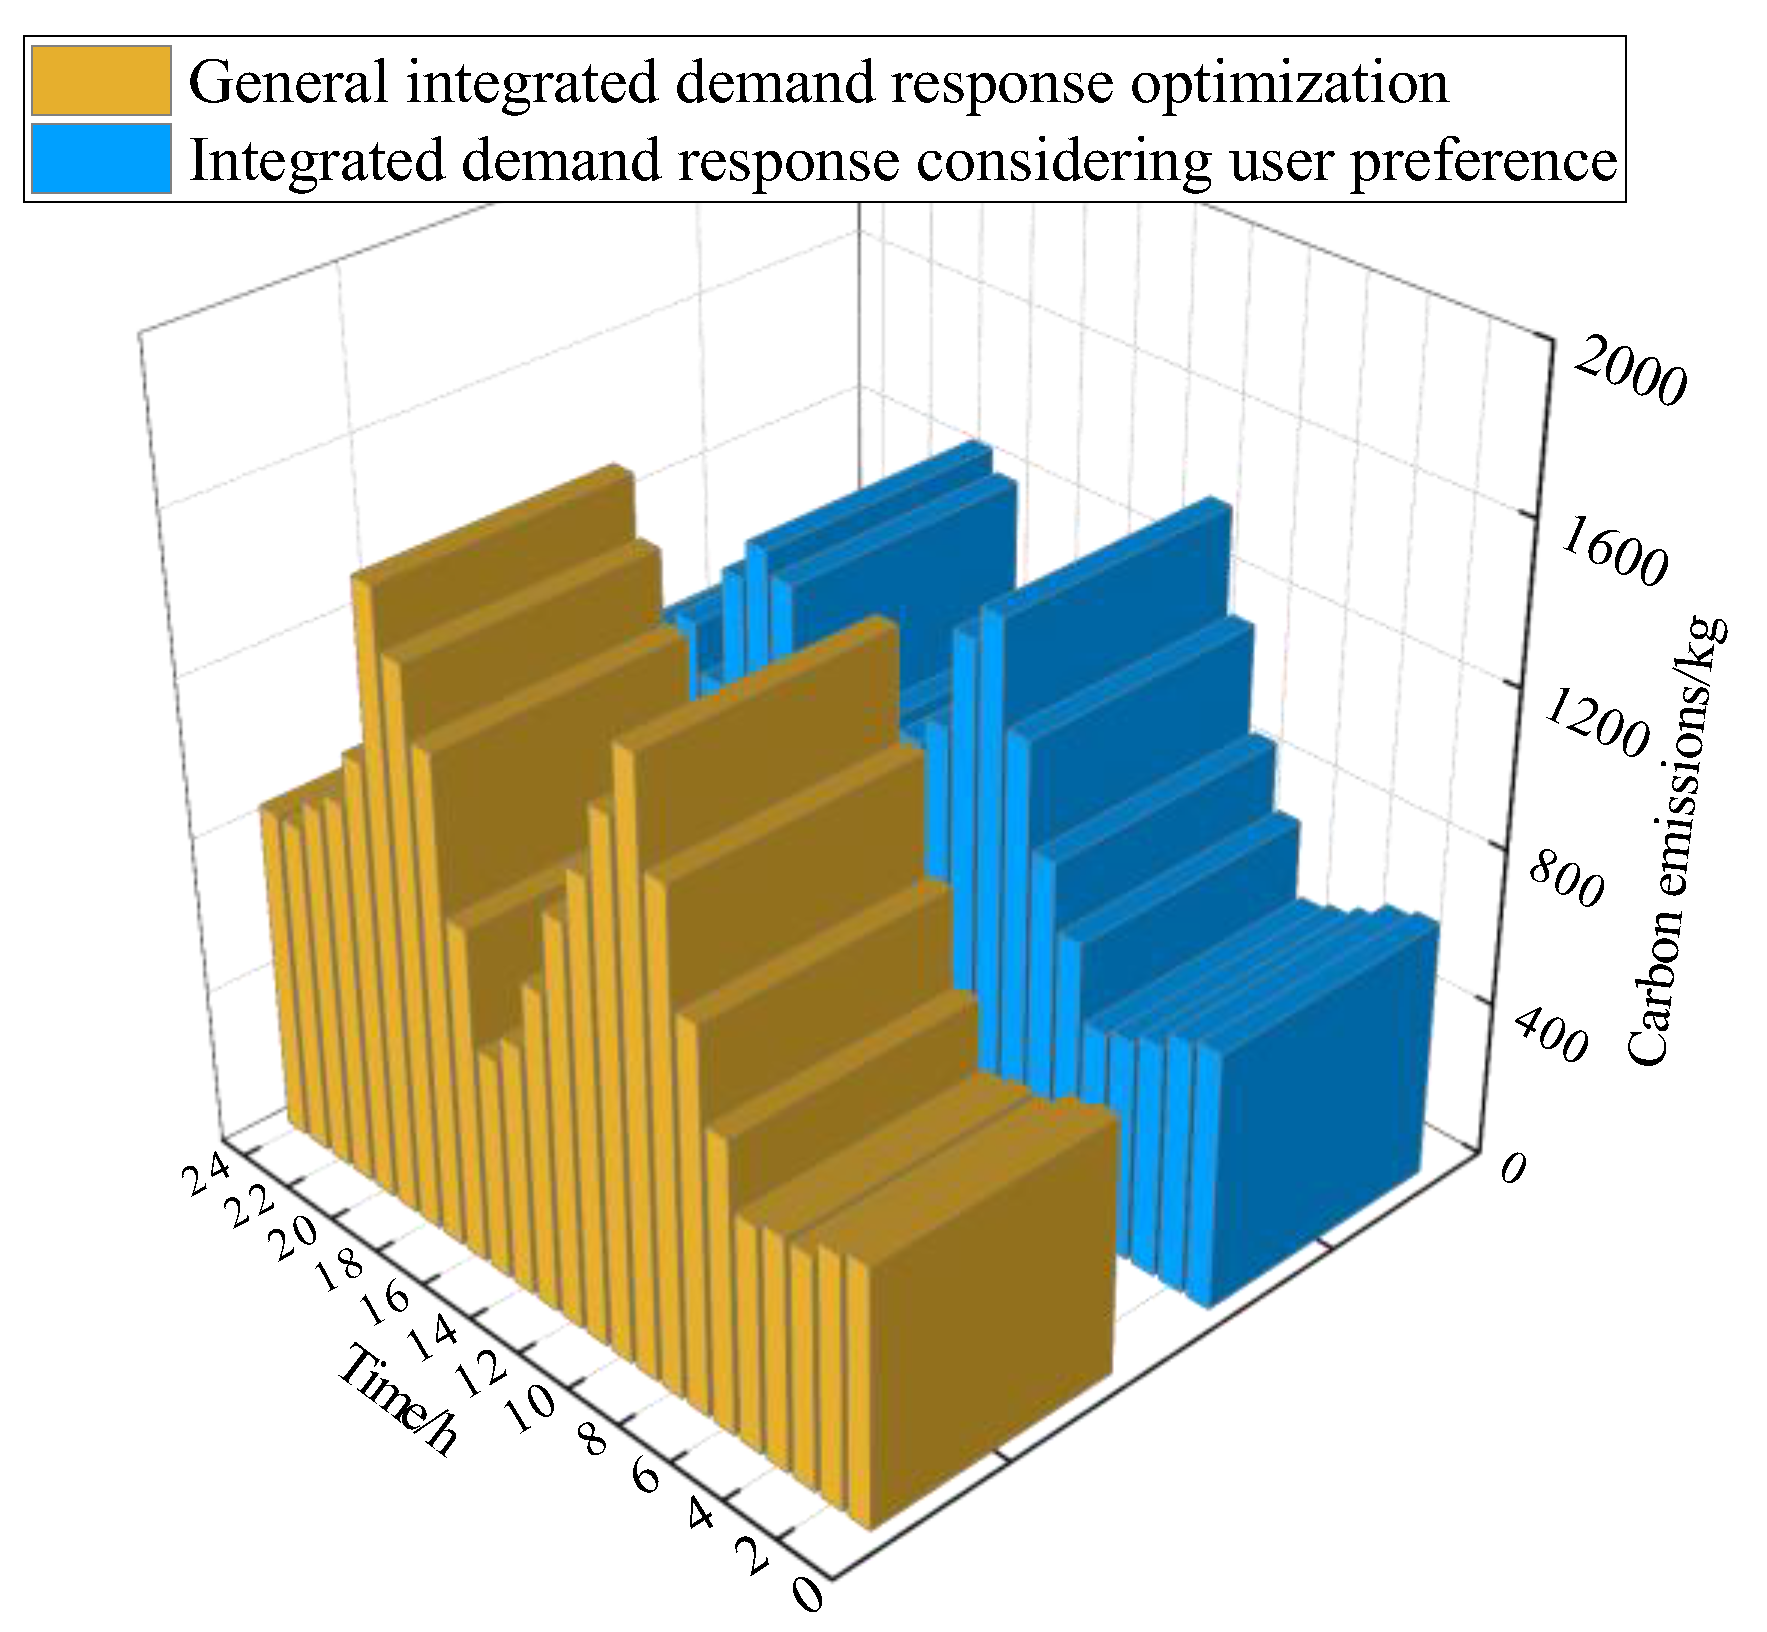
In order to further verify the effectiveness of the model established in this paper in improving system operation economy and reducing carbon emissions, this section compares the results of the proposed IDR optimization considering user preferences with those of the conventional IDR optimization. Among them, the conventional IDR optimization users directly optimize the load according to the price of the ESP, considering the preference of power supply and heating source. Table 3 shows the results of cost–benefit analysis of user clusters, Table 4 shows the results of cost–benefit analysis of ESP, and Figure 14 shows the results of carbon emission of the system.
As can be seen from the data in Table 3, compared with the conventional IDR optimization, the total operating costs of user cluster 1 and user cluster 2 are reduced by 6.98% and 0.36%, respectively, and the loss costs of user satisfaction are reduced by 11.45% and 17.18%, respectively. For user cluster 1, after considering the energy preference, the adjustment flexibility of load optimization becomes greater, the synergy between load adjustment and unit operation optimization is stronger, and its operation cost and satisfaction loss cost are greatly reduced.
Compared with user cluster 1, after considering the energy preference, user cluster 2 can adjust the electric heating load to better meet the user’s energy supply preference, and its loss cost of user satisfaction is greatly reduced. However, it also leads to a smaller load adjustment range during the peak period of electric heating load and needs to optimize the PV, ES, and trading power with the ESP and power grid to meet the energy demand. Its unit operation and maintenance cost increases by 4.04%, the total electric heating transaction cost increases by 3.38%, and the total operating cost decreases by 0.36%.
As can be seen from the data in Table 4, compared with the conventional IDR optimization, the total operating benefit of the ESP improved by 10.79% after IDR optimization considering user preferences, and the environmental cost was reduced by 5.05%. Figure 14 shows the analysis of carbon emission results, and Table 5 shows the carbon emission source of the test system.
According to the calculation data in Figure 14 and Table 5, in the case of conventional IDR optimization, the flexibility of ESP operation optimization is limited due to the rigid adjustment of user cluster load, and the total carbon emission of the system reaches 22,946.39 kg. After considering the user’s energy preference, the flexibility of the user’s load adjustment is enhanced, which improves the collaborative optimization ability between the user cluster and ESP, and the flexibility of ESP operation optimization is enhanced. The total carbon emission of the system is 21,787.64 kg, which is 5.05% lower than that of conventional IDR optimization.

5.3.2. Scalability Verification of the Proposed Method

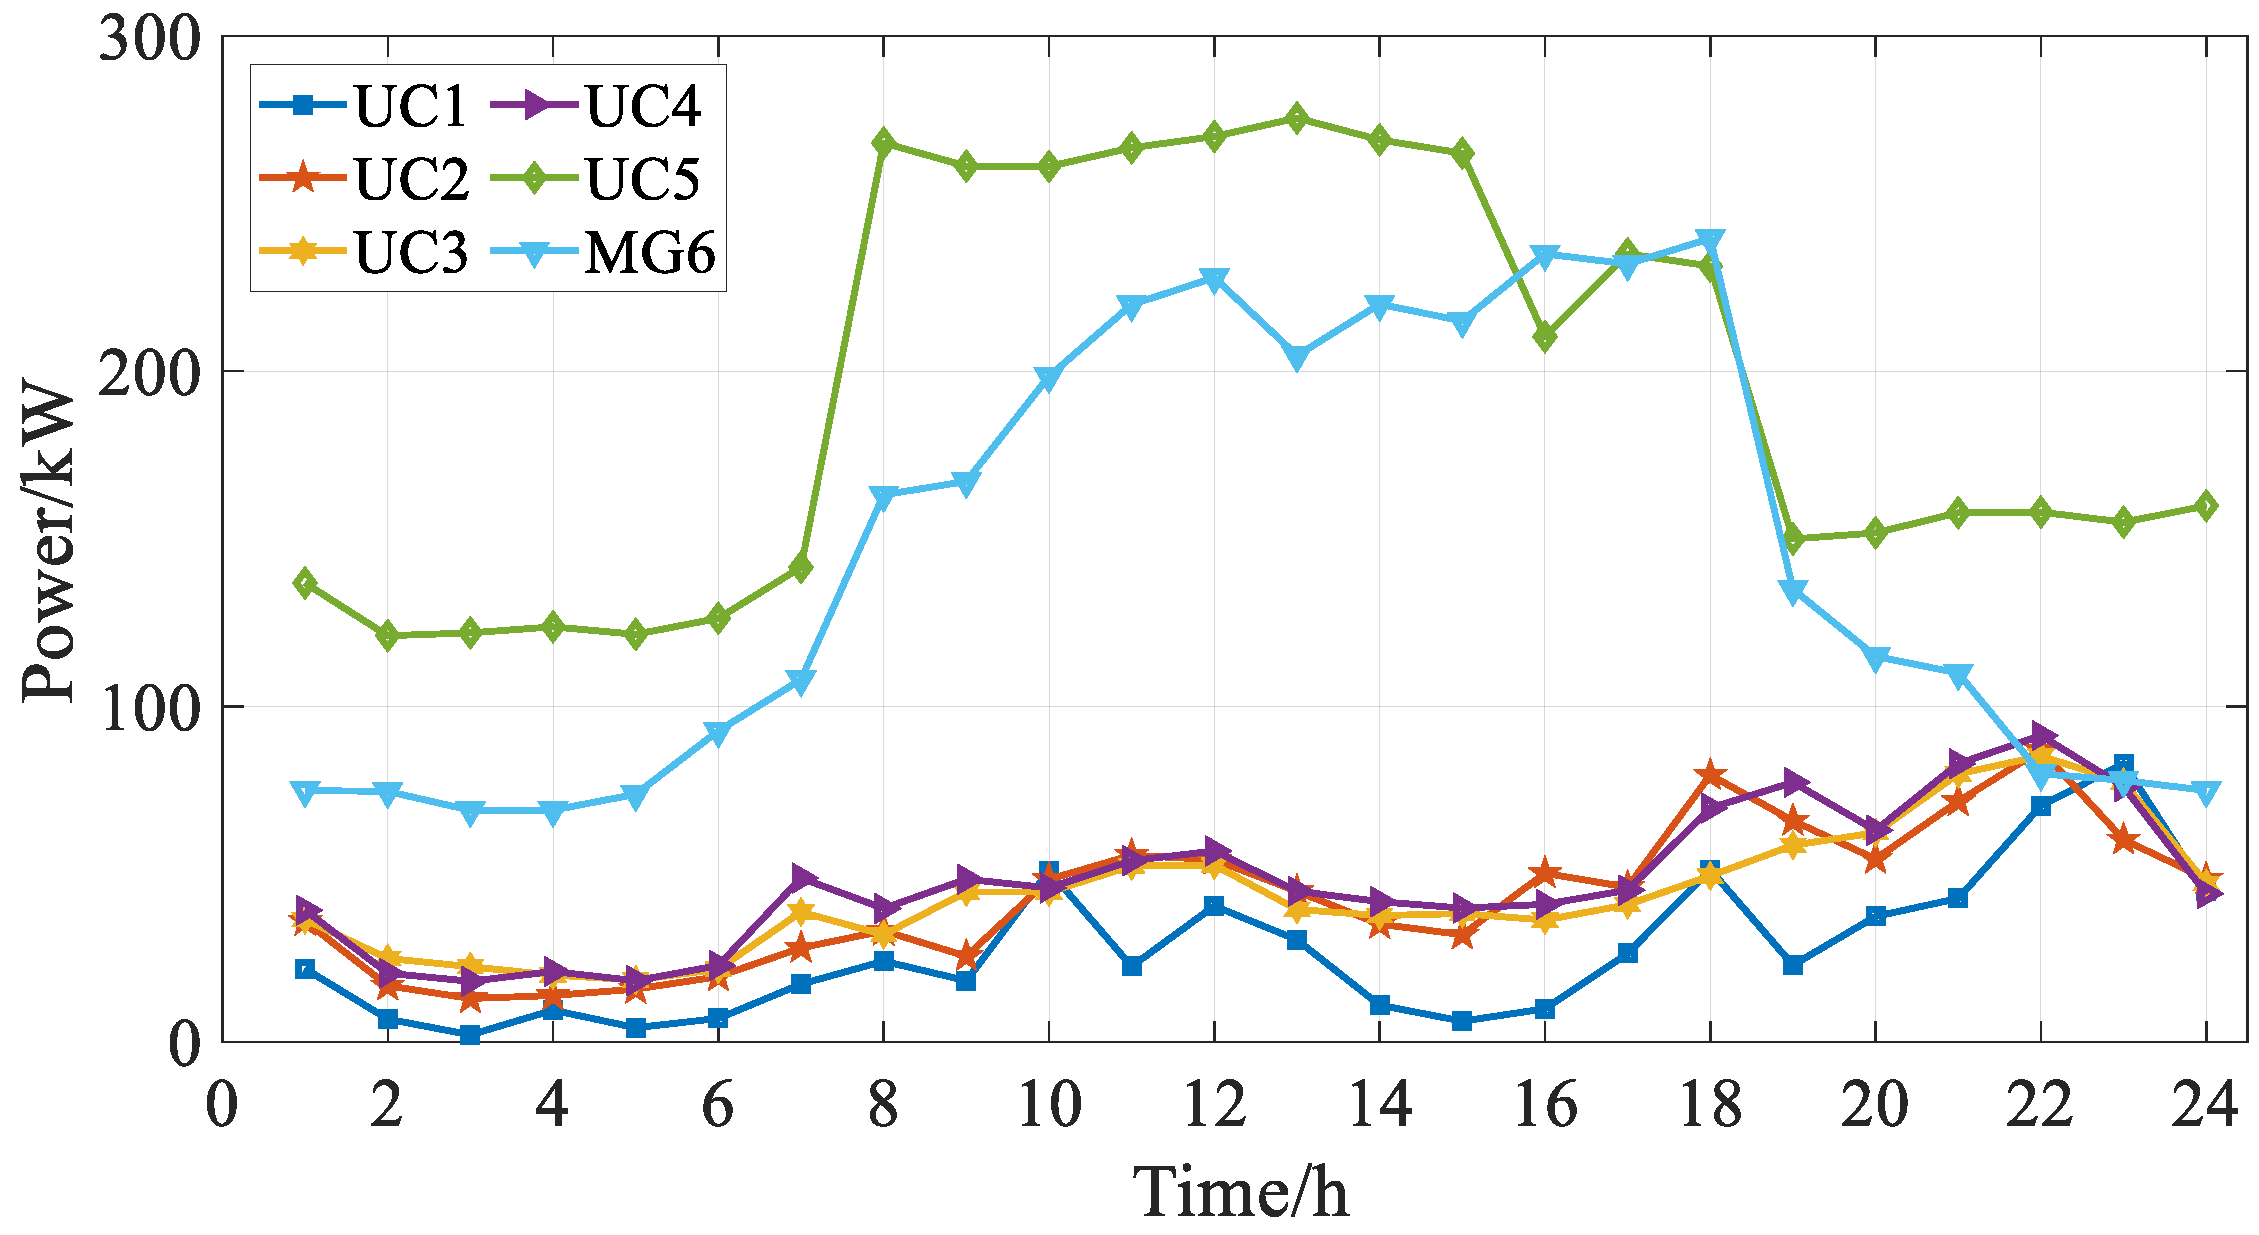
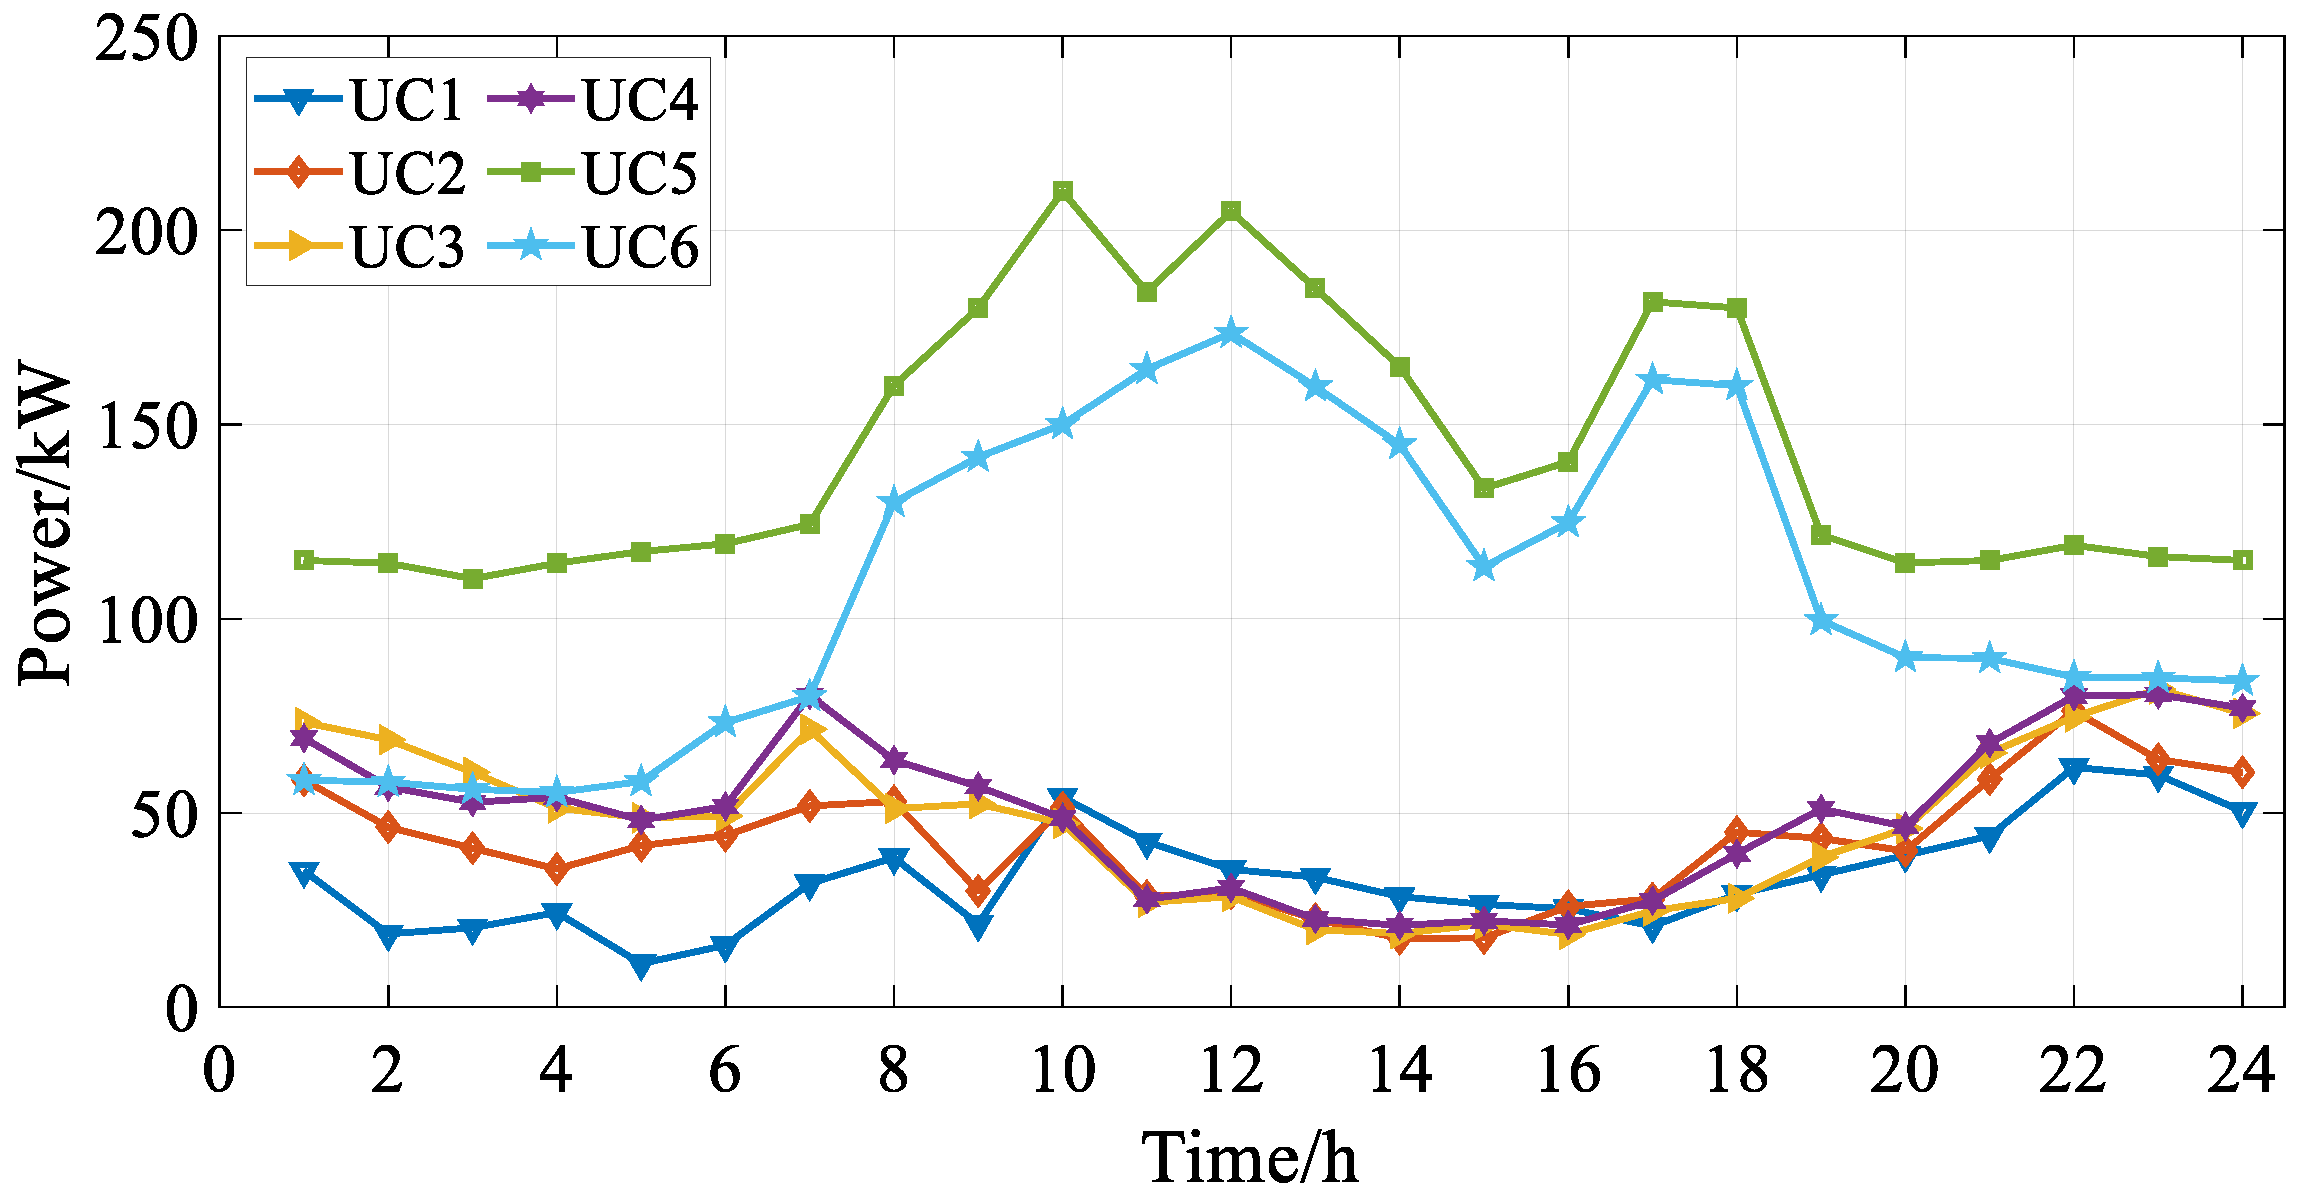
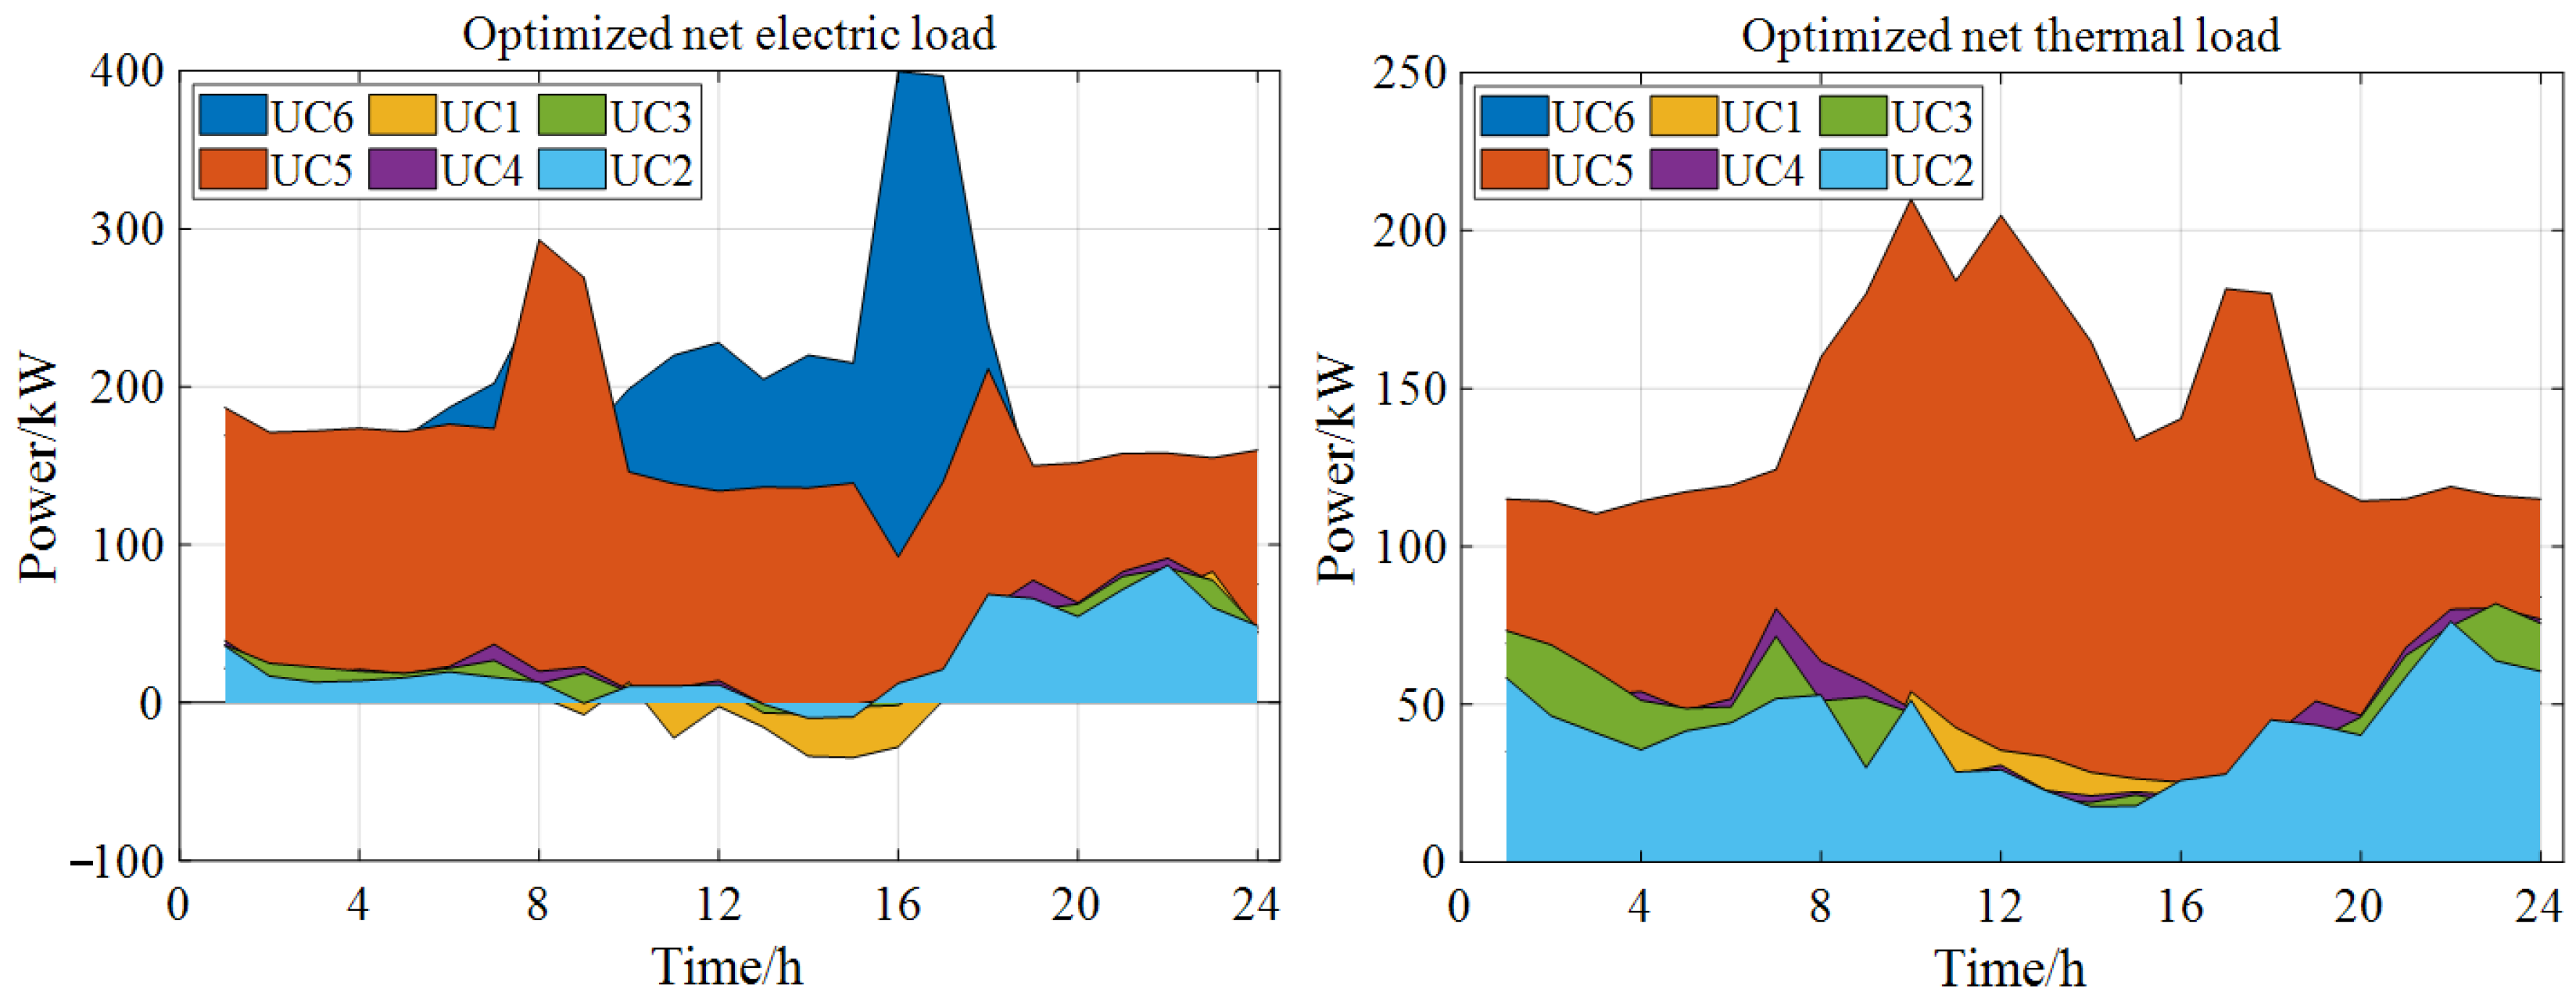
To demonstrate the scalability of the proposed method, a sophisticated test system comprising six user clusters (UCs) is employed for simulation. Specifically, UC1–4 represent residential building clusters, UC5 denotes an office building cluster, and UC6 corresponds to a commercial building cluster. Figure 15 illustrates the electric load profile of this complex test system, while Figure 16 depicts its thermal load profile. Table 6 outlines the equipment parameters for the ESP [1,4,39,45], and Table 7 provides the equipment parameters for each UC [1,4,39,45]. The pricing and operational parameters utilized in testing the complex system remain consistent with those specified in Section 5.1.
Figure 17 shows the iterative process of optimizing the benefits of the ESP and UCs. According to the calculation data in Figure 17, the algorithm converges after 65 iterations, which takes 13.26 s. And when the algorithm converges, the objective function values of the ESP and UC1–UC6 are 1494.31 CNY, 946.71 CNY, 1202.20 CNY, 1271.92 CNY, 1399.38 CNY, 1238.98 CNY, and 1567.32 CNY, respectively.
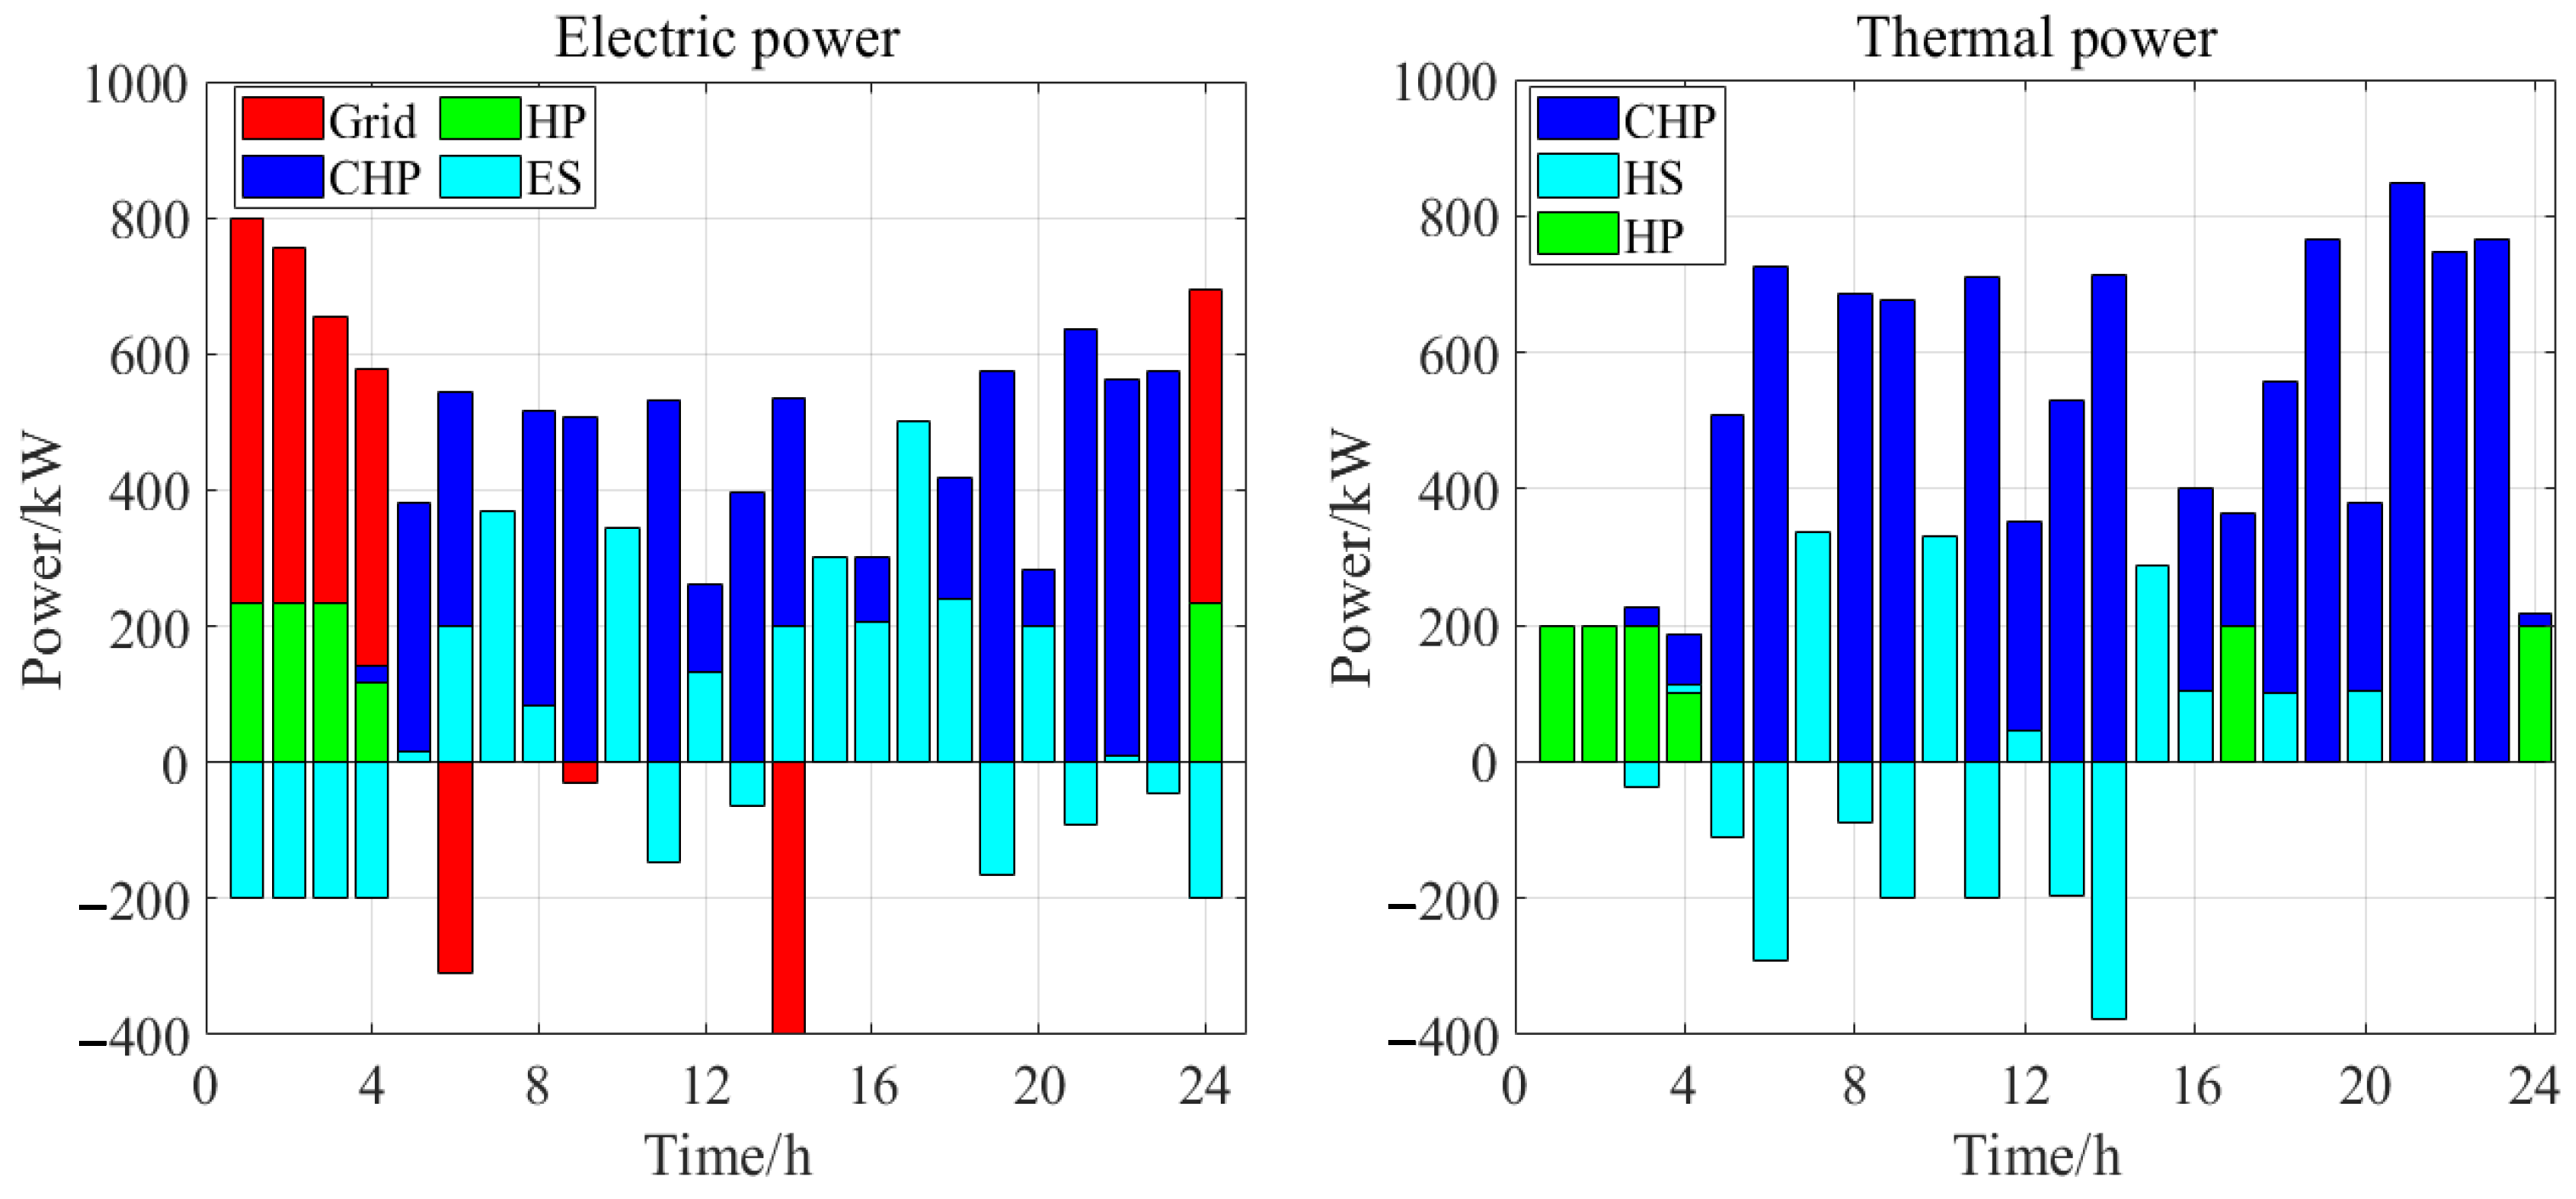
Figure 18 shows the ESP pricing strategy corresponding to the optimization result in the complex test system, Figure 19 shows the optimized electricity and thermal energy demand of UCs, and Figure 20 shows the energy unit operation strategy of the ESP in the complex test system.
Figure 19 demonstrates a distinct peak-valley pattern in the ESP’s electricity supply curve to UCs. UC power consumption decreases during high-price periods while showing significant increases during low-price periods. Simulation results indicate that between 9:00 and 15:00, influenced by both high electricity prices and sufficient photovoltaic generation, UCs supplied 207.15 kWh of electricity back to ESP.
To ensure energy supply–demand equilibrium, the ESP dynamically adjusts equipment operations to maintain optimal performance. Figure 20 shows the output strategies of electric and thermal units: while ESP satisfies most UC demands internally, it strategically purchases grid electricity during low-price periods to improve cost-efficiency.

5.3.3. Sensitivity Analysis of Key Parameters

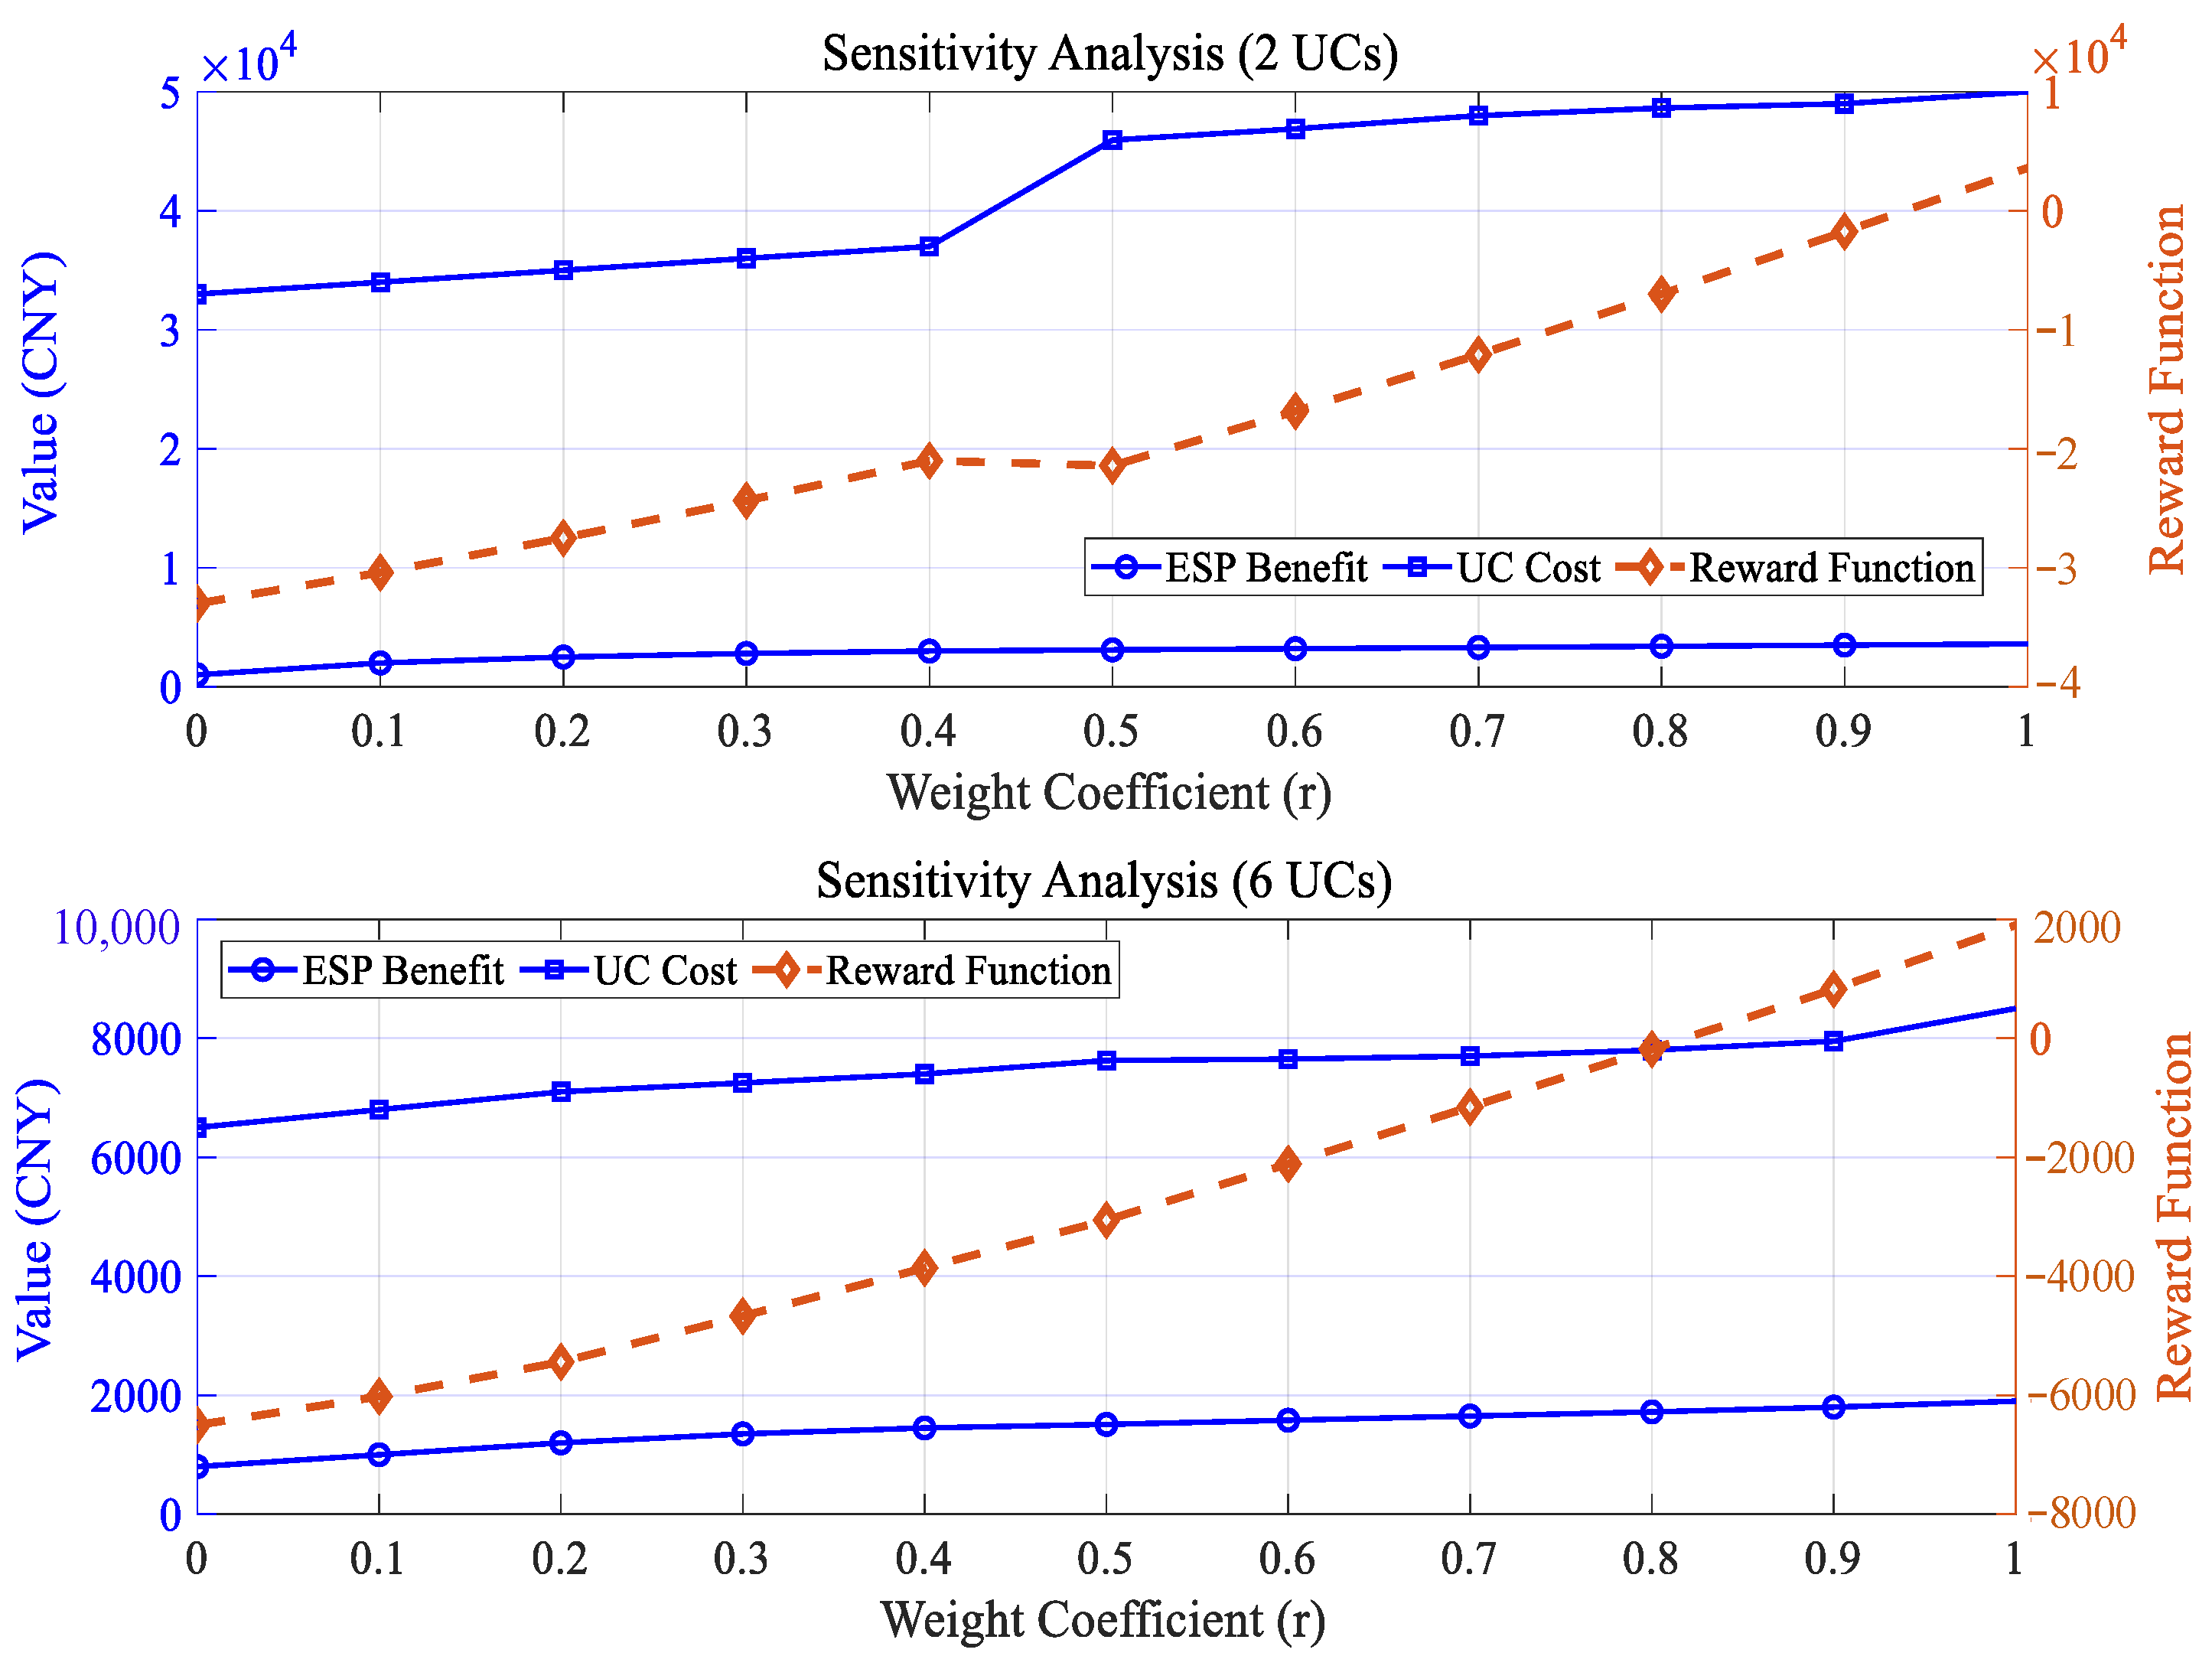
In the design of the energy trading system, the weight coefficient r is the core adjustment parameter to balance the interests of the ESP and users, and its value directly affects the operation efficiency and sustainability of the whole system. Through in-depth analysis, we can find that the setting of r value is essentially to find the optimal balance between efficiency and fairness, and many factors need to be considered comprehensively. Figure 21 shows the sensitivity analysis result of weight coefficients in different test systems.
From the basic mechanism, the design of the r value reflects the unique characteristics of the supply and demand game in the energy trading market. As shown in Figure 21, when the r value increases, the system will tilt to the ESP, giving priority to ensuring its profit margin; when the r value decreases, it will pay more attention to protecting the interests of users. This two-way adjustment mechanism provides a flexible means of interest distribution for the system. In actual operation, extreme values often bring negative effects: when r approaches 1, although the short-term income of ESP increases rapidly, an aggressive pricing strategy will lead to soaring user costs, which may lead to user loss in the long run; when r approaches 0, over-protection of users’ interests will inhibit the ESP’s investment enthusiasm and ultimately affect the quality of service.
The most ideal operating state appears in the median range of the r value, namely 0.4–0.7. This interval can produce a significant two-way incentive effect: the ESP can obtain a reasonable profit of about 150% of the benchmark value and, at the same time, control the increase of UC cost within an acceptable range of 20–30%. It is worth noting that the scale of the system plays an important role in adjusting the choice of the r value. The data show that in a large-scale system with six UCs, the reward function can be changed from negative to positive when the r value reaches 0.6, while a small-scale system with two UCs needs a higher r value (0.8+) to achieve the same effect.
From the perspective of development trends, the setting of the r value should be adapted to the market development stage. Using a low r value (0.3–0.5) in the cultivation period is helpful to attract users to participate; after entering the mature stage, appropriately increasing it to 0.6–0.7 can maintain the market vitality. In addition, policymakers can implement precise regulation by setting the floating range of the r value, and it is suggested to maintain a policy intervention space of 0.1, which can not only ensure market autonomy but also prevent systemic risks.
To sum up, the setting of the weight coefficient is essentially a process of finding the “efficiency–fairness” optimal solution. The ideal weight value should make the system present a dynamic equilibrium state of “ESP has the motivation to innovate continuously and users are willing to participate”. The simulation results show that maintaining the weight in the golden range of 0.4–0.7, combined with a moderate dynamic adjustment mechanism, can promote the efficient operation of energy-integrated energy systems.

6. Conclusions

In this paper, an energy management method of integrated energy systems considering users’ energy preferences is proposed. Considering users’ energy preference for electric heating load, an energy management model of integrated energy systems based on a reinforcement learning framework is established to optimize users’ point heating load and system operation strategy so as to improve the economy of system operation and reduce the carbon emission of the system.
(1) Considering the two-way energy–information interaction process between the ESP and user clusters, as well as the optimal pricing decision of the ESP and users’ energy preference, an energy management framework based on reinforcement learning is established.
(2) Based on reinforcement learning theory, the relationship model among ESP pricing decision (Action), user feedback (Environment), and energy management objective function (Reward) is established to optimize ESP energy price, user load, and system operation optimization strategy, and a distributed solution algorithm combining Q-learning and QP is proposed.
(3) Simulation analysis verifies the effectiveness of the established energy management model considering user preferences through a typical system. The simulation results demonstrate that the energy management model proposed enhances the economic efficiency of IES operations and reduces carbon emissions. In a test system with two UCs, the optimized system achieves a 5.05% reduction in carbon emissions. The RL-based distributed solution algorithm efficiently solves the energy management model for systems with varying UC scales, requiring only 6.55 s for systems with two UCs and 13.26 s for systems with six UCs. And the weight in the golden range of 0.4–0.7, combined with a moderate dynamic adjustment mechanism, can promote the efficient operation of energy-integrated energy systems.

Author Contributions

Conceptualization, Y.C.; Methodology, Y.C., S.Y. and J.X.; Software, P.Y.; Formal analysis, S.Y. and J.X.; Resources, Y.C. and S.S.; Writing – original draft, Y.C., S.Y., P.Y. and J.X.; Supervision, S.S. All authors have read and agreed to the published version of the manuscript.

Funding

This work is supported by the project “Research on User-side Distributed Optical Storage Evaluation and Its Cooperative Operation with Distribution Network” (SGSDDK00PDJS2310147).

Data Availability Statement

The original contributions presented in this study are included in the article. Further inquiries can be directed to the corresponding author.

Conflicts of Interest

All authors were employed by the State Grid Shandong Electric Power Company.

Appendix A

ViewpointsParticipating SubjectEnergy FormDR PricePricing DecisionOptimization Method
Demand responseRef. [5]User clusterElectricity;
thermal;
hydrogen
Electricity priceNoDistributionally robust optimization model
Ref. [6]User clusterElectricityElectricity priceNoMulti-objective optimization;
horse herd optimization algorithm
Ref. [7]User clusterElectricity;
thermal
Electricity price; thermal priceNoTwo-stage optimal operation;
nondominated sorting genetic algorithm (NSGA-II)
Ref. [8]User clusterElectricityElectricity priceNoSegmented linearization approach
Ref. [9]User clusterElectricity;
thermal
Electricity priceNoRobust optimization technique
Ref. [10]User clusterElectricity;
thermal
Electricity priceNoMixed-integer linear programming approach
Ref. [11]ESP;
user cluster
ElectricityElectricity priceElectricity pricingStackelberg game approach;
distributed algorithm
Ref. [12]ESP;
user cluster
ElectricityElectricity priceElectricity pricingTwo-stage energy sharing;
Stackelberg game approach
This paperESP;
user cluster
Electricity;
thermal
Electricity price; thermal priceElectricity and thermal pricingReinforcement learning
Energy management and operation optimizationRef. [13]User clusterElectricityElectricity priceNoHybrid deep learning
Ref. [15]User clusterElectricityElectricity priceElectricity pricingDR optimization of electric load;
mathematical programming
Ref. [16]User clusterElectricityElectricity priceNoBlockchain-based solution
Ref. [17]User clusterElectricityElectricity priceNoBi-level mixed integer nonlinear programming
Ref. [18]User clusterElectricityElectricity priceNoPSO algorithm
Ref. [19]User clusterElectricityElectricity priceNoMathematical programming
Ref. [20]ESP;
user cluster
ElectricityElectricity priceElectricity pricingDR optimization of electric load;
Stackelberg game approach
Ref. [21]User clusterElectricityElectricity priceNoMulti-stage RL algorithm
Ref. [22]User clusterElectricityElectricity priceNoDeep reinforcement learning
Ref. [23]User clusterElectricityElectricity priceNoDeep–fuzzy logic control
Ref. [24]User clusterElectricity;
thermal
Electricity priceNoElectric-thermal collaborative optimization;
multiscale multiphysics model
This paperESP;
user cluster
Electricity;
thermal
Electricity price; thermal priceElectricity and thermal pricingElectric–thermal collaborative optimization;
DR optimization of electric–thermal load;
reinforcement learning
Solution methodRef. [31]
Ref. [32]
User clusterElectricityElectricity priceNoMarkov decision making;
deep reinforcement learning
Ref. [33]User clusterElectricityElectricity priceNoMarkov decision making;
multi-Agent reinforcement learning
Ref. [34]User clusterElectricityElectricity priceNoMarkov decision making;
adaptive personalized federated reinforcement learning
This paperESP;
user cluster
Electricity;
thermal
Electricity price; thermal priceElectricity and thermal pricingMarkov decision making;
reinforcement learning

References

  1. Hung, Y.; Liu, N.; Chen, Z.; Xu, J. Collaborative optimization for interconnected energy hubs based on cluster partition of electric-thermal energy network. Energy 2025, 321, 135403. [Google Scholar] [CrossRef]
  2. Wang, Y.; Zhao, X.; Huang, Y. Low-Carbon-Oriented Capacity Optimization Method for Electric–Thermal Integrated Energy System Considering Construction Time Sequence and Uncertainty. Processes 2024, 12, 648. [Google Scholar] [CrossRef]
  3. Hu, J.; Wang, Y.; Dong, L. Low carbon-oriented planning of shared energy storage station for multiple integrated energy systems considering energy-carbon flow and carbon emission reduction. Energy 2024, 290, 130139. [Google Scholar] [CrossRef]
  4. Wang, Y.; Hu, J. Two-stage energy management method of integrated energy system considering pre-transaction behavior of energy service provider and users. Energy 2023, 271, 127065. [Google Scholar] [CrossRef]
  5. Zhang, Z.; Niu, D.; Yun, J.; Siqin, Z. Distributionally Robust Optimization Model of the Integrated Energy System with Integrated Demand Response. J. Energy Eng. 2025, 151, 04025022. [Google Scholar] [CrossRef]
  6. Du, X.; Yang, Y.; Guo, H. Optimizing integrated hydrogen technologies and demand response for sustainable multi-energy microgrids. Electr. Eng. 2025, 107, 2621–2643. [Google Scholar] [CrossRef]
  7. Wang, X.; Jiao, Y.; Cui, B.; Zhu, H.; Wang, R. Two-Stage Optimal Operation of Integrated Energy System Considering Electricity–Heat Demand Response and Time-of-Use Energy Price. Int. J. Energy Res. 2025, 2025, 6106019. [Google Scholar] [CrossRef]
  8. Ma, C.; Hu, Z. Low-Carbon Economic Scheduling of Integrated Energy System Considering Flexible Supply–Demand Response and Diversified Utilization of Hydrogen. Sustainability 2025, 17, 1749. [Google Scholar] [CrossRef]
  9. Mobarakeh, S.I.; Sadeghi, R.; Saghafi, H.; Delshad, M. Hierarchical integrated energy system management considering energy market, demand response and uncertainties: A robust optimization approach. Comput. Electr. Eng. 2025, 123, 110138. [Google Scholar] [CrossRef]
  10. Moosavi, M.; Olamaei, J.; Shourkaei, H.M. Optimizing microgrid performance a multi-objective strategy for integrated energy management with hybrid sources and demand response. Sci. Rep. 2025, 15, 17827. [Google Scholar] [CrossRef]
  11. Lin, W.-T.; Chen, G.; Li, J.; Lei, Y.; Zhang, W.; Yang, D.; Ming, T. Privacy-preserving incentive mechanism for integrated demand response: A homomorphic encryption-based approach. Int. J. Electr. Power Energy Syst. 2025, 164, 110407. [Google Scholar] [CrossRef]
  12. Bian, Y.; Xie, L.; Ma, L.; Cui, C. A novel two-stage energy sharing model for data center cluster considering integrated demand response of multiple loads. Appl. Energy 2025, 384, 125454. [Google Scholar] [CrossRef]
  13. Ibude, F.; Otebolaku, A.; Ameh, J.E.; Ikpehai, A. Multi-Timescale Energy Consumption Management in Smart Buildings Using Hybrid Deep Artificial Neural Networks. J. Low Power Electron. Appl. 2024, 14, 54. [Google Scholar] [CrossRef]
  14. Ahmad, W.; Lucas, A.; Carvalhosa, S.M.P. Battery Control for Node Capacity Increase for Electric Vehicle Charging Support. Energies 2024, 17, 5554. [Google Scholar] [CrossRef]
  15. Asaleye, D.A.; Murphy, D.J.; Shine, P.; Murphy, M.D. The Practical Impact of Price-Based Demand-Side Management for Occupants of an Office Building Connected to a Renewable Energy Microgrid. Sustainability 2024, 16, 8120. [Google Scholar] [CrossRef]
  16. Kolahan, A.; Maadi, S.R.; Teymouri, Z.; Schenone, C. Blockchain-based solution for energy demand-side management of residential buildings. Sustain. Cities Soc. 2021, 75, 103316. [Google Scholar] [CrossRef]
  17. Al-Quraan, A.; Al-Mhairat, B. Sizing and energy management of standalone hybrid renewable energy systems based on economic predictive control. Energy Convers. Manag. 2024, 300, 117948. [Google Scholar] [CrossRef]
  18. Sun, Y.; Luo, Z.; Li, Y.; Zhao, T. Grey-box model-based demand side management for rooftop PV and air conditioning systems in public buildings using PSO algorithm. Energy 2024, 296, 131052. [Google Scholar] [CrossRef]
  19. Zhang, K.; Saloux, E.; Candanedo, J.A. Enhancing energy flexibility of building clusters via supervisory room temperature control: Quantification and evaluation of benefits. Energy Build. 2024, 302, 113750. [Google Scholar] [CrossRef]
  20. Ying, C.; Zou, Y.; Xu, Y. Decentralized energy management of a hybrid building cluster via peer-to-peer transactive energy trading. Appl. Energy 2024, 372, 123803. [Google Scholar] [CrossRef]
  21. Wang, Z.; Xiao, F.; Ran, Y.; Li, Y.; Xu, Y. Scalable energy management approach of residential hybrid energy system using multi-agent deep reinforcement learning. Appl. Energy 2024, 367, 123414. [Google Scholar] [CrossRef]
  22. Mocanu, E.; Mocanu, D.C.; Nguyen, P.H.; Liotta, A.; Webber, M.E.; Gibescu, M.; Slootweg, J.G. On-Line Building Energy Optimization Using Deep Reinforcement Learning. IEEE Trans. Smart Grid 2019, 10, 3698–3708. [Google Scholar] [CrossRef]
  23. Cavus, M.; Dissanayake, D.; Bell, M. Deep-Fuzzy Logic Control for Optimal Energy Management: A Predictive and Adaptive Framework for Grid-Connected Microgrids. Energies 2025, 18, 995. [Google Scholar] [CrossRef]
  24. Zhou, Y.P.; Wang, L.X.; Wang, B.Y.; Chen, Y.; Ran, C.X.; Wu, Z.B. Polarization management of photonic crystals to achieve synergistic optimization of optical, thermal, and electrical performance of building-integrated photovoltaic glazing. Appl. Energy 2024, 372, 123827. [Google Scholar] [CrossRef]
  25. Liang, H.; Lin, C.; Pang, A. Expert knowledge data-driven based actor–critic reinforcement learning framework to solve computationally expensive unit commitment problems with uncertain wind energy. Int. J. Electr. Power Energy Syst. 2024, 159, 110033. [Google Scholar] [CrossRef]
  26. Alharbi, M.; Alghamdi, A.S. Hybrid CNN-GRU Forecasting and Improved Teaching–Learning-Based Optimization for Cost-Efficient Microgrid Energy Management. Processes 2025, 13, 1452. [Google Scholar] [CrossRef]
  27. Ding, L.; Cui, Y.; Yan, G.; Huang, Y.; Fan, Z. Distributed energy management of multi-area integrated energy system based on multi-agent deep reinforcement learning. Int. J. Electr. Power Energy Syst. 2024, 157, 109867. [Google Scholar] [CrossRef]
  28. Shuai, Q.; Yin, Y.; Huang, S.; Chen, C. Deep Reinforcement Learning-Based Real-Time Energy Management for an Integrated Electric–Thermal Energy System. Sustainability 2025, 17, 407. [Google Scholar] [CrossRef]
  29. Li, Y.; Ma, W.; Li, Y.; Li, S.; Chen, Z.; Shahidehpour, M. Enhancing cyber-resilience in integrated energy system scheduling with demand response using deep reinforcement learning. Appl. Energy 2025, 379, 124831. [Google Scholar] [CrossRef]
  30. Gong, J.; Yu, N.; Han, F.; Tang, B.; Wu, H.; Ge, Y. Bias Correction of Data-Driven Deep Reinforcement Learning in Economic Scheduling of Integrated Energy Systems. In Proceedings of the International Conference on Life System Modeling and Simulation, International Conference on Intelligent Computing for Sustainable Energy and Environment, Suzhou, China, 13–15 September 2024; Springer: Singapore, 2025. [Google Scholar] [CrossRef]
  31. Lian, J.; Li, D.; Li, L. Real-Time Energy Management Strategy for Fuel Cell/Battery Plug-In Hybrid Electric Buses Based on Deep Reinforcement Learning and State of Charge Descent Curve Trajectory Control. Energy Technol. 2025, 13, 2401696. [Google Scholar] [CrossRef]
  32. Li, Y.; Chang, W.; Yang, Q. Deep reinforcement learning based hierarchical energy management for virtual power plant with aggregated multiple heterogeneous microgrids. Appl. Energy 2025, 382, 125333. [Google Scholar] [CrossRef]
  33. Liao, Z.; Li, C.; Zhang, X.; Hu, Q.; Wang, B. A Bidding Strategy for Power Suppliers Based on Multi-Agent Reinforcement Learning in Carbon–Electricity–Coal Coupling Market. Energies 2025, 18, 2388. [Google Scholar] [CrossRef]
  34. Wang, T.; Dong, Z.Y. Adaptive personalized federated reinforcement learning for multiple-ESS optimal market dispatch strategy with electric vehicles and photovoltaic power generations. Appl. Energy 2024, 365, 123107. [Google Scholar] [CrossRef]
  35. Wang, L.; Tao, Z.; Zhu, L.; Wang, X.; Yin, C.; Cong, H.; Bi, R.; Qi, X. Optimal dispatch of integrated energy system considering integrated demand response resource trading. IET Gener. Transm. Distrib. 2022, 16, 1727–1742. [Google Scholar] [CrossRef]
  36. Lu, J.; Liu, T.; He, C.; Nan, L.; Hu, X. Robust day-ahead coordinated scheduling of multi-energy systems with integrated heat-electricity demand response and high penetration of renewable energy. Renew. Energy 2021, 178, 466–482. [Google Scholar] [CrossRef]
  37. Lu, R.; Hong, S.H.; Zhang, X. A Dynamic pricing demand response algorithm for smart grid: Reinforcement learning approach. Appl. Energy 2018, 220, 220–230. [Google Scholar] [CrossRef]
  38. Ma, L.; Liu, J.; Wang, Q. Energy Management and Pricing Strategy of Building Cluster Energy System Based on Two-Stage Optimization. Front. Energy Res. 2022, 10, 865190. [Google Scholar] [CrossRef]
  39. Huang, Y.; Wang, Y.; Liu, N. Low-carbon economic dispatch and energy sharing method of multiple Integrated Energy Systems from the perspective of System of Systems. Energy 2022, 244, 122717. [Google Scholar] [CrossRef]
  40. Lin, Z.; Wang, S.; Wang, S.; Zhao, Q. Distributed coordinated dispatching of district electric-thermal integrated energy system considering ladder-type carbon trading mechanism. Power Syst. Syst. Syst. Technol. 2023, 47, 217–229. [Google Scholar] [CrossRef]
  41. Gao, X.; Tao, H.; Miao, G.; Ping, Z. Joint optimization control of energy storage system management and demand response. J. Syst. Simul. 2016, 28, 1165–1172. [Google Scholar] [CrossRef]
  42. Ma, L.; Cheng, Y. Optimal operation for park integrated energy system considering interruptible loads. J. Syst. Simul. 2022, 34, 817–825. [Google Scholar] [CrossRef]
  43. Huang, H.; Chen, X.; Cha, J. Partition autonomous energy cooperation community and its joint optimal scheduling for multi-park integrated energy system. Power Syst. Technol. 2022, 46, 2955–2965. [Google Scholar] [CrossRef]
  44. Zeng, X.; Liu, T.; Li, Q.; He, C.; Xiao, H.; Qin, H. An Mixed Integer Quadratic Programming Model and Algorithm Study for Power Balance Problem of High Hydropower Proportion’s System. Proc. CSEE 2017, 37, 1114–1125. [Google Scholar] [CrossRef]
  45. Luo, J.; Li, Y.; Wang, H.; Li, G.; Song, Y.; Long, W. Optimal Scheduling of Integrated Energy System Considering Integrated Demand Response. In Proceedings of the 2023 8th Asia Conference on Power and Electrical Engineering (ACPEE), Tianjin, China, 14–16 April 2023; Conference Series 2022. pp. 110–116. [Google Scholar] [CrossRef]
  46. Huang, Y.; Wang, Y.; Liu, N. A two-stage energy management for heat-electricity integrated energy system considering dynamic pricing of Stackelberg game and operation strategy optimization. Energy 2022, 244, 122576. [Google Scholar] [CrossRef]
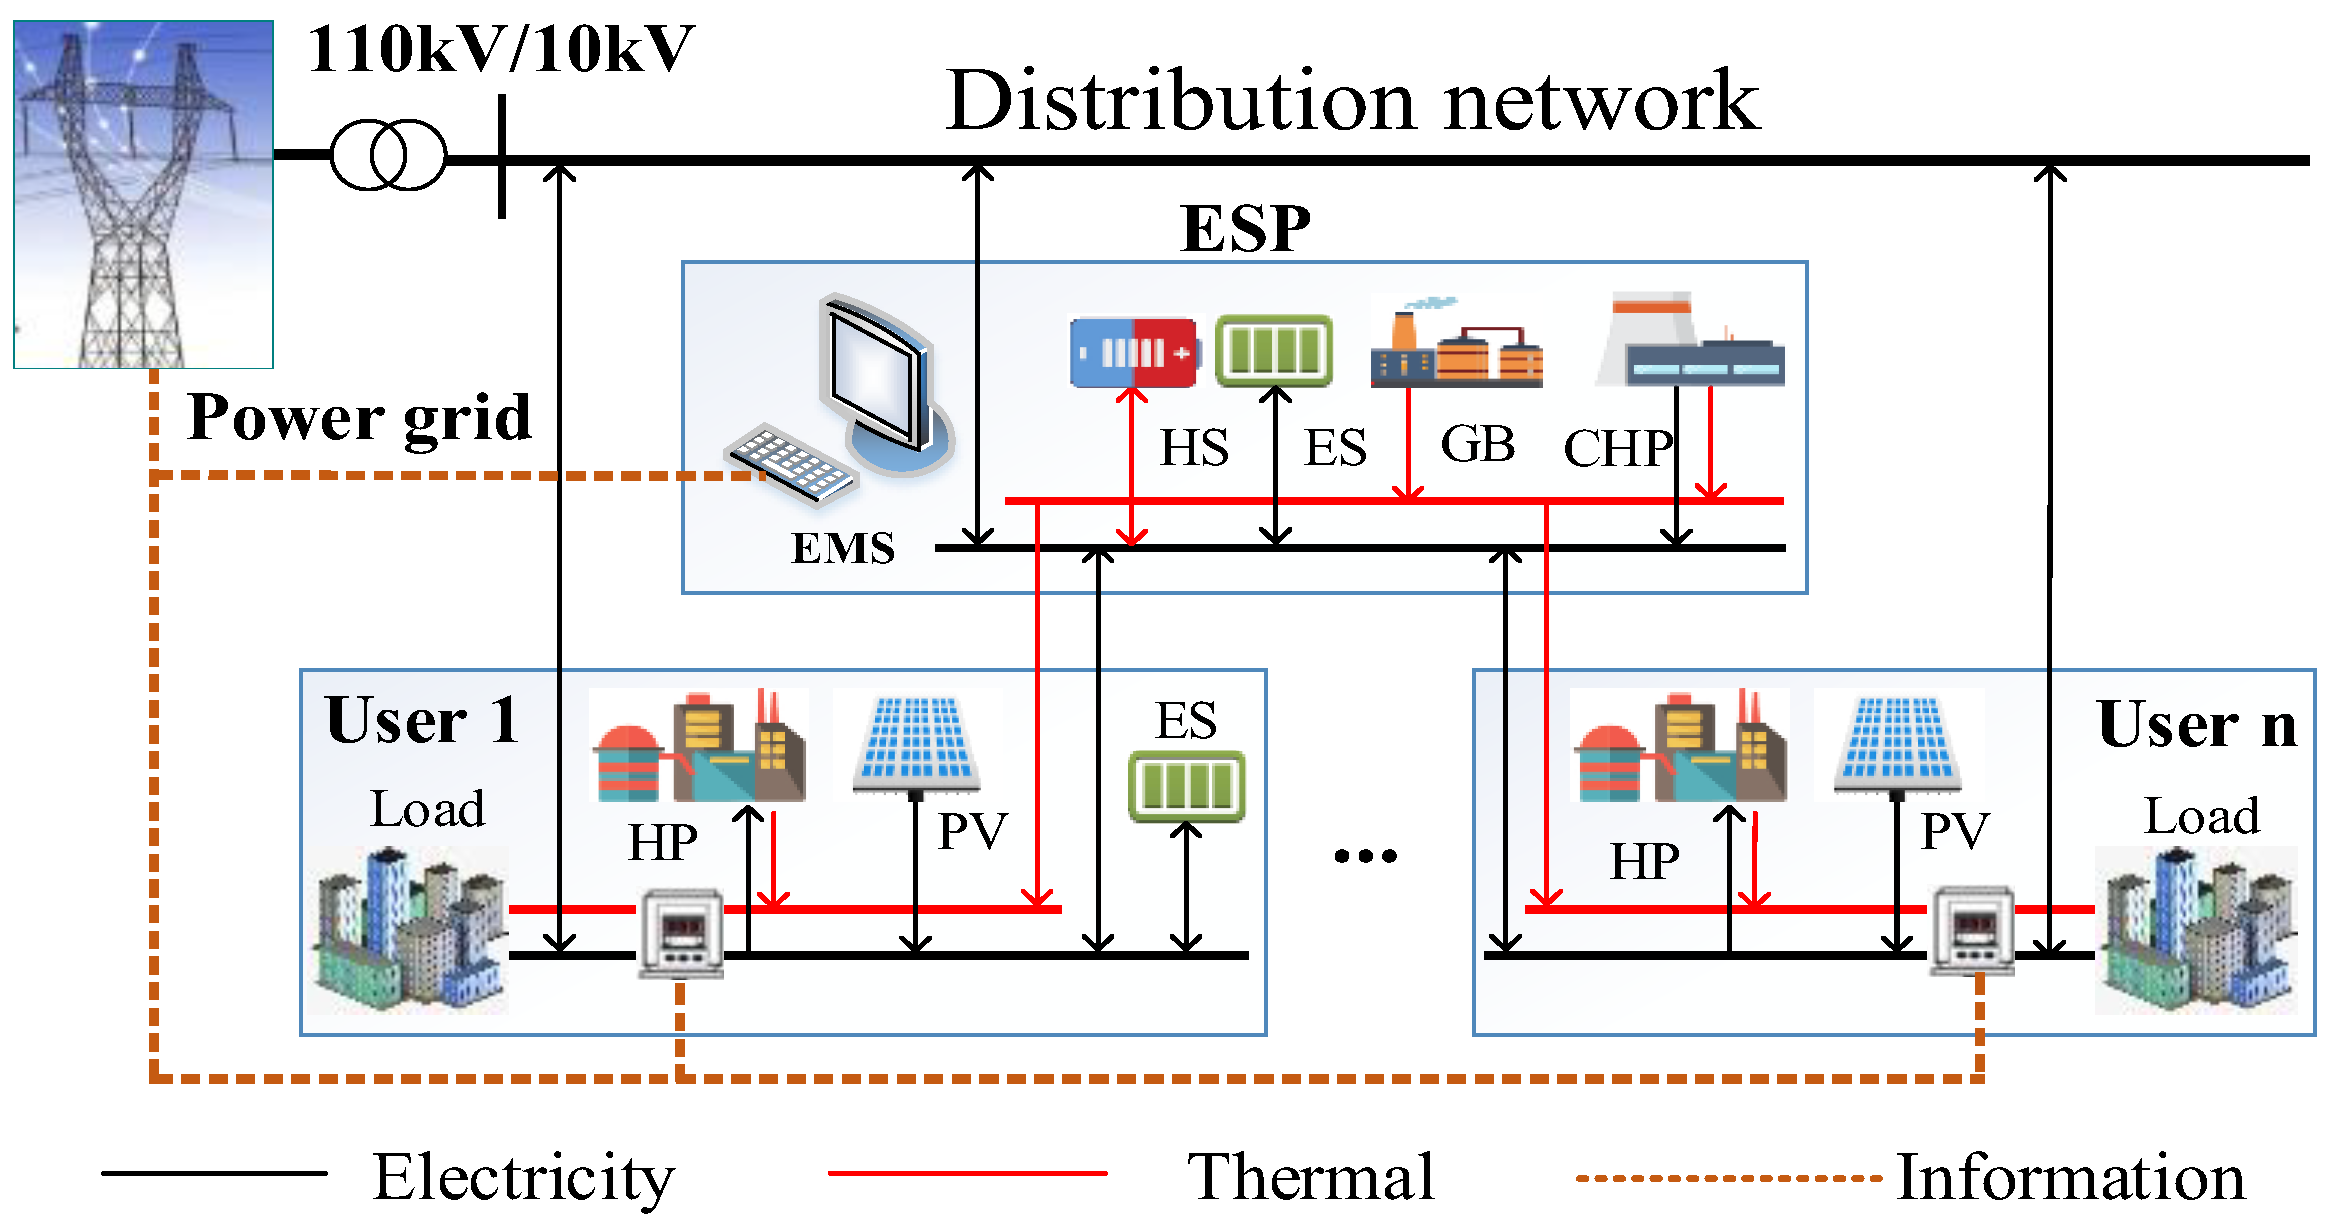
Figure 1. Typical structure of the IES with the ESP and users.
Processes 13 02693 g001
Figure 2. Energy management framework based on RL.
Processes 13 02693 g002
Figure 3. Flow chart of Q-learning–QP algorithm.
Processes 13 02693 g003
Figure 4. Electricity, thermal load, and PV power in users.
Processes 13 02693 g004
Figure 5. Electricity pricing strategy for the ESP.
Processes 13 02693 g005
Figure 6. Thermal pricing strategy for the ESP.
Processes 13 02693 g006
Figure 7. Energy interaction between the ESP and users.
Processes 13 02693 g007
Figure 8. Optimal unit operation strategy of the ESP.
Processes 13 02693 g008
Figure 9. Load optimization results of user 1.
Processes 13 02693 g009
Figure 10. Optimal operation strategy of user 1.
Processes 13 02693 g010
Figure 11. Load optimization results of user 2.
Processes 13 02693 g011
Figure 12. Optimal operation strategy of user 2.
Processes 13 02693 g012
Figure 13. Convergence curve of all parties.
Processes 13 02693 g013
Figure 14. Analysis of carbon emission results.
Processes 13 02693 g014
Figure 15. Electric load in the test system.
Processes 13 02693 g015
Figure 16. Thermal load in the test system.
Processes 13 02693 g016
Figure 17. Convergence curve of all parties in the test system.
Processes 13 02693 g017
Figure 18. Energy pricing strategy for the ESP in the test system.
Processes 13 02693 g018
Figure 19. Electricity and thermal energy demand of UCs in the test system.
Processes 13 02693 g019
Figure 20. Optimal unit operation strategy of the ESP in the test system.
Processes 13 02693 g020
Figure 21. Sensitivity analysis result of weight coefficients in different test systems.
Processes 13 02693 g021
Table 1. Equipment parameters in the IES.
EquipmentParametersESPUser Cluster 1User Cluster 2
CHPCapacity1500 kW--
Operating cost coefficient0.05 CNY/kWh--
Thermal–electric ratio1.35--
HPCapacity-1500 kW1000 kW
Operating cost coefficient-0.026 CNY/kWh0.026 CNY/kWh
Heating efficiency-0.900.86
GBCapacity1500 kW--
Operating cost coefficient0.15 CNY/kWh--
Heating efficiency0.85--
PVCapacity-1000 kW2500 kW
Operating cost coefficient-0.025 CNY/kWh0.025 CNY/kWh
ESCapacity1000 kW-2000 kW
Operating cost coefficient0.02 CNY/kWh-0.02 CNY/kWh
HSCapacity1000 kW--
Operating cost coefficient0.02 CNY/kWh--
Table 2. Wholesale price and elasticity of the electricity.
Price TypeOff-PeakMid-PeakOn-Peak
Time1:00–8:009:00–11:00; 16:00–17:00; 23:00–24:0012:00–15:00 20:00–22:00
Selling Price0.45 CNY/kWh0.86 CNY/kWh1.35 CNY/kWh
Buying Price0.40 CNY/kWh
Table 3. Cost–benefit analysis of users.
User Cost/CNYGeneral Integrated Demand Response OptimizationOptimization of Integrated Demand Response Considering User Preference
User Cluster 1User Cluster 2User Cluster 1User Cluster 2
Electricity transaction cost with ESP13,322.065968.6413,489.564892.61
Thermal transaction cost with ESP10,244.048644.998536.978536.97
Electricity transaction cost with power grid0.002044.990.003793.04
Satisfaction loss2780.523892.952462.213224.27
Operation and maintenance cost269.77707.12269.77735.72
Total operating cost26,616.3921,258.7024,758.5021,182.61
Table 4. Cost–benefit analysis of the ESP.
ESP Benefit Composition/CNYGeneral Integrated Demand Response OptimizationOptimization of Integrated Demand Response Considering User Preference
Revenue from electricity interaction with power grid3601.023245.98
Revenue from electricity interaction with users19,290.7018,382.17
Revenue from thermal energy interaction with users18,889.0317,073.93
Natural gas cost29,778.7528,274.97
Operation and maintenance cost3464.131876.47
Environmental cost5736.605446.91
Total operating benefit2801.273103.72
Table 5. Carbon emission source of the test system.
Carbon EmissionGeneral Integrated Demand Response OptimizationOptimization of Integrated Demand Response Considering User Preference
Carbon emission of CHP15,080.4814,426.84
Carbon emission of GB7865.917360.80
Total carbon emission22,946.3921,787.64
Table 6. Equipment parameters of the ESP.
EquipmentParametersValue
CHPCapacity700 kW
Operating cost coefficient0.05 CNY/kWh
Thermal–electric ratio1.35
HPCapacity200 kW
Operating cost coefficient0.026 CNY/kWh
Heating efficiency0.90
ESCapacity500 kW
Operating cost coefficient0.02 CNY/kWh
HSCapacity500 kW
Operating cost coefficient0.02 CNY/kWh
Table 7. Equipment parameters of UCs.
EquipmentParametersUC 1–UC 4UC 5UC 6
HPCapacity--150 kW
Operating cost coefficient--0.026 CNY/kWh
Heating efficiency--0.86
PVCapacity50 kW100 kW100 kW
Operating cost coefficient0.025 CNY/kWh0.025 CNY/kWh0.025 CNY/kWh
ESCapacity-100 kW-
Operating cost coefficient-0.02 CNY/kWh-
Disclaimer/Publisher’s Note: The statements, opinions and data contained in all publications are solely those of the individual author(s) and contributor(s) and not of MDPI and/or the editor(s). MDPI and/or the editor(s) disclaim responsibility for any injury to people or property resulting from any ideas, methods, instructions or products referred to in the content.