1. Introduction
In 2006, China was both the world’s top carbon emitter and the No. 1 developing country in the late stages of industrialization and urbanization. China needs to ensure energy demand and economic growth while achieving its goal of reducing carbon emissions. The “30–60” carbon goal is to achieve a “carbon peak” by 2030 and “carbon neutrality” by 2060. “Carbon peak” refers to a period of time when greenhouse gas emissions reach a historical high, after which they enter a plateau period and may fluctuate in a certain range, and then enter a stage of continuous slow emissions or rapid decline, which is the inflection point when greenhouse gas emissions turn from increasing to decreasing. “Carbon neutrality” refers to a certain period of time when enterprises, groups, or individuals directly or indirectly generate carbon dioxide emissions through reforestation, energy conservation, and emission reduction to offset their own carbon dioxide emissions and achieve “zero emission” of carbon dioxide [
1,
2].
As the main processes of carbon emission, direct fossil fuel combustion in transportation and fuel combustion in power generation are the main sources of carbon emission. With economic development and technological progress, the number of automobiles in China has grown rapidly. From 1999 to 2018, China’s civilian vehicle ownership increased from 14,529,400 to 23.1 million. In these two decades, private car ownership increased dramatically from 5,338,800 in 1999 to 207 million in 2018, and the share increased from 36.7% in 1999 to 89.6% in 2018, which was the largest in China’s motor vehicle market [
3]. Exploration of the use of new energy vehicles or energy with low carbon emissions to replace fuel and reduce carbon emissions has become a new research direction for scholars in the fields of transportation, environmental pollution, and energy development. In addition, the issue of carbon pollution from power generation is addressed through a clean energy hydrogen combustion program. In the existing methods, electric-driven vehicles are mainly used. Hydrogen vehicles use hydrogen as a power source. The chemical energy of hydrogen is directly converted into electrical energy through fuel cells to drive the operation of vehicles and other means of transportation. Compared with traditional fuel vehicles, hydrogen-fueled vehicles have the advantages of zero emissions, long range and short hydrogen refueling time. Moreover, hydrogen has a wide range of sources and can be obtained through electrolysis of water and other methods, making it highly renewable.
Since the 1990s, in order to make carbon emission accounting methods more systematic and rational, many national governments and relevant international organizations have cooperated to do in-depth research and develop some carbon emission accounting standards with high feasibility, which cover all levels from countries to individuals, from enterprises to products and services. After continuous practical verification and improvement over the years, a number of carbon emission accounting standards have been widely recognized by researchers, which can be divided into the following two categories: end-consumption-based carbon emissions (GHG Product, ISO 14064) [
4] and life-cycle carbon emissions (GHG Protocol of Product and Supply Chain, ISO 14067) [
5]. According to the combustion reaction equations of different fuels, the carbon emissions after complete combustion can be obtained. In existing studies, the additional carbon emissions from the production and transportation of fuels at several stages have also been analysed. For fossil energy emissions and electrical energy emissions, the life cycle assessment method (LCA) is mainly used. The term “life cycle assessment” refers to the entire process of a product from its origin in nature to the extraction of initial resources and energy in which the final product is formed through the manufacturing process of mining, smelting, processing, and reprocessing, and it finally goes back to the environmental system in various forms through consumption and use in the field of distribution [
6,
7].
For the research on the life-cycle carbon emission evaluation of electric vehicles, relevant methods have been proposed and are becoming more and more mature in foreign countries. The LCA models that have been widely accepted overseas include GREET [
8], the e-balance model, GaBl software-based models [
9,
10], the EIO LCA model of the University of Toronto [
11], etc. They are also commonly used in automotive-related research. Although the research on the life-cycle carbon emissions of electric vehicles in China started late, it has developed rapidly. Zhou Boya et al. [
12] summarized the carbon reduction potential of pure electric buses in the Chinese transport system through a life cycle assessment of the upstream fuel production and operation stages. The results show that electric buses can reduce fuel consumption by 85–87%, fossil fuel consumption by 32–46%, and CO
2 emissions by 19–35% from a life-cycle perspective under various conditions compared to diesel buses. Yu et al. [
13] quantified and compared the GHG emissions of vehicles with different powertrains from a life-cycle perspective. The results show that the total energy consumption and GHG emissions of all electric vehicles in the whole life cycle are lower than those of gasoline vehicles with an internal combustion engine, and that GHG emissions in the whole life cycle of the vehicle are most sensitive to the proportion of thermal power. In the long term, battery-powered electric vehicles (BEVs) have more favourable carbon emission reduction performance than other electric vehicles (EVs). The results of a study by Yan et al. [
14] showed that the environmental costs in the whole life cycle of pure electric vehicles, hybrid vehicles, and conventional fuel vehicles were from high to low. It is worth noting that the environmental costs of pure electric vehicles can be 63.96% lower than those of conventional fuel vehicles. Over the course of their lives, hybrid vehicles use 60.08% less energy than conventional fuel vehicles, while electric vehicles use 7.72% less energy than hybrid vehicles. Shi et al. [
15,
16,
17] showed that pure electric vehicles could reduce carbon emissions by 57% to 81.2% compared to conventional fuel vehicles under different electrical energy structures. Wang et al. [
18] studied the suppression effect of electric vehicles on oil consumption, other fossil fuel consumption, and CO
2 emissions, respectively. The results showed that the suppression effect of electric vehicles on CO
2 emissions was affected by various factors such as the power generation structure, the energy conversion efficiency of power plants, and the energy conversion efficiency of conventional fuel vehicles.
However, with the increasing research on the life-cycle carbon emissions of electric vehicles (EVs), there are some different voices on the evaluation of the emission reduction effect of EVs. The results of some studies have shown that the effect of EVs on reducing CO
2 emissions may not be as promising as it could be under the current energy mix. For example, Song et al. [
19] argued that the carbon emissions generated by electric vehicles were higher compared to traditional fuel vehicles if the carbon emissions generated during power generation were included in the carbon emissions of electric vehicles. Karanam et al. [
20] used empirical on-road vehicle data to explore whether drivers were using driving modes as expected by the vehicle manufacturer and developed regression models and engine start analysis to quantify the impact of mode use on energy efficiency and emissions of PHEVs. Incorrect use of driving modes was found to result in an increase of 15–30% in energy consumption and an increase in engine starting emissions. Xia et al. [
21] summarise the environmental impacts of production, use, secondary use, recycling, and remanufacturing of batteries. The results show that electric vehicles have a bigger environmental impact in the production stage than internal combustion engines due to battery manufacturing. Throughout their life cycle, electric vehicles have the potential to reduce greenhouse gas emissions and fossil energy consumption. However, they have a bigger impact than ICEVs in terms of metal and mineral consumption and human toxicity potential. The results of Zhang et al. [
22] showed that the total integrated environmental impact in the whole life cycle of conventional internal combustion engine vehicles is smaller compared to electric motor-driven vehicles. Xu et al. [
23] argued that the assessment of GHG emissions from electric vehicles focused on direct CO
2 emissions from electricity production during the use of the vehicle, while emissions from upstream and downstream processes were neglected. Furthermore, additional charging may lead to accelerated degradation of EV batteries, which may result in higher GHG emissions. This phenomenon was explained by Chao et al. [
24,
25,
26], who concluded that the current energy mix was still dominated by fossil energy and the technology for emission reduction in power plants was still immature. Although the energy conversion efficiency of pure electric vehicles is higher, a significant portion of the electrical energy used comes from coal, which results in higher CO
2 emissions than internal combustion engine vehicles using gasoline [
27,
28]. Therefore, under the current energy structure, the desired emission reduction effect may not be achieved through the large-scale promotion of electric vehicles.
Current research on the carbon emission reduction of electric vehicles (EVs) still has several limitations. First, most studies focus on emissions during the usage phase while neglecting full life-cycle assessments, particularly the high carbon emissions associated with battery production, raw material extraction, and end-of-life recycling. Second, there is insufficient analysis of regional differences, as the impact of varying grid cleanliness on EVs’ emission reduction benefits has not been systematically quantified. Third, dynamic emission reduction models are lacking, failing to fully incorporate scenarios such as future energy structure transitions, battery technology advancements, and synergistic developments in transportation systems.
Additionally, existing studies inadequately address the sensitivity of user behavior (e.g., charging habits, vehicle utilization rates) and lack long-term assessments of grid load and indirect emissions under large-scale EV adoption. Finally, carbon accounting boundaries remain ambiguous, with some studies excluding indirect emissions from infrastructure upgrades and grid expansion, leading to overestimated reduction benefits. A more comprehensive analytical framework is urgently needed to support policymaking.
The life-cycle CO2 emissions of conventional fuel vehicles mainly include “mine-tanks” and “tank wheels”. CO2 gas is produced in the life-cycle processes of oil extraction, storage, transportation, processing, product transportation, and emissions from use, while the life-cycle CO2 emissions of electric vehicles are mainly from the power generation process. In order to investigate the life-cycle carbon emissions and carbon reduction potential of different automotive energy sources, this paper calculates the life-cycle CO2 emissions of electric vehicles and conventional fuels with respect to the electricity energy mix and the CO2 gas emissions generated by different energy sources for power generation. The carbon emission reduction potential of electric vehicles replacing fuel vehicles is predicted.
2. Method
CO
2 emissions of LCA: The consumption of fuel and natural gas in automobile transportation consists of two parts. The first part is the energy consumption in the production stage, and the second part is the energy consumption in the use stage. Energy consumption in the production stage is divided into four stages: raw material mining, raw material transportation, raw material processing, and fuel transportation. Each stage can be numbered with a subscript j. j = 1,2,3,4. To compare with coal consumption in the final stage, energy consumption intensity is defined as E, gce/km. Therefore, the total fuel consumption intensity of an automobile can be calculated as
where
EPTS is the energy consumption intensity in the fuel production process, which can be expressed as the sum of fuel oil and natural gas consumption.
EPTS =
Eoil +
Egas.
EPUS is the direct energy consumption intensity of fuel combustion. The conversion coefficient of coal combustion with isothermal value is defined as
η, gce/kJ. Energy consumption per unit mileage is
ε, kJ/km. Calorific value of fuel is
e, kJ/kg. The efficiency is
ζ in raw material mining, transportation, processing and fuel transportation [
29]. Then, the energy consumption intensity of automobile fuel can be expressed as
where
i is the number of the primary energy type.
i is the consumption intensity of the
ith fuel product in the primary period. In its calculation, various links of the entire industry chain that produce the
ith fuel product throughout its life cycle need to be considered. In the calculation process, the raw material mining loss rate
ζ1 of the
ith fuel is 90%, the raw material transportation loss rate
ζ2 is 96%, the raw material processing loss rate
ζ3 is 85%, and the fuel transportation, combustion, and transmission loss rate
ζ4 is 35%. Therefore, the efficiency of the fuel production stage is approximately 25.2%.
Global Warming Potential (GWP) is used to uniformly convert the N
2O and CH
4 emissions generated at each stage of the whole life cycle of automotive fuel products into CO
2 equivalents. By querying the fifth assessment report of the Intergovernmental Panel on Climate Change (IPCC), the GWP of N
2O is 298, and the GWP of CH
4 is 34, and
Table 1 further gives the calorific value of various fossil fuels on this basis. Convert the total greenhouse gas emissions produced during the whole life cycle of the
jth fuel into CO
2 equivalent and record it as E
T, j. In the calculation process, the CO
2, CH
4, and N
2O emissions generated during the whole life cycle of the
jth terminal energy are recorded as CO
2,
j, CH
4,
j, and N
2O
j, respectively [
30]. Then the fuel emissions in the production stage have the following relationship:
where
mc is the carbon content per unit calorific value of the fuel, kg/kJ.
λc is the oxidation rate of fuel carbon,%.
Q is the fuel mass consumed per kilometer, kg/km. According to engine fuel consumption, the amount of CO
2 produced during fuel extraction and transportation can be classified as emissions in the combustion stage [
31]. Therefore, the CO
2 emissions in the whole life cycle of automobile fuel emissions can be described as follows:
where
ψc is the growth rate of CO
2 emissions in each link. For crude oil extraction, transportation, and processing, the carbon balance method is used to calculate the production of 1 L of gasoline, which will produce 1722 g of CO
2.
In the gasoline combustion process, the converted molecular formula of gasoline is C8H18, and the equivalent molecular weight is 114. The equivalent molecular weight of CO2 is 44. The density of gasoline is 0.742 kg/L. The ideal gasoline combustion reaction formula is 2C8H18 + 25O2 = 16CO2 + 18H2O. According to the law of conservation of mass, the CO2 emission of 1 L of gasoline after complete combustion is 7,451,644/(1142) = 2300 g. According to the proportion of gasoline combustion emissions, the ratio of CO to CO2 is about 1:100, and the ratio of CH to CO2 is about 1:1000. Therefore, according to Formula (5), the amount of CO2 emitted by 1 L of gasoline after combustion is approximately 2301 g. Combining the carbon emissions in the gasoline production process, the mass of CO2 produced in the whole life cycle of consumption of 1 L of gasoline is calculated as MC = 2300 + 1722/95% = 4113 g, and the efficiency of gasoline transportation is 95%.
Using a similar calculation method, the CO2 produced after diesel combustion is about 2677 g/L. Considering the energy consumption of the production process and transportation process, the CO2 emissions of diesel for the whole cycle are about 4490 g/L. For gas vehicles, the main energy source is the CH4 component in natural gas. According to the methane combustion reaction equation, CH4 + 2O2 = CO2 + 2H2O, it is calculated that each cubic meter of natural gas produces about 1964 g of CO2 after combustion. Considering the emissions from natural gas transportation and processing, the CO2 emissions of natural gas in the whole life cycle are about 2078 g/m3.
Electric energy drive equivalent CO
2 emissions: According to the principle of conservation of energy, the conversion formula between electric energy and gasoline consumption is described as [
32]:
where
W is electric energy, kJ. The calculated electric energy of 1 kW·h is equivalent to about 0.109 L of gasoline. In the whole life cycle of fuel production, the energy loss of gasoline vehicles is mainly determined by the thermal efficiency of the gasoline engine, while the energy loss of electric vehicles is mainly determined by the power generation efficiency of the power plant. Considering the energy transfer efficiency (Equation (2)), the energy efficiency of gasoline vehicles is 25.2% and the energy efficiency of electric vehicles is 60% (from the charging pile to the wheels, the energy efficiency of electric vehicles is 57.1–62.5%). Under the premise of considering energy transfer efficiency, the conversion formula of electric energy and gasoline consumption is described as:
Therefore, under the premise of considering the internal energy consumption of the car, 1 kW·h of electric energy is equivalent to 0.26 L of gasoline. Taking coal combustion in thermal power plants as the main comparison object, according to the current average power generation efficiency, 1 kW·h of electricity corresponds to about 0.4 kg of standard coal. When burning solid and liquid fuels in the atmosphere, the volume and mass of air and combustion products are calculated according to the formula listed below, and all volume units are m
3/kg. The theoretical amount of dry air required for the complete combustion of the fuel is described as (when the excess air coefficient is 1):
The theoretical volume of the combustion products produced by the complete combustion of the fuel under the theoretically necessary amount of air (when the excess air coefficient is 1).
The nitrogen volume is described as:
The volume of carbon dioxide (CO
2 + SO
2) is described as:
The water vapor volume is described as:
When the excess air coefficient is greater than 1, the calculation is as follows:
When burning a gaseous fuel in air, the volume and mass of air and combustion products are calculated according to the formula listed below, and all volume units are m3/m3.
The theoretical dry air volume is described as:
The theoretical volume of nitrogen is described as:
The volume of carbon dioxide (CO
2 + SO
2) is described as:
Through calculation, the low-level CO
2 emissions corresponding to 1 kW·h of electricity are about 790 g, SO
2 emissions are about 30 g, and NO
x emissions are about 15 g. Considering the electric energy consumption from the power plant to the tram, the CO
2 emission M
E = 56 = 975 g, where
5 is the power efficiency of the grid, which is taken as 90%.
6 is the charging efficiency of the charger, which is 90%. By querying the proportions of different power generation methods in electric energy, we found that coal power generation accounted for 72.4%, hydropower generation accounted for 24.5%, nuclear power generation accounted for 2.4%, and other power generation accounted for 0.7%. The corresponding CO
2 emissions are 975 g/kW·h, 14 g/kW·h, 272 g/kW·h, and 31 g/kW·h. Therefore, considering various forms of power generation, the CO
2 emissions per kilometer of electric vehicles can be described as:
where k = 1, 2, 3, and 4, respectively, representing four power generation modes.
M is the CO
2 emission of each power generation mode, g/kW·h.
R is the proportion of each power generation mode,%.
EE is the energy consumption of trams per 100 km, in kW·h. The calculated comprehensive CO
2 emissions under various power generation forms are 1056 g/kW·h.
Emissions model considering traffic patterns: The main vehicle fuels are divided into gasoline, diesel, natural gas, and electric energy. Among them, electric vehicles are further divided into pure electric vehicles and gasoline-electric hybrid vehicles. According to the conventional fuel or electric energy consumption of L/km or kW·h/km, the CO2 emissions per unit mileage in the full cycle of various fuels are calculated.
According to the proportion of various vehicles obtained by statistics, the congestion situation of urban traffic in different periods of time and the impact of seasonal changes on the energy consumption of trams, the carbon emission reduction potential model of a certain area in different periods of time can be described as [
33]:
where
n = 1, 2, 3 represents the carbon emissions of gasoline, diesel, and natural gas.
Mc denotes the fuel carbon emissions per kilometer, in grams per kilometer.
βc is the rate of change of fuel vehicle energy consumption (affected by congestion, load, etc.).
βe is the rate of change in energy consumption of electric vehicles (affected by temperature, load, and battery attenuation),%.
Sc and
Se are the average mileage of fuel vehicles and electric vehicles, respectively, in km. In the calculation process, based on the number of cars in a certain area, the proportion of vehicle types, and the distance travelled, the total carbon emissions of the area can be macroscopically calculated. In addition, by using electric vehicles to replace some fuel vehicles, the carbon emission reduction potential of the region can be predicted. Through the daily energy consumption of fuel vehicles and the rate of change of electric energy consumption of electric vehicles, the cycle rate of carbon emission reduction can be predicted.
3. Results
Impact of power substitution on grid structure: From the perspective of the same energy consumption, the average consumption of gasoline is 6 L per 100 km, that of diesel is 5 L per 100 km, and that of electricity is 20 kW·h per 100 km. To facilitate data calculation and comparison, the consumption of oil, diesel, and electricity can be treated as approximately equivalent. A rough calculation of CO2 emissions can be made by the gasoline consumption of a country in a year.
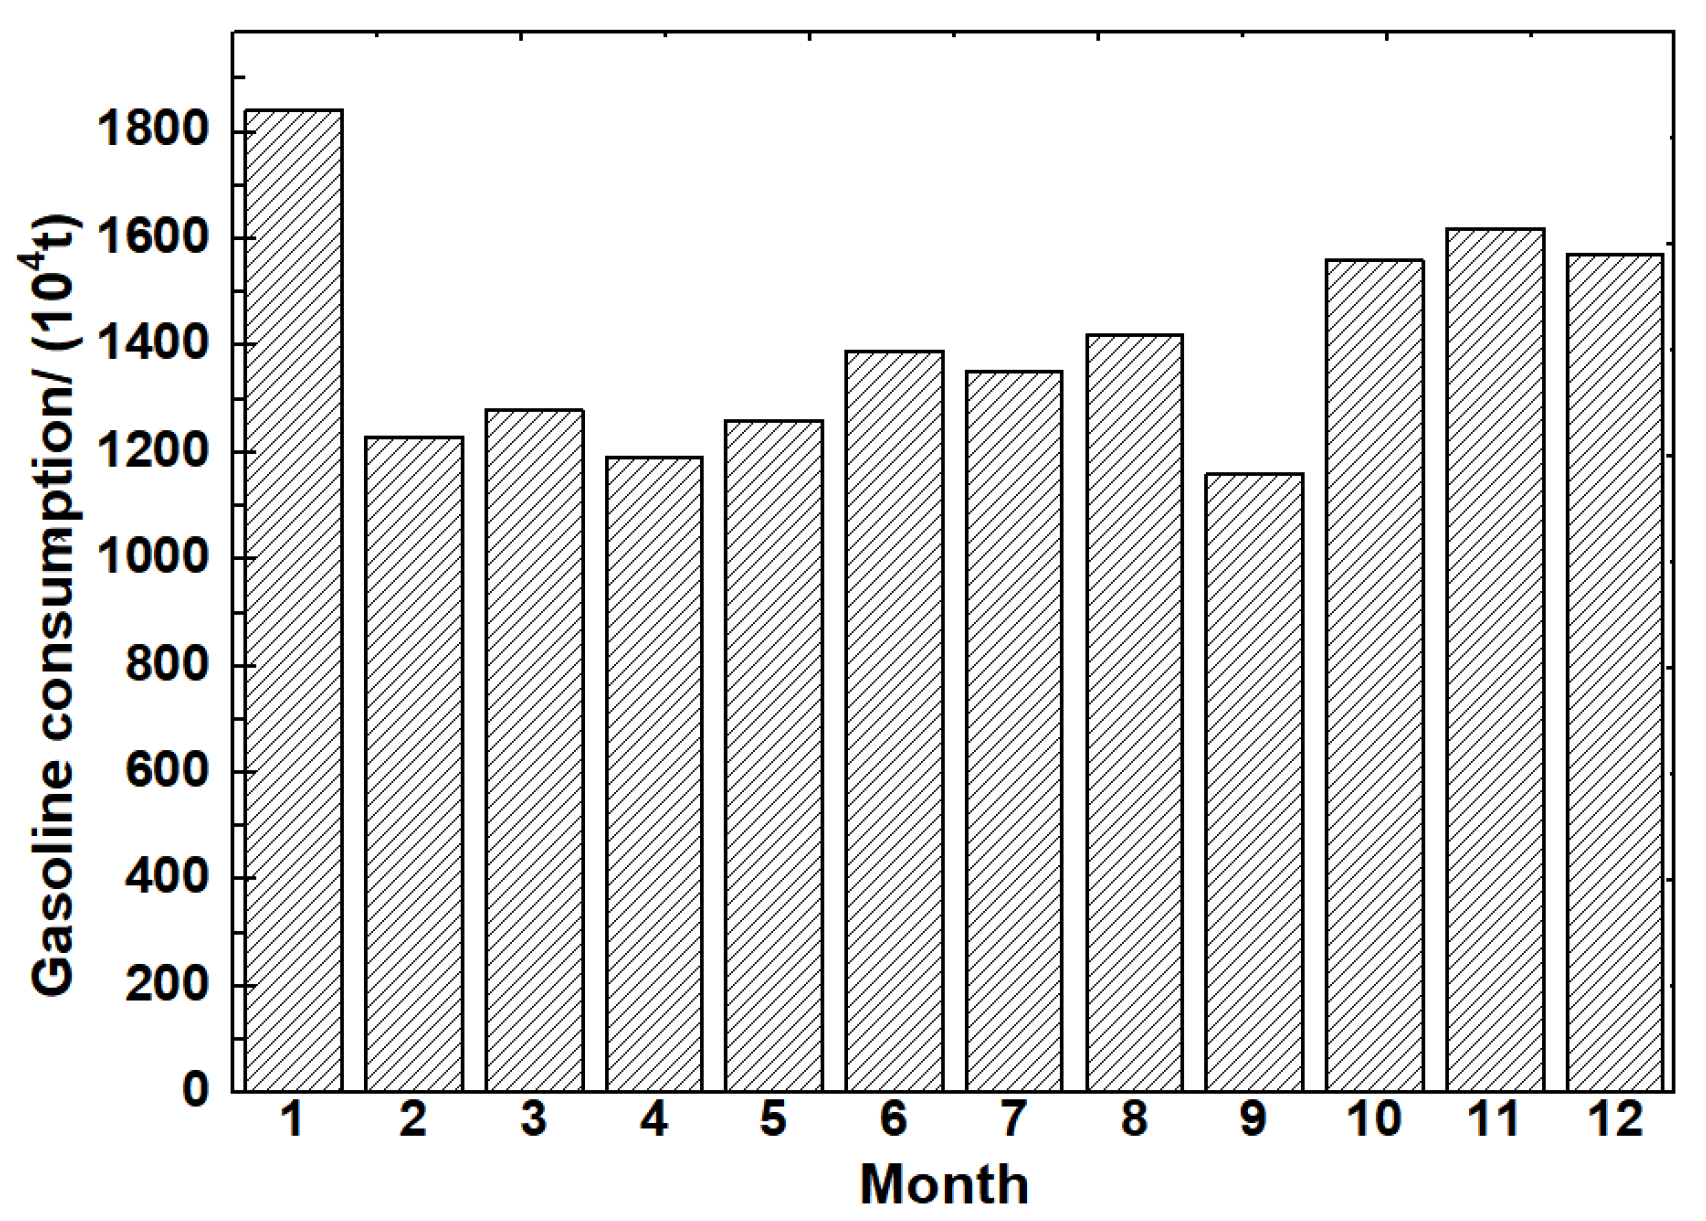
Figure 1 shows the gasoline production and growth from January to December. The total gasoline production in this country was 168.732 million tons, increasing by 6.8% year-on-year. The actual consumption of gasoline amounted to 159.311 million tons or 94.4% of the total production.
The total gasoline consumption and volume calculations for the whole year, from January to December, can be obtained by using the conversion of gasoline mass to volume. By using the annual gasoline production data and combining it with the reasonable equivalent of oil consumption, the annual CO
2 emission of gasoline combustion is calculated from Equation (6) as 4.94 × 10
11 kg. By using Equation (5) and the calculation results in
Table 2, the total life-cycle CO
2 emission of gasoline is 8.82 × 10
11 kg, of which the CO
2 emission from the combustion process accounts for 56%. Since most of the CO
2 products are released through exhaust gas during the operation of the vehicle, it is important to improve the efficiency of vehicle exhaust gas treatment by optimizing the engine exhaust gas emission process to reduce CO
2 emissions. According to Equation (7), the total electrical energy consumed for the equivalent treatment of gasoline and electricity is 8.25 × 10
11 kW·h.
As shown in
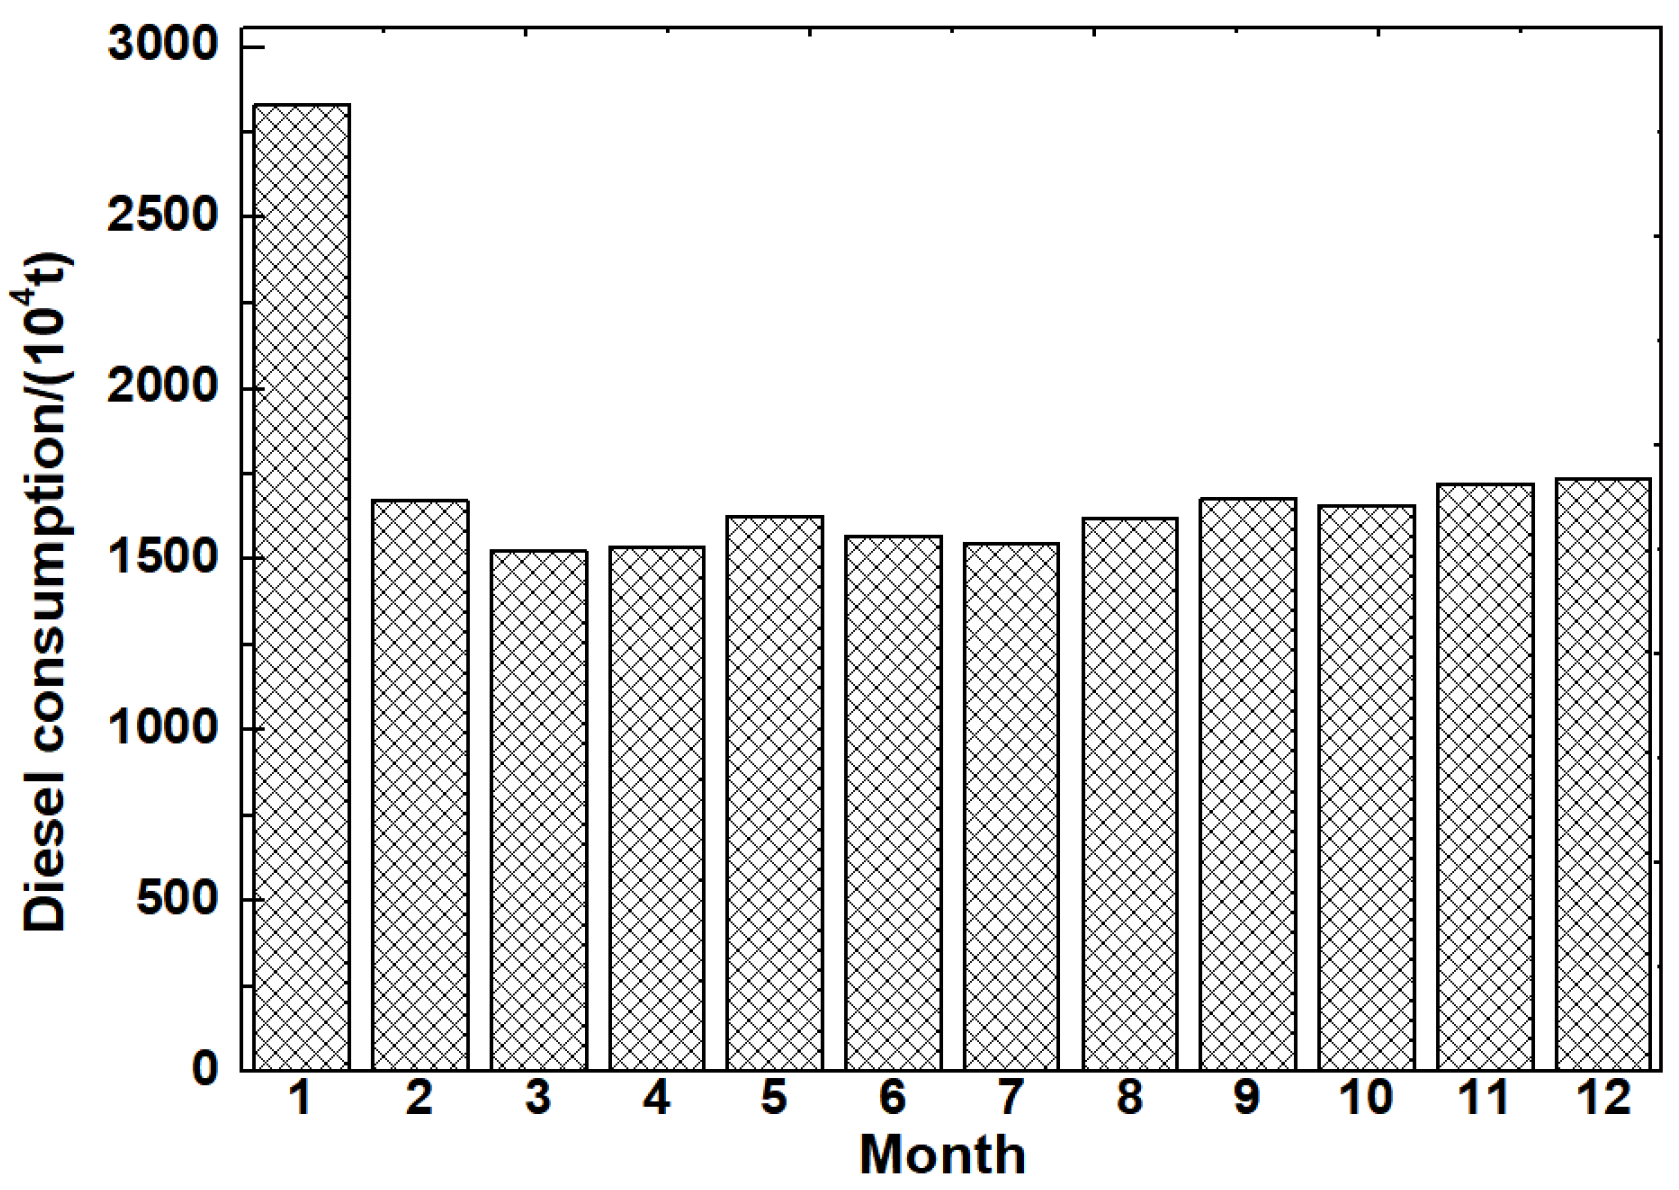
Figure 2, the diesel consumption from January to December is 207.214 million tons, and the actual consumption is about 194.37 million tons, which corresponds to the consumed diesel volume capacity of 2.32 × 10
11 L. By appropriately processing the equivalence relationship between gasoline and diesel, this part of diesel is approximately equivalent to 2.55 × 10
11 L of gasoline, which corresponds to a total CO
2 emission of 1.05 × 10
12 kg. If half of the annual automobile fuel consumption is replaced by electric energy, the new power generation capacity is 9.03 × 10
11 kW·h. According to the statistics, the total national power generation capacity is 7.03 × 10
12 kW·h in that year, and the new part of power generation accounts for 12.8% of the total annual power generation capacity.
This year, the national motor vehicle ownership reached 360 million, of which 318.22 million were gasoline vehicles, accounting for 88.4%, 31.54 million were diesel vehicles, accounting for 8.8%, 3.46 million were gas vehicles, accounting for 1%, and 678 were new energy vehicles, accounting for 1.9%. Assuming that all the electricity required for electric vehicles comes from renewable clean energy such as solar and wind power, and that gasoline vehicles are mainly replaced with electric vehicles, in order to reduce CO2 emissions by half, the number of new electric vehicles required is N = Qc·Nc/2 V, where Qc is the total annual equivalent gasoline consumption and Nc is the total annual equivalent gasoline vehicle number. According to the calculation, the number of electric vehicles needs to be increased by more than 1.62 × 10⁸. From the current development of electric vehicles, the charging time of electric vehicles is long, and the possibility of charging multiple electric vehicles at the same time is high. Assuming that the charging power of each EV is Pi, the total charging power required for new EVs is N·Pi. If Pi = 3 kW, the new charging power required is 4.86 × 10⁸ kW, which will have higher requirements on the grid load of that year.
Impact of reducing the proportion of coal and electrification of vehicles on CO
2 emissions: In the existing power structure, coal power generation accounts for 72.4%, hydro power generation accounts for 24.5%, nuclear power generation accounts for 2.4%, and other power generation accounts for 0.7%. The life-cycle CO
2 emissions of various forms of power generation are 975 g/kW·h, 14 g/kW·h, 272 g/kW·h, and 31 g/kW·h. Ideally, the share of coal power generation is less than 50%. If the reduced share of coal is divided equally among other energy sources, the corresponding carbon emissions per unit of electricity and the corresponding carbon emission reduction due to the increase in electric vehicles are shown in
Table 3. When the coal share is reduced by 70% to 50%, the corresponding CO
2 emission reduction from power generation is reduced by about 25%. This indicates that the increase in the proportion of clean power generation increases carbon emission reduction at a rate greater than that of the reduced share of coal. Thus, the reduction in emissions is more obvious in the later stages of the reduction of the coal generation share.
By comparing the reduced gasoline cycle carbon emissions with the corresponding tram carbon emissions, it is concluded that a 20% reduction in gasoline corresponds to a reduction in carbon emissions of about 5.43 × 10⁷ kg to 8.47 × 10⁷ kg. When the share of coal in power generation is changed, the CO2 reduction rate is about 30.9% to 48.2%. When gasoline vehicle emissions are reduced by 40% compared to the current level, the annual carbon emission reduction is 1.09 × 10⁸ kg.
Cyclical carbon reduction pattern: Since the fuel or power consumption of fuel vehicles and electric vehicles varies significantly with seasons and road congestion, the carbon emissions of fuel and electric vehicles in different months and daily time intervals are calculated, and then the time cycle law of carbon emission reduction is predicted.
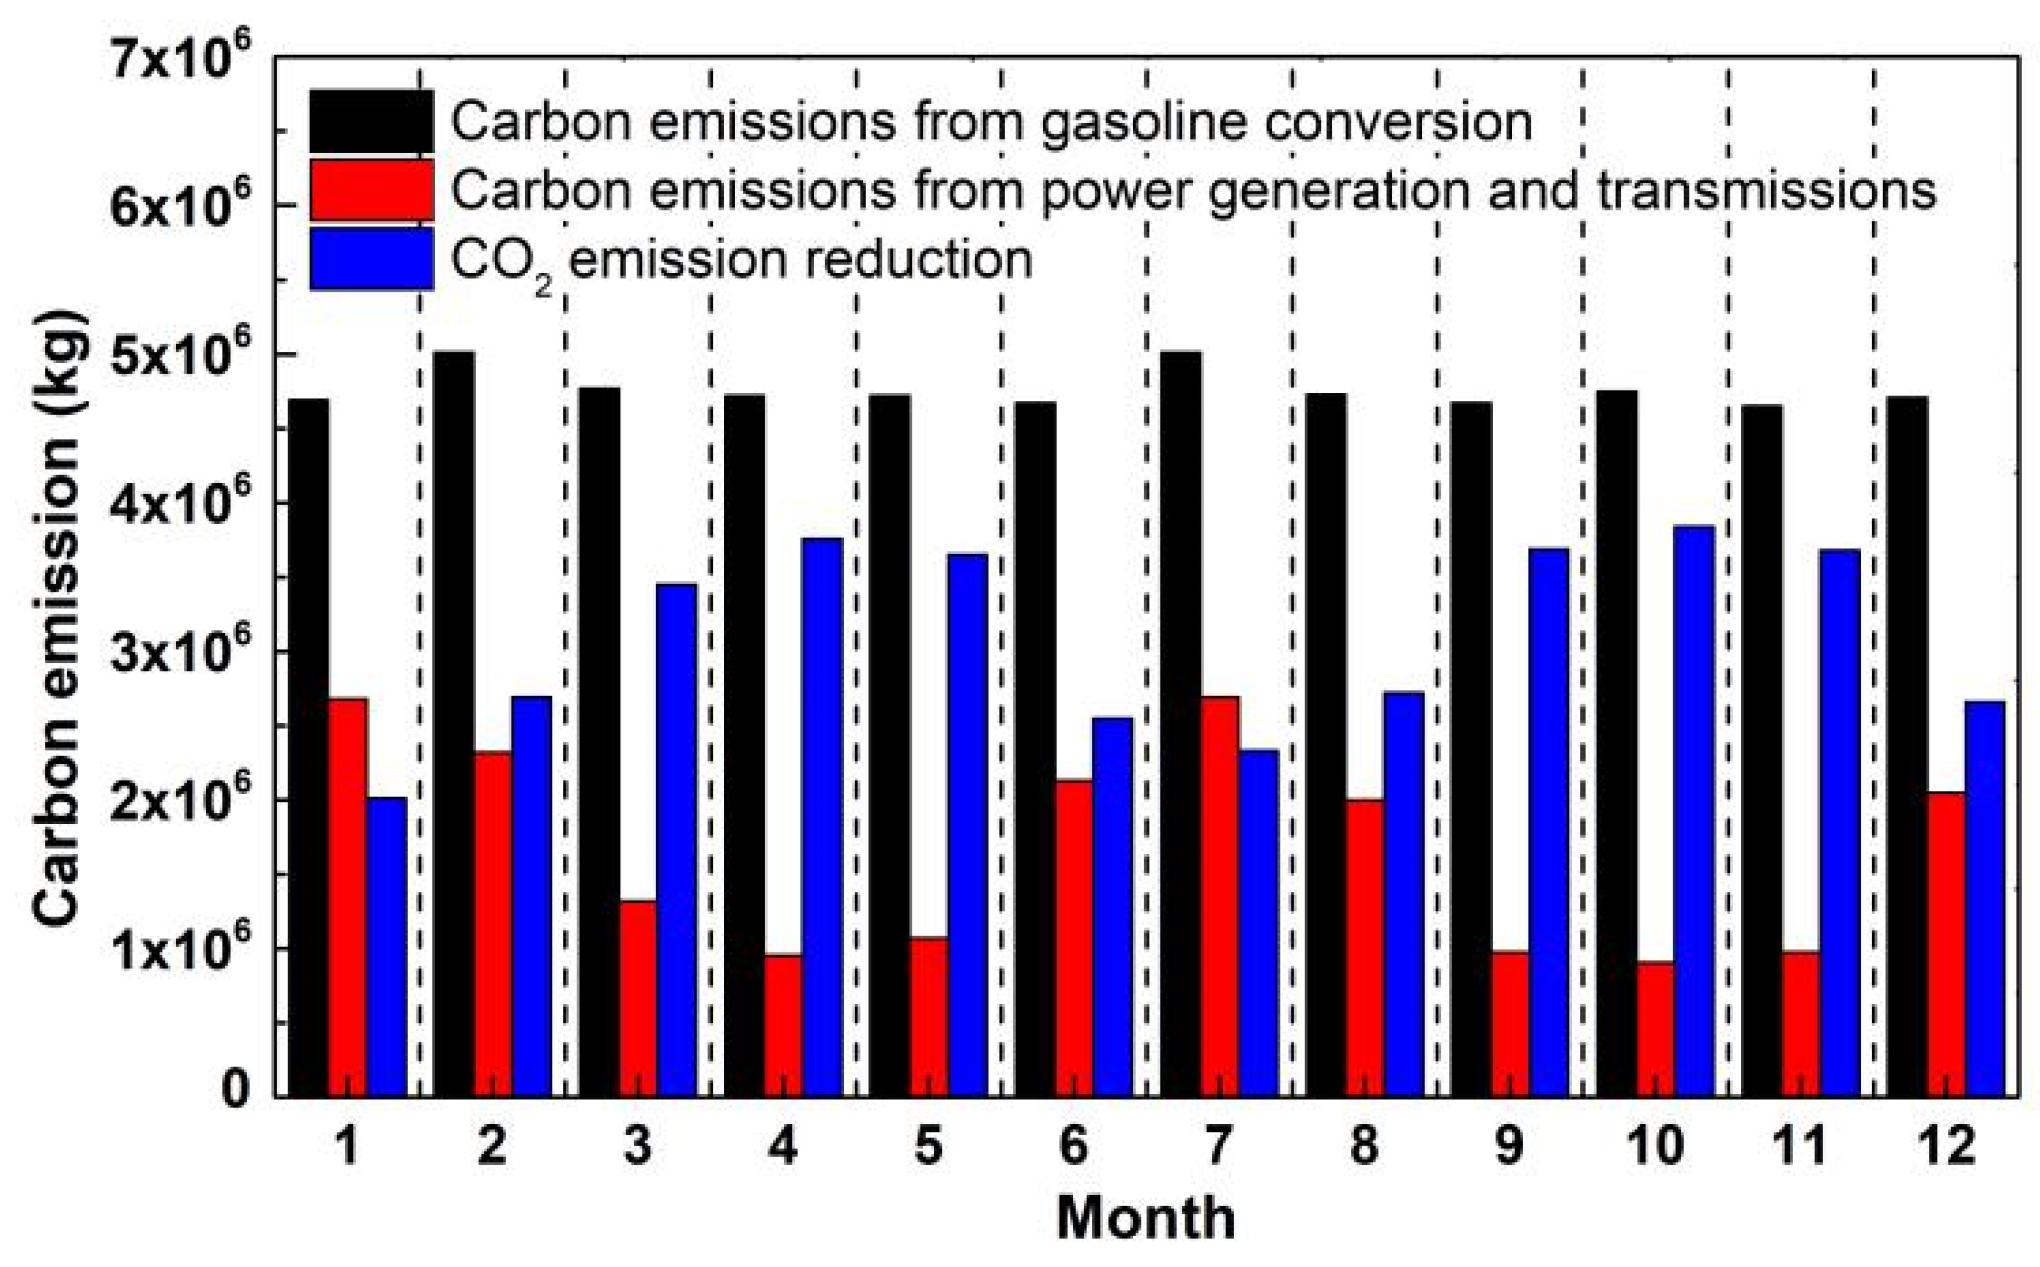
Figure 3 shows the carbon emissions, electric vehicle emissions, and emission reduction of every 10,000 vehicles in different months. Since fuel and power consumption will increase as automobile air conditioners are turned on in summer and winter, energy consumption is the highest from June to August and December to February. Compared with the consumption of fuel air conditioning, the battery consumption of electric vehicles is more significant when they are super cold in winter and overheated in summer. The maximum carbon emissions are about three times the minimum, while those of fuel vehicles increase by 7%. According to the corresponding seasonal carbon emission changes of trams, the time period of maximum annual carbon emission reduction is from March to May and from September to November. Therefore, the use of energy vehicles can be adjusted according to the seasonal carbon emission law to meet the carbon emission requirements.
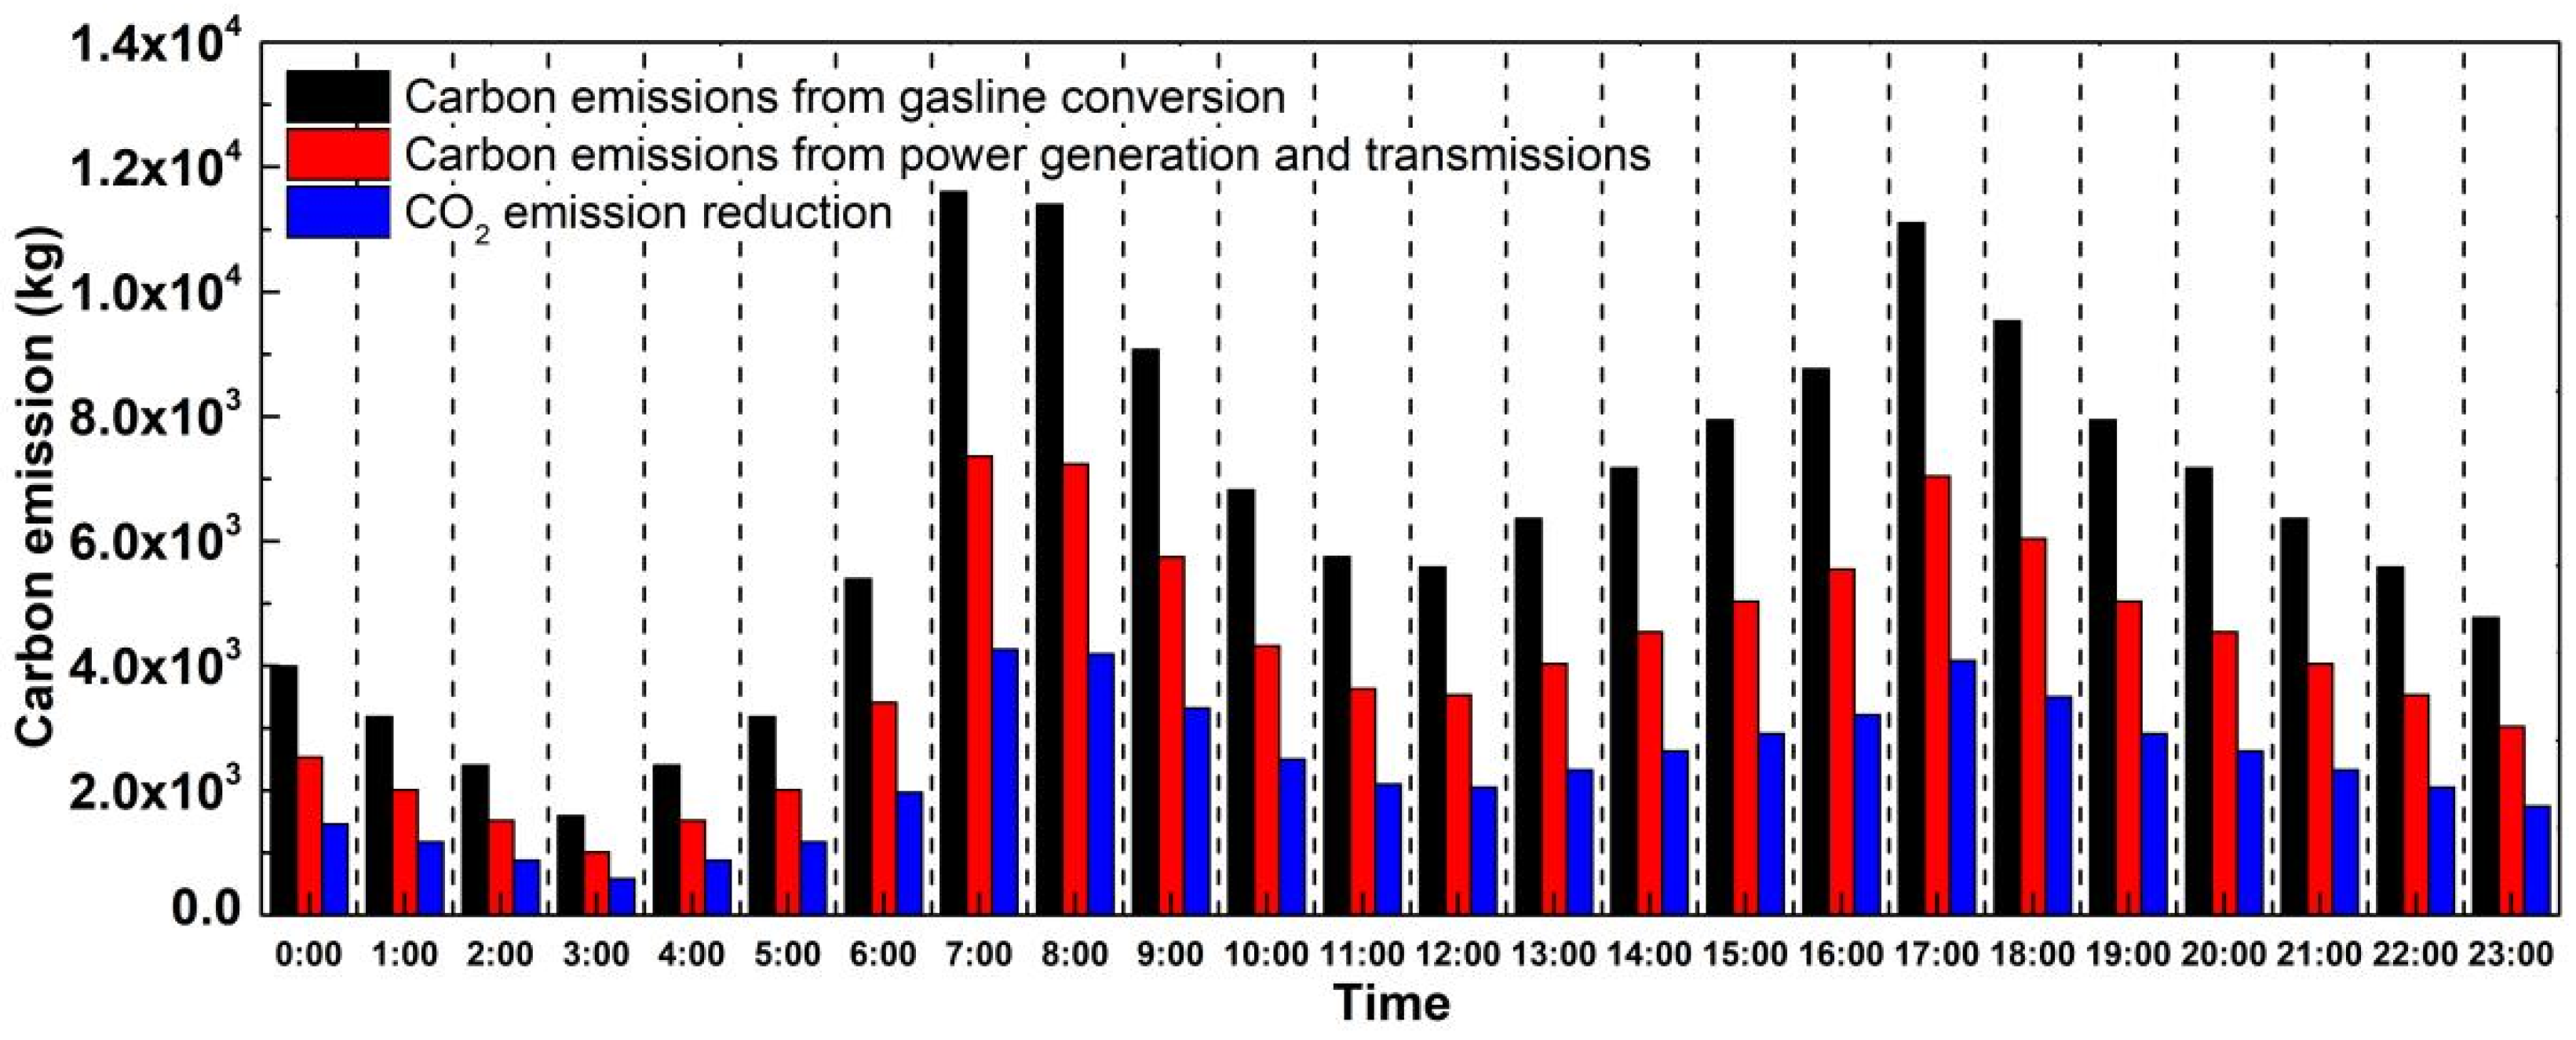
Figure 4 shows the pattern of carbon emissions per 10,000 vehicles with time of day (hours). In the first two stages of the peak, which are 6:00 to 9:00 and 17:00 to 20:00, the number of travellers is the biggest and carbon emissions peak during this time; in the second stage, which are 9:00 to 12:00 and 20:00 to 23:00, carbon emissions are close to the average of emissions; in the third stage, which is 12:00 to 17:00 and 23:00 to 24:00, the number of travellers and emissions significantly decrease; in the fourth stage, which is 0:00 to 6:00, there are only a few travellers. The calculation results show that the equivalent emissions of electric vehicles are close to the trend of fuel vehicles over time. The increase in carbon emissions from fuel vehicles during peak hours is about 7.3 times higher than that during the low peak hours of 3:00, while the equivalent emissions from trams increase by about 6.8 times in the same comparison, indicating that peak congestion has a more significant impact on carbon emissions from fuel vehicles than from electric vehicles. The comparison reveals that there is not only a carbon emissions peak but also a carbon emission reduction peak during the peak period, which indicates that the use of a tram for travel in the peak period can help with carbon emission reduction.
4. Discussion
The results of the study show that thermal power has the biggest share in the power generation structure, and its carbon emissions are the largest. Ideally, thermal power generation needs to be replaced by clean power generation, and fuel cars need to be replaced by electric cars, with a maximum emission reduction rate of 91.45%. However, the replacement of thermal power by clean power generation is constrained by the impact of power generation capacity and energy consumption, which is difficult to reduce to less than 70% currently. Therefore, measures to reduce carbon emissions for cities and individuals can be considered in terms of urban transportation planning schemes and personal means of travel.
If a city has a population of 10 million and 6 million cars, and if electric public transportation is used for peak trips and carpooling is used for low peak trips, as shown in
Table 4, carbon emissions change periodically with the change in transportation mode. The daily travel time is divided into four time periods with 6 million, 4 million, 2 million, and 500,000 travellers, respectively. The carbon emissions from fuel and natural gas combustion for single-person driving, two-person carpooling, three-person carpooling, four-person carpooling, and bus travel were calculated, respectively. The results show that about 90% to 95% of CO
2 emissions can be reduced by using public transportation during peak hours. The maximum carbon reduction rate is about 70% to 75% if the carpooling mode is used. If the percentage of public transportation trips is 50% and the travel mode of carpooling is used, the maximum carbon reduction in the city is about 5.98 × 10
7 kg/d, which is about 73% of the maximum emissions. Therefore, the goal of reaching a daily average carbon emission reduction of more than 50% can be achieved by combining long-distance carpooling and short-distance public transportation methods.
The electric drive of buses and subways has a significant impact on carbon emission reduction. Therefore, the daily traffic of the city is still taken as the object of investigation. Assuming that driving, public transportation (bus and subway), and emissions-free transportation (cycling or walking) account for 45%, 35%, and 20% of the daily traffic, the total daily carbon emission of the city is about 6.25 × 10
6 kg. As shown in
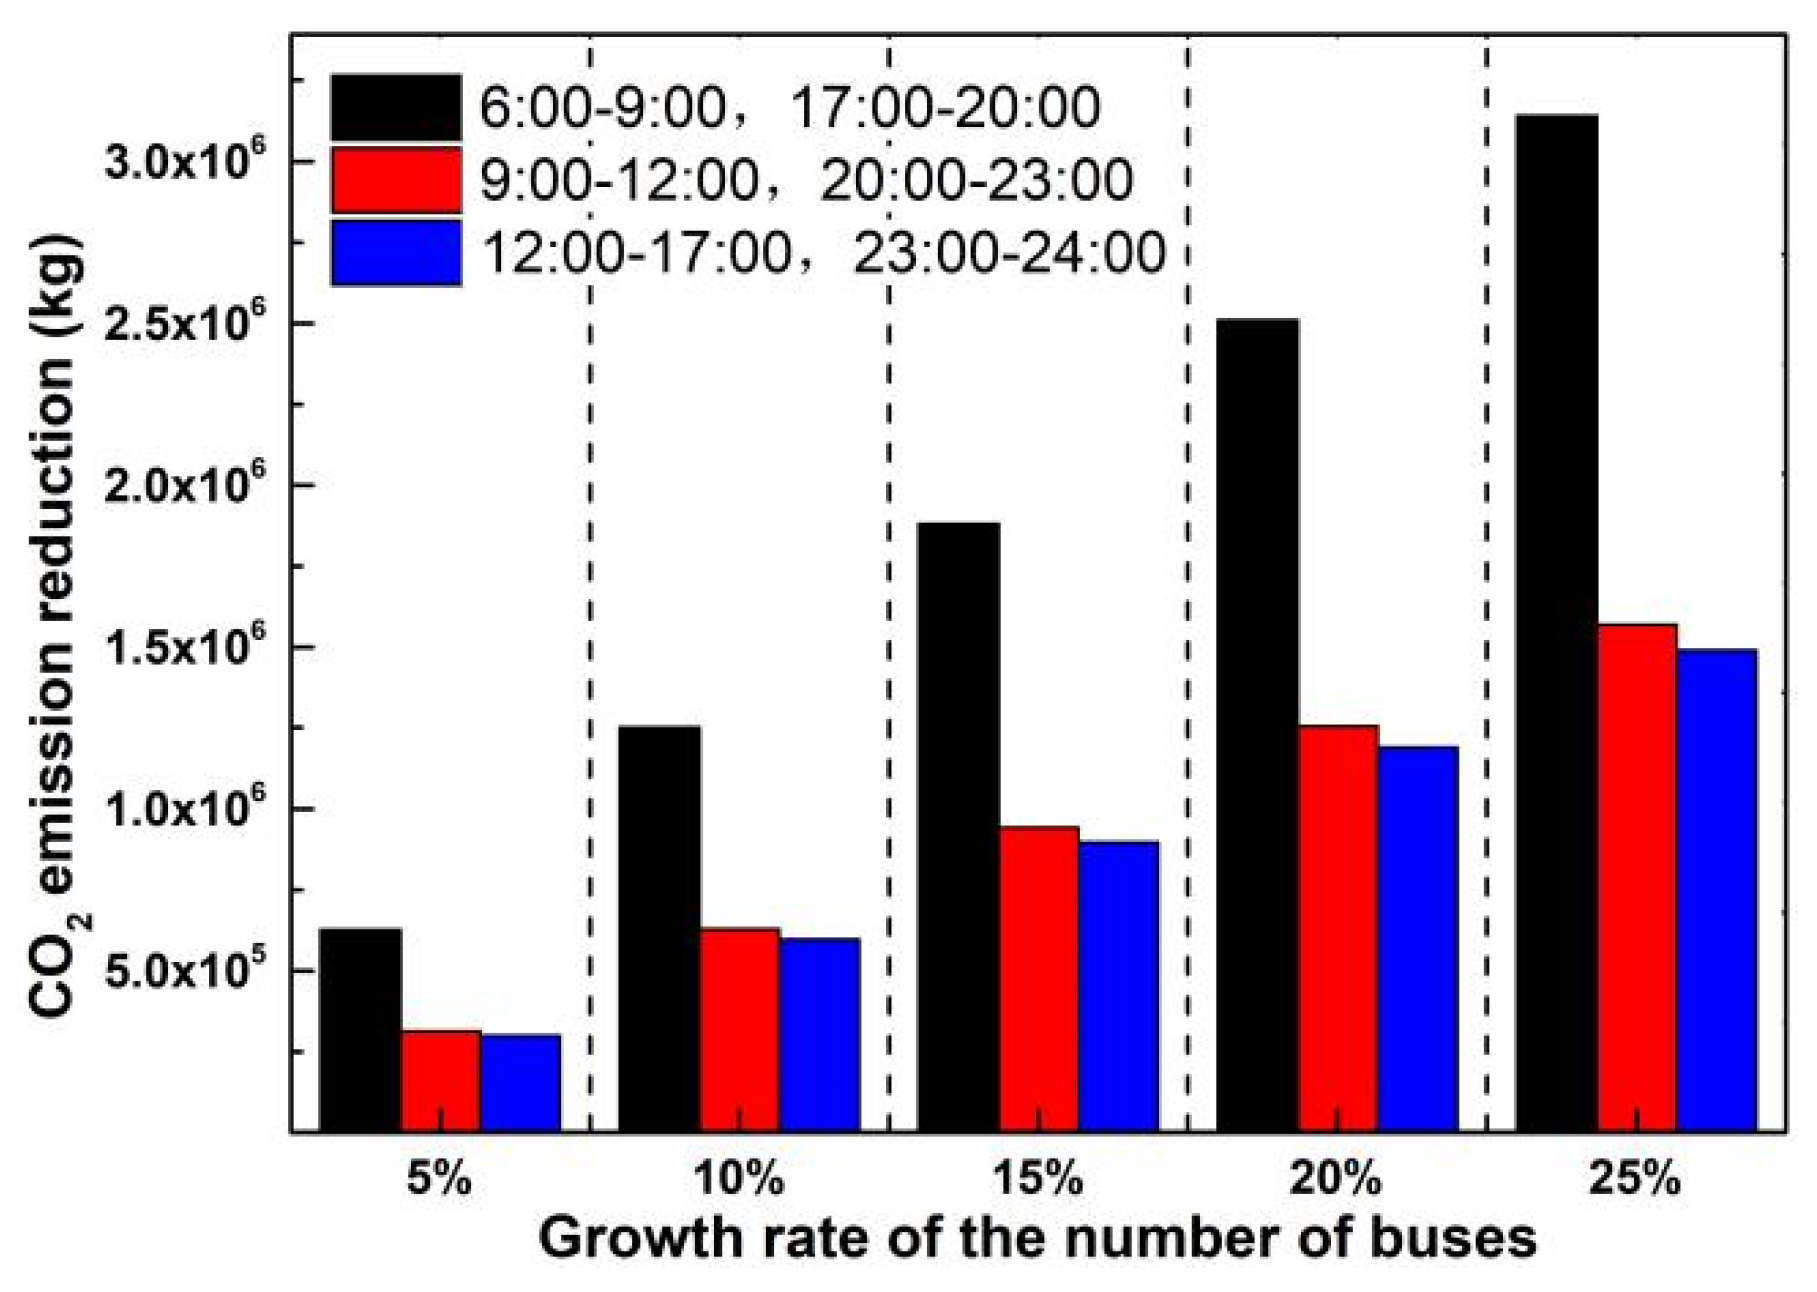
Figure 5, the proportion of electric public transport increases by 5% to 25%, corresponding to the carbon emission reduction in each period. When public transport increases by 5%, that is, the proportion reaches 40%, and the carbon emission reduction in the peak period (6:00 to 9:00, 17:00 to 20:00) is 6.27 × 10
5 kg/d, the maximum carbon emission is about 10%. When public transportation increased by 25%, that is, the proportion reached 60%, the peak carbon emission reduction was 3.14 × 10
6 kg/d, about 50% of the maximum carbon emission. The results show that the increase in public electric vehicles and carbon emission reduction change approximately linearly, and the carbon emission reduction in the first stage of the peak period is the most obvious, which is about twice the carbon emission reduction in the second and third periods. If subway transportation is introduced, as shown in
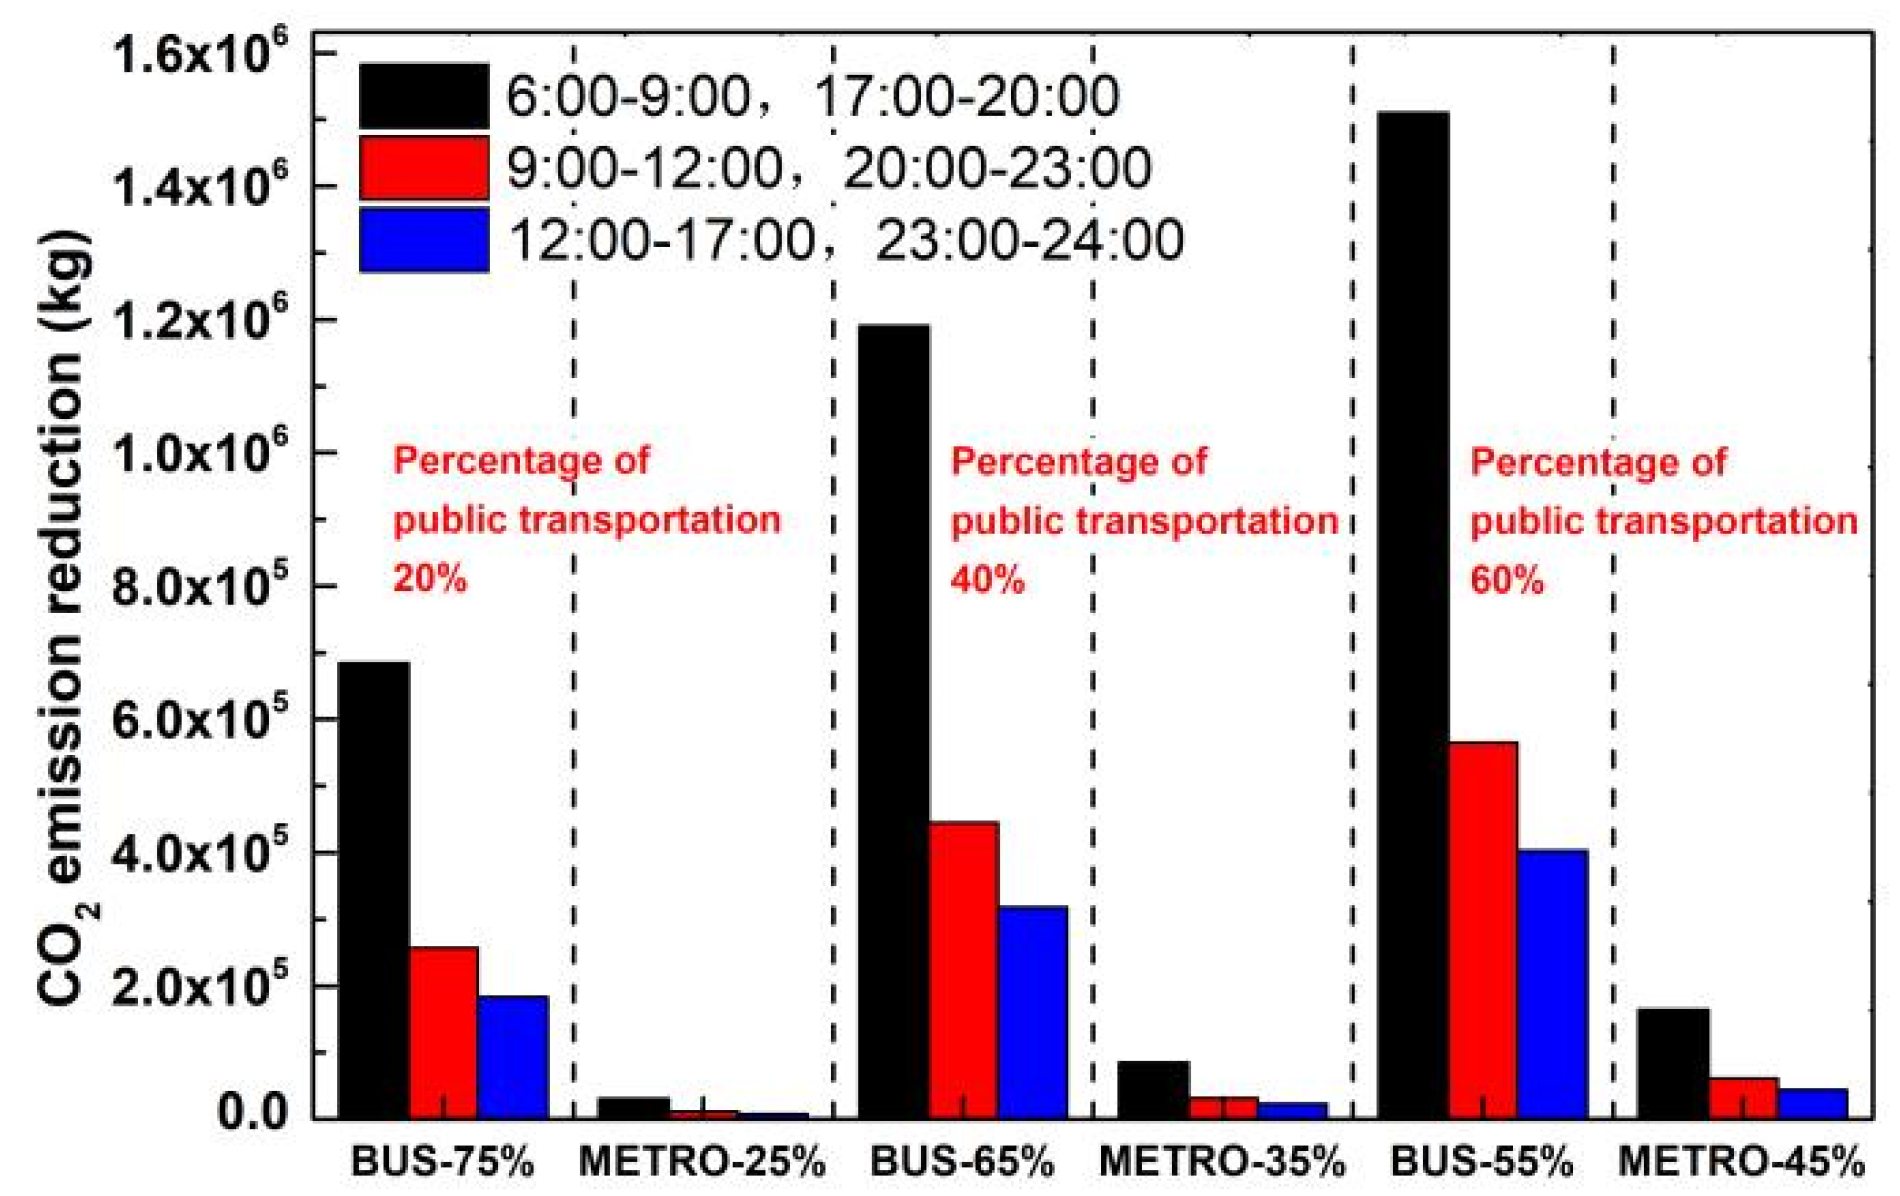
Table 5, the average number of passengers carried by bus and subway varies in each time period. As shown in
Figure 6, carbon emission reduction varies approximately linearly between time periods under different proportions of public transport. However, when the proportion of the subway increased from 25% to 45%, its carbon emission reduction changed by about five times. In addition, the change rate of carbon emission reduction caused by the increased subway use in peak periods is much higher than that in daily periods.
5. Conclusions
In this paper, CO2 emissions from conventional motor fuels and electrical energy in transportation are predicted for the whole life cycle of production and use. The carbon emissions from gasoline, kerosene, and natural gas during extraction, processing, and transportation, as well as carbon emissions from coal generation and transmission losses, are considered in the calculations. By comparing the carbon emission patterns of seasonal travel changes and traffic congestion states, the following main conclusions are drawn:
(1) By reducing the use of gasoline and replacing it with electric vehicles, the resulting CO2 reduction rate for the existing power generation method is about 30.9%. If the share of coal generation is reduced to 50% by replacing gasoline vehicles with electric vehicles, emissions will be reduced by about 48.2%. However, to replace 50% of existing fuel vehicles with electric vehicles, an additional 9.03 × 10¹¹ kW·h of electricity generation would be required, accounting for 12.8% of the total annual electricity generation.
(2) The increase in energy consumption of electric vehicles in winter and summer leads to an increase in their equivalent carbon emissions, corresponding to a smaller increment in carbon emissions from fuel vehicles. The corresponding emission reduction effects are for the months of March to May and September to November. Due to the regularity of daily trips, the increase in carbon emissions from fuel vehicles during peak hours is about 7.3 times higher compared to that during low peak hours, and peak congestion has a more significant effect on carbon emissions from fuel vehicles than those from electric vehicles.
(3) By replacing fuel vehicles with trams, carpooling, or increasing the proportion of public transportation, urban carbon emissions can all be reduced. Among them, the use of public transportation during the peak hours of daily travel has the most significant impact on emission reduction. Ideally, 90% to 95% of CO2 emissions can be reduced. At the same time, the carbon reduction rate of the subway during peak hours is about 5 to 10 times higher than that of the bus. As the number of travellers increases, the carbon reduction effect of the subway becomes more and more significant. Therefore, seasonal use of electric vehicles to replace fuel vehicles and using more public transportation during daily peak hours can be more effective in reducing carbon emissions.
