1. Introduction
The heavy dependence on fossil fuels for energy generation has resulted in severe environmental issues, making carbon emission reduction a top priority. Advancing innovative technologies or optimizing existing processes in alignment with sustainability principles, while incorporating alternative products like methanol, is crucial for producing clean, cost-effective energy and chemicals while addressing economic and energy-related challenges [
1,
2]. However, achieving sustainable industrial processes remains a major global hurdle in the chemical sector. Embedding sustainability considerations into process design is essential for mitigating environmental impacts. The future development of chemical, pharmaceutical, and bio-based industries must prioritize key aspects such as improved efficiency, capacity, safety, and adaptability, while also minimizing energy consumption, waste production, and operational expenses. Additionally, streamlined process configurations are necessary to enable seamless retrofitting and enhance overall process sustainability [
3,
4].
Hydrogen has attracted global attention for its immense potential as a key energy carrier, with applications in both stationary and mobile energy systems [
5]. It presents a viable solution to current energy challenges; however, its large-scale adoption depends on substantially reducing production costs, as economic feasibility remains a crucial factor in expanding the hydrogen economy [
6,
7]. Currently, worldwide hydrogen demand is approximately 70 million metric tons per year, with the majority produced through fossil fuel-based processes. Around half of global hydrogen production comes from natural gas and refinery gas reforming, while nearly 30% is generated as a byproduct of chemical synthesis. Traditional production methods, such as steam methane reforming and coal gasification, contribute significantly to greenhouse gas emissions. In contrast, sustainable approaches, including renewable energy integration, advanced power generation technologies like the Allam–Fetvedt cycle, and green hydrogen production via electrolysis, offer substantial environmental benefits over conventional methods [
8,
9].
Methanol is an essential chemical with a wide range of industrial applications, including its use as a fuel, feedstock for chemical synthesis, and as a hydrogen carrier for clean energy systems. Due to its high hydrogen content, ease of transport, and compatibility with existing infrastructure, methanol has gained significant attention as a sustainable and practical hydrogen storage medium [
10]. Methanol production can be integrated with renewable and low-carbon technologies, enhancing its sustainability profile. Green methanol, produced from carbon capture and utilization (CCU) or biomass gasification, offers a carbon-neutral alternative to conventional fossil fuel-based hydrogen production. Additionally, methanol synthesis from captured CO
2 contributes to carbon recycling, reducing overall greenhouse gas emissions and promoting a circular economy. The use of methanol in hydrogen fuel cells provides a cleaner alternative to conventional fossil fuels, supporting the transition toward low-emission energy solutions. Its application in maritime and heavy-duty transport sectors as a renewable fuel further underscores its potential to decarbonize hard-to-abate industries. Advancements in methanol production from sustainable sources, coupled with innovations in methanol reforming and fuel cell technology, will further enhance its viability as a hydrogen carrier [
11,
12].
Process integration is a structured methodology aimed at designing and optimizing industrial processes to enhance energy efficiency, maximize resource utilization, and promote environmental sustainability. It is essential in energy and chemical production, as it improves process efficiency, minimizes waste, and reduces environmental impact. By strategically integrating heat, mass, and utility flows within industrial systems, process integration enables more sustainable and cost-effective operations [
13,
14]. The key principles and advantages of process integration in sustainable energy and chemical production include heat and mass integration, improved energy efficiency, lower carbon emissions, optimized resource consumption, minimized waste generation, facilitation of renewable energy adoption, economic benefits, and process intensification. As industries move toward decarbonization and sustainable energy transitions, process integration will become even more significant. Emerging digital technologies, such as digital twins and AI-driven optimization, will further enhance its efficiency and implementation. With increasing regulatory demands for emission reductions, process integration will be a fundamental strategy for achieving industrial sustainability goals [
15,
16].
Liquefied natural gas (LNG) has emerged as a pivotal element in the global energy landscape, offering a cleaner alternative to traditional fossil fuels and serving as a bridge toward more sustainable energy systems. Its versatility allows for seamless integration with power generation and chemical production, enhancing energy security and supporting environmental objectives [
17]. Incorporating LNG into power generation significantly reduces greenhouse gas emissions, contributing to improved air quality and aiding in climate change mitigation efforts. Additionally, LNG’s reliability complements renewable energy sources like wind and solar by providing consistent power during periods of low renewable output, thereby ensuring grid stability. Beyond electricity generation, LNG plays a crucial role in the chemical industry [
18]. It serves as both a feedstock and an energy source for various chemical processes, including the production of hydrogen, methanol, and ammonia. The chemical sector’s integration of LNG enhances process efficiency and reduces carbon emissions, aligning with global sustainability goals. In conclusion, LNG’s integration into power generation and chemical production offers a viable pathway toward a more sustainable energy future. Its role as a cleaner fossil fuel, combined with advancements in renewable energy integration, positions LNG as a critical component in the global energy transition [
17,
19].
This research focuses on the design and simulation of a novel, fully integrated process for the co-production of power, LNG, and methanol, with an emphasis on improving sustainability and energy efficiency. The proposed system employs the Allam–Fetvedt cycle for power generation alongside carbon capture, utilizes a solid oxide co-electrolyzer system for syngas production from water and carbon dioxide, and includes a unit for methanol synthesis. This paper aims to achieve the following objectives: Develop an integrated process that effectively merges power generation via the Allam–Fetvedt cycle with hydrogen production and syngas generation through the H2O and CO2 electrolyzers’ system, alongside methanol synthesis. Implement and analyze heat and mass integration to optimize resource utilization and reduce energy losses. Develop a comprehensive process simulation utilizing Aspen HYSYS to evaluate the feasibility and performance of the integrated system, while assessing key performance indicators including energy efficiency and production rates. Evaluate the carbon footprint and environmental advantages of the proposed integrated process in relation to traditional LNG, hydrogen, and methanol production methods. Identify significant challenges and opportunities for the commercial implementation of the proposed system. The paper’s structure embodies this thorough methodology. The introduction delineates the rationale for sustainable chemical and energy production, emphasizing the benefits of hydrogen and methanol in the shift towards low-carbon energy systems. This segment is succeeded by a comprehensive description of the integrated process, encompassing the Allam–Fetvedt power cycle, the electrolyzer system, methanol synthesis, the LNG liquefaction unit, and the air separation unit. The simulation section delineates the modeling of each unit in Aspen HYSYS, accompanied by flow diagrams and stream data. The results and discussion section offers a detailed examination of material and energy efficiencies, carbon emissions, and the system’s conformity with net-zero objectives. The paper concludes by summarizing the system’s potential contribution to clean energy objectives and advocates for future techno-economic and life cycle assessments to further validate its industrial feasibility.
2. Process Overview
The
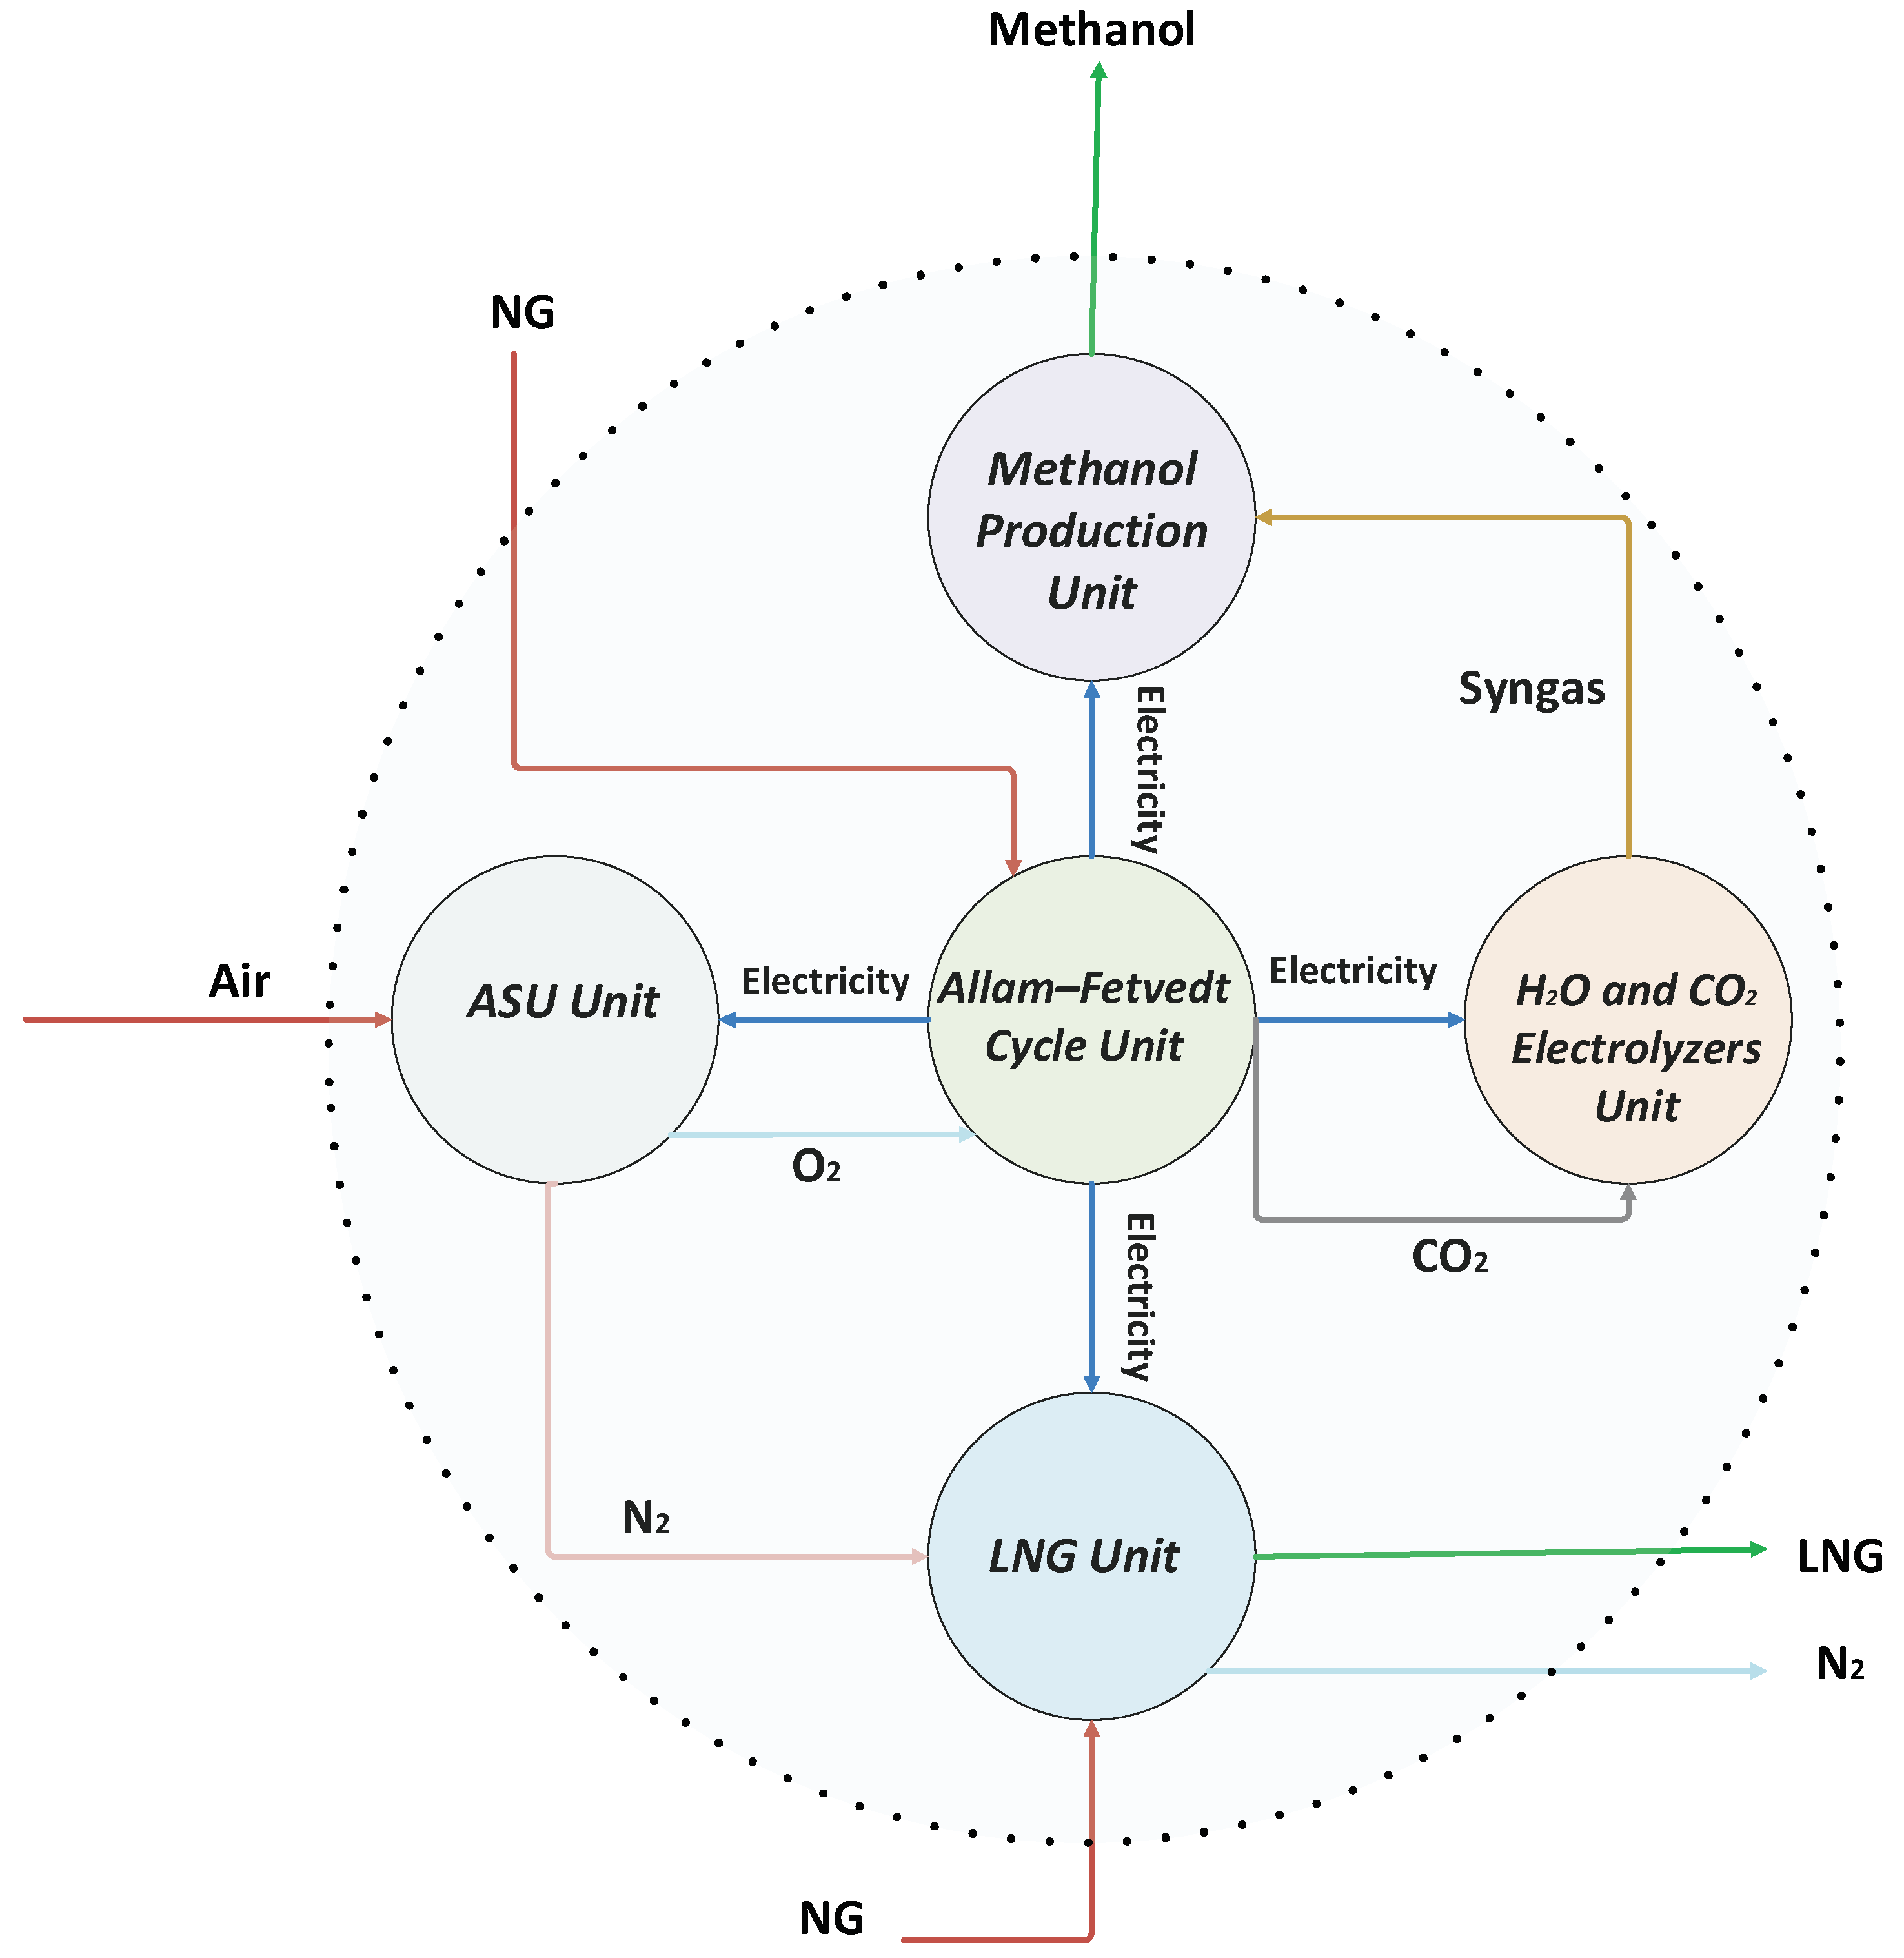
Figure 1 presents an integrated system designed for the simultaneous production of power, liquefied natural gas (LNG), syngas, and methanol. This process incorporates the Allam–Fetvedt cycle, an electrolyzers’ system, an air separation unit (ASU), an LNG production unit, and a methanol synthesis unit.
In the Allam–Fetvedt cycle, natural gas and oxygen serve as the input streams, while carbon dioxide and water are generated as by-products. This advanced power generation system employs supercritical CO2 as a working fluid within a closed-loop gas turbine, maximizing efficiency and lowering emissions. The electricity produced in this cycle is utilized to power different sections of the integrated process, optimizing overall energy use. Furthermore, CO2 emissions and water from the cycle are captured and redirected to electrolyzers for further conversion, contributing to reduced carbon emissions and enhanced sustainability.
The adoption of carbon capture and storage (CCS) technology in the power sector is essential for reducing CO
2 emissions from fossil fuel sources. Oxy-fuel combustion is recognized as one of the most effective methods for addressing emissions in fossil fuel-fired power plants due to its inherent carbon capture capability. In this process, fuel is combusted with high-purity oxygen under near-stoichiometric conditions, with a portion of the flue gas—mainly steam and CO
2—being recirculated to control combustion temperature. This setup allows for the efficient separation of CO
2. When oxy-fuel combustion is applied to gaseous fuels such as natural gas or syngas, the system is referred to as an “oxy-turbine”. Over time, various oxy-turbine cycle designs have been proposed, which can be categorized based on their working fluids: (1) CO
2 is used as the working fluid in cycles such as the semi-closed oxy-fuel combustion combined cycle (SCOC-CC), the MATIAN cycle, and the Allam cycle (also known as the NET Power cycle). (2) Water is used as the working fluid in cycles like the Graz cycle and the Clean Energy System (CES) [
20].
Barba et al. [
21] conducted a comparative study of six oxy-turbine cycles, including the Allam cycle, CES cycle, modified S-Graz cycle, E-MATIANT cycle, AZEP cycle, and SCOC-CC cycle. Their analysis evaluated these cycles from multiple perspectives, including political, environmental, social, technological, legislative, and economic factors. The findings highlighted the Allam cycle as the most efficient and promising oxy-fuel combustion cycle. Similarly, Sifat and Haseli [
22] reviewed various carbon capture and storage (CCS) technologies applicable to power plants, assessing oxy-fuel combustion alongside post-combustion, pre-combustion carbon capture methods, and chemical looping combustion. Their study revealed that, despite the high energy demand of the air separation unit (ASU), the Allam cycle remains a viable CCS technology due to its inherent carbon capture capability and high efficiency. Additionally, Rogalev et al. [
23] conducted a thermodynamic evaluation comparing the SCOC-CC, E-MATIANT, and Allam cycles. Their results indicated that the Allam cycle demonstrated superior energy efficiency, outperforming the SCOC-CC, E-MATIANT, and a conventional combined cycle with CCS by 8.5%, 8.8%, and 12.5%, respectively.
Despite its high efficiency and inherent carbon capture capability, the Allam–Fetvedt cycle presents several technical and operational challenges that must be addressed for large-scale deployment. One of the most significant issues is the high energy demand of the air separation unit (ASU), which is required to provide high-purity oxygen for oxy-combustion. The ASU can consume up to 10–15% of the total plant energy, thereby reducing the net power output and affecting the overall efficiency of the cycle [
20,
21]. Additionally, the cycle requires the continuous recycling of supercritical CO
2 at high pressures, which imposes strict material and mechanical requirements on compressors, pumps, and piping systems. The design and maintenance of high-pressure, high-temperature heat exchangers are also complex due to the dense and corrosive nature of supercritical CO
2 [
20,
22]. Moreover, the operation of the combustor with pure oxygen poses flame stability and thermal control challenges, necessitating the use of recirculated CO
2 for temperature moderation. Even so, maintaining stable oxy-combustion under dynamic load conditions is difficult, making start-up and transient operations more complicated compared to conventional gas turbines [
22]. Another critical challenge lies in the limited availability of commercial supercritical carbon dioxide turbines and high-temperature alloys capable of withstanding the extreme operational conditions, which increases capital costs and restricts scalability [
21,
23]. Furthermore, the integration of the Allam–Fetvedt cycle with other subsystems such as electrolyzers and DME synthesis demands precise process control and synchronization to optimize heat and mass flows while minimizing exergy losses. Although pilot projects have demonstrated the feasibility of this technology, further advancements in materials, component standardization, and dynamic process modeling are essential to overcome these limitations and facilitate widespread adoption [
20,
21,
22,
23].
The electrolyzer system is essential for transforming H
2O and CO
2 into hydrogen and syngas. By utilizing electricity, the system decomposes water into hydrogen (H
2) and oxygen (O
2) while simultaneously reducing CO
2 to carbon monoxide (CO) and O
2. This process generates syngas, a blend of CO and H
2, which acts as a crucial feedstock for the subsequent production of methanol. Over the course of water electrolysis technology development, four primary types have emerged, categorized based on their electrolyte composition, operating conditions, and ionic charge carriers (OH
−, H
+, O
2−): (i) Alkaline electrolysis, (ii) Anion Exchange Membrane (AEM) electrolysis, (iii) Proton Exchange Membrane (PEM) electrolysis, and (iv) Solid Oxide (SO) electrolysis. Despite their distinct characteristics, all these technologies operate on the same fundamental principle. The choice of electrolysis method depends on factors such as operating conditions, cost-effectiveness, scalability, compatibility with renewable energy sources, and the required hydrogen purity. Among these, PEM, AEM, and SO electrolyzers are particularly noteworthy [
23,
24].
High-temperature SO electrolyzers offer distinct advantages over conventional low-temperature electrolyzers, making them a promising option for large-scale hydrogen production. These advantages include greater energy efficiency, the ability to utilize industrial waste heat, co-electrolysis of CO
2 and H
2O for syngas production, enhanced durability, and better integration with the electrical grid for load balancing [
25].
Compared to alkaline and PEM electrolyzers, SO electrolyzers require less electrical energy, as they harness thermal energy to drive the endothermic water-splitting reaction. This enables them to achieve energy efficiencies exceeding 85%, significantly lowering electricity consumption. Additionally, industrial sectors such as power generation, steel production, and chemical manufacturing generate high-temperature waste heat, which can be repurposed to enhance the efficiency and sustainability of SO electrolysis. Furthermore, SO electrolyzers are capable of co-electrolyzing H
2O and CO
2 to produce syngas (CO + H
2), a vital feedstock for synthetic fuel, methanol, and DME production. This capability aligns with carbon capture and utilization (CCU) strategies, promoting a circular carbon economy [
25,
26].
SO electrolyzers are commonly structured as stacked cell systems, where numerous electrolyzer cells are connected in series or parallel to attain the required hydrogen production rate. The total number of cells in a stack is determined by factors such as power input, hydrogen output capacity, and overall system design specifications. To optimize hydrogen production, these electrolyzers incorporate hundreds to thousands of individual cells. In large-scale industrial applications, the number of cells in a stack can range from several hundred to more than a thousand [
25].
For CO2 and H2O co-electrolysis in SO electrolyzers, general electrochemical reactions:
The energy demand for co-electrolysis is dictated by the Gibbs free energy change (ΔG) and enthalpy (ΔH) of the reaction. However, in real-world applications, additional energy is required due to irreversible losses, including activation, ohmic, and concentration overpotentials. In practical SO co-electrolyzer systems, the energy consumption typically falls within the range of 5.5 to 6.2 kWh per normal cubic meter (Nm
3) of syngas, with overall efficiency varying between 70% and 85% [
27].
The methanol production unit processes syngas (from electrolyzers) to synthesize methanol. Methanol is produced from syngas (CO + H2) over a Cu-ZnO-Al2O3 catalyst at moderate pressures (20–30 bar) and temperatures (200–300 °C).
An Air Separation Unit (ASU) is an industrial system that extracts the primary components of atmospheric air—oxygen (O
2), nitrogen (N
2), and argon (Ar)—using cryogenic distillation or alternative separation methods. ASUs are essential in various sectors, including power generation, chemical processing, metallurgy, and medical applications. They play a crucial role in energy and power systems, particularly in oxy-fuel combustion and gasification-based power plants, where oxygen-enriched combustion enhances efficiency, such as in Integrated Gasification Combined Cycle (IGCC) and the Allam–Fetvedt cycle. In these applications, ASUs supply oxygen to both the Allam–Fetvedt cycle and electrolyzers, while nitrogen can be utilized for other industrial purposes. Depending on the required purity and application, different separation techniques are employed, including cryogenic distillation, pressure swing adsorption (PSA), and membrane separation. Among these, cryogenic air separation is the most widely used, operating at extremely low temperatures (−180 °C to −200 °C) to liquefy air and separate gases based on their distinct boiling points. This method produces high-purity oxygen and nitrogen (99.9%+), making it ideal for large-scale industrial applications [
28].
The liquefaction of natural gas (LNG) is a critical step in its transportation, enabling efficient shipment to consumers worldwide. This process is highly energy-intensive and involves cooling natural gas to approximately −162 °C, which reduces its volume by around 600 times, making long-distance transport economically viable. Prior to liquefaction, natural gas undergoes purification to remove impurities such as carbon dioxide, hydrogen sulfide, and water, ensuring that the final product consists mainly of methane with small amounts of hydrocarbons like ethane. The gas is then processed in a natural gas liquids (NGL) recovery unit to eliminate heavier hydrocarbons, producing lean gas [
29].
Different liquefaction processes employ various refrigeration cycles, with key methods classified into three main categories: (1) Cascade liquefaction processes, (2) Mixed refrigerant processes, and (3) Expansion-based processes. Among these, the modern C3MR (propane pre-cooled mixed refrigerant) technology is widely used in LNG industries due to its high efficiency. The C3MR process integrates propane-based pre-cooling with a mixed refrigerant (MR) system for liquefaction and subcooling. In the pre-cooling stage, the treated natural gas is cooled to −30 °C to −40 °C. During liquefaction, the temperature drops further to −120 °C to −135 °C. Finally, in the subcooling stage, the gas reaches −161 °C within a cryogenic heat exchanger. C3MR technology falls under the category of dual mixed refrigerant (DMR) systems, which are widely adopted due to their superior efficiency and ability to closely match the natural gas cooling curve with the boiling curve of the refrigerant. This alignment enhances process efficiency and makes C3MR one of the preferred liquefaction technologies in the LNG industry [
29,
30].
3. Aspen HYSYS Simulations
After delineating the features, the simulation is executed using ASPEN HYSYS V12 software. The fluid package is chosen according to the process specifications. The thermodynamic properties are determined using the Peng-Robinson equation of state (EOS). As can be seen in
Table 1, the mole fractions of impurities in the LNG stream are kept very low in this analysis to reflect typical product specifications in commercial LNG production. In practice, even small concentrations of these impurities can affect the efficiency of liquefaction and downstream processes. To mitigate these effects, large-scale LNG facilities employ a series of gas treatment units including acid gas removal systems, dehydration units, nitrogen rejection units, and heavy hydrocarbon removal columns. This ensures compliance with LNG quality standards and enhances overall process performance.
As can be seen the
Figure 2, The LNG process consists of one input and four output streams. The mole fractions of impurities such as N
2 and C
2H
6 in the LNG stream are kept very low in this analysis to reflect typical product specifications in commercial LNG production. In practice, even small concentrations of these impurities can affect the efficiency of liquefaction and downstream processes. To mitigate these effects, large-scale LNG facilities employ a series of gas treatment units—including acid gas removal systems, dehydration units, nitrogen rejection units (NRUs), and heavy hydrocarbon removal columns—to reduce these impurities to acceptable levels before liquefaction. This ensures compliance with LNG quality standards and enhances overall process performance. The natural gas (NG) stream is initially cooled using a pure propane stream in a shell and tube heat exchanger. After cooling, the gas undergoes dehydration to remove water, a crucial step that prevents the formation of hydrates, which are corrosive to pipelines and contribute to fouling. Once dehydrated, the stream is further cooled with propane before being directed to the fractionation unit, where heavy hydrocarbons are separated from light natural gas.
The light natural gas is then cooled again with propane before undergoing nitrogen rejection distillation to eliminate nitrogen. Following this, the gas proceeds to the liquefaction and sub-cooling stages, which take place in two multi-stream heat exchangers arranged in series, resulting in the final LNG product. The liquefaction and sub-cooling of NG are achieved using mixed refrigerant (MR) streams. To maintain the necessary temperature and pressure conditions for MR in these stages, the recycled MR stream is directed through a series of compressors and coolers (represented as MR 11 to MR 1), before being sent to heat exchangers for cooling via pure propane streams. Similarly, the recycled propane stream is compressed and cooled to achieve optimal conditions for cooling, as indicated by P1 to P5. Both propane (C3) and mixed refrigerant (MR) are continuously recycled within the process to enhance efficiency. Phase separators for propane ensure that streams of the same or nearly identical phases are mixed appropriately during different stages of the process.
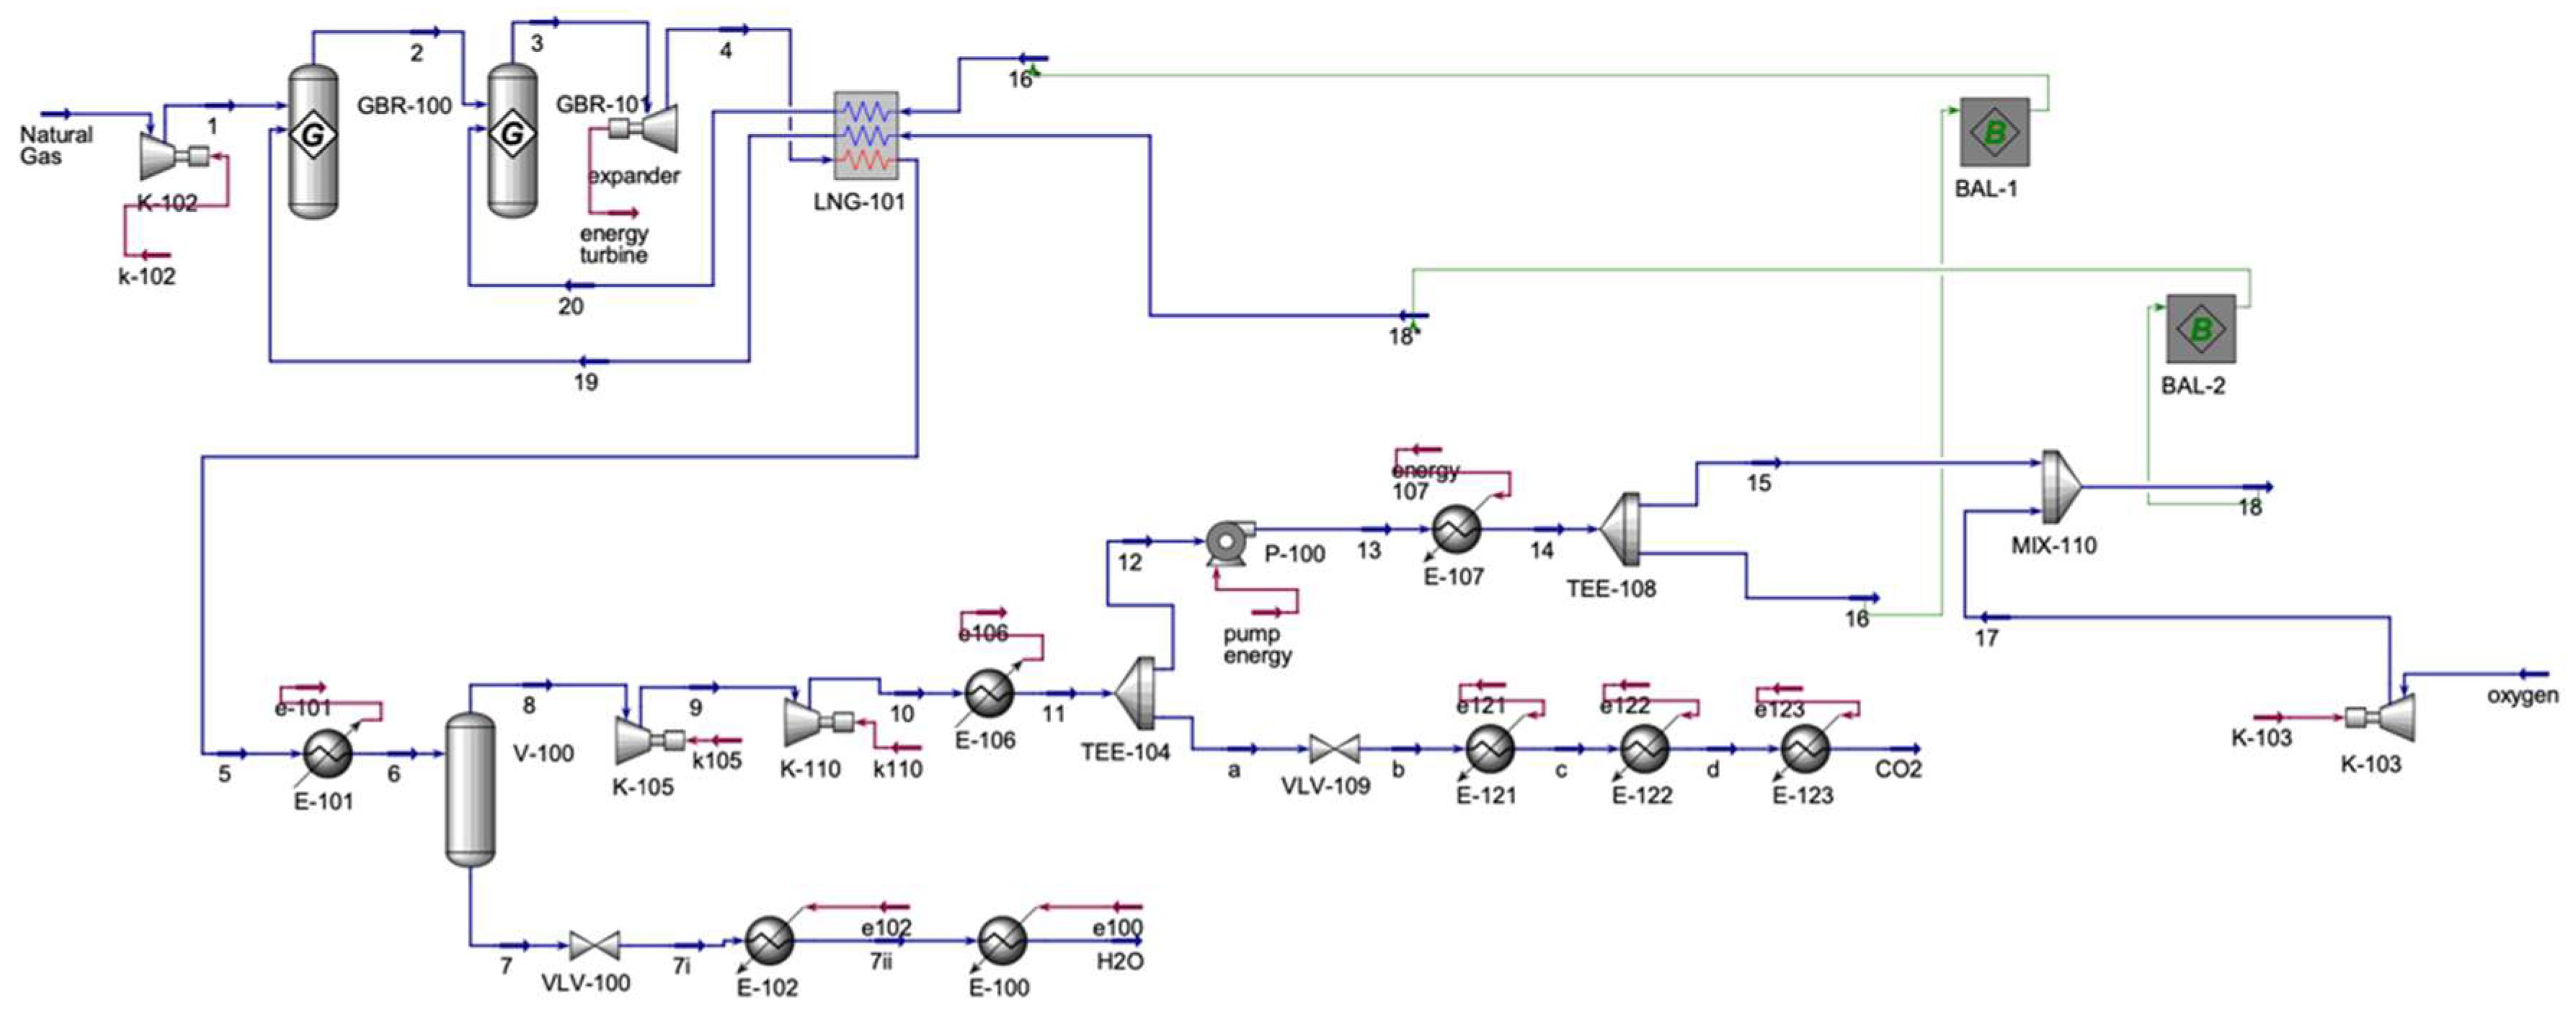
The Allam-Fetvedt cycle power generation simulation (
Figure 3) involves two primary inputs and two outputs. Initially, natural gas undergoes compression before entering two Gibbs reactors. The Gibbs reactor model in Aspen HYSYS is particularly well-suited for simulating combustion reactions, such as the oxidation of methane in the Allam–Fetvedt cycle. This reactor type uses the Gibbs free energy minimization principle to estimate the equilibrium composition of products from a given set of reactants, rather than predefined stoichiometric processes or kinetic expressions. Methane combustion in high-efficiency cycles (such as Allam-Fetvedt) takes place at elevated temperatures and pressures, when equilibrium conditions prevail. The Gibbs reactor calculates the final concentrations of all possible products (e.g., CO
2, H
2O, CO, H
2, O
2, N
2) by minimizing the system’s total Gibbs free energy. This accurately captures the thermodynamic constraints of conversion. Because the reaction occurs at extremely high temperatures and is completed quickly, the system approaches chemical equilibrium. In such circumstances, kinetic restrictions are negligible, therefore specific rate representations are unneeded. Thus, a Gibbs reactor is preferable than a kinetic reactor when the reaction mechanism or rate data is absent or not rate-limited. Multiple reactions can occur at the same time in a genuine combustion process. The Gibbs reactor handles multi-component and multi-reaction systems fluidly, eliminating the need to specify each reaction, making it perfect for modeling complex combustion settings. The Allam–Fetvedt cycle involves oxy-fuel combustion (CH
4 + O
2) and generates CO
2 and H
2O under controlled stoichiometry. The Gibbs reactor can easily incorporate these operating conditions, including excess O
2, recirculated CO
2, and high-pressure operation, providing accurate equilibrium predictions under non-standard air/fuel ratios. Following this, the stream is directed into an expander, which functions as the turbine for power generation. After expansion, the stream is cooled in a multi-stream heat exchanger—also referred to as an LNG heat exchanger in Aspen HYSYS—before undergoing further cooling. In Aspen HYSYS, an LNG heat exchanger is a specialized heat exchanger unit used to simulate the thermal exchange between multiple hot and cold fluid streams in a single unit operation. It is designed to handle complex heat integration systems, such as those typically found in LNG liquefaction plants, where multiple stages of cooling and reheating occur. It then passes through a separator, where water is removed from the stream. The separated water stream experiences a pressure drop via a valve and is subsequently heated in two sequential heaters until it transitions to the vapor phase. Meanwhile, the remaining stream from the separator, primarily composed of carbon dioxide, is compressed using two compressors in series and then cooled before being split. A portion of this carbon dioxide stream is extracted as an output, while the remaining fraction is recycled within the process. The recycled CO
2 is directed to a pump, heated, and then divided into two streams. One portion (stream 16) is sent to the multi-stream heat exchanger, while the other (stream 15) is combined with compressed oxygen (stream 17). The resulting mixed stream (stream 18) is also routed to the heat exchanger. Finally, the heat exchanger’s outlet streams (streams 19 and 20) serve as inlets to the first and second Gibbs reactors, respectively.
Table 2 represents the main inlet and outlet streams of Allam–Fetvedt cycle unit.
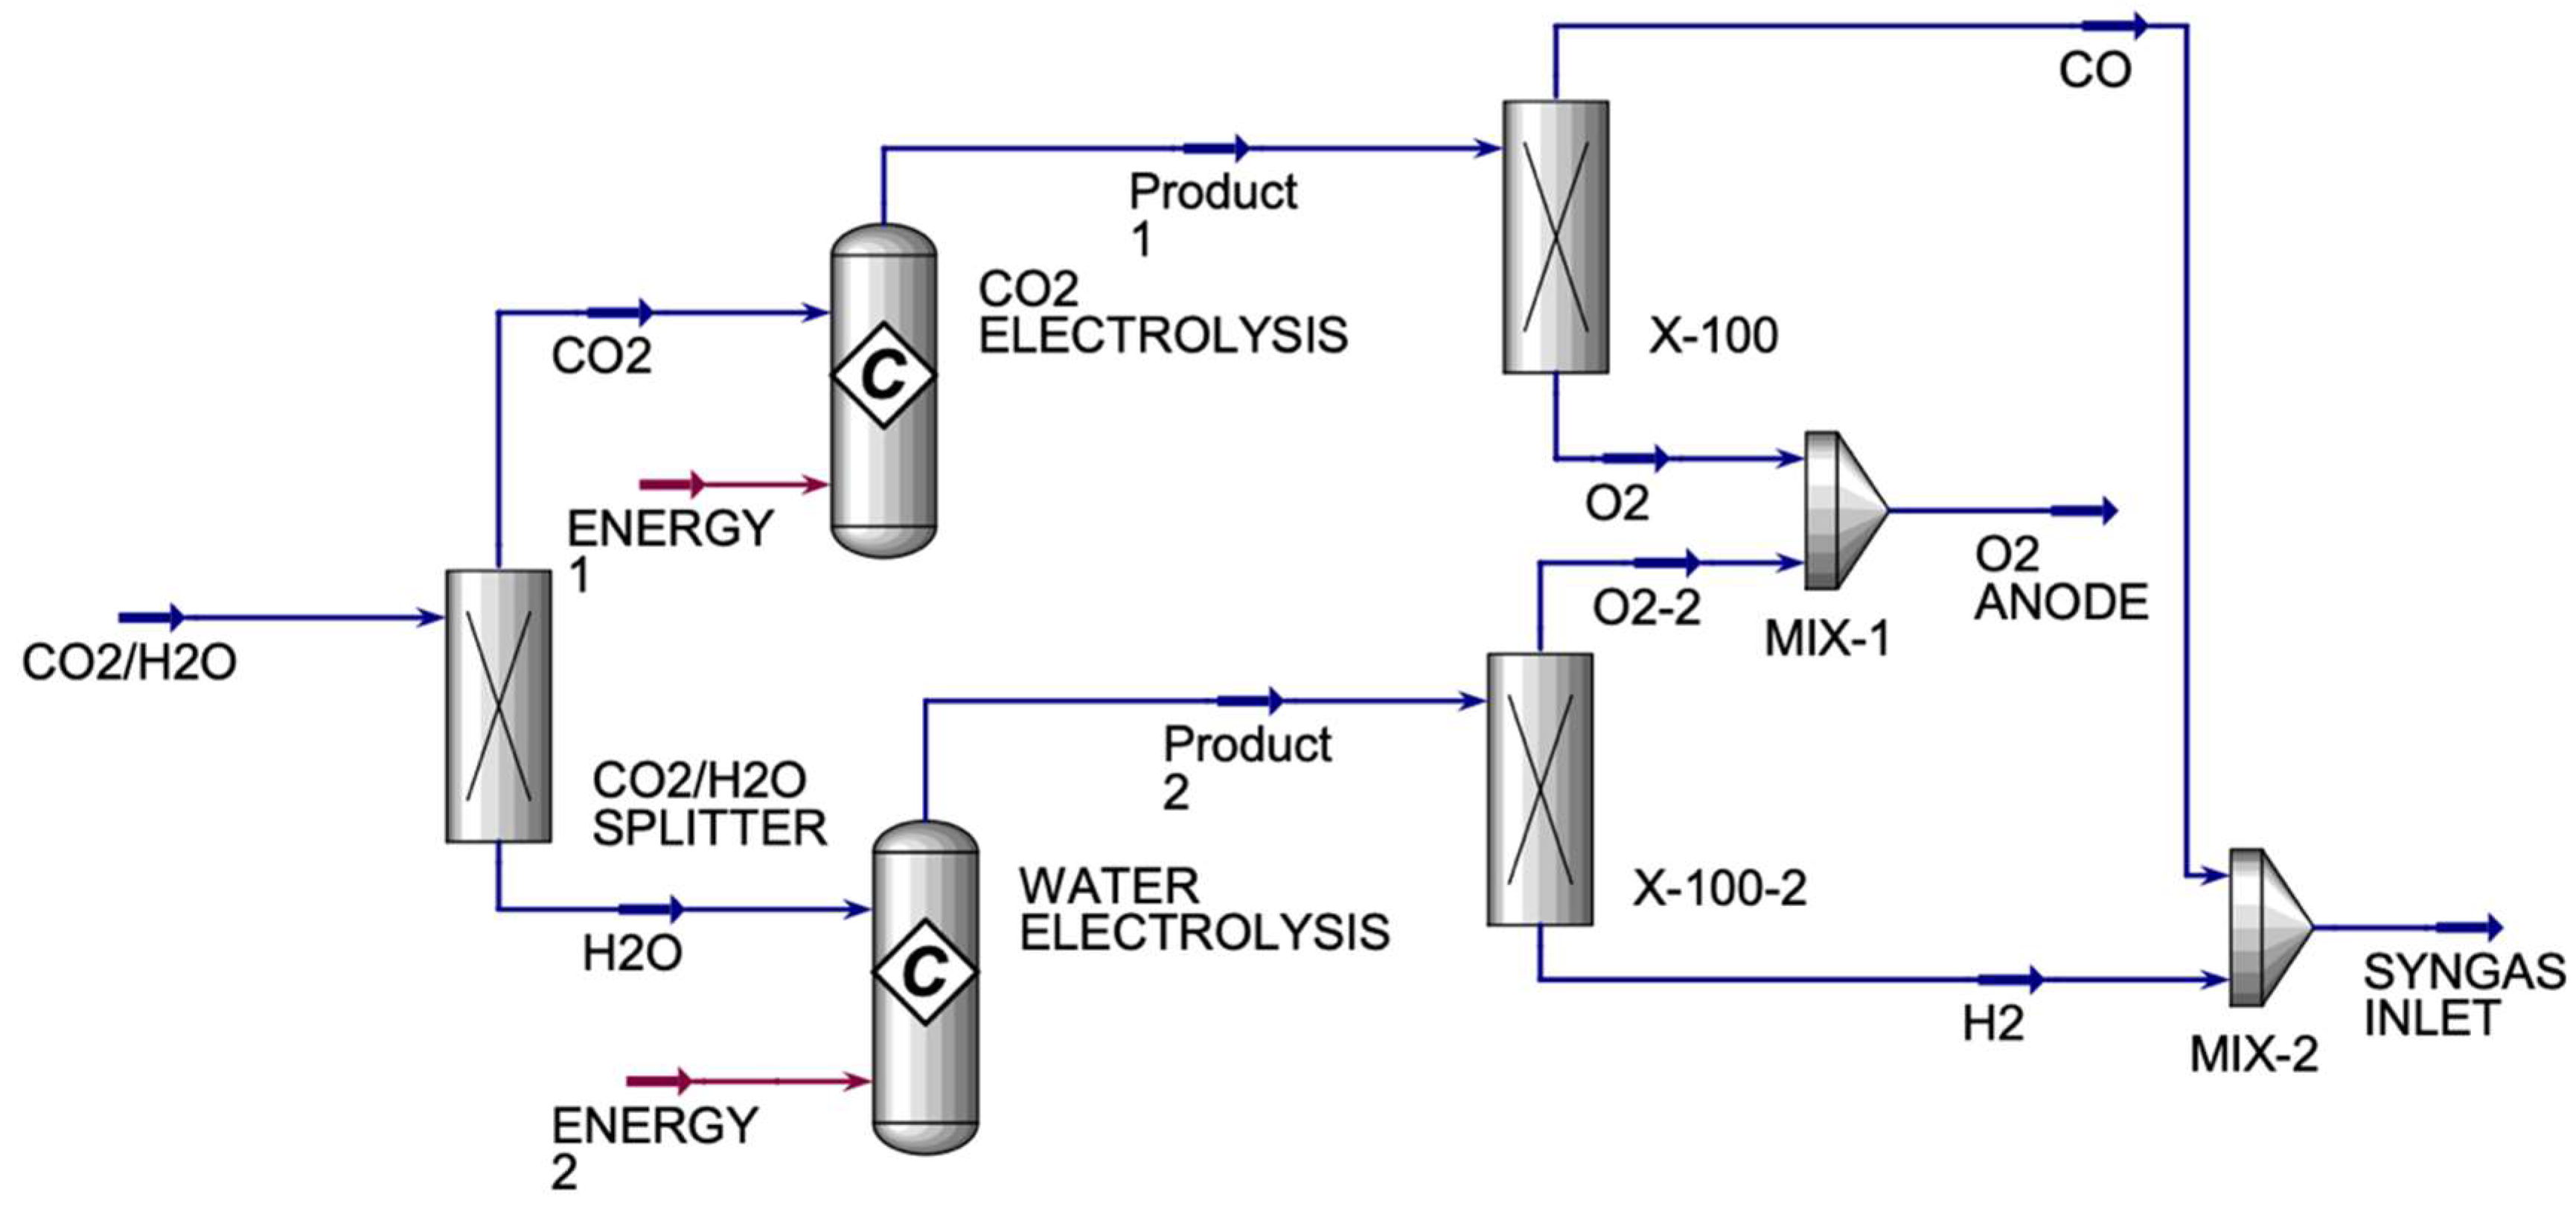
The CO
2/H
2O electrolyzer (
Figure 4) has one inlet and two exit streams. The CO
2/H
2O electrolyzer’s incoming stream is made up of CO
2 and H
2O streams that are divided into a component splitter to produce pure CO
2 and H
2O streams. Each pure stream enters a conversion reactor. The CO
2 conversion reactor generates a product stream of CO and O
2, which is divided in a component splitter to create pure CO and O
2 streams. The X-100 and X-100-2 are component splitters that are used to split the components into desired fractions between the two streams. They are used because the product streams from both conversion reactors will have oxygen in them, which is not wanted in the SYNGAS stream. Therefore, X-100 is used to split the oxygen completely from carbon monoxide, where oxygen will be sent to MIX-1 and the carbon monoxide will be sent to MIX-2. X-100-2 is used to split the oxygen completely from hydrogen, where oxygen will be sent to MIX-1 to be mixed with the oxygen from X-100 and hydrogen will be sent to MIX-2 to be mixed with carbon monoxide from X-100 to form SYNGAS. Under optimal operating conditions, SOEs can deliver hydrogen purity levels of 99.9% or higher, assuming good sealing and system integrity. So, in this study, we achieved a hydrogen purity of approximately 100%.
Table 3 displays the main inlet and outlet streams for the HO and CO co-electrolyzers.
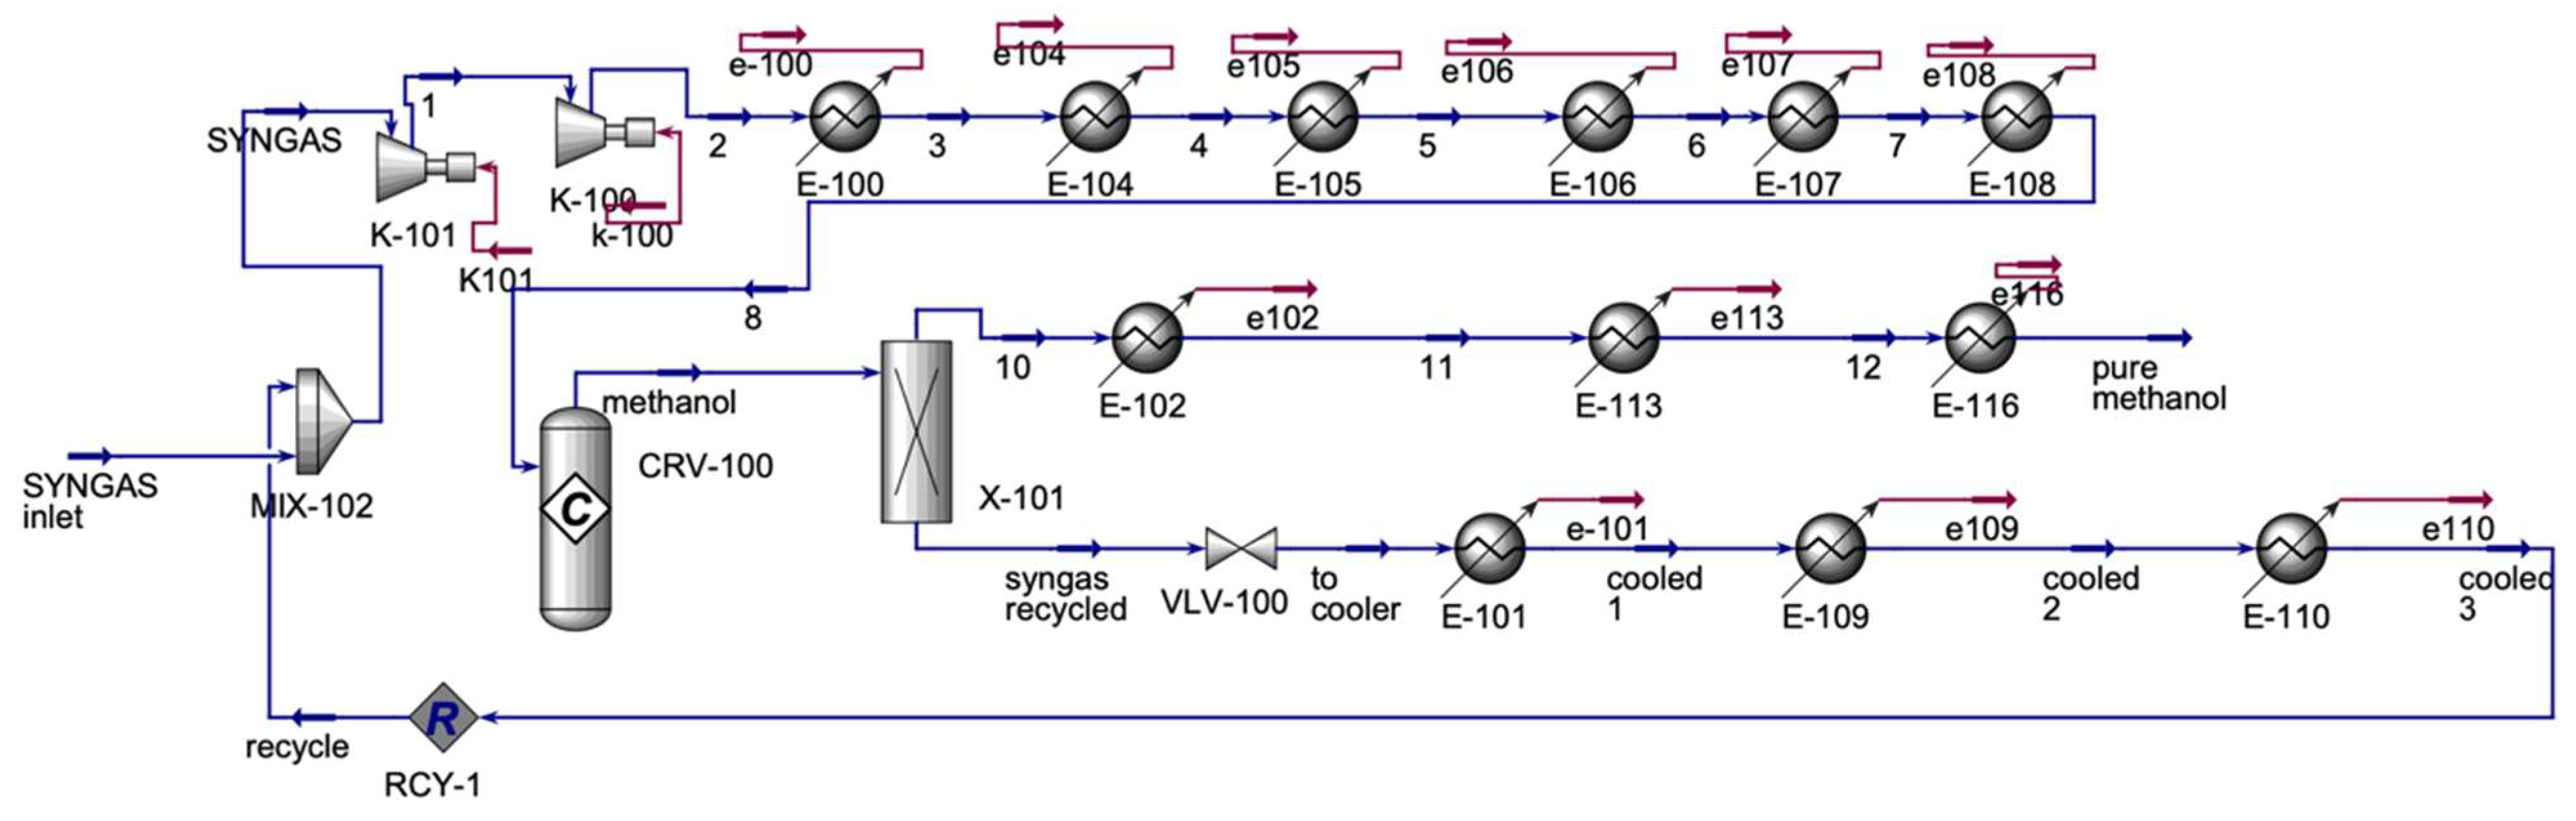
As can be seen the
Figure 5, Syngas from the CO
2/H
2O electrolyzer is mixed with the recycled syngas from the methanol process. The mixed stream is compressed in two compressors in series, then the stream is allowed to cool in coolers in series. The cooled stream enters the methanol conversion reactor (
Table 4). A component splitter is placed to separate the methanol stream from unreacted syngas. The unreacted syngas is the recycled stream that the syngas from the CO
2/H
2O electrolyzer gets mixed with. In this study, for electrolyzer, we selected 300 °C operating temperature based on recent developments in intermediate-temperature solid oxide electrolyzers (IT-SOECs). IT-SOECs are an emerging class of electrochemical devices designed to operate at reduced temperatures, typically between 300 °C and 600 °C, compared to conventional high-temperature SOECs (700–850 °C). Lowering the operating temperature helps address key challenges associated with traditional SOECs, including material degradation, sealing failures, and thermal expansion mismatches. IT-SOECs also enable the use of alternative materials with improved mechanical and chemical stability and can potentially reduce system costs by simplifying insulation and balance-of-plant requirements. Therefore, the choice of 300 °C in this study aligns with ongoing research efforts toward making solid oxide electrolysis more durable, efficient, and economically viable for commercial applications [
31,
32,
33,
34].
The ASU process (
Figure 6) consists of a single inlet stream and three output streams. The incoming compressed air is first cooled before being split into multiple streams, each entering multi-stream heat exchangers LNG-103 and LNG-104. In LNG-103, the output stream (5) is divided into two parts: stream 6 undergoes compression and cooling before re-entering LNG-103, while stream 7 is compressed and cooled through a series of coolers before being fed back into LNG-103. The booster heat exchanger (LNG-103) is placed downstream of the booster compressor and is designed to cool the boosted air to near-cryogenic temperatures before it enters the expander or distillation column. Its purposes include pre-cooling high-pressure air, facilitating air liquefaction, recovering cold energy, and reducing external cooling demand. On the other hand, the booster compressor in an ASU is used to increase the pressure of a portion of the already compressed and purified feed air before it enters the cryogenic section (especially the cold box and heat exchangers). Its purposes include enhancing cooling efficiency, supporting distillation, enabling expansion for refrigeration, and optimizing process integration. Basically, the booster compressor and booster heat exchanger work together to increase the energy of the incoming air, cool it down to very low temperatures, help separate oxygen, nitrogen, and argon in the distillation columns, and allow for energy-saving connections with other units. The outputs from LNG-103 (streams 10 and 15), along with a split portion of stream 4, serve as inputs to LNG-104. Stream 11, an output from LNG-104, passes through a valve to reduce pressure before entering an absorber, along with stream 18, another LNG-104 output. The absorber produces four output streams: stream 19 is redirected into LNG-104, while streams 21, 24, and 27 serve as inputs to LNG-105. Meanwhile, another output from LNG-104, stream 16, is compressed and directed into a distillation column (T-100). In LNG-105, stream 28 is cooled and directed through a valve to lower pressure before being split, heated, and recombined as stream 35, which enters T-100. Additionally, streams 22 and 25 pass through a valve before entering T-100. The distillation column T-100 produces two output streams: stream 37, which re-enters LNG-105, forming stream 38*, which is recycled to LNG-104, and stream 36, which is directed to the final distillation column (T-101). In T-101, stream 36 is separated into argon (Ar) and oxygen (O
2), while in LNG-104, streams 39 and 20 mix after passing through a valve to form a nitrogen (N
2) stream.
Table 5 illustrates the main inlet and outlet streams of ASU.
The main equations used to calculate the outcomes in this study are as follows.
The general mass balance equation for any process equipment is
where
and
are mass flow rates in and out of the streams
i and
j (kg/h),
m and
n represent the total number of the streams for each process equipment, and
E represents any process equipment such as compressor, distillation coulums, heat exchangers, etc.
The general mass balance equation for any process unit is
where
and
are mass flow rates in and out of the streams
k and
l (kg/h),
p and
r represent the total number of the streams for each process unit, and
U represents any process unit such as ASU, LNG liquefication, etc.
The general mass balance equation for a component
c in any process equipment is given by:
where
and
are mass flow rates in and out of component
c in the equipment
E (kg/h);
is reacted or produced component
c in the equipment
E.
C is the total number of components in the process.
The general mass balance equation for a component
c in any process unit is given by:
where
and
are mass flow rates in and out of component
c in the any unit
U (kg/h);
is reacted or produced component
c in the any unit
U.
The general energy balance equation for any process equipment is
where
and
are enthalpy flow rates in and out of streams
i and
j (kg/h);
m and
n represent the total number of the streams for each process equipment;
E represents any process equipment such as compressor, distillation coulums, heat exchangers, etc;
and
are heat and shaft work (kJ/h).
The CO
2 looping ratio in the Allam–Fetvedt cycle refers to the fraction of CO
2 that is recycled within the cycle rather than vented or captured for storage or utilization. In the Allam-Fetvedt cycle, a high looping ratio is required. The majority of CO
2 produced during combustion is cooled, compressed, and recycled back into the combustor alongside oxygen and fuel. Only a small percentage of CO
2 is purged for sequestration or utilization. This recycled CO
2 is used as the working fluid in a turbine to generate power. The looping ratio is typically 95–98%, implying that only 2–5% of CO
2 is removed as a pure stream for sequestration. This is much higher than conventional CO
2 capture cycles, which aim to capture only the CO
2 after combustion, with an average capture efficiency of 85–90%. The CO
2 looping ratio of the Allam–Fetvedt cycle is calculated by the equation below [
20,
21]:
where
and
are mass of CO
2 reused in the cycle (kg/h) and total CO
2 generated from combustion (kg/h).
The energy balance of the Allam–Fetvedt cycle plays a critical role in its superior performance compared to conventional power cycles with carbon capture. The cycle uses natural gas and pure oxygen for oxy-combustion. The combustion products are primarily CO
2 and H
2O, eliminating nitrogen-related emissions like NO
x. The Allam–Fetvedt cycle energy balance is given by the equation [
35]:
where
is mass flow rate of natural gas fuel (kg/h); LHV is lower heating value of fuel (kJ/kg);
is net electrical power output (kJ/h or MW);
is total thermal/mechanical losses (kJ/h);
heat input (kJ/h). In the Allam–Fetvedt cycle,
is often zero (no extenal heating) and
is minimized through thermal integration. The energy released from fuel combustion is calculated as
. Net power output of the cycle is [
35]:
A gas turbine converts a high-pressure CO2-H2O mixture into mechanical work, . represents the amount of energy consumed during the cycle by equipment such as compressors.
The Allam–Fetvedt cycle efficiency is given by the equation [
35]:
SOE efficiency is given by the equation [
36]:
where
is enthalpy change of the reaction (kJ/mol).
Finally, the methanol energy intensity is calculated by the equation:
where
is energy consumption per kg of methanol (kJ/kg).
4. Results and Discussion
Advancing innovative technologies or improving existing processes in accordance with sustainability standards, while integrating alternative products such as methanol, is essential for generating clean and economical energy and chemicals, while tackling economic and energy-related issues. Nonetheless, attaining sustainable industrial processes continues to pose a significant global issue for the chemical sector. Incorporating sustainability concepts into process design is crucial for surmounting this challenge by reducing or eradicating negative environmental impacts. Methodological sustainability assessment functions as an essential instrument across several process scales, allowing designers to execute a thorough performance review. Essential sustainability indicators encompass economic viability, energy efficiency, environmental effect, and material consumption, all critical for evaluating overall sustainable performance. The following section will summarize the key findings of this study regarding the material, energy, and especially the environmental sustainability assessment of the proposed integrated process.
The data shown in
Table 1,
Table 2,
Table 3,
Table 4,
Table 5 and
Table 6 demonstrate that the proposed integrated process efficiently employs diverse feedstocks, such as natural gas, air, and water, to optimize the co-production of power, hydrogen, methanol, and LNG. The efficiency of material use within the system can be assessed by analyzing the input and output streams of each segment.
Table 6 illustrates the summary of the material flow efficiency in the proposed integrated design.
The CO2 looping ratio in the Allam-Fetvedt cycle is a key parameter that indicates the proportion of CO2 recycled within the system relative to the amount emitted or utilized in downstream applications. As a closed-loop supercritical CO2 power cycle, a substantial fraction of the CO2 remains in circulation, with a controlled portion extracted for external use. Ideally, the looping ratio would be close to 1 (100%), signifying complete CO2 recirculation. However, in practical implementations, the ratio typically ranges between 0.9 and 0.98 due to minor losses from leakage, purging, and system inefficiencies.
In this study (
Table 1), a looping ratio of 0.96 was achieved, with 1,890,032.4 metric tons per year (MTPA) of CO
2 (over 330 days of plant operation) extracted for further processing.
Table 3 shows that when H
2O and CO
2 are electrochemically broken down together, a single cell uses 759 MTPA of CO
2 and 620.8 MTPA of H
2O to make 69 MTPA of H
2, 483 MTPA of CO, and 827.7 MTPA of O
2. To utilize all captured CO
2, 2490 cells are required. A total of 2490 cells contribute to the production of 130,893 MT of hydrogen per year and 1,376,096.3 MT of methanol annually (as shown in
Table 4). Additionally, as indicated in
Table 1, the integrated process also yields 3,605,001 MTPA of LNG. Methanol production facilities vary in capacity, ranging from small-scale plants to large industrial complexes. Large-scale facilities can produce between 1,000,000 to 3,000,000 metric tons of methanol per year. LNG production capacities also vary depending on the scale of the facility. Small-scale LNG plants typically produce less than 1 million metric tons per year (MTPA), while mid-scale facilities range between 1 to 5 million MTPA. Large-scale LNG terminals can produce over 5 million MTPA, with some mega facilities exceeding 20 MTPA.
Figure 7 depicts the material flow along the integrated process.
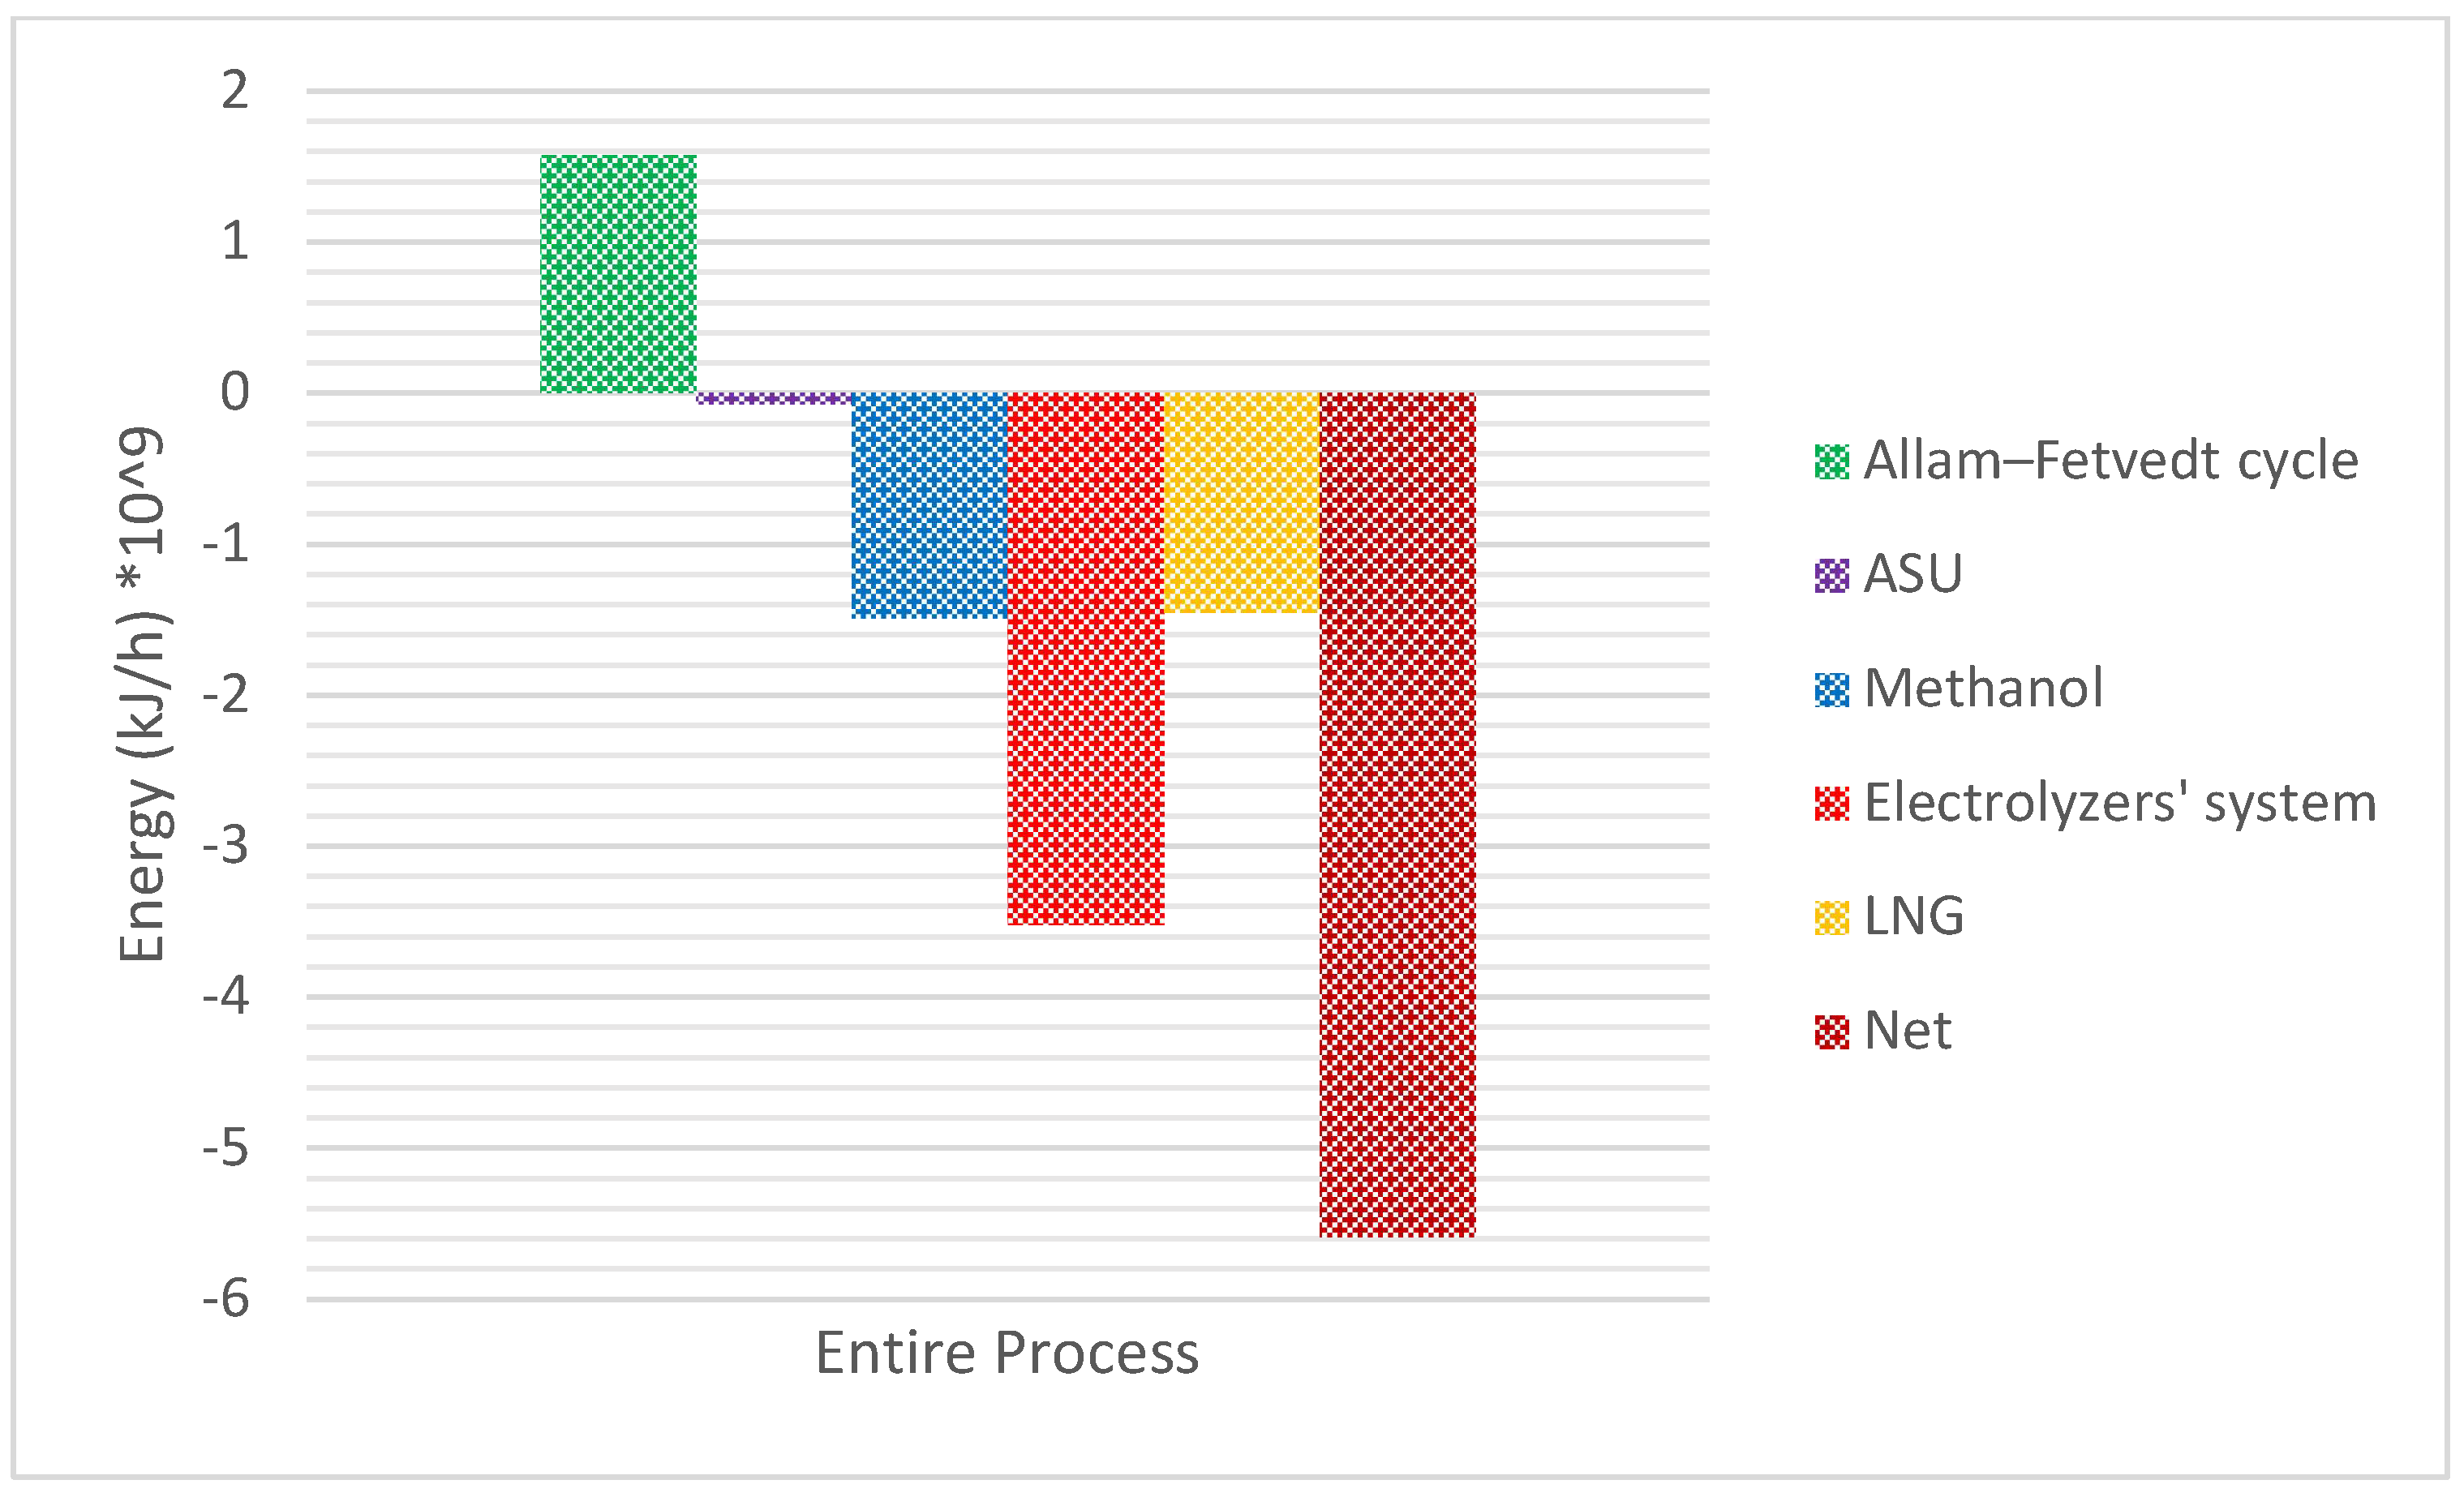
The Allam-Fetvedt cycle delivers efficiency levels that match or surpass those of conventional combined cycle gas turbines (CCGTs) while incorporating CO2 capture without additional energy loss. Its high efficiency and built-in carbon capture make it a promising technology for net-zero power generation. Theoretical efficiency ranges from 59% to 61%, while practical efficiency falls between 55% and 57%. In this study, the cycle’s total and net power outputs are reported as 795 MW (2.862 × 10⁹ kJ/h) and 437 MW (1.5732 × 10⁹ kJ/h), respectively, with an overall efficiency of 55%.
Heat integration is a crucial strategy in process engineering that enhances energy efficiency by maximizing the reuse of thermal energy within a system. One of the primary benefits of heat integration is energy savings. By transferring heat from hot process streams to cold streams, the need for external heating and cooling utilities, such as fuel-fired heaters or refrigeration systems, is minimized. This leads to significant reductions in fuel consumption, operating costs, and greenhouse gas emissions. Additionally, heat integration improves process efficiency and sustainability. Industries such as chemical processing, power generation, and LNG production rely on energy-intensive operations. Implementing heat exchangers, heat recovery steam generators, and pinch analysis techniques ensure optimal heat utilization, lowering energy losses and increasing overall system performance. Moreover, heat integration contributes to cost reduction and economic viability. By lowering fuel and utility costs, industries can enhance profitability while complying with stricter environmental regulations. This makes heat integration a key approach for industries aiming to achieve carbon neutrality and sustainable energy management.
Figure 8 illustrates the utility consumption of the overall process following heat integration and optimization. In the simulation of H
2O and CO
2 co-electrolysis, the energy demand for a single cell is 1.855 × 10
6 kJ/h, while the total electrolyzer system requires 4.14 × 10
9 kJ/h. With a cell efficiency of 85%, this accounts for 57.8% of the total energy consumption in the process.
Figure 8 indicates that the net energy demand of the process is 5.59 × 10
9 kJ/h. Although the electrolyzer system has a high energy consumption, the overall net energy requirement of the proposed integrated process remains competitive compared to conventional high-emission processes.
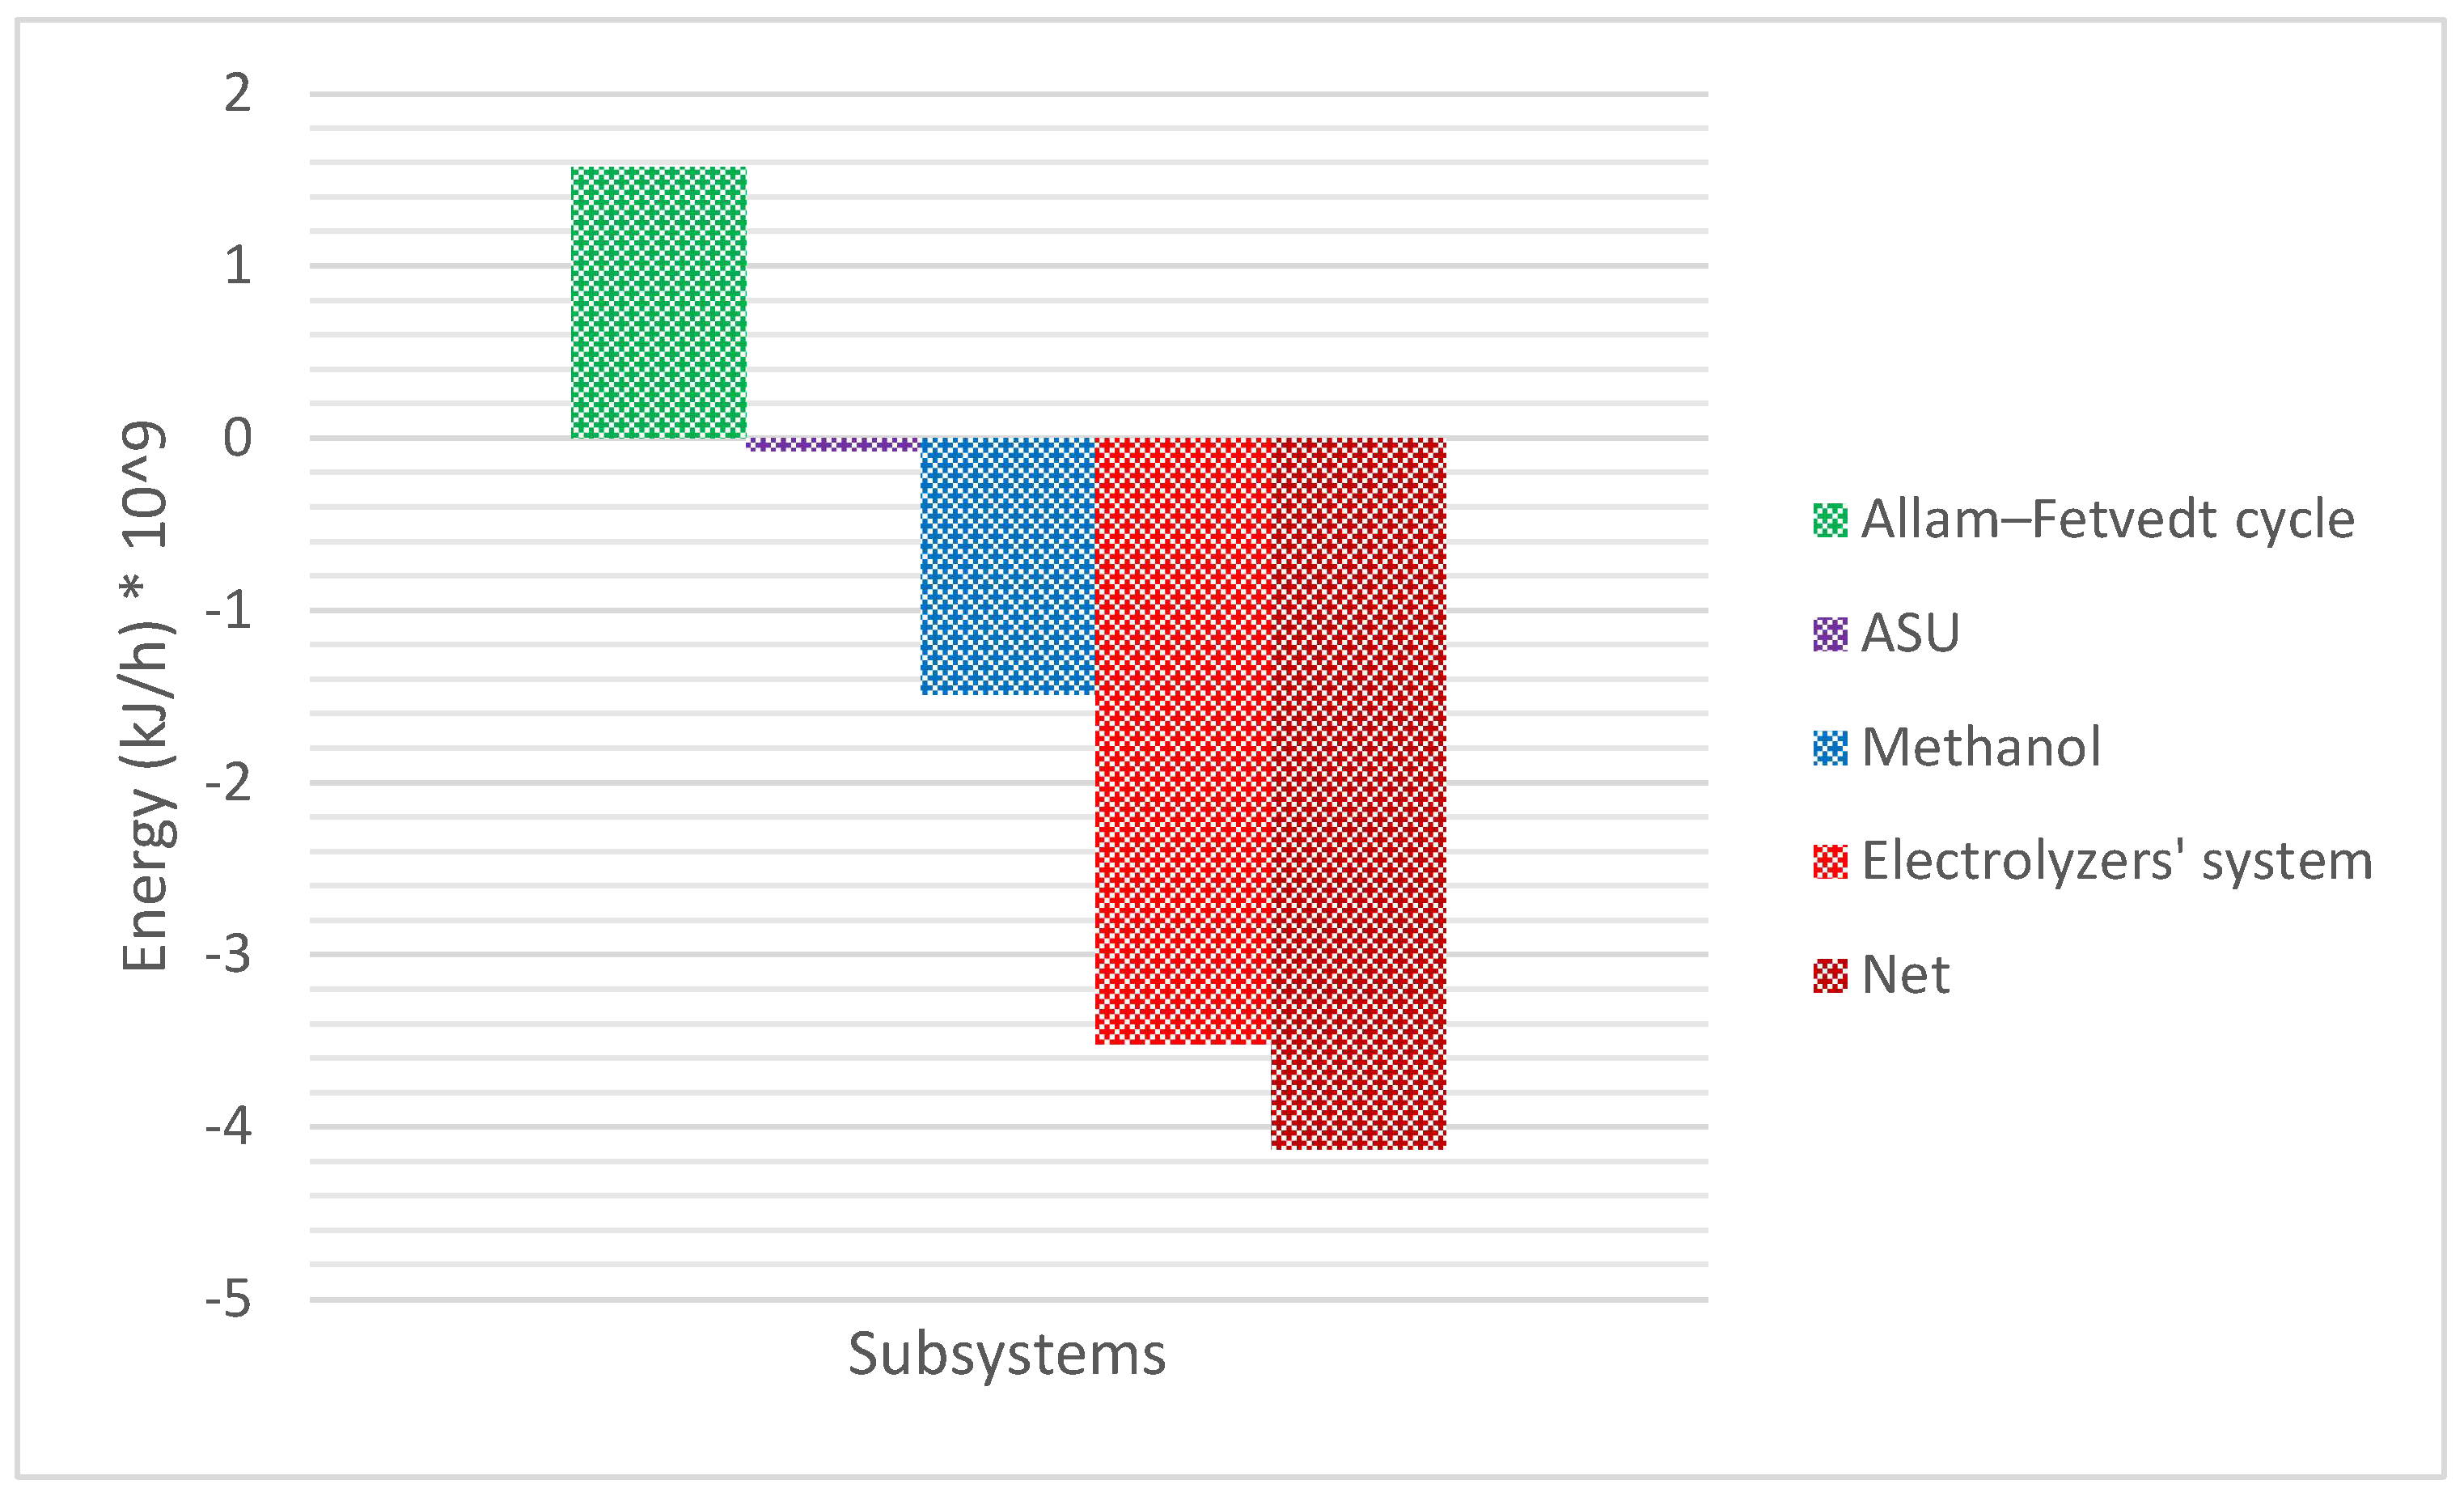
Without LNG production, making methanol by using the power cycle, ASU, and electrolyzers’ system need 29,200 kJ for every kilogram of methanol (
Figure 9). The energy required to produce methanol varies depending on the production method and feedstock used. Conventional natural gas-based production typically requires approximately 556 kJ of electrical energy per kilogram (kg) of methanol produced [
37]. On the other hand, when producing methanol from renewable sources, such as using green hydrogen and captured CO
2, the energy demand is higher. Approximately 10 to 11 megawatt-hours (MWh) of renewable electricity are needed to produce 1000 kg of methanol, which translates to about 36,000 to 40,000 kJ per kg [
37]. So, this value is much higher than the energy requirement (29,200 kJ/kg methanol) of the proposed integrated process.
Net zero refers to achieving a balance between the greenhouse gases emitted into the atmosphere and those removed, effectively eliminating the carbon footprint of industrial activities. Reaching net zero, especially in energy-intensive sectors, is vital for addressing climate change. Cutting-edge hybrid technologies are instrumental in helping industries reach these goals by integrating innovative solutions that improve efficiency, lower emissions, and revolutionize industrial operations. These technologies support the shift from carbon-heavy practices to more sustainable, energy-efficient, and resilient processes. As the demand to meet climate commitments intensifies, the significance of hybrid technologies in driving this transition will continue to rise [
38,
39,
40,
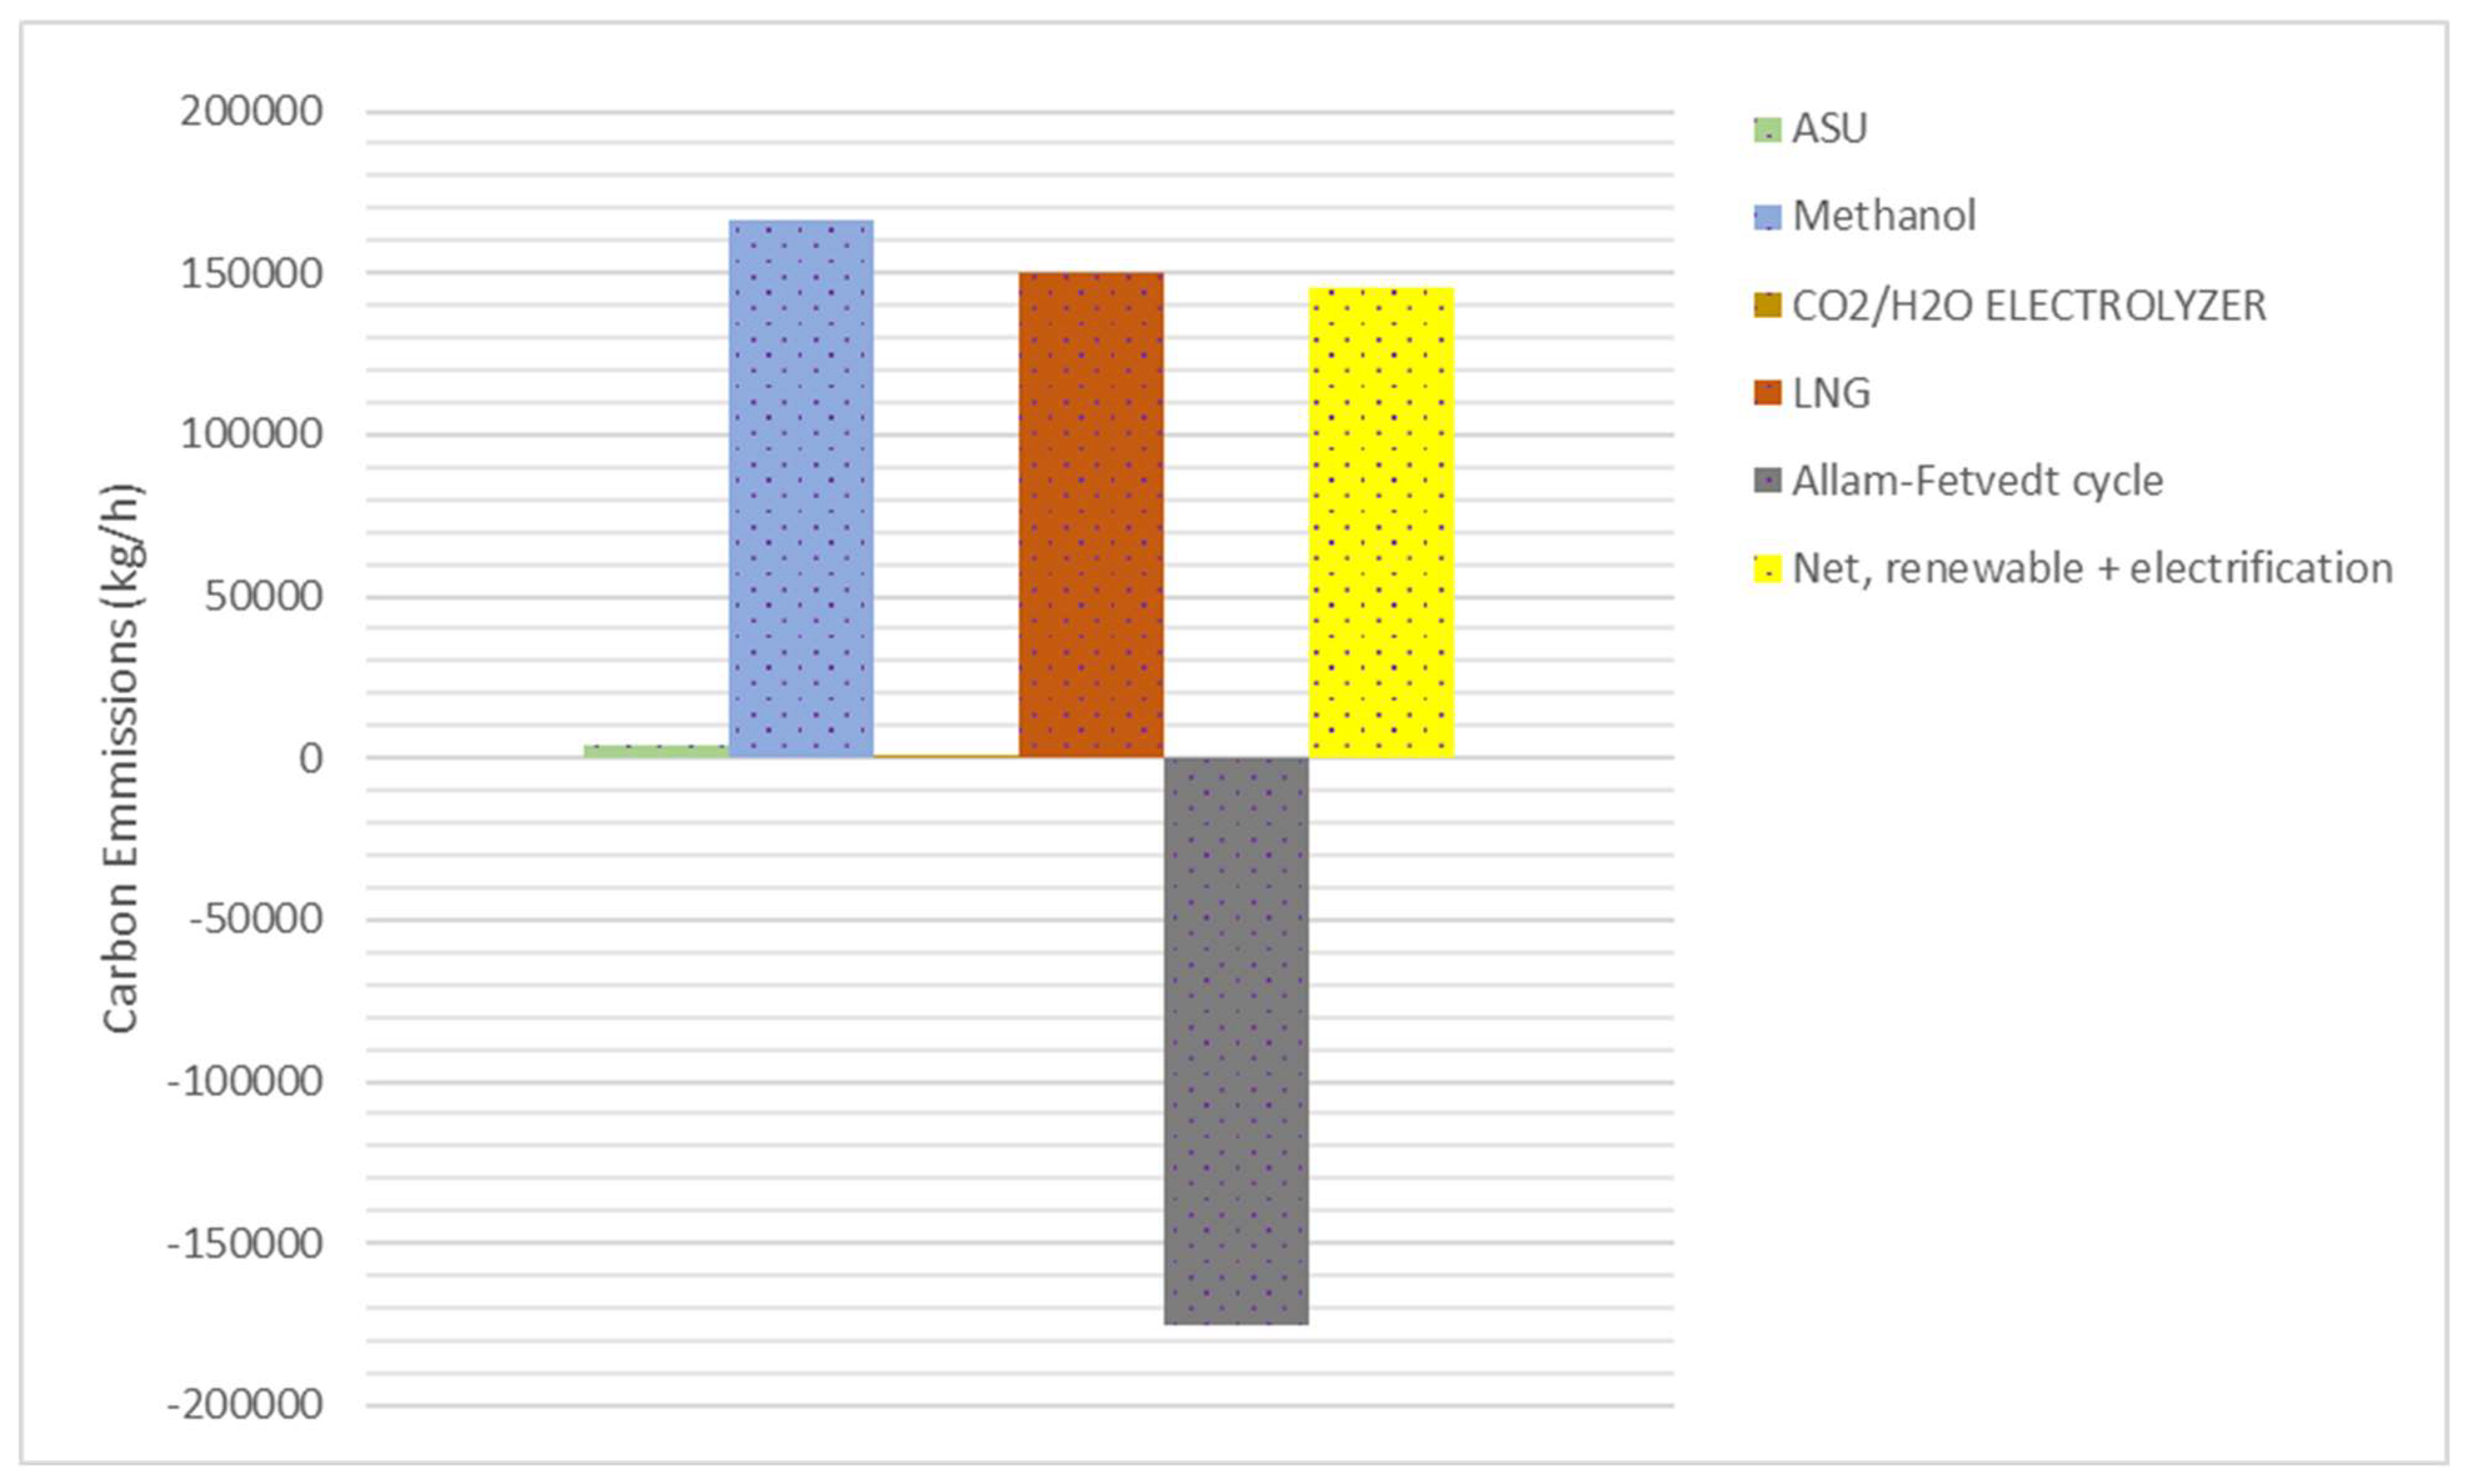
41]. In this study, the integrated process design enables the Allam-Fetvedt cycle to recirculate 96% of the generated CO
2 in the cycle, while the remaining 202,891.7 kg/h of CO
2 is captured and directed to subsequent processing stages (electrolyzers’ system). As a result, the cycle functions as a net-zero emissions system. However, as depicted in
Figure 10, the total net carbon emissions are 146,000 kg/h, taking into account the electrolyzers’ system that uses renewable energy and some portion of the energy from the power cycle, which reduces the overall carbon emissions of the system. The carbon emissions from natural gas (NG) liquefaction depend on the liquefaction technology, energy source, and process efficiency. However, typical estimates from literature and industry data suggest carbon emissions from NG liquefaction generally range from 0.25 to 0.35 kg CO
2 per kg of LNG produced [
40,
41]. In this study, this value is estimated at 0.29 kg CO
2 per kg of LNG, even though it also has methanol production.
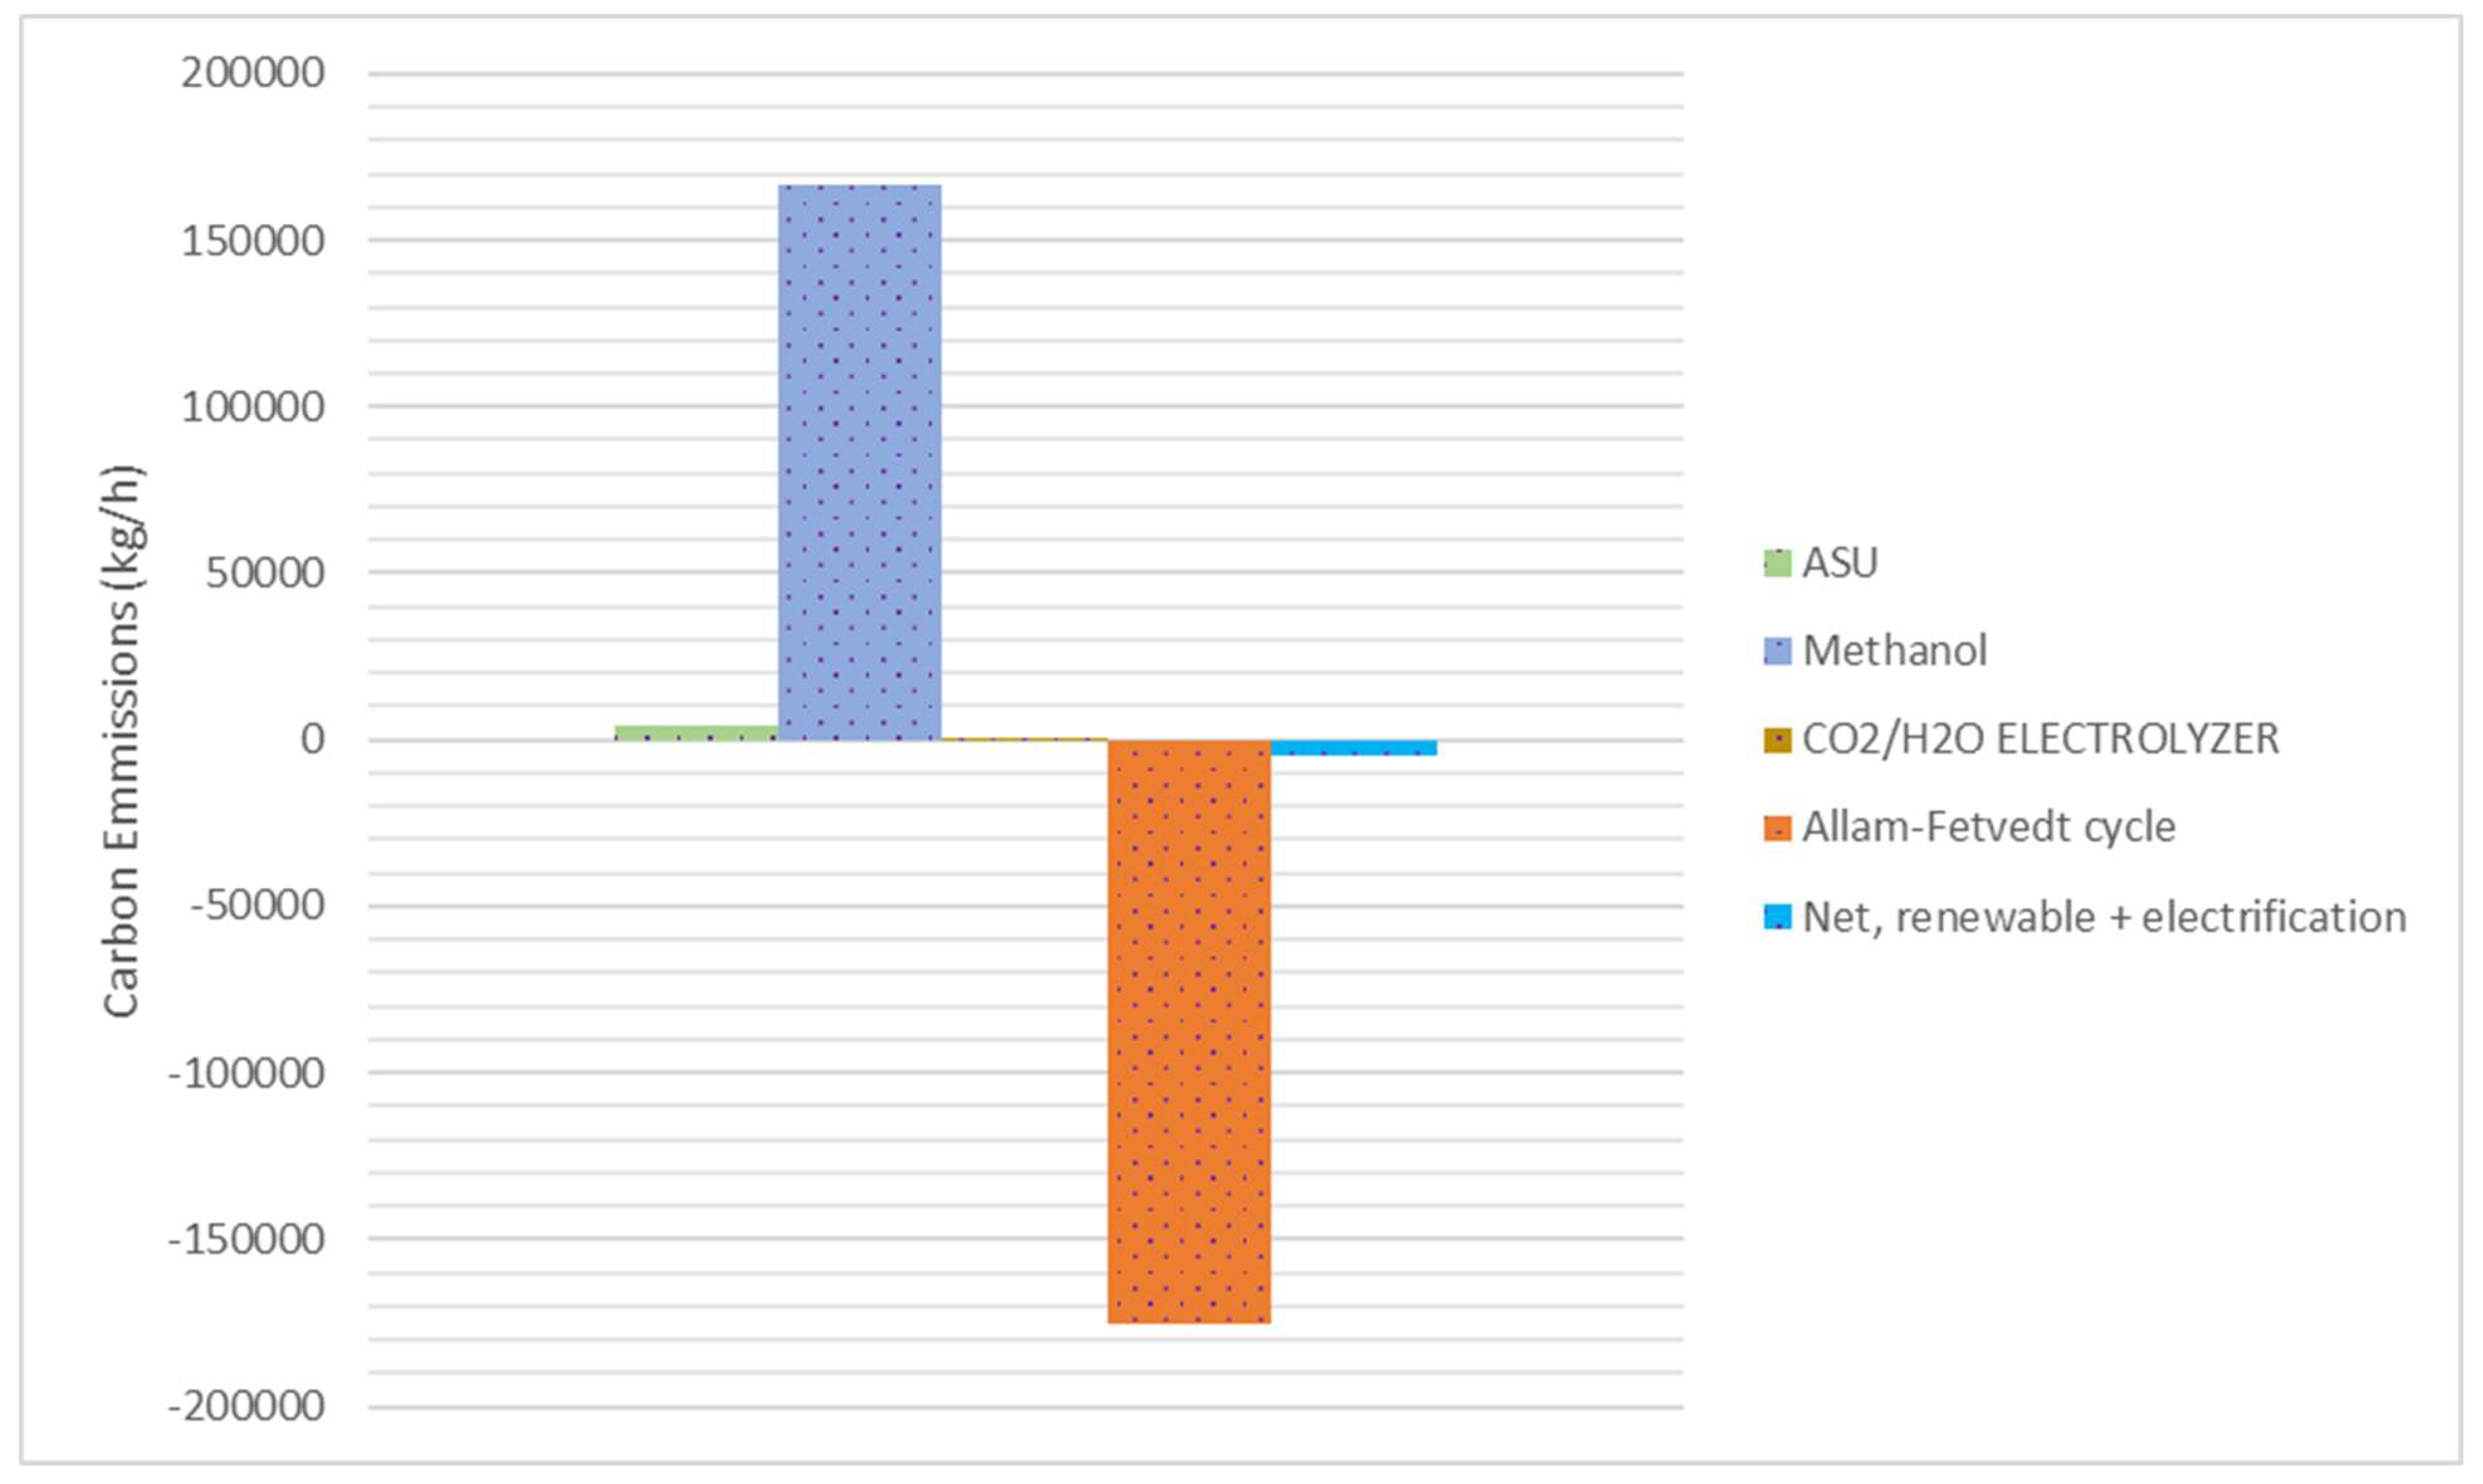
When the identical process is assessed solely for methanol production (without the LNG unit), by applying various strategies such as utilizing renewable (solar and wind) energy in a co-electrolyzer system and electrification of the ASU and methanol production units, carbon emissions can be reduced to net zero (
Figure 11). When we look at the literature, the reported carbon emissions associated with methanol production vary significantly depending on the feedstock and production process used. Natural gas-based methanol facilities typically emit approximately 0.4 kg of CO
2 per kilogram of methanol produced [
42]. Coal-based methanol is more carbon-intensive, with emissions ranging from 0.6 to 1.5 kg of CO
2 per kilogram of methanol [
38]. Produced using sustainable feedstocks or processes, renewable methanol can achieve significantly lower emissions, potentially approaching zero or even negative CO
2 emissions, depending on the specific production pathway [
43]. As a result, through the utilization of natural gas as a feedstock in a sustainable integrated process, this research is able to accomplish the goal of achieving net zero emissions.
5. Conclusions
This study presents a comprehensive simulation and environmental sustainability assessment of a novel integrated process that combines LNG production, power generation via the Allam–Fetvedt cycle, solid oxide co-electrolysis of CO2 and H2O, and methanol synthesis. The proposed configuration represents a novel approach to clean energy generation by enabling high energy efficiency, optimal resource utilization, and significant carbon footprint reduction. The Allam–Fetvedt cycle demonstrated a net electrical efficiency of 55%, and the results demonstrate that 96% of CO2 is recycled within the Allam–Fetvedt cycle, and the rest (the 4% of CO2) is captured and converted to syngas, validating its potential as a net-zero-emissions power generation technology. Despite the high energy demands of the electrolyzers’ system, the overall energy consumption of the process remains competitive when compared to conventional high-emission methods, owing to strategic heat integration and energy recovery mechanisms. The simulation outcomes demonstrate large-scale production capabilities, with methanol output reaching approximately 1.38 million metric tons per annum (MTPA) and LNG output at 3.6 million MTPA. These figures position the process within mid- to large-scale industrial ranges, underscoring its practical feasibility. The process also achieves a methanol-specific energy requirement of 29,200 kJ/kg, which is significantly lower than the energy demands reported for other green methanol production pathways, further affirming the efficiency of the system. Environmental analysis reveals that the integrated system emits only 0.29 kg of CO2 per kg of LNG produced—on par with best-in-class emissions benchmarks—even while also generating methanol. Furthermore, when LNG production is excluded and renewable electricity is utilized, the system attains net zero carbon emissions, outperforming traditional fossil-based methanol pathways in sustainability.
The findings underscore the critical role of advanced process integration in achieving decarbonization objectives. By coupling high-efficiency power cycles with electrochemical CO2 utilization and fuel synthesis, this study offers a scalable and environmentally responsible blueprint for clean energy infrastructure. Even though the proposed integrated process presents a promising pathway toward sustainable energy and chemical production. The main difficulties for the practical implementation of the proposed process can be listed as (1) High capital investment and integration complexity: The integration of multiple advanced systems such as the Allam–Fetvedt cycle, solid oxide co-electrolyzers, cryogenic ASU, LNG production, and chemical synthesis requires significant capital investment. Moreover, the complexity of process integration, control, and safety assurance in a tightly coupled system poses engineering and operational challenges. (2) Energy requirements and renewable energy supply: Although the proposed process achieves high energy efficiency, the solid oxide co-electrolyzer unit has a high energy demand. Ensuring a consistent and renewable power supply to this unit is critical for maintaining low carbon emissions and sustainability goals. (3) Material durability and scalability of SO electrolyzers: Solid oxide electrolyzer cells (SOECs) operate at high temperatures, which can limit their long-term durability and scalability. Large-scale deployment of SOEC cells, as calculated, demands robust materials and advanced thermal management to maintain efficiency and operational lifespan. (4) Technology readiness level (TRL) and commercial maturity: While each subsystem (e.g., DME synthesis, LNG production) is commercially proven individually, the fully integrated configuration, especially involving high-efficiency CO2 capture with the Allam cycle and co-electrolysis, has a relatively low TRL. Pilot-scale demonstrations are essential before industrial rollout. (5) Process control and operational flexibility: Developing advanced control systems and real-time optimization strategies is essential. (6) Policy and market constraints: Widespread deployment of such systems requires supportive regulatory frameworks and economics. Current market structures may not yet favor the integration of such multifaceted technologies. Also, to ensure its feasibility for large-scale implementation, a detailed techno-economic analysis (TEA) is essential. Future work should aim to expand upon this foundation with rigorous techno-economic assessments, life cycle analysis (LCA), and implementation strategies to confirm the viability of this approach at commercial scale and under variable market and policy conditions.


