Article

Promotion Effect and Mechanism Analysis of Different Strain Pre-Treatment on Methane Conversion from Lignite

1
General Prospecting Institute of China National Administration of Coal Geology, Beijing 100039, China
2
Key Laboratory of Transparent Mine Geology and Digital Twin Technology, National Mine Safety Administration, Beijing 100039, China
3
PetroChina Coalbed Methane Co., Ltd., Beijing 100020, China
4
School of Energy Science and Engineering, Henan Polytechnic University, Jiaozuo 454000, China
5
College of Mining, Liaoning Technical University, Fuxin 123000, China
6
Research Institute of Petroleum Exploration & Development, Beijing 100083, China
*
Author to whom correspondence should be addressed.
Processes 2025, 13(8), 2581; https://doi.org/10.3390/pr13082581
Submission received: 18 May 2025 / Revised: 17 July 2025 / Accepted: 31 July 2025 / Published: 15 August 2025

Abstract

To evaluate lignite degradation efficiency and the enhancement of biogas production by different microbial treatments, lignite was pre-treated with Streptomyces viridosporus (actinomycete), Phanerochaete chrysosporium (fungus), and Pseudomonas sp. (bacterium), followed by biogasification experiments. Among the three, Phanerochaete chrysosporium exhibited the highest lignite degradation rate. All microbial treatments improved both cumulative biogas yield and methane conversion, with Phanerochaete chrysosporium again demonstrating the most significant enhancement. Ultimate analysis after degradation showed the following consistent trends across all treatments: increases in carbon, hydrogen, and nitrogen contents, and reductions in sulfur and oxygen contents. A linear correlation was observed between the H/C atomic ratio and total biogas yield. Functional group analysis revealed the greatest reductions in key functional groups with Phanerochaete chrysosporium, followed by moderate changes with Pseudomonas and Streptomyces viridosporus. Pore structure characterization indicated that all microorganisms influenced lignite porosity, particularly in mesopore and micropore regions. Increases in pore volume and connectivity were associated with improved biogas production efficiency.

1. Introduction

China has a substantial coal production capacity, with raw coal output reaching 4.76 billion tons in 2024, a 1.3% increase compared to the previous year. However, coal combustion remains a major source of atmospheric pollutants, continuously impacting environmental quality. Clean coal technologies, internationally recognized as key solutions to coal-related environmental challenges, hold significant potential to enhance coal utilization efficiency and reduce emissions [1]. Nevertheless, most current technologies are based on physical and chemical conversion processes, which suffer from notable drawbacks, including low utilization efficiency, high energy consumption, and secondary environmental pollution [2]. For example, thermal decomposition processes can release harmful emissions such as CS2, COS, H2S, NH3, HCN, and BTX [3].
Biotechnology offers notable advantages, such as environmental compatibility and mild operating conditions. Among these, fermentation-based approaches have attracted increasing attention as they enable the bioconversion of coal into biomethane through the synergistic activity of diverse microbial communities. This process not only facilitates the cleaner utilization of coal resources but also provides a sustainable pathway for methane production under anaerobic conditions [4,5]. However, coal’s complex and recalcitrant structure significantly limits the efficiency of biogasification, often resulting in low cumulative methane yields and short gas production cycles [6].
Pre-treatment is therefore essential to improve coal’s structural accessibility. Current pre-treatment strategies are classified as physical, chemical, or biological [7,8]. Physical pre-treatments—such as ultrasonic irradiation and swelling—aim to enhance coal dissolution and degradation. Chemical methods use oxidants like hydrogen peroxide, nitric acid, and potassium permanganate to cleave macromolecular bonds, simplifying coal’s structure into smaller, more degradable molecules [9,10]. Biological pre-treatment leverages microbial activity to break down coal macromolecules into low-molecular-weight compounds and organic acids [11]. For example, Xia et al. pre-treated bituminous coal with five hydrolytic microbial strains, which significantly enhanced its subsequent biomethanation efficiency, demonstrating the potential of microbial consortia in improving coal biodegradability [12].
This study explores microbial degradation as a pre-treatment strategy for lignite by employing three microbial strains: Streptomyces viridosporus, Phanerochaete chrysosporium, and Pseudomonas sp. The effects of microbial pre-treatment were systematically evaluated based on biogas production, changes in elemental composition, alterations in functional groups, and pore structure evolution. These comprehensive analyses aim to clarify how microbial pre-treatment modifies coal’s structure and enhances biogasification performance.

2. Experimental Materials and Methods

2.1. Experimental Materials

The lignite sample was obtained from the Baiyin Hua mine in Inner Mongolia. A 0.2–0.3 mm fraction of the lignite was selected, sterilized, and then dried in a vacuum oven at 50 °C for 24 h before being sealed and stored. The proximate and ultimate analysis of the lignite is presented in Table 1. Streptomyces viridosporus (St), Phanerochaete chrysosporium (Ph), and Pseudomonas (Ps) were selected from the BeNa Culture Collection (BNCC) and the China General Microbiological Culture Collection Center (CGMCC), with strain information listed in Table 2. The enrichment culture of methanogenic communities was performed by adding the following components to 1000 mL of fresh mine water: 0.4 g K2HPO4, 2.0 g MgCl2, 0.4 g KH2PO4, 1.0 g yeast extract, 1.0 g NH4Cl, 0.001 g blade green, 0.5 g cysteine, 0.2 g Na2S, 0.2 g NaHCO3, 2.0 g sodium acetate, 0.2 g KCl, 2.0 g NaCl, 10.0 mL trace element solution, and 10.0 mL composite vitamin solution. The pH was adjusted to 7.0 [13].

2.2. Experimental Methods

2.2.1. Experimental Procedures

(1) Microbial Pretreatment Experiment: In 250 mL sterilized conical flasks, 10 g of lignite and an appropriate amount of enriched microbial cultures were added for the experiment. The flasks were sealed with breathable cotton stoppers to prevent contamination by unwanted microorganisms. Untreated lignite was used as the control group. Detailed sample information is provided in Table 3.
(2) Anaerobic Methanogenesis Experiment: The microbial pre-treated lignite samples (ST-L, PH-L, PS-L) and raw lignite samples (L) were added to reaction flasks along with the enriched methanogenic consortia. The reaction flasks were sealed with rubber stoppers, and biogas was collected using the water displacement method. Gas measurements were taken every 3 days during the gas production phase, and after the completion of gas production, the gas composition was analyzed using a gas chromatograph.

2.2.2. Experimental Testing Methods

(1)
Gas Composition and Concentration Analysis: The gas composition and concentration were determined using gas chromatography (Agilent7890GC, Agilent Technologies Inc., Santa Clara, CA, USA).
(2)
Ultimate Analysis: Ultimate analysis was conducted using a Thermo Scientific FLASH 2000 CHNS/O analyzer (Waltham, MA, USA). Both pre- and post-treatment lignite samples were washed with distilled water, placed in a vacuum-drying oven, and dried at 105 °C for 6 h. Ultimate analysis accorded to the standard (GB/T 31391-2015) [14], and changes in carbon, hydrogen, oxygen, nitrogen, and sulfur content in the treated lignite samples were compared.
(3)
Analysis of Lignite Functional Groups: The analysis of lignite functional groups was performed using an AVATAR 360 Fourier-transform infrared (FTIR) spectrometer (Nicolet Instrument Corporation, Madison, WI, USA). The scanning parameters included 32 scans, a resolution of 4 cm−1, and a scanning range of 400–4000 cm−1.
(4)
Pore Structure Analysis of Lignite: The pore structure of the lignite was evaluated using an AutoPore IV 9505 mercury intrusion porosimeter (Micromeritics Instrument Corporation, Norcross, GA, USA). The accuracy of the mercury volume measurement during both intrusion and extrusion was less than 0.1 μL. The contact angle between the mercury and the sample was 130°, with a surface tension of 0.485 N/m.
(5)
SEM Analysis: The surface morphology of coal samples was examined using a Scanning Electron Microscope (SEM, QUANTA FEG 250, Thermo Fisher Scientific, Waltham, MA, USA). Coal samples were fixed with 2.5% glutaraldehyde, dehydrated through a graded ethanol series, dried, and gold-coated for SEM observation.

3. Experimental Results and Analysis

3.1. Effect of Different Microbial Pre-Treatment on Lignite Degradation Rate

From the results of the anaerobic methanogenesis experiment, it is evident that the cumulative biogas production and CH4 concentration increased to varying degrees after microbial pre-treatment (Table 4). Among the treatment groups, PH-L exhibited the highest biogas yield, reaching 288 mL, compared to the control group (L). The ST-L and PS-L groups also showed increased cumulative biogas production, with values of 202.50 mL and 171.00 mL, respectively. Regarding CH4 concentration, the PS-L group achieved the highest value at 51.77%, followed by PH-L at 48.20%. The ST-L group showed only a slight increase in CH4 concentration relative to the control. Overall, the PH-L group demonstrated superior performance in both cumulative biogas production and CH4 conversion rate. The PS-L group exhibited a higher CH4 conversion rate but showed only a modest increase in cumulative biogas production. The ST-L group showed an increase in cumulative biogas production, but its CH4 conversion rate remained lower.

3.2. Ultimate Analysis

Table 5 presents the ultimate analysis results of the lignite samples before and after treatment. After treatment with the three microorganisms the content of carbon (C), hydrogen (H), and nitrogen (N) increased to varying extents, while sulfur (S) and oxygen (O) contents decreased. Specifically, after treatment with the ST-L, PH-L, and PS-L groups, the carbon content increased by 44.08%, 45.51%, and 77.59%, respectively. The hydrogen content increased by 15.45%, 42.50%, and 22.95%, respectively, and the nitrogen content increased by 107.50%, 242.50%, and 250.00%, respectively. In contrast, the oxygen content decreased by 4.70%, 8.76%, and 6.75%, and the sulfur content decreased by 100% after treatment with the three microorganisms. This could be attributed to microbial growth during the pre-treatment process, which likely consumed oxygen and sulfur, thereby causing a relative increase in the content of carbon, hydrogen, and nitrogen [15]. The PS-L group showed the most significant increase in carbon content. The substantial reduction in sulfur content suggests that desulfurization may have occurred during microbial pre-treatment. The microbial reaction likely consumed oxygen and sulfur. Additionally, the O/C and H/C atomic ratios of the pre-treated lignite samples were lower than those of the raw lignite. Among the microbial treatments, the PS-L group showed the lowest O/C and H/C atomic ratios, while the PH-L group exhibited a higher H/C atomic ratio than the ST-L group.
By correlating the biogas production during the anaerobic methanogenesis process with the results of ultimate analysis, as shown in Figure 1, the biogas production after pre-treatment with the ST-L, PH-L, and PS-L groups reached 202.50 mL, 288.00 mL, and 171.00 mL, respectively. These results exhibited a positive correlation with the H/C atomic ratio of the pre-treated samples. This indicates that higher H/C atomic ratios after microbial pre-treatment are associated with improved biogas production. Microbial pre-treatment accelerates the hydrogen production and acetic acid fermentation stages, thereby facilitating biogas production and making the process more favorable for anaerobic biogas generation [16].

3.3. Influence of Lignite Chemical Functional Groups

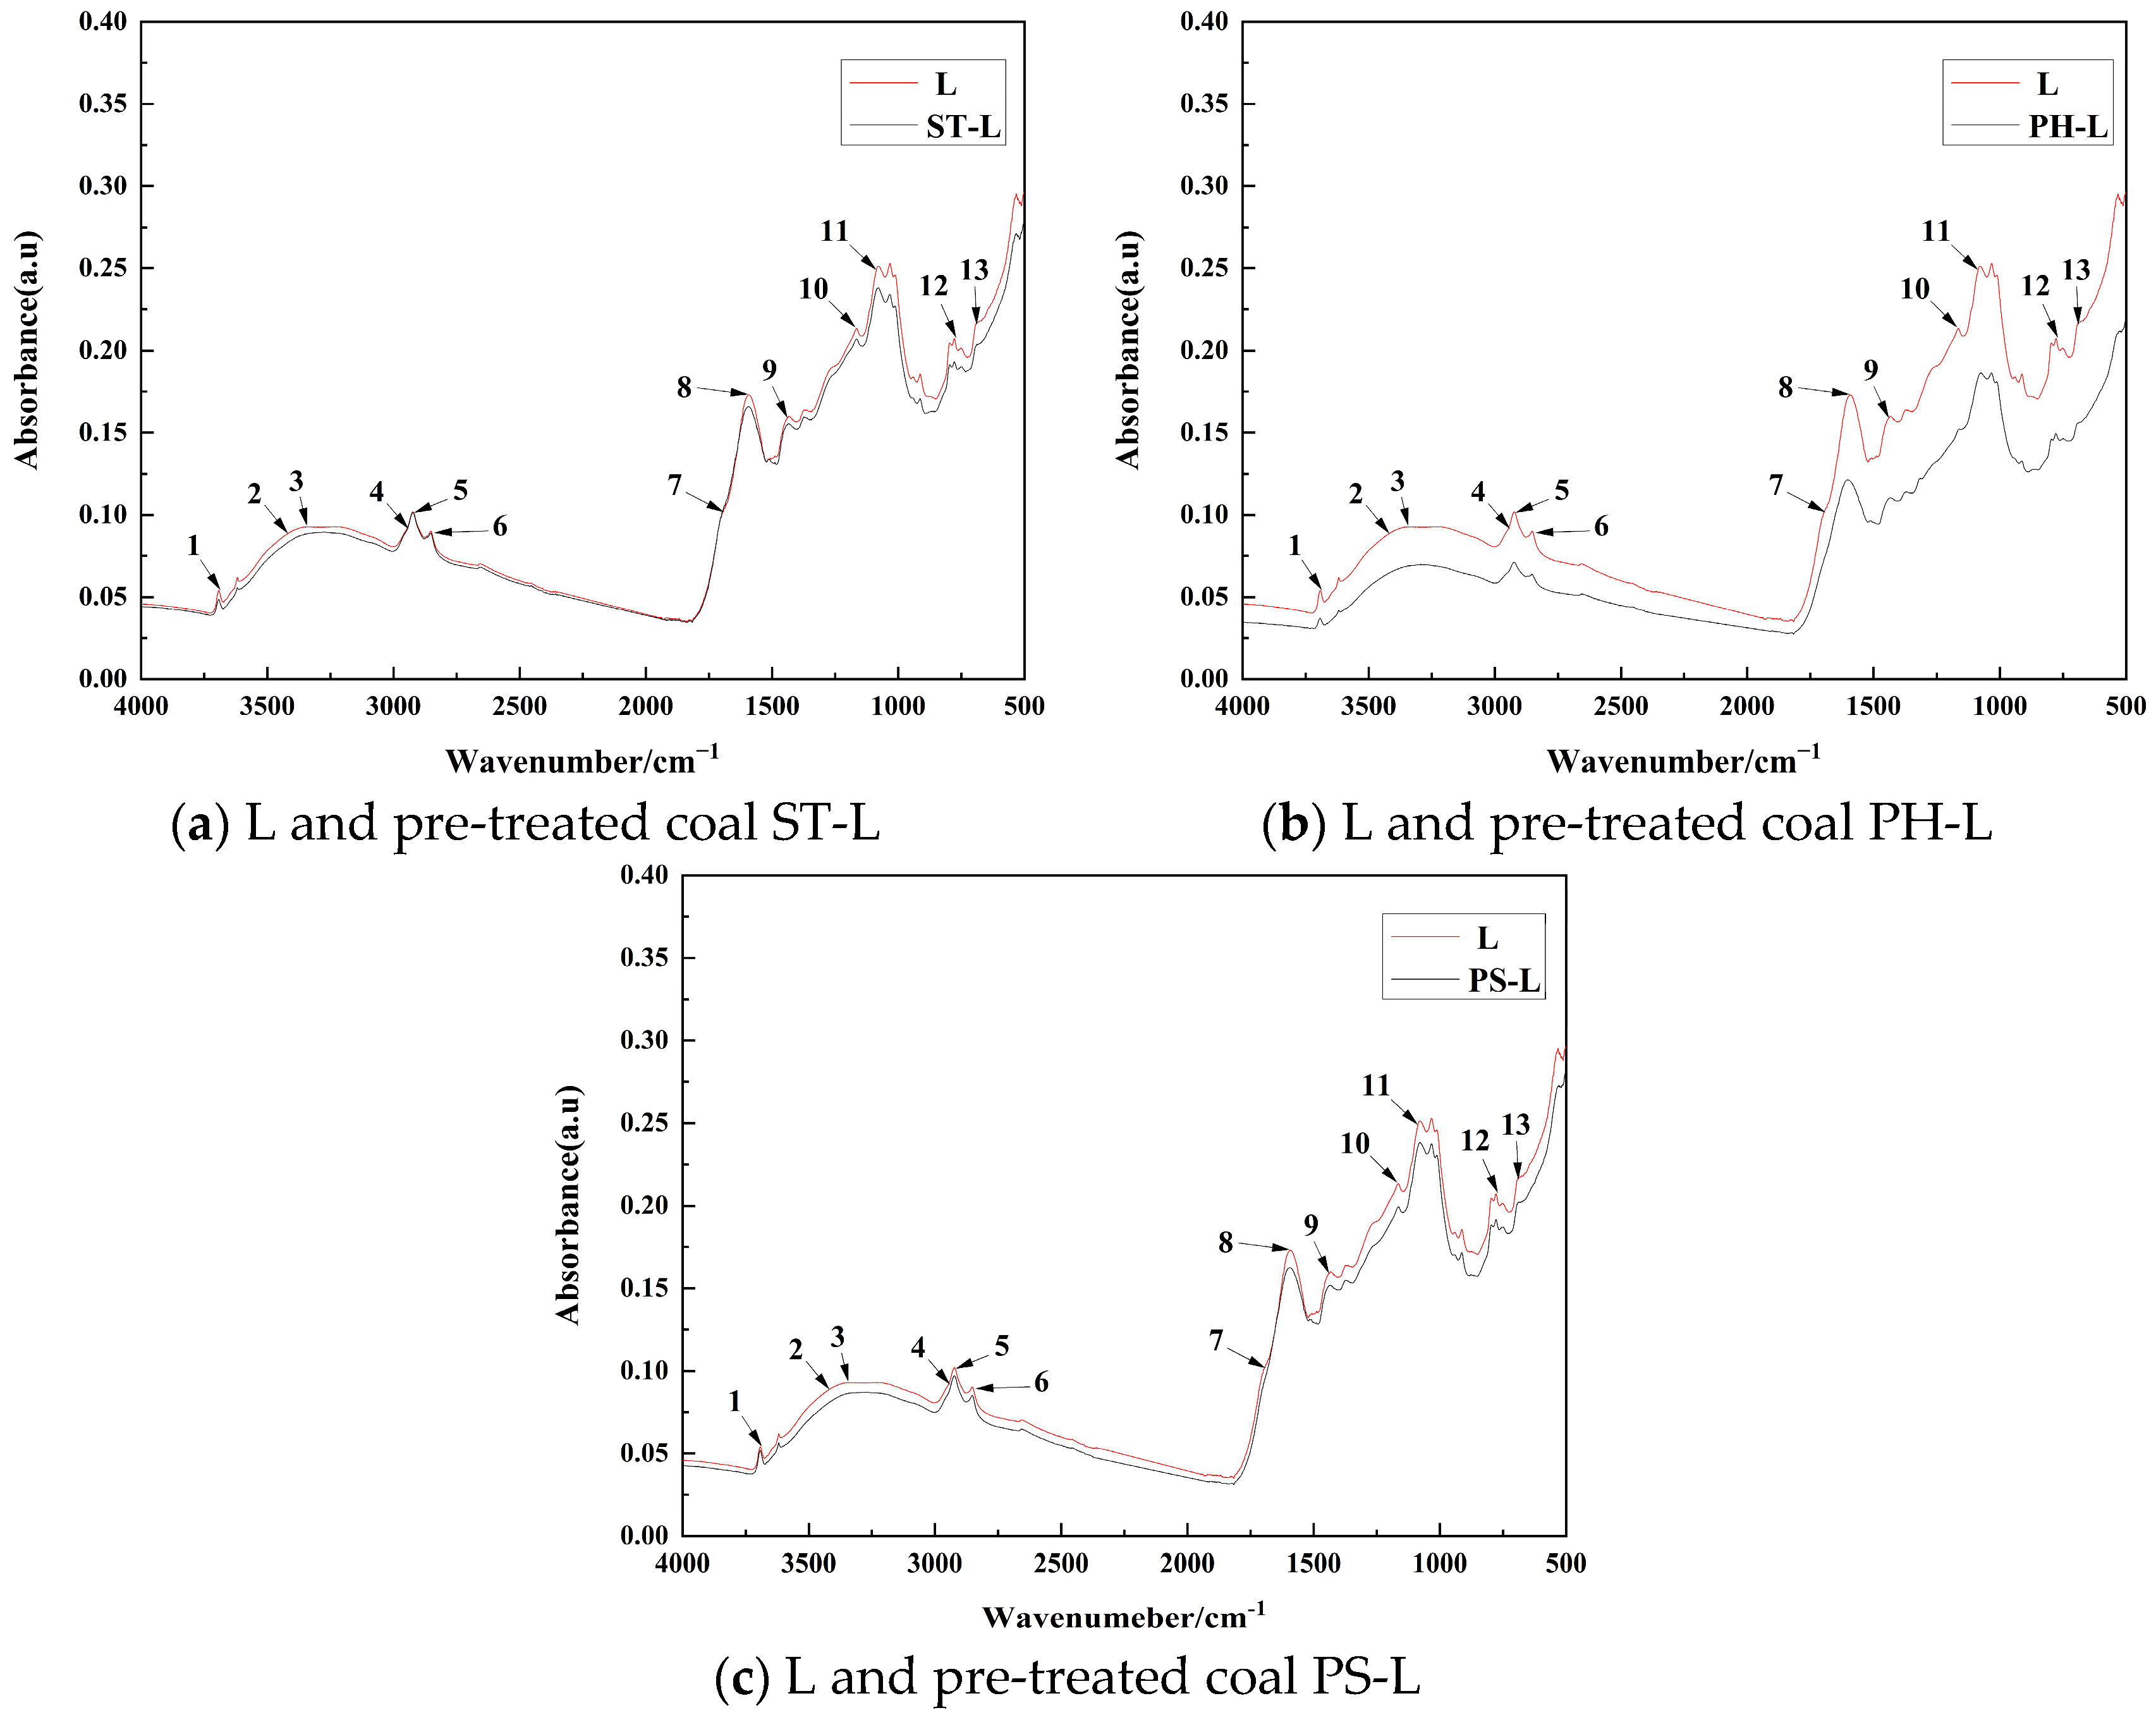
The lignite samples were processed using the potassium bromide (KBr) pellet method, and the changes in functional group content before and after microbial pre-treatment were compared by analyzing the main characteristic peaks, as shown in Figure 2. In the lignite samples pre-treated with different microorganisms, significant changes were observed in the hydroxyl (OH) groups of phenols, alcohols, and carboxylic acids, the C=C skeletal vibration of the benzene ring, the C-H stretching vibration of aldehydes, and the out-of-plane bending vibrations of C-H bonds in aromatics [17,18]. The PS-L group showed a more significant decrease compared to the ST-L group in these functional groups. Additionally, the asymmetric stretching vibration of CH3 in naphthenic or aliphatic structures, the methylene CH2 stretching vibration, and the symmetric stretching vibration of methylene CH2 were clearly visible. Among the three microbial treatments, the PH-L group exhibited stronger functional group vibrations than the other two groups. White rot fungi demonstrated a stronger degradation effect on the side chains, branched chains, and benzene ring skeletons compared to Pseudomonas and Streptomyces viridigriseus, leading to butyric acid as the primary degradation product, although other degradation products showed variability.

3.4. Analysis of Lignite Porosity

Mercury intrusion experiments were conducted on the four lignite samples after anaerobic methanogenesis experiments to compare the pore volume and specific surface area at different pore sizes. The basic parameters are presented in Table 6. After the anaerobic methanogenesis experiments, the porosity and intrusion volume of the raw lignite were relatively large. This may be due to microbial pre-treatment, during which the microorganisms filled the cracks and pores in the lignite [19,20]. The total pore area of the PS-L group was superior to that of the PH-L group, and both were larger than that of the raw lignite. However, the total pore area of the ST-L group was smaller than that of the raw lignite. A smaller average pore diameter corresponded to a larger total pore area, which may be attributed to microbial growth and proliferation on the lignite surface. Thus, the microbial community in the PS-L group demonstrated a stronger pore-forming effect on the lignite compared to the PH-L and ST-L groups.

3.4.1. Pore Volume Analysis

The pore volume distribution characteristics of the lignite samples at different pore sizes are shown in Table 7. For macropores and mesopores, the L group exhibited a larger macropore volume compared to the lignite samples from the microbial pre-treatment groups (ST-L, PH-L, and PS-L). Additionally, the L group had a larger mesopore volume than the PH-L and PS-L groups. Regarding micropores, the pore volume followed the order: PS-L group > PH-L group > ST-L group > L group. The variations in micropore volume were consistent with those observed in the smaller pore sizes, which may be attributed to the pore-forming effects of the microorganisms and their morphological impact during the pre-treatment phase. In the pre-treatment groups, the pore volumes of the small pores and micropores increased, which could be due to microbial metabolism during the pre-treatment, leading to partial coal degradation [21,22]. This process enhanced the connectivity of the pore spaces, effectively altering the surface structure of the coal, increasing both its surface roughness and porosity [11]. This modification is favorable for subsequent anaerobic methane production experiments.

3.4.2. Specific Surface Area Analysis

The specific surface area distribution characteristics of the lignite samples at different pore sizes are shown in Table 8. Regarding macropores and mesopores, the macropore specific surface areas of the PH-L and PS-L groups (microbial pre-treated lignite) were lower compared to the H group, while the macropore specific surface area of the ST-L group increased. Similarly, the mesopore specific surface area of the H group was smaller compared to those of the PS-L and ST-L groups. In terms of micropore specific surface area, the order of surface area was, PS-L group > PH-L group > L group > ST-L group, which was consistent with the trends observed for micropore specific surface area. This variation may be attributed to differences in the pore-forming abilities of the microorganisms and their morphological characteristics during the pre-treatment phase [23,24].
As shown in Table 8, the specific surface area of the ST-L group decreased by 11.60% compared to the L group. This could be due to the covering of some pores by the Streptomyces viridigriseus during growth. The specific surface areas of the PH-L and PS-L groups increased by 44.43% and 109.83%, respectively, compared to the L group, which can be attributed to the increase in micropore specific surface area. For the L and ST-L groups, the specific surface area was primarily contributed by micropores and mesopores, with minimal contribution from macropores. In contrast, the specific surface areas of the PH-L and PS-L groups were mainly contributed by micropores and small pores.

3.4.3. Mercury Intrusion–Extrusion Curve Analysis

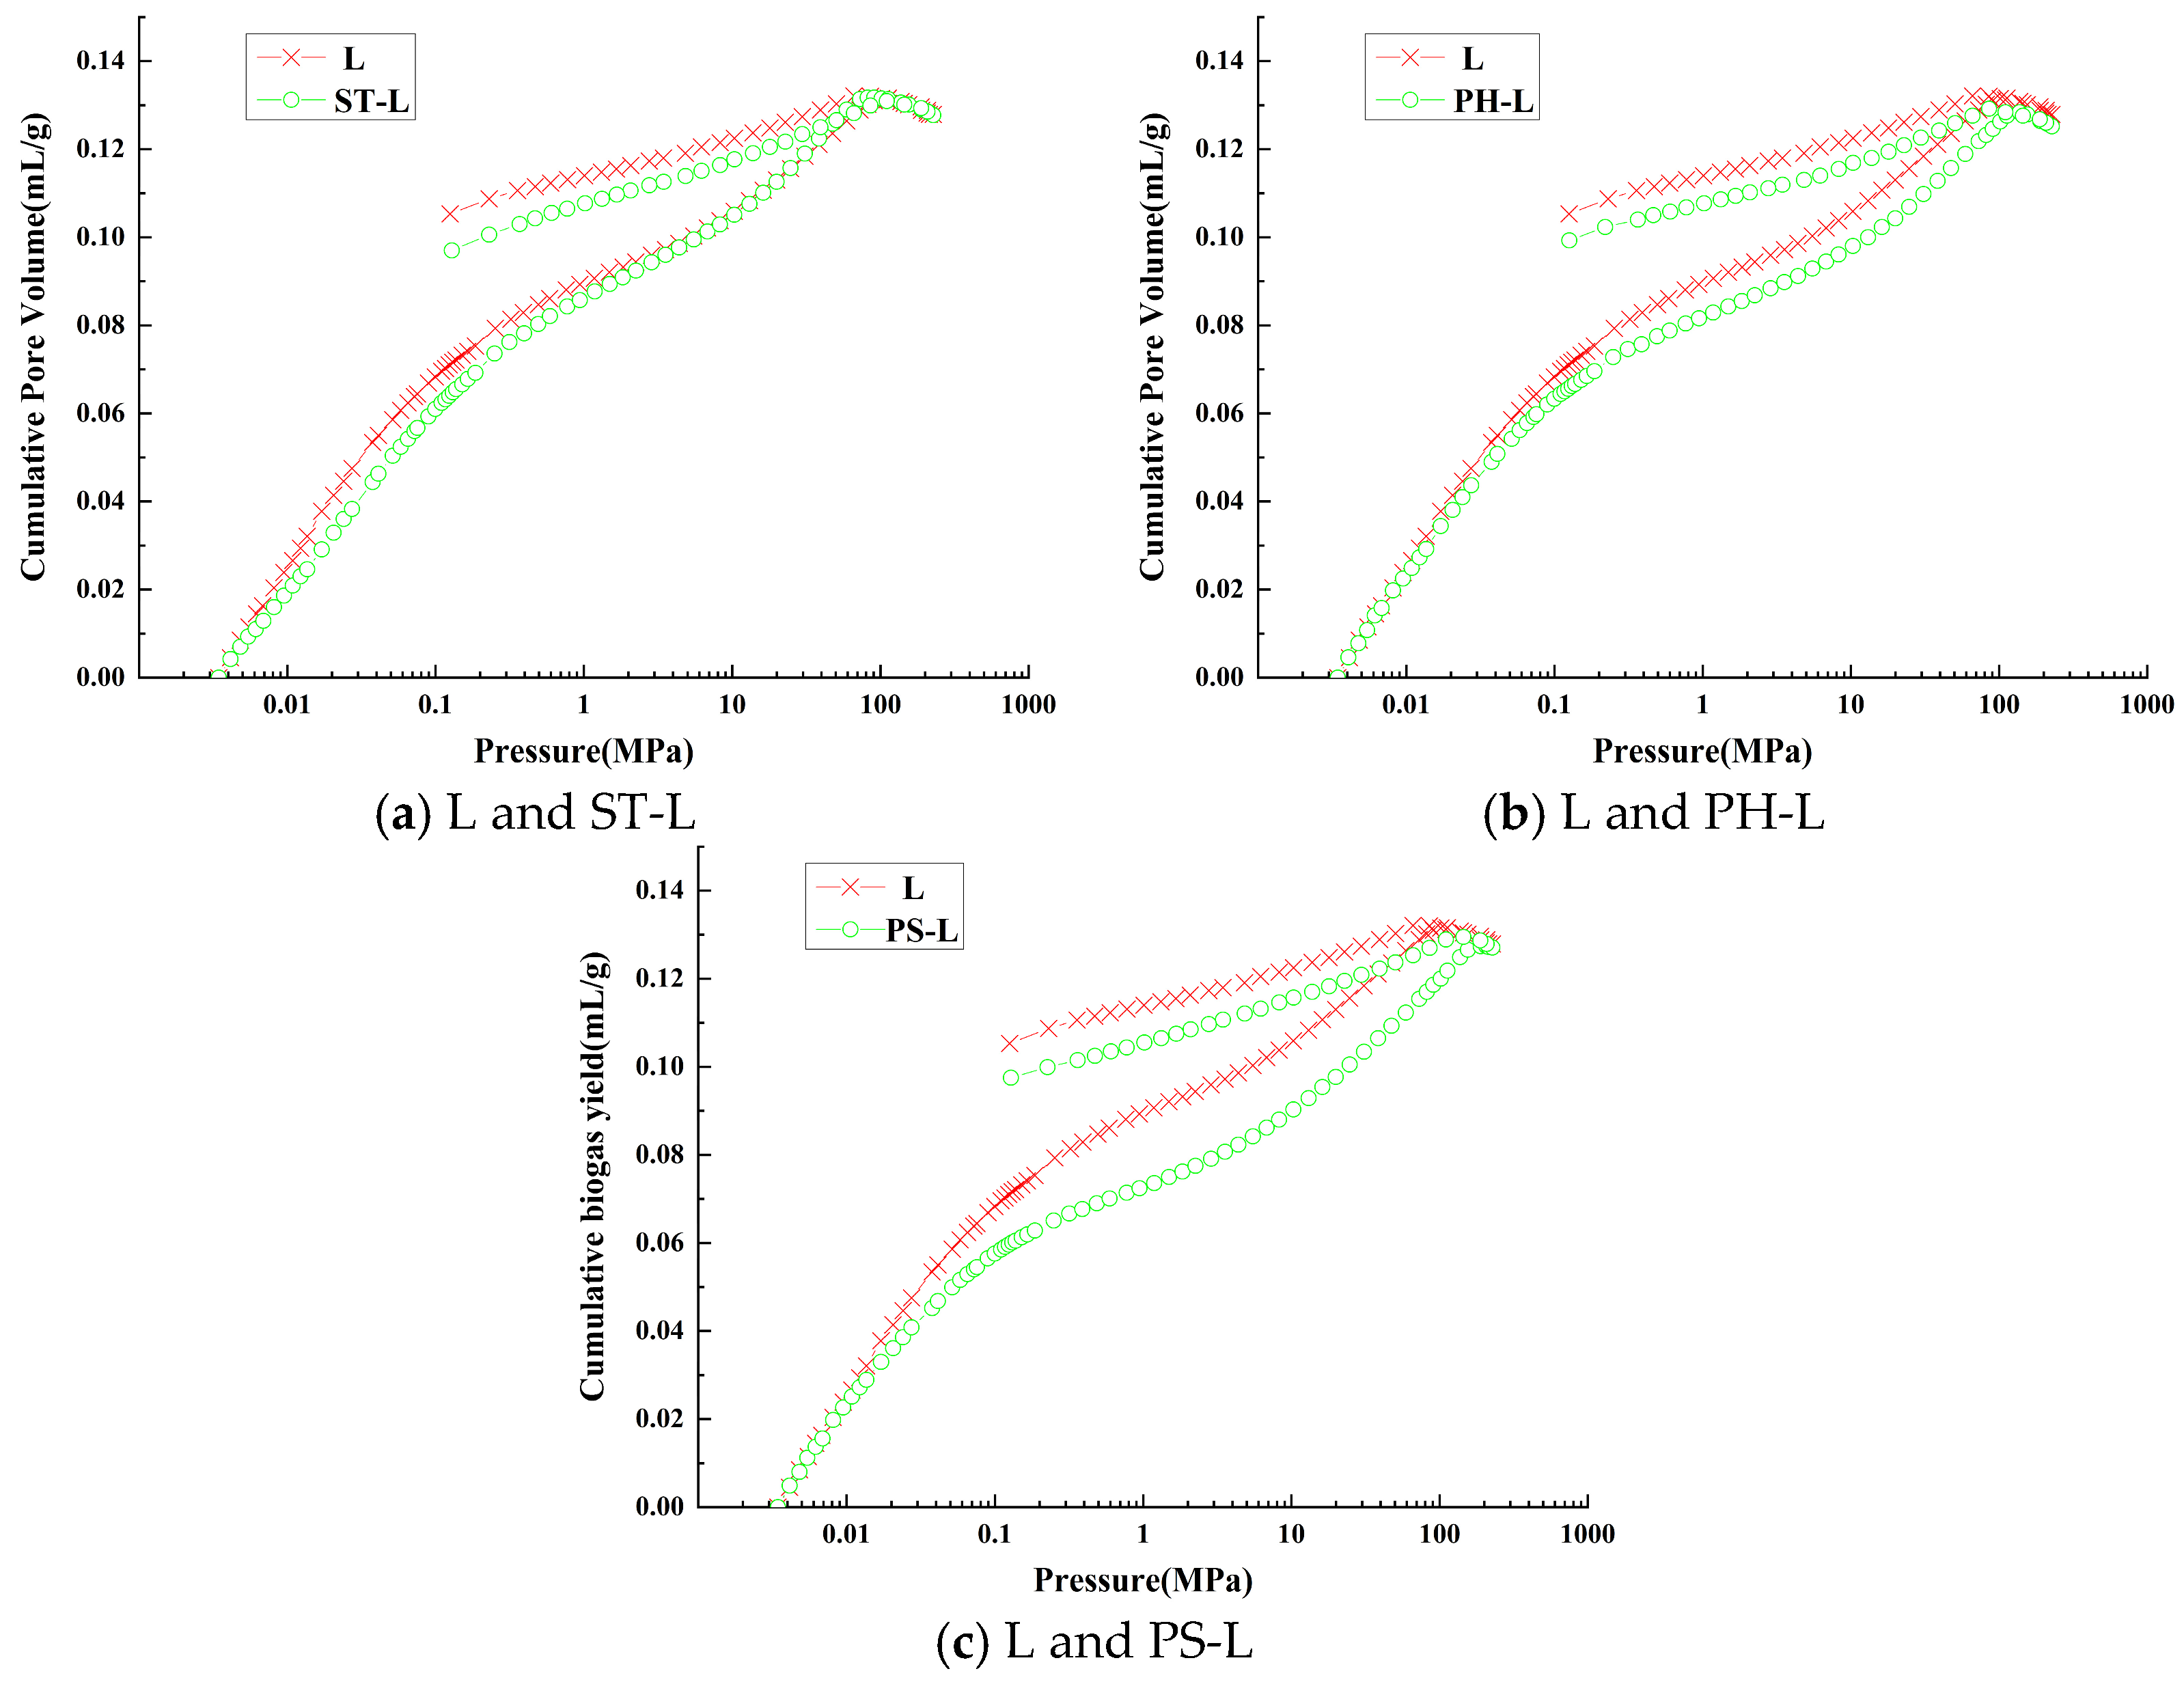
Pore connectivity significantly determines the permeability of coal reservoirs, which in turn affects the migration rate of coalbed methane. The mercury intrusion–extrusion curves of the lignite samples are shown in Figure 3. As depicted in Figure 3, the intrusion and extrusion curves do not overlap, primarily due to the presence of a large number of dead-end pores or capillary pores within the coal [25,26]. As shown in Figure 3a, compared to the L group, the ST-L group lignite sample exhibits a narrower hysteresis loop with similar intrusion and extrusion volumes, suggesting that the pores are predominantly semi-closed with poor pore connectivity. In Figure 3b, it is evident that the intrusion–extrusion curves of the PH-L group are similar to those of the L group, with a wider hysteresis loop and a greater difference in intrusion and extrusion volumes, indicating better pore connectivity in the PH-L group lignite sample. In Figure 3c, the hysteresis loop of the PS-L group lignite sample is notably larger than that in Figure 3b, suggesting that the pore connectivity of the PS-L group lignite sample is superior to that of the PH-L group.

3.4.4. SEM Analysis

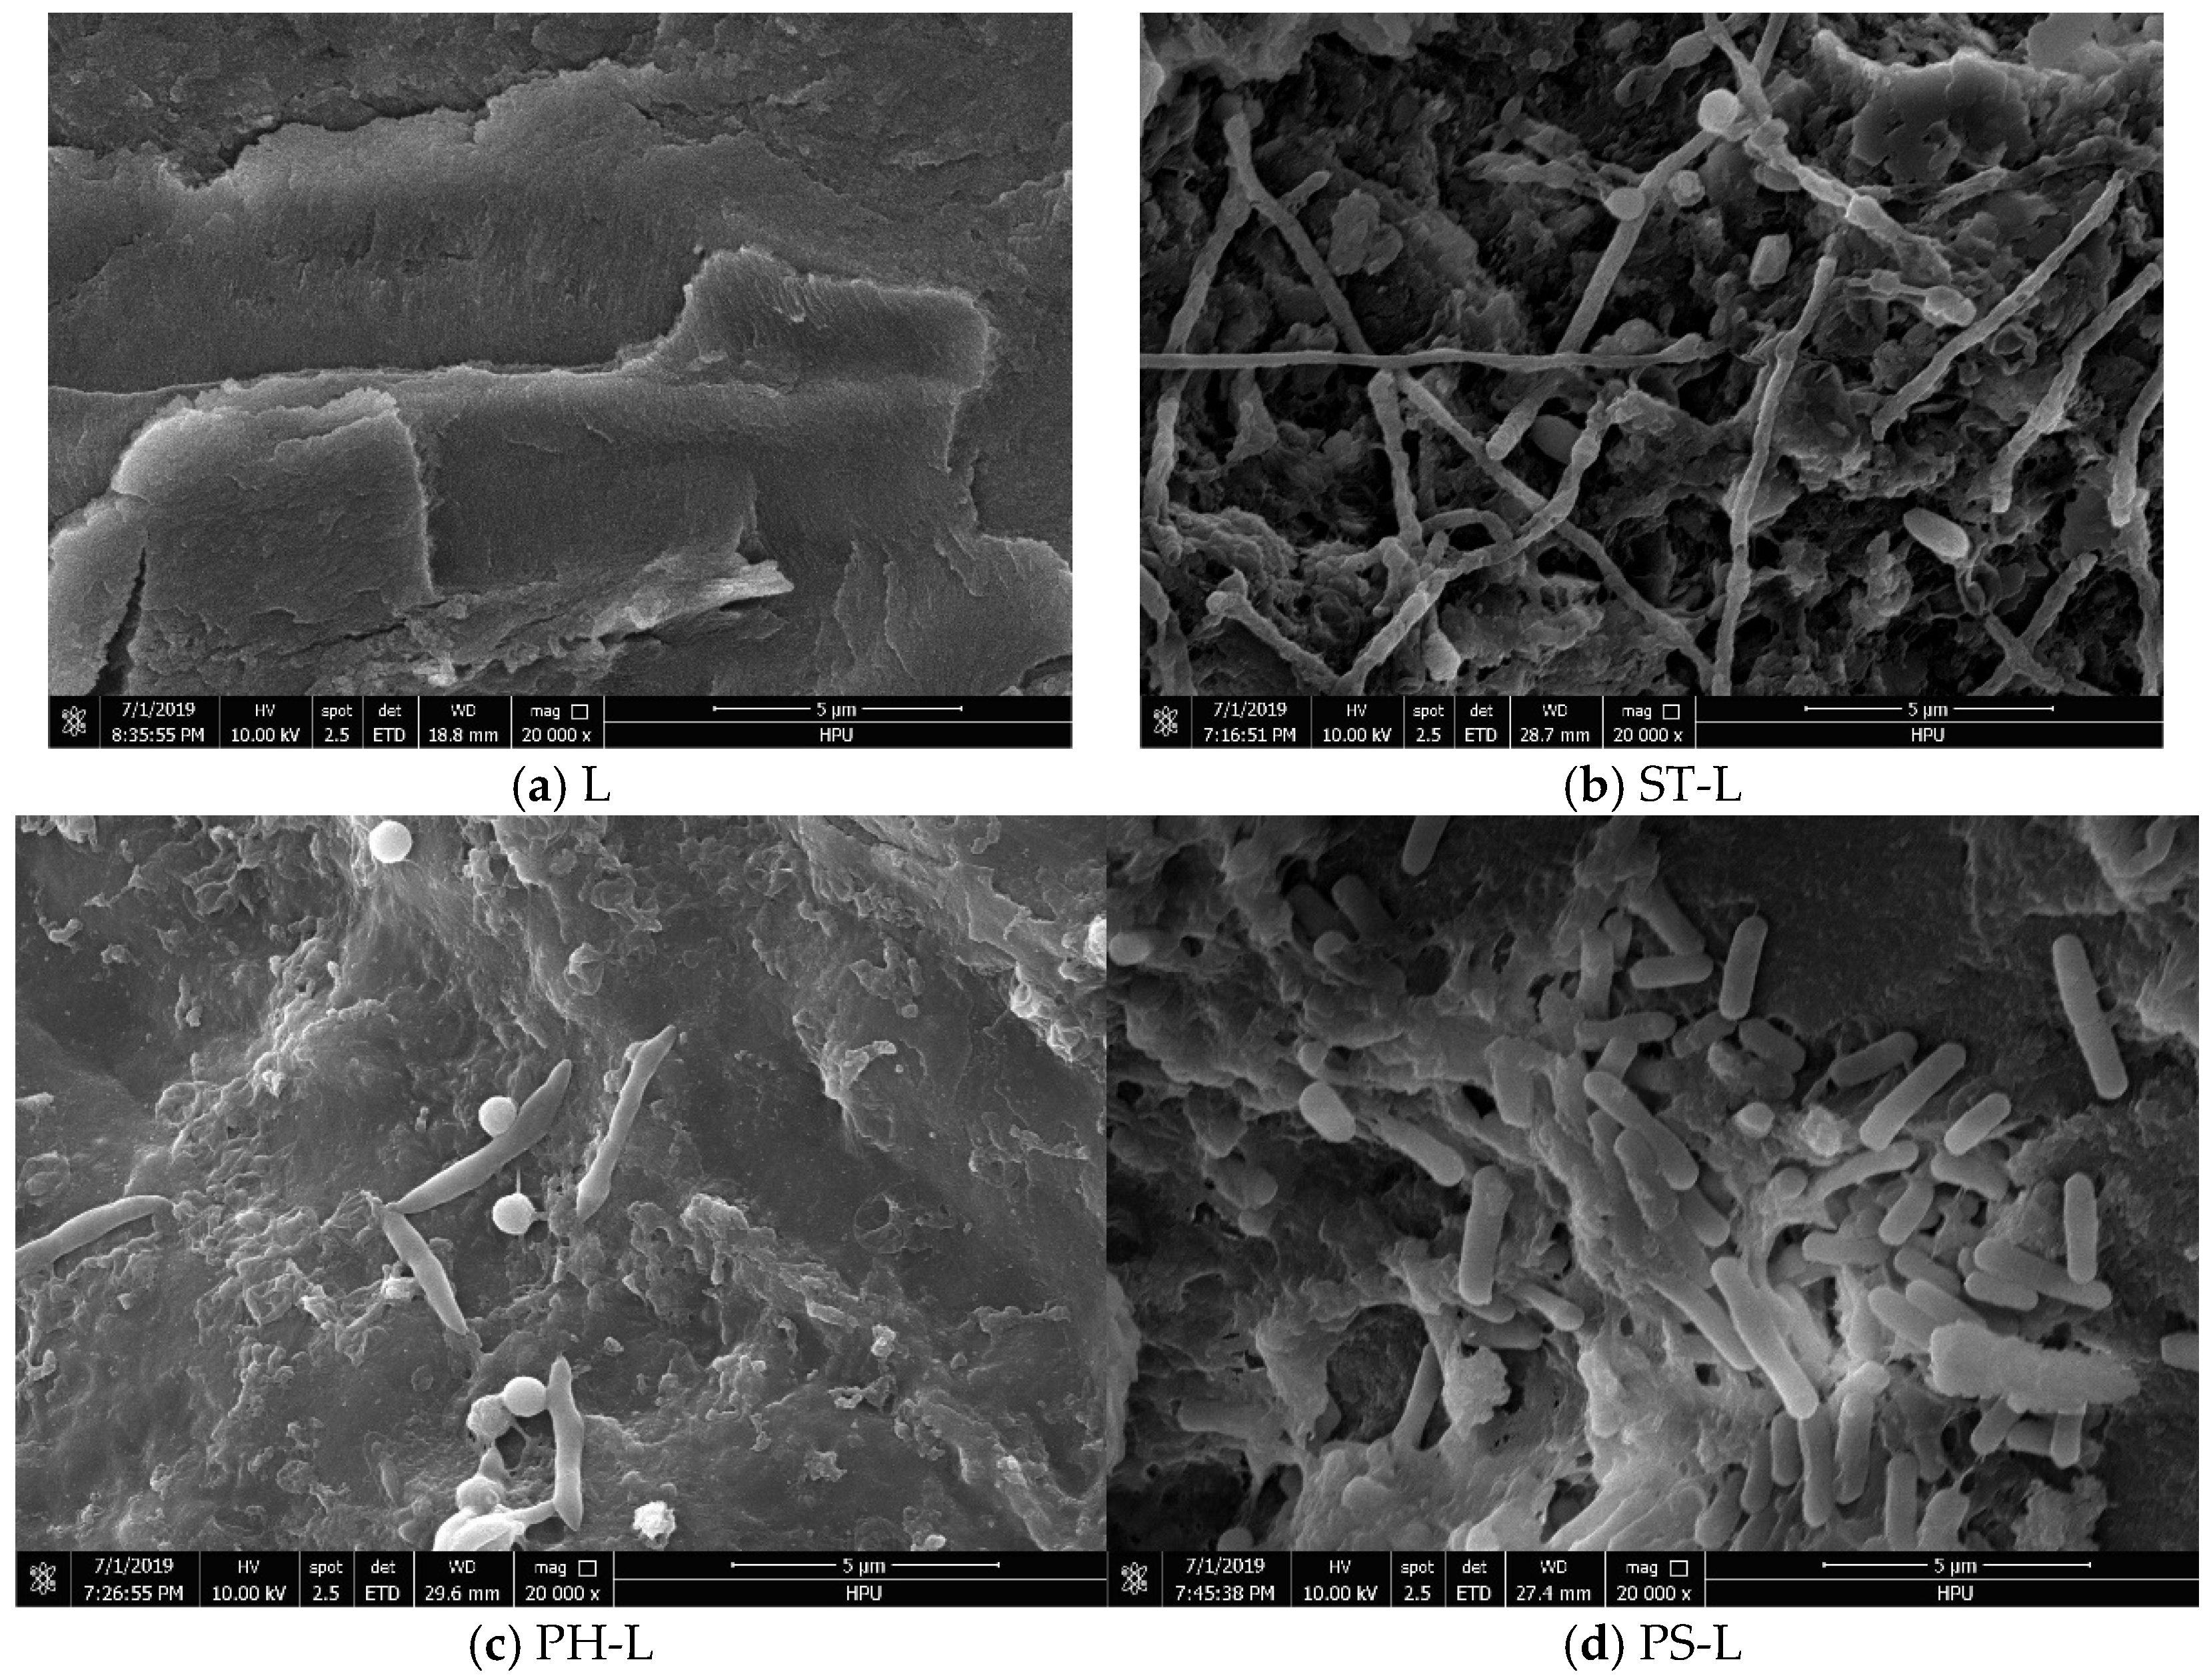
The surface of the raw lignite sample (L) appeared smooth and relatively flat, with few visible pores or fractures (Figure 4a). In contrast, lignite samples pre-treated with the three different microorganisms exhibited markedly increased surface roughness, forming irregular and uneven textures with significantly more pores and microcracks(Figure 4b–d). These morphological changes observed in SEM images are consistent with the pore structure parameters obtained from low-temperature nitrogen adsorption measurements, which indicated a reduction in macropore volume and specific surface area after microbial pre-treatment. This suggests that microbial activity contributed to the fragmentation and internal restructuring of the coal surface, creating more favorable conditions for subsequent biodegradation and methane production.

4. Conclusions

The anaerobic methane metabolism of lignite pre-treated with three different microorganisms exhibited varying degrees of improvement in cumulative biogas yield and CH4 concentration compared to raw lignite. Among the treatments, the coal pre-treated with Pseudomonas showed the highest methane production performance, followed by those treated with Phanerochaete chrysosporium and Streptomyces viridigriseus. Correspondingly, the H/C atomic ratios of the pre-treated coal samples followed the same trend—highest in the Pseudomonas-treated lignite (PH-L), followed by ST-L and PS-L—indicating a positive correlation between H/C ratio and methane production efficiency. Additionally, microbial pre-treatment altered the physical structure of the coal as both macropore volume and specific surface area decreased to varying extents, which may have provided more favorable conditions for subsequent anaerobic fermentation by methanogenic consortia.

Author Contributions

Conceptualization, Y.L., H.G. and Q.X.; Methodology, Z.W. (Zebin Wang); Software, G.Z.; Validation, S.W.; Formal analysis, B.Z.; Investigation, X.B. and S.R.; Writing—original draft, Z.Z.; Writing—review & editing, Y.L. and H.Y.; Visualization, Z.W. (Zheng Wang); Funding acquisition, H.G. All authors have read and agreed to the published version of the manuscript.

Funding

This work was supported by the Key Scientific Research Project of Colleges and Universities in Henan Province (23ZX015); the National Natural Science Foundation of China (42172195, 42372202, 42172199); the Xinjiang Key R&D Task Project (2024B03002); and the Double First-Class Initiative for Safety Discipline Construction Project (AQ20240302).

Data Availability Statement

The original contributions presented in this study are included in the article. Further inquiries can be directed to the corresponding author.

Conflicts of Interest

Authors Yongchen Li and Zebin Wang were employed by the company PetroChina Coalbed Methane Co., Ltd. The remaining authors declare that the research was conducted in the absence of any commercial or financial relationships that could be construed as a potential conflict of interest.

References

  1. Wen, Z.; Yu, Y.; Yan, J. Best available techniques assessment for coal gasification to promote cleaner production based on the ELECTRE-II method. J. Clean. Prod. 2016, 129, 12–22. [Google Scholar] [CrossRef]
  2. Keboletse, K.P.; Ntuli, F.; Oladijo, O.P. Influence of coal properties on coal conversion processes-coal carbonization, carbon fiber production, gasification and liquefaction technologies: A review. Int. J. Coal Sci. Technol. 2021, 8, 817–843. [Google Scholar] [CrossRef]
  3. Xu, T.; Wu, Y.; Bhattacharya, S. Release of nitrogen and sulphur species from low-rank coal during entrained flow pyrolysis and gasification. J. Anal. Appl. Pyrolysis 2022, 168, 105741. [Google Scholar] [CrossRef]
  4. Scott, A.R. Improving coal gas recovery with microbially enhanced coalbed methane. In Coalbed Methane: Scientific, Environmental and Economic Evaluation; Springer: Dordrecht, The Netherlands, 1999; pp. 89–110. [Google Scholar]
  5. Flores, R.M.; Rice, C.A.; Stricker, G.D.; Warden, A.; Ellis, M.S. Methanogenic pathways of coal-bed gas in the Powder River Basin, United States: The geologic factor. Int. J. Coal Geol. 2008, 76, 52–75. [Google Scholar] [CrossRef]
  6. Vinson, D.S.; Blair, N.E.; Martini, A.M.; Larter, S.; Orem, W.H.; McIntosh, J.C. Microbial methane from in situ biodegradation of coal and shale: A review and reevaluation of hydrogen and carbon isotope signatures. Chem. Geol. 2017, 453, 128–145. [Google Scholar] [CrossRef]
  7. Feng, X.; Sun, J.; Xie, Y. Degradation of Shanxi lignite by Trichoderma citrinoviride. Fuel 2021, 291, 120204. [Google Scholar] [CrossRef]
  8. Li, X.-H.; Li, H.-J.; Wang, R.-Q.; Feng, J.; Li, W.-Y. Acid pretreatment effect on oxygen migration during lignite pyrolysis. Fuel 2020, 262, 116650. [Google Scholar] [CrossRef]
  9. Zhang, D.; He, H.; Ren, Y.; Haider, R.; Urynowicz, M.; Fallgren, P.H.; Jin, S.; Ishtiaq Ali, M.; Jamal, A.; Huang, Z.; et al. A mini review on biotransformation of coal to methane by enhancement of chemical pretreatment. Fuel 2022, 308, 121961. [Google Scholar] [CrossRef]
  10. Zhang, Z.; Yan, G.; Zhu, G.; Zhao, P.; Ma, Z.; Zhang, B. Using microwave pretreatment to improve the high-gradient magnetic-separation desulfurization of pulverized coal before combustion. Fuel 2020, 274, 117826. [Google Scholar] [CrossRef]
  11. Li, Y.; Tang, S.; Chen, J.; Zhang, S. A review on microbial metabolism to increase coalbed methane generation and coal pretreatment to improve its bioavailability. Front. Earth Sci. 2023, 17, 218–229. [Google Scholar] [CrossRef]
  12. Xia, D.; Niu, Y.; Tian, J.; Su, X.; Wei, G.; Jian, K.; Wang, Z.; Zhang, Y.; Zhao, W. Degradation metabolic pathway of low-rank coal using single hydrolytic bacteria. Fuel 2024, 364, 130917. [Google Scholar] [CrossRef]
  13. Dong, Z.; Guo, H.; Zhang, M.; Xia, D.; Yin, X.; Lv, J. Enhancing biomethane yield of coal in anaerobic digestion using iron/copper nanoparticles synthesized from corn straw extract. Fuel 2022, 319, 123664. [Google Scholar] [CrossRef]
  14. GB/T 31391-2015; Ultimate Analysis of Coal. General Administration of Quality Supervision, Inspection and Quarantine of the People’s Republic of China: Beijing, China; China Coal Industry Press: Beijing, China, 2015.
  15. Wang, B.; Yu, Z.; Zhang, Y.; Zhang, H. Microbial communities from the Huaibei Coalfield alter the physicochemical properties of coal in methanogenic bioconversion. Int. J. Coal Geol. 2019, 202, 85–94. [Google Scholar] [CrossRef]
  16. Zhang, J.; Anderson, K.; Britt, D.; Liang, Y. Sustaining biogenic methane release from Illinois coal in a fermentor for one year. Fuel 2018, 227, 27–34. [Google Scholar] [CrossRef]
  17. Dong, X.; Wang, F.; Guo, L.; Han, T.; Dong, X.; Hu, X. The inhibitory effect of microbes on coal spontaneous combustion. Fuel 2024, 375, 132658. [Google Scholar] [CrossRef]
  18. Li, D.; Bao, Y.; Wang, Y.; An, C.; Chang, J. Multiple-experimental investigation on the physicochemical structures alternation during coal biogasification. Fuel 2023, 339, 127433. [Google Scholar] [CrossRef]
  19. Bao, Y.; Li, Z.; Meng, J.; Chen, X.; Liu, X. Reformation of coal reservoirs by microorganisms and its significance in CBM exploitation. Fuel 2024, 360, 130642. [Google Scholar] [CrossRef]
  20. Liu, S.; Wang, W.; Zhu, W.; Li, T.; Liu, Z.; Yang, H.; Liu, J. Effects of indigenous microorganisms on the CO2 adsorption capacity of coal. Chem. Eng. J. 2024, 500, 156894. [Google Scholar] [CrossRef]
  21. Zheng, C.; Li, J.; Xue, S.; Jiang, B.; Liu, B. Experimental study on changes in components and pore characteristics of acidified coal treated by organic solvents. Fuel 2023, 353, 129215. [Google Scholar] [CrossRef]
  22. Haider, R.; Ghauri, M.A.; Rahim, M.U. On Comparison Between Fungal and Bacterial Pretreatment of Coal for Enhanced Biogenic Methane Generation. Geomicrobiol. J. 2018, 35, 432–437. [Google Scholar] [CrossRef]
  23. Xia, D.; Lv, H.; Chen, Z.; Chen, H.; Su, P. Bioconversion of coal to Biogas: Insights into the microbial degradation mechanisms and molecular structure transformations. Chem. Eng. Sci. 2025, 312, 121706. [Google Scholar] [CrossRef]
  24. Li, S.; Xia, D.; Chen, Z.; Zhao, W.; Chen, L.; Lin, J. Experimental study on the change of coal structure and microbial community structure during supercritical-CO2-H2O-microorganisms-coal interaction process. Environ. Technol. Innov. 2023, 30, 103036. [Google Scholar] [CrossRef]
  25. Guo, H.; Li, Y.; Wang, Q.; Zhao, W.; Jia, J.; Lv, J.; Liu, S.; Xia, D. Feasibility analysis of the in situ conversion of biomethane in surface weathered coal. Fuel 2020, 268, 117273. [Google Scholar] [CrossRef]
  26. Zhao, W.; Su, X.; Xia, D.; Hou, S.; Wang, Q.; Zhou, Y. Enhanced coalbed methane recovery by the modification of coal reservoir under the supercritical CO2 extraction and anaerobic digestion. Energy 2022, 259, 124914. [Google Scholar] [CrossRef]
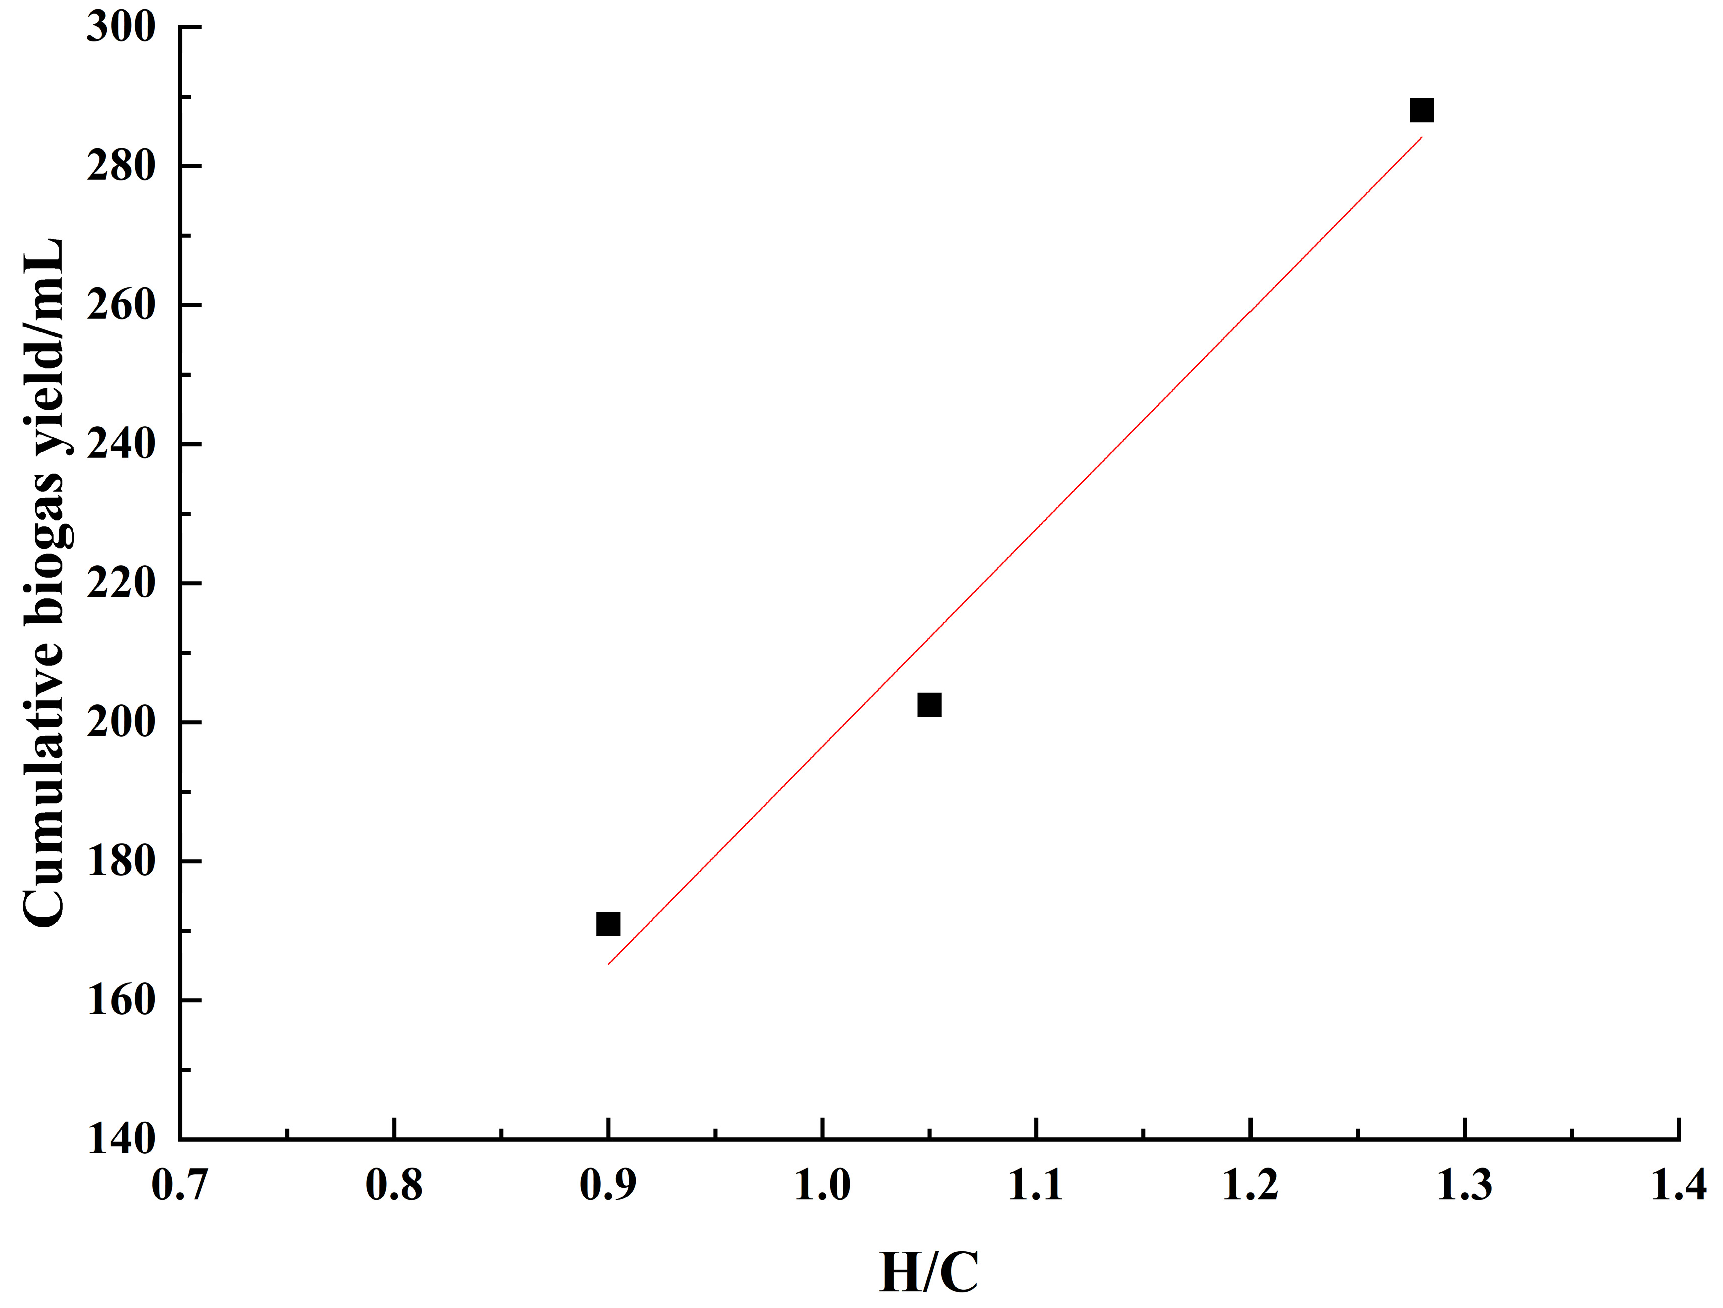
Figure 1. Linear correlation between cumulative gas production and H/C atomic ratio.
Processes 13 02581 g001
Figure 2. Absorbance spectra of raw lignite and pre-treated lignite samples. (1. Free O–H stretching, 2. Broad O–H stretching, 3. N–H stretching vibrations, 4. Asymmetric stretching of methyl (–CH3), 5. Asymmetric stretching of methylene (–CH2–), 6. Symmetric stretching of methylene (–CH2–), 7. C=O (–COOH) stretching, 8. Aromatic C=C stretching, 9. Asymmetric deformation of methyl (–CH3), 10. C–C(=O)–O stretching, 11. C–H stretching of aldehyde, 12. Out-of-plane bending of aromatic C–H, 13. Out-of-plane bending of O–H in alcohols and phenols).
Processes 13 02581 g002
Figure 3. Mercury intrusion–extrusion curves of gas-producing lignite samples.
Processes 13 02581 g003
Figure 4. SEM images of raw lignite and pre-treated lignite samples.
Processes 13 02581 g004
Table 1. Basic information of the lignite.
SampleRo,ran%Mad/%Aad/%Vad/%FCad/%Cdaf%Hdaf%Odaf%Ndaf%Sdaf%
Lignite0.437.4610.7144.5837.2540.434.4021.470.401.34
M, moisture; A, ash yield; V, volatile matter; FC, fixed carbon; ad, air-dry basis.
Table 2. Basic information of selected strains.
StrainsPhylumClassOrderFamilyGenusStrain SourceCulture Medium
Streptomyces viridosporusActinobacteriotaActinomycetesActinomycetalesStreptomycetaceaeStreptomycesCGMCC 4.17700038 ISP-2 medium
Phanerochaete chrysosporiumBasidiomycotaAgaricomycetesPolyporalesPhanerochaetaceaeWhite rot fungiBNCC336257Comprehensive potato medium
PseudomonasProteobacteriaGammaproteobacteriaPseudomonadalesPseudomonadaceaePseudomonasGSICC 31603CM0841 culture medium
Table 3. Sample information.
Sample NumberSample Information
LLignite
ST-LStreptomyces viridosporus + Lignite
PH-LPhanerochaete chrysosporium + Lignite
PS-LPseudomonas + Lignite
Table 4. Biological gas production results of different lignite samples.
Sample NumberTotal Gas
Production/mL
CH4 Concentration/%Concentration of Other Gas/%CH4 Generation/mL
L151.5034.5465.4652.33
ST-L202.5035.3764.6371.62
PH-L288.0048.2051.80138.82
PS-L171.0051.7748.2388.53
Table 5. Ultimate analysis results of samples.
Sample NumberC%H%O%N%S%H/C Atomic
Ratio
O/C Atomic
Ratio
L40.434.4021.470.401.341.310.40
ST-L58.255.0820.460.8301.050.26
PH-L58.836.2719.591.3701.280.25
PS-L71.805.4120.021.4000.900.21
Table 6. Basic parameters of mercury pressing experiments.
Sample NumberPorosity/%Total Intrusion Volume/mL/gTotal Hole Area/m2/gAverage Pore Size/nmStarting Pressure/kPaDiscontinuation Pressure/kPa
L15.01530.13163.378346.00.689414,300
ST-L14.93030.13142.986555.10.689414,300
PH-L14.66210.12844.879167.70.689413,400
PS-L15.10880.12717.08871.70.689414,300
Table 7. Pore volume and pore volume ratio of different coal samples with different pore sizes.
Sample NumberMacropore
cm3·g−1
Ratio
%
Mesopore
cm3·g−1
Ratio
%
Small Pores cm3·g−1Ratio %Micropore
cm3·g−1
Ratio
%
Total cm3·g−1
L0.071053.950.034926.520.025719.530.00000.000.1316
ST-L0.064048.710.041131.280.026320.020.00000.000.1314
PH-L0.065651.090.032425.230.029623.050.00080.620.1284
PS-L0.059646.890.030724.150.031524.780.00534.170.1271
Table 8. Specific surface area and specific surface area ratio of different lignite samples with different pore sizes.
Sample NumberMacropore m2/gRatio/%Mesopore m2/gRatio/%Small Pore m2/gRatio/%Micropore m2/gRatio/%Total
L0.0381.120.3109.183.03089.700.0000.003.378
ST-L0.0451.510.33211.122.60987.370.0000.002.986
PH-L0.0340.700.2885.904.23386.760.3246.644.879
PS-L0.0300.420.3384.774.47163.082.24931.737.088
Disclaimer/Publisher’s Note: The statements, opinions and data contained in all publications are solely those of the individual author(s) and contributor(s) and not of MDPI and/or the editor(s). MDPI and/or the editor(s) disclaim responsibility for any injury to people or property resulting from any ideas, methods, instructions or products referred to in the content.