Abstract
Kerogen micropores in shale are crucial for gas sorption; nevertheless, their formation and evolution have been insufficiently studied. To qualitatively and quantitatively analyze changes in the molecular structure and associated micropores of kerogen throughout natural maturation, a series of experiments were performed on collected kerogen samples with varying maturity levels. The results demonstrated that the evolution of the chemical structure and associated micropores of kerogen can be divided into three stages during thermal evolution. When Ro < 1.43%, micropores are primarily controlled by the aliphatic composition of kerogen, resulting in a reduction in the micropore volume with decreasing numbers of aliphatic functional groups. When 1.43% < Ro < 1.93%, the micropore structure is primarily governed by the aromatic composition of kerogen and the micropore volume exhibits a gradual increment with increasing aromatic ring size. When Ro > 1.93%, the micropore volume rapidly increases with increasing aromatic composition of kerogen, and the aromatic rings become more orderly. Moreover, molecular simulations also show that the adsorption curves of CO2 and CH4 are type I isotherms, and that the adsorption capacity of CO2 is greater than that of CH4 under the same conditions, which indicates that the microscopic adsorption mechanism of CH4 and CO2 is gas competitive adsorption. This research offers new perspectives on the formation and evolution of kerogen micropores, and the carbon sequestration process.
1. Introduction
The environmental problems caused by excessive CO2 emissions are seriously threatening the survival of all humanity [1]. The shale and coal reservoirs have been proposed as potential targets for long-term CO2 sequestration [2,3]. Moreover, injecting CO2 into shale reservoir also could displace adsorbed CH4, thereby enhancing shale gas recovery (CO2-ESGR) [4,5]. Micropores related to kerogen in shale are important components of shale pore systems and the primary sites for CH4 desorption and CO2 sequestration, with its structure mainly determined by the chemical structure evolution of kerogen [6,7,8,9]. However, there remains insufficient knowledge of the detailed changes in the molecular structure and associated micropores of kerogen during the maturation process, as well as the competitive adsorption mechanism of CH4 and CO2 in kerogen.
Various analytical techniques have been used to elucidate the changes in the kerogen structure, including Fourier-transform infrared (FTIR) and 13C solid-state nuclear magnetic resonance (13C SSNMR) spectroscopy [10,11,12,13,14,15]. The relative abundance of various functional groups that include carbon, hydrogen, and oxygen can be detected in FTIR spectra (e.g., -C-H, O-H, C=C, and C=O). Moreover, 13C SSNMR generally provides information regarding the bond environment and connectivity of aromatic carbons, aliphatic carbons, and their subgroups [10,11,14]. High-resolution transmission electron microscopy (HRTEM) is another practical technique that provides quantitative and qualitative details regarding the aromatic composition of kerogen. Compared with other spectral analysis methods, HRTEM can be used to directly observe the nanoscale structure of carbonaceous materials; hence, it is extensively utilized in the examination of molecular structure alterations in kerogen during thermal evolution [6,16,17,18]. In recent years, scientists have come to understand that kerogen comprises different large molecular components, leading to the use of diverse methods to examine the alterations in the molecular composition of kerogen [10,11,15]. Kerogen-associated micropores in shale reservoirs are important for shale gas/oil adsorption and migration [19,20,21,22], significantly contributing to the total pore volume and total specific surface area [23,24]. Moreover, these micropores are directly related to thermal maturity levels and are controlled by the type and molecular structure of kerogen [6,7,25]. However, the relationships between thermal maturity levels, molecular structure, and kerogen-associated micropores during thermal evolution remain insufficiently understood.
Previous researchers have always conducted physical experiments to investigate the competitive adsorption behavior of CO2 and CH4 under in situ conditions [4,5]; however, these experiments do not reflect the conditions of real shale gas reservoirs. Considering that commercial shale gas reservoirs are always buried at more than 2000 m depth, previous studies on CH4 and CO2 comparative adsorption are not sufficient to accurately, directly, and comprehensively represent the competitive adsorption behavior in practice [26,27]. Nowadays, researchers mainly use molecular simulations to study competitive adsorption and have achieved fruitful results [1,3]. It is worth mentioning that, although many efforts have been made to ensure the rationality of kerogen molecular structure, it is necessary to validate these structures by comparing simulated adsorption isotherms with experimental data. In fact, the microscopic adsorption mechanisms of CH4 and CO2 in relation to gas competitive adsorption behavior on different mature kerogens have not been investigated.
Herein, we collected kerogen samples of varying maturity levels and qualitatively and quantitatively analyzed the chemical structure via FTIR, 13C SSNMR, and HRTEM. And CO2 adsorption experiments were conducted to characterize the micropore properties of the kerogen samples. Based on the collected data, changes in the molecular and pore structures of kerogen during thermal evolution were comprehensively analyzed. Finally, molecular simulations were implemented using the Materials Studio software 2020 (MS simulation, Hohhot, China, Inner Mongolia University of Technology) to investigate the microscopic mechanisms of CH4 and CO2 comparative adsorption. This research offers new perspectives on CO2 injection into shale gas reservoirs to improve CH4 recovery and the carbon sequestration process.
2. Samples and Methods
2.1. Sample Preparation
To enhance experimental comparability, seven shale samples with varying maturity levels were collected from the Nanjiang Formation (NJ-1) in the upper Cretaceous (located in Songliao Basin), the Dalong Formation (DL-1) in the lower Permian, the Longmaxi Formation (LJ-1, HP-17, ZP-16, BL-26) in the lower Silurian, and the Lujiaping Formation (LT-25) in the lower Cambrian (located in Sichuan Basin) (Figure 1). The purple–red and green continental mudstones from the NJ Formation were deposited in deep and semi-deep lacustrine facies during the depressional stage of the basin [28], and a major sea-level transgression stage led to the deposition of organic-rich, black, marine shale in deep-water shelf facies in the DL, LMX, and LJP Formations [29,30,31,32]. The shale samples exhibited total organic carbon levels of > 2.00%, with some reaching as high as 10%. In addition, thermal maturity levels significantly differed among samples, with vitrinite reflectance (Ro) values ranging from 0.89% to 3.03%. Samples from the NJ and DL Formations had low maturity levels, while those from the LMX and LJP Formations had high maturity levels. Kerogen extraction from these shale samples was performed using chemical techniques described by Lis et al. [33].
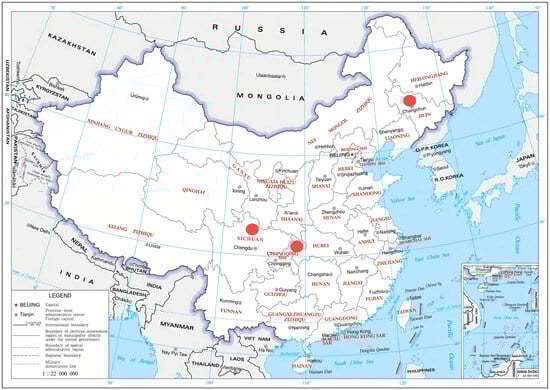
Figure 1.
Shale sample collection sites in major basins in China. Map created by the Ministry of Natural Resources of the People’s Republic of China.
2.2. Raman Spectroscopy
RS analysis of the isolated kerogen samples was performed as described in Song et al. in the 45–4500 cm−1 region with a 532 nm wavelength and 2 s integration time using a Sentera Raman spectrometer (Bruker, Berlin, Germany) [34]. The laser was adjusted to a power of 5 milliwatts to avoid the occurrence of coking [35]. The experiment was repeated five times to ensure the representative results, and Ro values were calculated from RS spectra using the method proposed by Liu et al. [36].
2.3. FTIR Spectroscopy
FTIR experiments were performed on a Vertex 80v FTIR device (Bruker, Xuzhou, China, China University of Mining and Technology). Prior to analysis, each kerogen sample was pulverized to a fine powder (<200 mesh) and combined with KBr (60 mg) for sample preparation. Then, the blend was positioned on a vacuum-sealed disk measuring approximately 10 mm in diameter. The FTIR spectrum of the disk sample was recorded at a resolution of 0.06 cm−1 in the 500–4000 cm−1 wavenumber range.
2.4. Solid-State 13C SSNMR
13C SSNMR analysis was performed using an Avance III 400 spectrometer (Bruker) with operating frequencies of 400 MHz 1H and 100 MHz 13C. Each kerogen powder sample (<200 mesh) was loaded into a dual-resonance probe with a 4 mm ZrO2 rotor and centrifuged at 5 kHz. The 13C cross-polarized magic-angle spinning (CP-TOSS/MAS) technique was employed to obtain the kerogen structure and suppress sidebands [37,38]. The SSNMR experiment was carried out at a speed of 4 kHz and contact time of 1 ms.
2.5. HRTEM
HRTEM has the capability to visualize the multiscale organization of kerogen at the nanometer level. In this study, HRTEM tests were carried out using a G2 F20 Field Emission Electron Microscope (Tecnai, Hillsboro, OR, USA) equipped with an advanced aberration corrector and CCD camera. Prior to observation, the TEM grid was prepared as follows: The kerogen powder was crushed and dispersed in absolute ethanol, and the resulting suspension was placed on a high-quality 200-mesh copper microgrid and left to dry. In order to avoid possible interference caused by the support film of quasi-amorphous carbon and overlapping kerogen particles, the particles were imaged in a thin area of <10 nm.
Following the procedure proposed by Liu et al. [23], image analysis was performed on several representative HRTEM images of each kerogen sample. Adobe Photoshop software 2020 (Adobe Systems Incorporated, San Jose, CA, USA) was utilized to process the image by adjusting the threshold to reduce the background noise. Subsequently, the lattice fringe coordinate data were extracted using Mapgis 6.7 software (China University of Mining and Technology, Xuzhou, China), enabling the calculation of fringe length and fringe angle distribution. Over the past decade, Mathews and coworkers have developed, adapted, and applied many advanced HRTEM lattice fringe analysis techniques [16,39,40,41,42], with the present study referring to the assignments of different lattice fringes proposed by these researchers. More detailed information about these assignments can be found in the study by Van Niekerk and Mathews [40].
2.6. Low-Pressure CO2 Physisorption Analyses
Low-pressure gas physisorption analysis is commonly used to evaluate the pore structure of shale reservoirs [19,43]. Following the procedure outlined by Shang et al. [44], after initial evacuation under high vacuum at approximately 80 °C for >10 h, the CO2 adsorption isotherms of isolated kerogen samples were measured at 0 °C (273 K) using an ASAP 2020 HD88 analyzer (Micromeritics Instrument Corp., Norcross, GA, USA). To investigate the distribution of micropore size in the kerogen samples, the CO2 isotherm data were analyzed using the density functional theory (DFT) approach [45,46].
2.7. Molecular Simulation
In this work, we selected three kerogen samples of different maturity levels and established the three-dimensional molecular structure based on derived structure parameters from the FTIR spectroscopy and 13C NMR spectroscopy using the method proposed by Liu et al. [47]. We then simulated the isothermal adsorption behavior of CO2 and CH4 in the kerogen model use the Sorption module in MS software 2020. Regarding the simulation details, the grand canonical Monte Carlo (GCMC) simulations with a COMPASS force field were used. For each test condition, we selected ultra-fine quality and performed 1 × 10⁶ equilibrium steps to ensure the adsorption state, while adopting 1 × 10⁷ steps in the production stage to quantify gas adsorption capacity, with Fugacity steps set to 10. Forcefield assigned was used to calculate charges (the charge distribution of the molecular force field). Atom based was chosen to calculate electrostatic and van der Walls forces, but due to different molecular polarities, Ewald and Group was chosen for calculating electrostatic forces when adsorbing CO2. The pressure and temperature ranges were 0.001–15 MPa and 0–100 °C, representing the conditions of shale gas reservoirs.
3. Results and Discussion
3.1. Changes in the Molecular Structure of Kerogen
RS is widely recognized for its ability to analyze the chemical composition of geological carboniferous substances [13,17,35]. Thermal evolution is often considered to have a strong correlation with Raman parameters (i.e., separation between the D and G bands), which is particularly suitable for evaluating the maturity levels of organic matter in shale with Ro = 0.50–3.50%. Accordingly, RS was employed herein to determine the maturity levels of various kerogen samples. The Raman spectra of kerogen samples exhibited the typical presence of D1 and G broad bands, located at approximately 1345 and 1590 cm−1, respectively (Figure 2). Separation between the D and G bands gradually increases during thermal evolution, which is the basic principle underlying the use of the extent of separation to calculate maturity levels, as proposed by Liu et al. [36]. According to the thermal evolution stages proposed by Ko et al. [21], the NJ-1 and LJ-1 samples were in the low-maturity stage, while the LJ-1, HP-17, ZP-16, BL-26, and LT-25 samples were in the over-mature stage.
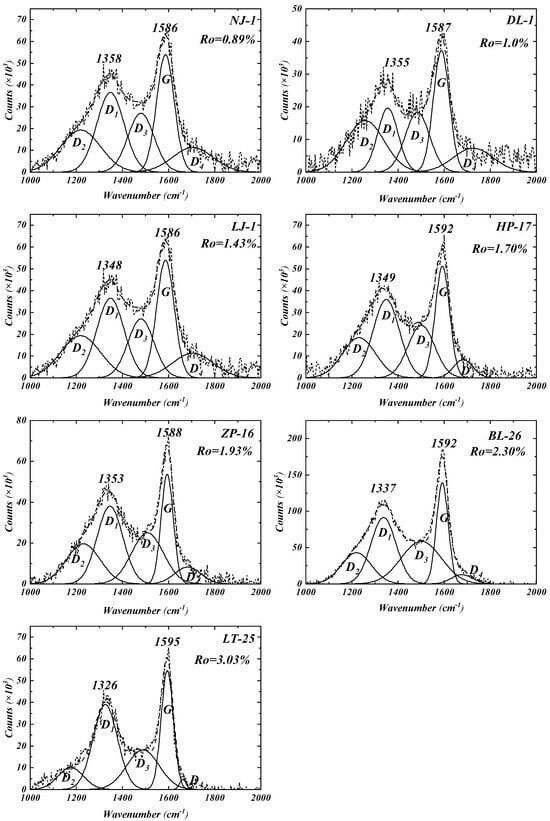
Figure 2.
Raman spectra and fitting curves for extracted kerogen samples. The dotted line is the test curve, and the solid line is the fitting curve.
Figure 3 shows the FTIR spectra and 13C SSNMR curves of kerogen samples with different maturities. Several typical absorbance peaks exist in the FTIR spectra of the kerogen samples: aliphatic -C-H at 2920 cm−1, 2850 cm−1 and 1450 cm−1; aromatic C=C at 1700 cm−1 and 1600 cm−1: and aromatic out-of-plane -C-H at 700–900 cm−1 (Figure 3a). For the kerogen samples with low maturity (NJ-1 and DL-1), peaks in the region 2920 cm−1 and 2850 cm−1 are presented as these kerogen samples contain some aliphatic side chains.
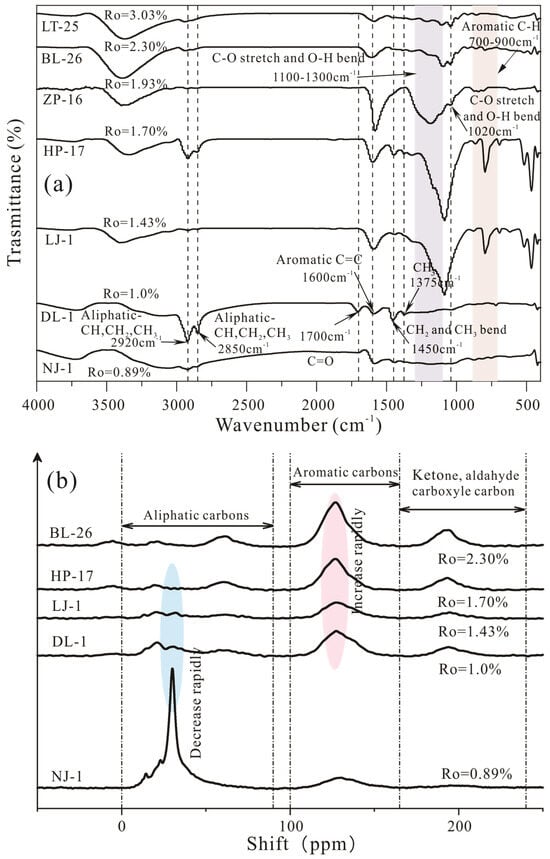
Figure 3.
FTIR spectra (a) and 13C SSNMR curves (b) of kerogen samples.
In addition, the 13C SSNMR spectra show that for the NJ-1 samples, the area of peaks in the aliphatic parts are greater than those in the aromatic parts, which also implies that more aliphatic carbons exist within the kerogen structure. With the continuous hydrocarbon generation (Ro from 1.0% to 3.03%), the intensities of the aliphatic -C-H (2920 cm−1, 2850 cm−1 and 1450 cm−1) peak in the FTIR spectra, and the aliphatic parts (0–90 ppm) in the 13C SSNMR spectra nearly disappeared, which implies that a large amount of aliphatic functional groups and oxygen-containing groups were tailored downward from the kerogen macromolecular structure.
13C SSNMR parameters were calculated through the peak fitting method [38,48]. Based on Figure 4, different types of carbon atoms in the molecular structure of kerogen usually evolve in a two-stage process during thermal evolution, and the jump point is about 1.43% Ro. It is clear that aliphatic carbon parameters (fraction of aliphatic CH4 or CH2) and (fraction of aliphatic CH3 or quaternary carbon) both decrease first and then vary slightly with an increase in maturation, suggesting that aliphatic structures fall off from the chemical structure of kerogen during the thermal evolution.
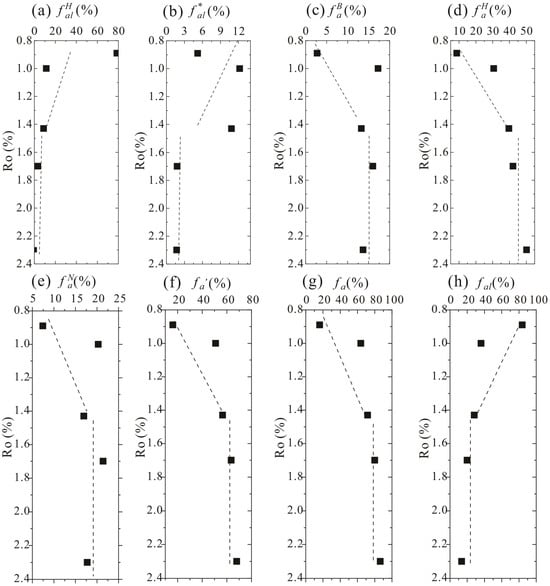
Figure 4.
Relative contents of methylene/methine (a), methyl (b), bridged aromatic carbon (c), protonated aromatic carbon (d), non-protonated aromatic carbon (e), aromatic carbon (f), total aromatic carbon (g), and total aliphatic carbon (h) in kerogen samples with different maturities [48]. The black dots represent the fitting results, and the dashed lines represent the trend lines.
Herein, we innovatively introduced the use of HRTEM to quantitatively characterize the aromatic rings of the kerogen structure, and combined it with spectral analyses to probe alterations in the kerogen molecular structure during natural evolution. The kerogen structure evolution can be divided into three stages based on the aforementioned results for Ro, ranging from 0.89% to 3.03% (Figure 5). For 0.89%< Ro < 1.43%, the aliphatic chains, naphthalene, and 2 × 2 rings experience rapid cracking from the kerogen structure, which was evidenced by a rapid decrease in the intensity of peaks at 20–50 ppm in the 13C SSNMR spectra and at 2850 and 2920 cm−1 in the FTIR spectra (Figure 3a). These trends were also supported by the HRTEM images in which the percentages of smaller aromatic rings greatly decreased within this interval, indicating the breakage of naphthalene and 2 × 2 rings from the kerogen structure (Figure 4). Previous studies have also confirmed that the significant decrease in aliphatic carbon content during this stage (0.89% < Ro < 1.76%) is accompanied by the generation of substantial amounts of C14+ oils and C6–14 hydrocarbons [49,50].
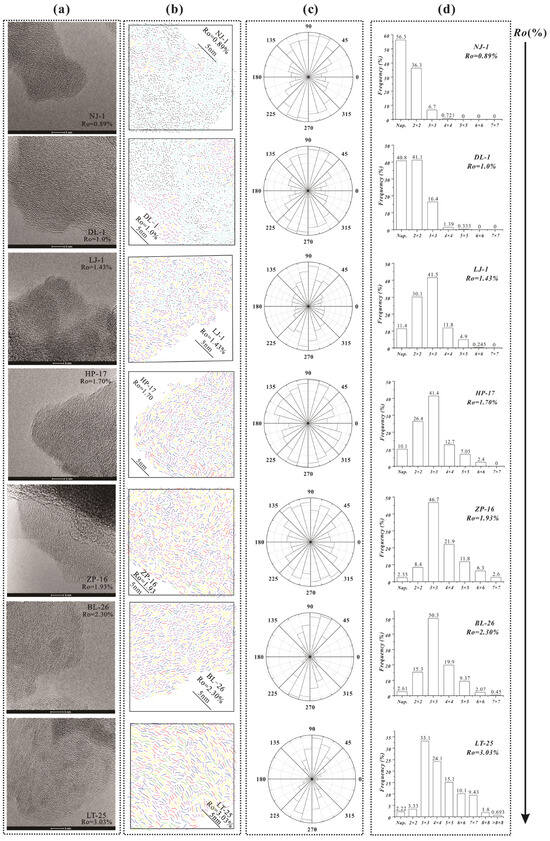
Figure 5.
HRTEM images (a), false color HRTEM images (b), statistical histogram of proportion of aromatic fringe content (c), and angle distribution of various sized aromatic rings (d) in kerogen samples with different maturities. The stripes of different colors represent aromatic rings of different sizes in (b).
For 1.43% < Ro < 1.93%, small aromatic ring-connected aliphatic structures formed into 3 × 3 rings through aromatization, as evidenced by the HRTEM images showing that the percentages of small-size aromatic rings (naphthalene and 2 × 2 rings) continued to decrease while that of 3 × 3 rings kept increasing. Meanwhile, the aliphatic carbon content continued to decrease, according to the SSNMR data, indicating a shedding of the aliphatic side chains at this time (Figure 3b). Previous studies also observed that kerogen molecular composition, structure, and properties change significantly when Ro = 1.8~2.0% and that the aliphatic components are mainly methyl groups connected to aromatic rings, with only small quantities of aliphatic chains [7,8,51].
For 1.93% < Ro < 3.03%, the hydrocarbon generation potential of kerogen was nearly nonexistent, but the aromatic carbon content varied dramatically. In this maturation period, 3 × 3 rings formed large aromatic rings through condensation, and their orientation was significantly enhanced. The HRTEM images also demonstrated that the 3 × 3 ring content declined, while that of larger aromatic rings (>3 × 3 rings) increased. In fact, Hou et al. believed that the kerogen structure evolution at this stage can be interpreted as molecular structural adjustment between aromatic rings. Hence, based on the above discussion, we speculate that kerogen slowly transforms into a turbostratic-like structure.
3.2. Relationship Between Chemical Structure Changes and Micropore Evolution During Maturation
Figure 6 illustrates the CO2 adsorption isotherms and pore volume change curves of kerogen samples of various maturities. It was found that the amounts of adsorbed CO2 differ among different kerogen samples (Figure 6a). LT-25 (Ro = 3.03%) has the largest CO2 adsorption amount, and NJ-1 (Ro = 0.89%) has the smallest CO2 adsorption amount. In reality, the relationship between CO2 adsorption amount and maturity was relatively complex, especially in the mature stage (Ro = 0.89~1.93%), which is closely related to the differential development of organic matter pores at various stages. Moreover, the variations in micropore volume were plotted against Ro, as shown in Figure 6b. From Ro = 0.89% to 3.03%, the micropore evolution can be divided into three stages: <1.43%, 1.43–1.93%, and 1.93–3.03%. When Ro < 1.43%, micropore volume decreases during the thermal evolution. When Ro = 1.43% to 1.93%, micropore volume gradually increases with increasing Ro. When Ro = 1.93% to 3.03%, micropore volume increases rapidly with increasing Ro. Moreover, it can be found that the micropore volumes of NJ-1 were relatively small and did not follow the trend of the first stage, perhaps due to differences in sources of organic matter [19,25,52,53].
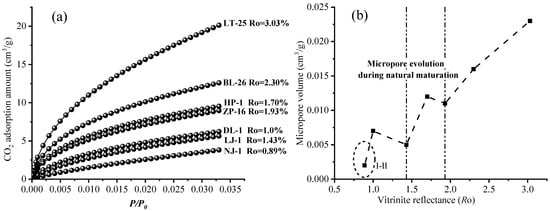
Figure 6.
(a) CO2 adsorption isotherms of kerogen samples with different maturity; (b) Variation in micropore volume of kerogen samples with different maturity.
To analyze the relationship between micropore parameters and kerogen composition, the variations in carbon atom content were plotted against the micropore parameters (Figure 7). Relatively few of the collected samples possessed a high aliphatic carbon content; hence, the correlation was not significant at high aliphatic carbon content (>50%) (Figure 6a). However, Duan et al. observed that aliphatic carbon content primarily controls kerogen-associated micropores within this interval, indicating that massive shedding of the aliphatic structures would lead to a significant reduction in the number of micropores [7]. When Ro was >1.43%, the aliphatic carbon content of kerogen was reduced, thus weakening the controlling effect of aliphatic structures on micropores, while the influence of other components on micropores was strengthened. These findings aligned with the outcomes of prior research conducted on coal and other kerogen samples [6,14].
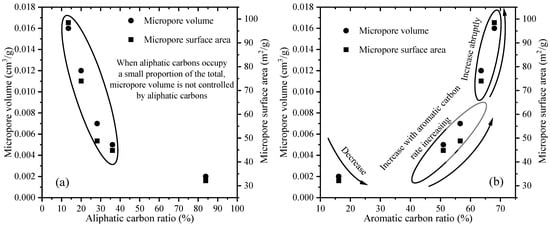
Figure 7.
Relationships between aliphatic carbon (a), aromatic carbon (b) and micropore parameters of kerogen samples with different maturities.
Variations in the aromatic carbon content and micropore parameters of kerogen samples with different maturity levels are shown in Figure 7b. When the aromatic carbon content was relatively low (few data), the correlation between aromatic carbon content and micropore parameters was not significant, but previous studies have observed that micropore volume decreases with increasing aromatic carbon content at this stage [7,24]. Since kerogen molecules are mainly composed of aliphatic carbons, the influence of aromatic structures on micropore parameters was masked by the significant loss of aliphatic structures. The aromatic carbon content continuously increased as thermal evolution continued, leading to changes in micropore volume that could be categorized into two distinct stages. During the first stage (aromatic carbon content of 45–58%), the micropore volume of kerogen generally increased with increasing aromatic carbon content, suggesting that these micropores were initially controlled by aromatic structures. In the second stage (aromatic carbon content of 58–70%), the micropore volume significantly increased with increasing aromatic carbon content, which may have been closely related to the formation of larger aromatic rings via the condensation of 3 × 3 rings.
Aromatic carbons comprise three distinct categories: alkylated aromatic carbons (), aromatic bridgehead carbons (), and protonated aromatic carbons (). Figure 8a–c show the direct relationship between micropore volume and protonated aromatic carbons, particularly when the aromatic structures comprised >50% of the overall composition. In contrast, there was not a clear relationship between micropore volume and alkylated aromatic carbon and aromatic bridgehead carbon contents (Figure 8a,b). In fact, low-maturity kerogen with a high alkylated aromatic carbon content usually also contained a large number of aliphatic structures, suggesting that aliphatic structures continued to mainly control the micropore volume at this stage. This may be responsible for the lack of correlation between alkylated aromatic carbon content and micropore volume. As thermal evolution progressed, the percentage of protonated aromatic carbons continuously increased. When the protonated aromatic carbon percentage was >30%, micropore volume increased with increasing protonated aromatic carbon percentage (Figure 8c), indicating that protonated aromatic carbons contributed to increased micropore abundance.
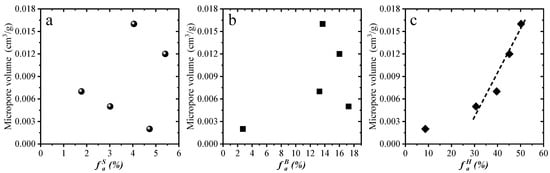
Figure 8.
Relationship between alkylated aromatic carbons, aromatic bridgehead carbons, protonated aromatic carbons and micropore volume.
3.3. Microscopic Mechanism of Methane Displacement by Carbon Dioxide
In the past, some studies have found that kerogen mainly contains various elements such as carbon, hydrogen, oxygen, nitrogen and sulfur [53,54]. However, some scholars have also pointed out that the content of nitrogen and sulfur elements in the kerogen of marine shale in southern China is relatively low, and can even be ignored [10,11,12,13]. In our study, based on 13C NMR and FTIR data, the carbon chains and chemical structure fragments of kerogen samples were combined and analyzed. The 13C NMR spectrograms of the model were calculated and plotted, using CHNMRPRO software, and compared with experimental values until they were almost identical. The average molecular structures of three shale kerogen samples were constructed, and their average molecular structure chemical formulas were as follows: NJ-1, C153H242O30; LJ-1, C169H164O31; and BL-26, C210H118O42 (Figure 9a–c). For the low-maturity kerogen sample, the main form of carbon content was long aliphatic rings, while the high-maturity kerogen sample was mainly composed of aromatic cluster structures with more than five aromatic rings, which is consistent with the findings reported in Section 3.1.
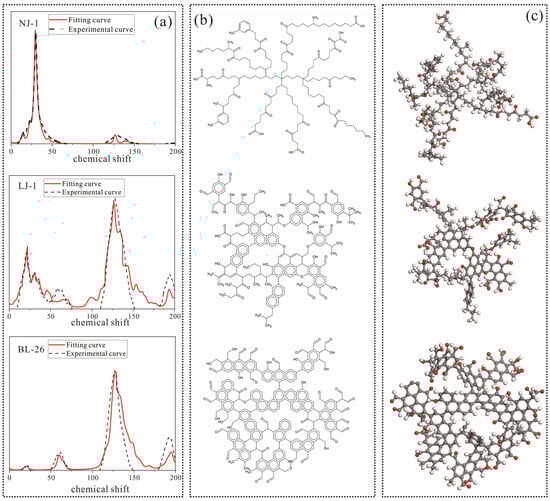
Figure 9.
SSNMR spectra and fitting results (a), average molecular structure models (b), and global minimum energy configuration (c) of kerogen samples with different maturities. Atom representations: grey for carbon atoms, white for hydrogen atoms, and red for oxygen atoms.
Due to the predominance of micropores in shale OM pores, in order to characterize the pore structure of shale kerogen as much as possible, the size of the kerogen unit cell model constructed should also conform to the micropore pore size. In this study, the Amorphous Cell module in Materials Studio software 2020 was used to construct kerogen unit cell models of NJ-1, LJ-1, and BL-26, from 20, 12, and 9 kerogen molecules, with side lengths of 39.3, 35.7, and 39.6 nm, respectively. Subsequently, the Forcite module was used to optimize the geometric configuration of the model, with Task selected as Geometry Optimization, Quality set to Ultra fine, Max. iterations set to 20,000 times, and Forcefield selected as COMPASS. Unreasonable parameters such as key length and key angle in the initial model were corrected to obtain the model with the lowest local energy. Finally, the molecular structure was annealed using the Forcite module, where Task was selected as Anneal, Quality was selected as Ultra fine, Annealing cycles were set to 20 times, initial temperature was set to 300 K, and the highest temperature in a single temperature cycle was set to 800 K. Forcefield was selected as COMPASS, and Ensemble was selected as the NVT. By annealing, the model is freed from local energy minima, resulting in a more stable global minimum energy structure. Based on the established three-dimensional macromolecular model (Figure 10), CO2 molecules were used as probes to calculate the internal pores of the kerogen samples. Moreover, the pore volume and specific surface area of NJ-1, LJ-1, and BL-26 were 6.40 Å3 and 31.28 Å2, 37.71 Å3, and 194.26 Å2, and 110.50 Å3 and 318.05 Å2, respectively. The pore volume and specific surface area increased with increasing maturity, which is consistent with the findings reported in Section 3.2. In addition, previous studies have also observed similar changes and proposed that the macromolecular structure of kerogen can control the development of micropores [6,8].
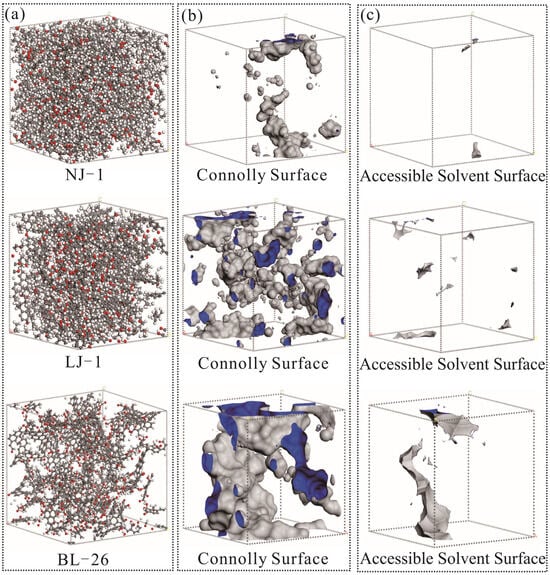
Figure 10.
Development of micropores in kerogen samples with different maturities.
In the actual process of CO2-ESGR, there is competitive adsorption of CO2 and CH4 on the kerogen surface [1,2,3,4]. In our study, we simulated the adsorption characteristics of CO2 and CH4 under different temperature and pressure conditions using the three-dimensional macromolecular structure of kerogen. (Figure 11). Compared to the CO2 adsorption experiment in Figure 5, the CO2 adsorption capacity in this simulation experiment is significantly higher. This is because the experimental value is set at a lower pressure, which may not have reached saturation adsorption. Another reason is that simulation experiments are based on the adsorption capacity under ideal conditions, while actual experiments are influenced by factors such as sample purity.
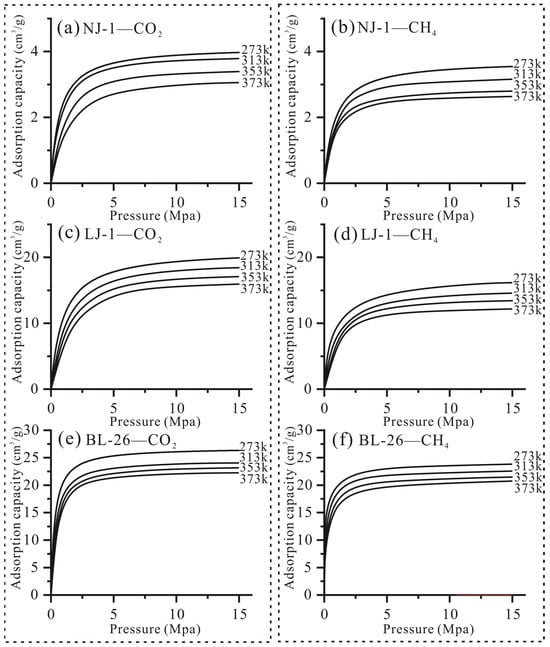
Figure 11.
Carbon dioxide and methane isothermal adsorption curves at different temperature points of kerogen samples with different maturities.
Both the adsorption curves of CO2 and CH4 can be categorized as type I isotherms; specifically, the adsorption capacity initially increases significantly, and then slightly increases under high pressure. In addition, the amount of CO2 adsorbed by kerogen is several times that of CH4 under the same experimental conditions; hence, the adsorbed CH4 in shale is displaced by CO2 and transformed into free CH4 in the displacement process. Actually, previous researchers have also observed similar results and proposed that they are related to the pore structure and surface chemistry groups of kerogen, such as the aromatic rings and oxygen-containing functional groups [54,55,56,57,58,59,60,61,62]. In our study, we have observed that the as the number of micropores and specific surface area of kerogen increase during the thermal evolution process, the adsorption capacity of CO2 and CH4 gradually increases, which also indicates that micropores in kerogen are the key control for the displacement behavior (Figure 11). In addition, some studies have observed that aromatic rings of coal have a stronger ability to adsorb CO2 than CH4, and attribute this phenomenon to the difference in molecular configuration and charge distributions, specifically because the electrons and orbits of CO2 molecules are more likely to interact with the electrons of aromatic rings [57,62]. Other studies also have observed that the polarity of oxygen-containing functional groups can change the charge distribution of molecules, increase the surface polarity of kerogen, enhance the electrostatic interaction with CO2, and reduce the dispersion force with CH4 [56,59]. Therefore, before the implementation of a CO2-ESGR project, the pore and molecular structure of the kerogen should be comprehensively considered.
4. Conclusions
Here, the changes in the molecular structure and related micropores of kerogen during natural maturation were investigated. The following conclusions can be drawn:
- (1)
- For Ro <1.43%, the kerogen structure is mainly composed of aliphatic chains, naphthalene (56.3–10.1%), 2 × 2 rings (26.4–41.1%), and 3 × 3 rings (6.7–41.4%). For 1.43% < Ro < 1.93%, the proportions of smaller structures (naphthalene and 2 × 2 rings) continuously decrease, while those of 3 × 3 rings and larger structures increase. For Ro >1.93%, over-mature kerogen has lower proportions of naphthalene and 2 × 2 rings and higher percentages of larger structures, such as 4 × 4 and 5 × 5 rings. In addition, the orderliness of aromatic stripes gradually increases with increasing maturity levels.
- (2)
- The molecular structure evolution of kerogen controls the development of its micropores. When 0.89% < Ro < 1.43%, the micropore volume is significantly reduced as aliphatic chains, naphthalene, and 2 × 2 rings rapidly crack from the kerogen structure. When 1.43% < Ro < 1.93%, the micropore volume gradually increases with increasing maturity levels because small aromatic ring-connected aliphatic structures form 3 × 3 rings through aromatization. When 1.93% < Ro < 3.03%, 3 × 3 rings form larger aromatic rings through condensation and their orientation is significantly enhanced (reaching 80% of the major direction), leading to rapid growth in micropore volume and specific surface area.
- (3)
- Both the adsorption curves of CO2 and CH4 are type I isotherms; specifically, the adsorption capacity initially increases significantly and then slightly increases under high pressure. The amount of CO2 adsorbed by kerogen is several times that of CH4 under the same experimental conditions; hence, the adsorbed CH4 in shale is displaced by CO2 and transformed into free CH4 in the displacement process. In addition, functional groups are also important factors affecting the process of CO2 displacement of CH4.
Author Contributions
Conceptualization, Y.Z. (Yuewen Zhu) and F.S.; methodology, Y.Z. (Yuewen Zhu) and G.Z.; software, K.M.; validation, Y.Z. (Yuewen Zhu), Y.P. and F.S.; formal analysis, K.M.; investigation, Y.Z. (Yuewen Zhu); resources, Y.Z. (Yulong Zhao) and Y.C.; data curation, F.S.; writing—original draft preparation, Y.Z. (Yuewen Zhu); writing—review and editing, F.S. and Y.Z. (Yulong Zhao); visualization, K.M. and Y.P.; supervision, G.Z.; project administration, Y.Z. (Yuewen Zhu); funding acquisition, F.S. All authors have read and agreed to the published version of the manuscript.
Funding
This research was funded by the Natural Science Foundation of China, grant number 42362022; the Central Government Guides Local Science and Technology Development Funds, grant number 2022ZY0083; the Open Fund of Shaanxi Key Laboratory of Petroleum Accumulation Geology, grant number PAG-202406; the Open Fund of Mine geology and environment academician and expert workstation, grant number 2024OITYSZJGZZ-005; the Graduate Research and Innovation Project of Inner Mongolia Autonomous Region, grant number S20231142Z.
Data Availability Statement
Dataset available on request from the authors.
Conflicts of Interest
Author Yujin Chen was employed by National Energy Group Yanbao Energy. Author Yulong Zhao was employed by Jining Energy Bureau. The remaining authors declare that the research was conducted in the absence of any commercial or financial relationships that could be construed as a potential conflict of interest.
References
- Davoodi, S.; Al-Shargabi, M.; Wood, D.A.; Rukavishnikov, V.S.; Minaev, K.M. Review of technological progress in carbon dioxide capture, storage, and utilization. Gas Sci. Eng. 2023, 117, 205070. [Google Scholar] [CrossRef]
- Liu, D.; Zhao, Z.; Cai, Y.; Sun, F. Characterizing coal gas reservoirs: A multiparametric evaluation based on geological and geophysical methods. Gondwana Res. 2024, 133, 91–107. [Google Scholar] [CrossRef]
- Dai, X.; Wei, C.; Wang, M.; Ma, R.; Yu, S.; Zhang, J.; Wang, X.; Shi, X.; Veerle, V. Interaction mechanism of supercritical CO2 with shales and a new quantitative storage capacity evaluation method. Energy 2023, 264, 126424. [Google Scholar] [CrossRef]
- Wang, R.; Wang, L.; Chen, W.; Shafiq, M.U.; Qiu, X.; Zou, J.; Wang, H. Surrogate-Assisted Evolutionary Optimization of CO2-ESGR and Storage. Energy Fuels 2023, 37, 14800–14810. [Google Scholar] [CrossRef]
- Qin, C.; Jiang, Y.; Zhou, J.; Song, X.; Liu, Z.; Li, D.; Zhou, F.; Xie, Y.; Xie, C. Effect of supercritical CO2 extraction on CO2/CH4 competitive adsorption in Yanchang shale. Chem. Eng. J. 2021, 412, 128701. [Google Scholar] [CrossRef]
- Romero-Sarmiento, M.F.; Rouzaud, J.N.; Bernard, S.; Deldicque, D.; Thomas, M.; Littke, R. Evolution of Barnett Shale organic carbon structure and nanostructure with increasing maturation. Org. Geochem. 2014, 71, 7–16. [Google Scholar] [CrossRef]
- Duan, D.; Zhang, D.; Ma, X.; Yang, Y.; Ran, Y.; Mao, J. Chemical and structural characterization of thermally simulated kerogen and its relationship with microporosity. Mar. Pet. Geol. 2018, 89, 4–13. [Google Scholar] [CrossRef]
- Hou, Y.; Zhang, K.; Wang, F.; He, S.; Dong, T.; Wang, C.; Qin, W.; Xiao, Y.; Tang, B.; Yu, R.; et al. Structural evolution of organic matter and implications for graphitization in over-mature marine shales, south China. Mar. Pet. Geol. 2019, 109, 304–316. [Google Scholar] [CrossRef]
- Zhang, H.; Ahmed, M.; Zhan, J. Recent advances in molecular simulation of oil shale kerogen. Fuel 2022, 316, 123392. [Google Scholar] [CrossRef]
- Liang, Z.; Jiang, Z.; Xue, Z.; Qiao, P.; Wu, W.; Jiang, Y.; Tang, X.; Chen, R.; Arif, M. Molecular structure and evolution mechanism of shale kerogen: Insights from thermal simulation and spectroscopic analysis. J. Anal. Appl. Pyrolysis 2024, 181, 106648. [Google Scholar] [CrossRef]
- Shi, K.; Chen, J.; Pang, X.; Jiang, F.; Hui, S.; Zhang, S.; Pang, H.; Wang, Y.; Chen, D.; Yang, X.; et al. Average molecular structure model of shale kerogen: Experimental characterization, structural reconstruction, and pyrolysis analysis. Fuel 2024, 355, 129474. [Google Scholar] [CrossRef]
- Zhang, D.; Cao, H.; Lei, Y.; Wu, H.; Wang, X.; Guo, X.; Yan, J.; Wang, S.; Shi, T.; Li, H.; et al. A study on molecular structural evolution of type II kerogen in a gold tube thermal system: Insights from solid-state 13C NMR. Fuel 2023, 331, 125898. [Google Scholar] [CrossRef]
- Liu, Y.; Zhu, Y.; Chen, S.; Wang, Y.; Song, Y. Evaluation of spatial alignment of kerogen in shale using high-resolution transmission electron microscopy, Raman spectroscopy, and Fourier transform infrared. Energy Fuels 2018, 32, 10616–10627. [Google Scholar] [CrossRef]
- Liu, Y.; Zhu, Y.; Liu, S.; Chen, S.; Li, W.; Wang, Y. Molecular structure controls on micropore evolution in coal vitrinite during coalification. Int. J. Coal Geol. 2018, 199, 19–30. [Google Scholar] [CrossRef]
- Liang, T.; Zhan, Z.W.; Zou, Y.R.; Lin, X.H.; Shan, Y. Research on type I kerogen molecular simulation and docking between kerogen and saturated hydrocarbon molecule during oil generation. Chem. Geol. 2023, 617, 121263. [Google Scholar] [CrossRef]
- Mathews, J.P.; Fernandez-Also, V.; Jones, A.D.; Schobert, H.H. Determining the molecular weight distribution of Pocahontas No. 3 low-volatile bituminous coal utilizing HRTEM and laser desorption ionization mass spectra data. Fuel 2010, 89, 1461–1469. [Google Scholar] [CrossRef]
- Deldicque, D.; Rouzaud, J.N.; Velde, B. A Raman–HRTEM study of the carbonization of wood: A new Raman-based paleothermometer dedicated to archaeometry. Carbon 2016, 102, 319–329. [Google Scholar] [CrossRef]
- Wang, X.; Zhu, Y.; Song, Y.; Mathews, J.P. Structure and partial ordering of terrestrial kerogen: Insight from high-resolution transmission electron microscopy. Fuel 2020, 281, 118759. [Google Scholar] [CrossRef]
- Mastalerz, M.; Schimmelmann, A.; Drobniak, A.; Chen, Y.Y. Porosity of Devonian and Mississippian New Albany Shale across a maturation gradient: Insights from organic petrology, gas adsorption, and mercury intrusion. AAPG Bull. 2013, 97, 1621–1643. [Google Scholar] [CrossRef]
- Liu, B.; Mastalerz, M.; Schieber, J. SEM petrography of dispersed organic matter in black shales: A review. Earth-Sci. Rev. 2022, 224, 103874. [Google Scholar] [CrossRef]
- Ko, L.T.; Loucks, R.G.; Zhang, T.; Ruppel, S.C.; Shao, D. Pore and pore network evolution of Upper Cretaceous Boquillas (Eagle Ford–equivalent) mudrocks: Results from gold tube pyrolysis experiments. AAPG Bull. 2016, 100, 1693–1722. [Google Scholar] [CrossRef]
- Liu, B.; Mohammadi, M.R.; Ma, Z.; Bai, L.; Wang, L.; Xu, Y.; Ostadhassan, M.; Hemmati-Sarapardeh, A. Evolution of porosity in kerogen type I during hydrous and anhydrous pyrolysis: Experimental study, mechanistic understanding, and model development. Fuel 2023, 338, 127149. [Google Scholar] [CrossRef]
- Dang, W.; Jiang, S.; Zhang, J.; Li, P.; Nie, H.; Liu, Y.; Li, F.; Sun, J.; Tao, J.; Shan, C.; et al. A systematic experimental and modeling study of water adsorption/desorption behavior in organic-rich shale with different particle sizes. Chem. Eng. J. 2021, 426, 130596. [Google Scholar] [CrossRef]
- Zhang, C.; Yao, Y.; Elsworth, D.; Liu, D.; Ju, Y.; Dong, Y.; Ye, S. Microstructure characterization of kerogen in mature shale: Molecular investigation of micropore development. J. Nat. Gas Sci. Eng. 2021, 95, 104239. [Google Scholar] [CrossRef]
- Song, D.; Tuo, J.; Wu, C.; Zhang, M.; Su, L. Comparison of pore evolution for a Mesoproterozoic marine shale and a Triassic terrestrial mudstone during artificial maturation experiments. J. Nat. Gas Sci. Eng. 2020, 75, 103153. [Google Scholar] [CrossRef]
- Fan, C.; Li, H.; Qin, Q.; He, S.; Zhong, C. Geological conditions and exploration potential of shale gas reservoir in Wufeng and Longmaxi Formation of southeastern Sichuan Basin, China. J. Pet. Sci. Eng. 2020, 191, 107138. [Google Scholar] [CrossRef]
- Ge, X.; Hu, W.; Ma, Y.; Li, M.; Tang, J.; Zhao, P. Quantitative evaluation of geological conditions for shale gas preservation based on vertical and lateral constraints in the Songkan area, Northern Guizhou, southern China. Mar. Pet. Geol. 2021, 124, 104787. [Google Scholar] [CrossRef]
- Li, J.; Batten, D.J.; Zhang, Y. Palynological record from a composite core through Late Cretaceous–early Paleocene deposits in the Songliao Basin, Northeast China and its biostratigraphic implications. Cretac. Res. 2011, 32, 1–12. [Google Scholar] [CrossRef]
- Chen, X.; Wang, X. Early Palaeozoic chrono-and sequence-stratigraphy in the Yangtze Gorges Area, China with an approach of palaeobiogeography. Gondwana Res. 1999, 2, 627–633. [Google Scholar]
- Wu, J.; Liang, F.; Lin, W.; Wang, H.; Bai, W.; Ma, C.; Sun, S.; Zhao, Q.; Song, X.; Yu, R. Characteristics of shale gas reservoirs in Wufeng Formation and Longmaxi Formation in Well WX2, northeast Chongqing. Pet. Res. 2017, 2, 324–335. [Google Scholar] [CrossRef]
- Xia, M.; Wen, L.; Wang, Y.; Hong, H.; Fan, Y.; Wen, Y. High quality source rocks in trough facies of Upper Permian Dalong Formation, Sichuan Basin. Pet. Explor. Dev. 2010, 37, 654–662. [Google Scholar] [CrossRef]
- Shang, F.; Zhu, Y.; Hu, Q.; Wang, Y.; Li, Y.; Li, W.; Liu, R.; Gao, H. Factors controlling organic-matter accumulation in the Upper Ordovician-Lower Silurian organic-rich shale on the northeast margin of the Upper Yangtze platform: Evidence from petrographic and geochemical proxies. Mar. Pet. Geol. 2020, 121, 104597. [Google Scholar] [CrossRef]
- Lis, G.P.; Mastalerz, M.; Schimmelmann, A.; Lewan, M.D.; Stankiewicz, B.A. FTIR absorption indices for thermal maturity in comparison with vitrinite reflectance R0 in type-II kerogens from Devonian black shales. Org. Geochem. 2005, 36, 1533–1552. [Google Scholar] [CrossRef]
- Song, Y.; Jiang, B.; Qu, M. Macromolecular evolution and structural defects in tectonically deformed coals. Fuel 2019, 236, 1432–1445. [Google Scholar] [CrossRef]
- Beyssac, O.; Goffé, B.; Petitet, J.P.; Froigneux, E.; Moreau, M.; Rouzaud, J.N. On the characterization of disordered and heterogeneous carbonaceous materials by Raman spectroscopy. Spectrochim. Acta Part A Mol. Biomol. Spectrosc. 2003, 59, 2267–2276. [Google Scholar] [CrossRef]
- Liu, D.; Xiao, X.; Tian, H.; Min, Y.; Zhou, Q.; Cheng, P.; Shen, J. Sample maturation calculated using Raman spectroscopic parameters for solid organics: Methodology and geological applications. Chin. Sci. Bull. 2013, 58, 1285–1298. [Google Scholar] [CrossRef]
- Patience, R.L.; Mann, A.L.; Poplett, I.J.F. Determination of molecular structure of kerogens using 13C NMR spectroscopy: II. The effects of thermal maturation on kerogens from marine sediments. Geochim. Cosmochim. Acta 1992, 56, 2725–2742. [Google Scholar] [CrossRef]
- Tong, J.; Han, X.; Wang, S.; Jiang, X. Evaluation of structural characteristics of Huadian oil shale kerogen using direct techniques (solid-state 13C NMR, XPS, FT-IR, and XRD). Energy Fuels 2011, 25, 4006–4013. [Google Scholar] [CrossRef]
- Zhong, Q.; Mao, Q.; Zhang, L.; Xiang, J.; Xiao, J.; Mathews, J.P. Structural features of Qingdao petroleum coke from HRTEM lattice fringes: Distributions of length, orientation, stacking, curvature, and a large-scale image-guided 3D atomistic representation. Carbon 2018, 129, 790–802. [Google Scholar] [CrossRef]
- Van, N.D.; Mathews, J.P. Molecular representations of Permian-aged vitrinite-rich and inertinite-rich South African coals. Fuel 2010, 89, 73–82. [Google Scholar]
- Fernandez-Alos, V.; Watson, J.K.; vander Wal, R.; Mathews, J.P. Soot and char molecular representations generated directly from HRTEM lattice fringe images using Fringe3D. Combust. Flame 2011, 158, 1807–1813. [Google Scholar] [CrossRef]
- Mathews, J.P.; Sharma, A. The structural alignment of coal and the analogous case of Argonne Upper Freeport coal. Fuel 2012, 95, 19–24. [Google Scholar] [CrossRef]
- Han, H.; Cao, Y.; Chen, S.; Lu, J.; Huang, C.; Zhu, H.; Zhan, P.; Gao, Y. Influence of particle size on gas-adsorption experiments of shales: An example from a Longmaxi Shale sample from the Sichuan Basin, China. Fuel 2016, 186, 750–757. [Google Scholar] [CrossRef]
- Shang, F.; Zhu, Y.; Hu, Q.; Zhu, Y.; Wang, Y.; Du, M.; Liu, R.; Han, Y. Characterization of methane adsorption on shale of a complex tectonic area in Northeast Guizhou, China: Experimental results and geological significance. J. Nat. Gas Sci. Eng. 2020, 84, 103676. [Google Scholar] [CrossRef]
- Chalmers, G.R.; Bustin, R.M. Lower Cretaceous gas shales in northeastern British Columbia, Part I: Geological controls on methane sorption capacity. Bull. Can. Pet. Geol. 2008, 56, 1–21. [Google Scholar] [CrossRef]
- Wang, Y.; Zhu, Y.; Chen, S.; Li, W. Characteristics of the nanoscale pore structure in Northwestern Hunan shale gas reservoirs using field emission scanning electron microscopy, high-pressure mercury intrusion, and gas adsorption. Energy Fuels 2014, 28, 945–955. [Google Scholar] [CrossRef]
- Liu, Y.; Liu, S.; Zhang, R.; Zhang, Y. The molecular model of Marcellus shale kerogen: Experimental characterization and structure reconstruction. Int. J. Coal Geol. 2021, 246, 103833. [Google Scholar] [CrossRef]
- Wang, S.; Tang, Y.; Schobert, H.H.; Guo, Y.N.; Su, Y. FTIR and 13C NMR investigation of coal component of late Permian coals from southern China. Energy Fuels 2011, 25, 5672–5677. [Google Scholar] [CrossRef]
- Dennis, L.W.; Maciel, G.E.; Hatcher, P.G.; Simoneit, B.R. 13C Nuclear magnetic resonance studies of kerogen from Cretaceous black shales thermally altered by basaltic intrusions and laboratory simulations. Geochim. Cosmochim. Acta 1982, 46, 901–907. [Google Scholar] [CrossRef]
- Cao, H.; Lei, Y.; Wang, X.; Zou, Y.; Peng, P. Molecular structure evolution of Type I kerogen during pyrolysis: Case study from the Songliao Basin, NE China. Mar. Pet. Geol. 2021, 134, 105338. [Google Scholar] [CrossRef]
- Su, C.; Liu, Y.; Yang, Y.; Gao, T.; Qi, T.; Wang, Y. Evolution of aromatic structure and nanopores in shale kerogen by using in-situ HRTEM and in-situ FT-IR experiment. Fuel 2024, 359, 130479. [Google Scholar] [CrossRef]
- Ungerer, P. State of the art of research in kinetic modelling of oil formation and expulsion. Org. Geochem. 1990, 16, 1–25. [Google Scholar] [CrossRef]
- Vandenbroucke, M. Kerogen: From types to models of chemical structure. Oil Gas Sci. Technol. 2003, 58, 243–269. [Google Scholar] [CrossRef]
- Li, W.; Cao, J.; Liang, Y.; Masuda, Y.; Tsuji, T.; Tamura, K.; Ishiwata, T.; Kuramoto, D.; Matsuoka, T. Methane/ethane adsorption behavior in shale nanopore systems with mesopores and micropores: Evaluating micropore contribution. Fluid Phase Equilibria 2025, 592, 114323. [Google Scholar] [CrossRef]
- Zhang, H.; Zeng, X.; Zhao, Z.; Zhai, Z.; Cao, D. Adsorption and selectivity of CH4/CO2 in functional group rich organic shales. J. Nat. Gas Sci. Eng. 2017, 39, 82–89. [Google Scholar] [CrossRef]
- Huang, L.; Ning, Z.; Wang, Q.; Zhang, W.; Cheng, Z.; Wu, X.; Qin, H. Effect of organic type and moisture on CO2/CH4 competitive adsorption in kerogen with implications for CO2 sequestration and enhanced CH4 recovery. Appl. Energy 2018, 210, 28–43. [Google Scholar] [CrossRef]
- Song, Y.; Jiang, B.; Lan, F. Competitive adsorption of CO2/N2/CH4 onto coal vitrinite macromolecular: Effects of electrostatic interactions and oxygen functionalities. Fuel 2019, 235, 23–38. [Google Scholar]
- Xiang, J.; Lei, L. Study on influence of coal surface functional groups on methane and carbon dioxide adsorption propertie. Coal Sci. Technol. 2021, 49, 145–151. [Google Scholar]
- Lu, G.; Zou, C.; Mathews, J.P.; Zhang, G.; Pan, S.; Liu, H.; Song, Y.; Liu, Y.; Hua, G.; Zhao, Z.; et al. Molecular simulation of the potential effects of oxygen functionalities on the adsorption and diffusion of methane in kerogen. Fuel 2025, 386, 134245. [Google Scholar] [CrossRef]
- Liao, Q.; Zhou, J.; Xian, X.; Yang, K.; Zhang, C.; Dong, Z.; Yin, H. Competition adsorption of CO2/CH4 in shale: Implications for CO2 sequestration with enhanced gas recovery. Fuel 2023, 339, 127400. [Google Scholar] [CrossRef]
- Wang, J.; Hu, S.; Yang, T.; Chen, X.; Li, W.; Wang, T. Mechanistic study of carbon dioxide sequestration technology using molecular simulations to assess the adsorption of methane and carbon dioxide by different functional groups. Appl. Surf. Sci. 2024, 677, 161058. [Google Scholar] [CrossRef]
- Li, G.; Li, J.; Pan, J.; Liu, L.; Zhang, M.; Zhang, L.; Wang, K. Adsorption of CO2/CH4 on the aromatic rings and oxygen groups of coal based on in-situ diffuse reflectance FTIR. Gas Sci. Eng. 2024, 130, 205440. [Google Scholar] [CrossRef]
Disclaimer/Publisher’s Note: The statements, opinions and data contained in all publications are solely those of the individual author(s) and contributor(s) and not of MDPI and/or the editor(s). MDPI and/or the editor(s) disclaim responsibility for any injury to people or property resulting from any ideas, methods, instructions or products referred to in the content. |
© 2025 by the authors. Licensee MDPI, Basel, Switzerland. This article is an open access article distributed under the terms and conditions of the Creative Commons Attribution (CC BY) license (https://creativecommons.org/licenses/by/4.0/).