Abstract
Chile, which accounts for 27% of global cherry exports (USD 2.26 billion annually), faces a critical industry challenge in crop health monitoring. While automated sensors monitor environmental variables, phytosanitary diagnosis still relies on manual visual inspection, leading to detection errors and delays. Given this reality and the growing use of AI models in agriculture, our study quantifies the theory–practice gap through comparative evaluation of three transfer learning architectures (namely, VGG16, ResNet50, and EfficientNetB0) for automated disease identification in cherry leaves under both controlled and real-world orchard conditions. Our analysis reveals that excellent laboratory performance does not guarantee operational effectiveness: while two of the three models exceeded 97% controlled validation accuracy, their field performance degraded significantly, reaching only 52% in the best-case scenario (ResNet50). These findings identify a major risk in agricultural transfer learning applications: strong laboratory performance does not ensure real-world effectiveness, creating unwarranted confidence in model performance under real conditions that may compromise crop health management.
1. Introduction
Cherries are among the most cherished fruits globally, known for their exquisite taste and nutritional value. In Chile, cherries have become a cornerstone of the agricultural export sector, with a reputation for exceptional quality. Introducing innovative cherry varieties, such as the early-maturing Cherry BurstTM by Bloom Fresh, underscores the industry’s commitment to maintaining its competitive edge [1]. Despite logistical and quality assurance challenges, Chile remains the world’s leading cherry exporter, accounting for 95.7% of the Southern Hemisphere’s export supply [2]. In the 2022–2023 season alone, Chile exported 356,442 tons of cherries, predominantly to China, which remains the primary market for this prized fruit.
During the 2022–2023 season, Chile produced 445,500 tons of cherries and exported 356,442 tons, equivalent to 71.3 million 5-kg boxes. On the other hand, the Southern Hemisphere as a whole exported 372,337 tons of cherries; of these, Chile accounted for 95.7 percent, followed by Argentina with 8173 tons in the 2021–2022 season, then Australia with 3975 tons, New Zealand with 3220 tons, and, finally, South Africa with 624 tons of cherries [2,3]. The main market for Chilean cherries continues to be China, although there was a slight decrease in the 2022–2023 season compared to 2020–2021, when 313,961 tons (88.1% of the total) were shipped to China and Hong Kong; in the previous season, this figure was 322,188 tons. Other important markets included North America and Europe. To the former 13,877 tons of cherries were exported (12,741 to the US and 1135 to Canada), while to the latter 6254 tons were exported (England 3317, Holland 1801, Spain 694, and 441 tons to other countries). Specialists assure that Chile will maintain its growth, with production expected to double in the next five years, reaching 830,000 tons, equivalent to 166 million 5-kilogram boxes, by the 2026–2027 season considering that current cherry plantations in our country cover 62,000 hectares [2,3].
Regarding the volumes exported in the 2023–2024 season, exporters have shipped 413,979 tons of cherries to international markets. China continues to be the main destination, showing a new record, with shipments 3.3% higher than last season, amounting to 377 thousand tons, according to Claudia Soler, executive director of Cherry Committee [3]. The main cherry varieties shipped were: Lapins with 43% of the total volume exported, Santina (21%), Regina (19%), Sweet Heart and Bing (both with 4% each). Other notable varieties included Kordia (3%), Skeena (2%), Royal Dawn and Rainer (both with 1%), among others. In total, the Chilean industry exports more than 36 cherry varieties worldwide. Some of these are new early varieties such as Meda Rex, Sweet Aryana, and Royal Lynn, among others, though these are still produced in low volumes, not exceeding 80 tons exported.
Ensuring quality is critical to the success of Chilean cherry exports. Stringent quality control measures are required to meet the high standards of international markets, particularly China, which demands premium-grade cherries. Traditional manual methods for quality assessment—such as using calibrating rings for size and color tablets for ripeness—are labor-intensive, slow, and prone to human error. Moreover, subjectivity in evaluating parameters like color and texture can lead to inconsistencies in quality control [3]. Hence, quality control of cherries remains key to safeguarding Chile’s strict export standards.
However, how is cherry quality evaluated at harvest? One method is the calibration and quality control of cherries using artificial vision, wherein image-processing software determines three types of information describing the quality of the fruit: the color as an indicator of ripeness, the presence of defects such as cracking, and the size [4]. At processing plants, before hydrocooling, the fruit is received by the quality control team, which obtains a representative sample from each lot for thorough evaluation. The purpose of fruit sampling is to determine fruit quality and condition. This information is used to manage processes, provide parameters to producers, and often to segregate raw materials and define packaging strategies. The vast majority of exporters destine 100% of their cherry exports to the Chinese market, so they work with different labels and formats. Fruit classified as Premium is designated with the exporter’s “TOP” label and is generally also packed in smaller formats, understanding that this fruit will opt for the highest selling prices. In such cases, accurate lot segregation is essential. Among the different cherry varieties, Sweet cherry is particularly prized. Its quality can be evaluated using several objective methodologies, such as caliber, color, texture, soluble solids content (SSC), titratable acidity (TA), as well as maturity indexes. Functional and nutritional compounds are also frequently determined, in response to consumer demand [5]. Most sweet cherries are consumed fresh, while a small portion is value-added to make processed food products [6].
Cherry producers always rely on good sampling, which not only implies the quantity of fruit to be analyzed but also how the sampling is conducted [7]. As a rule, the more fruit and the greater the number of bins, the better. This allows producers to cover the great diversity and obtain the most representative fruit [3]. However, this objective must be balanced with operational efficiency. Until recently, producers relied on 100% manual receptions to characterize all the parameters, taking samples of between 100 and 200 fruits at most. However, how was the sample evaluated? For sizing, the complete sample was passed fruit by fruit through calibrating rings and sorted by caliber. A similar approach was used for comparing the color of the fruit with color tablets, to ensure the fruit color was adequate. Both systems being manual were slow and tedious. In addition, visual assessments of color are susceptible to lighting conditions, which can reduce accuracy of evaluation.
Recent advances in artificial intelligence (AI) and image-processing technologies offer transformative potential for the cherry industry. Automated systems leveraging image-based analysis and artificial neural networks have shown promise in addressing the limitations of traditional methods. These technologies enable rapid, non-destructive quality assessments, accurately measuring parameters like size, color, and the presence of defects. For instance, Baiocco [8] demonstrated the efficacy of an image-based system for detecting pits in cherries, significantly reducing errors and enhancing efficiency.
Similarly, near-infrared spectroscopy combined with chemometrics has been used to monitor cherry quality changes under various storage conditions, providing valuable insights into post-harvest management [9]. These innovations highlight the potential of AI-driven tools to revolutionize quality assessment practices in the cherry industry.
Despite growing enthusiasm for agricultural applications of transfer learning, developing AI systems for agriculture requires validation not just of theoretical performance, but particularly of real-world operational effectiveness. Our study addresses this critical need through the following research question:
R.Q.: How does the effectiveness of transfer learning models (namely, VGG16, ResNet50, and EfficientNetB0) vary when transitioning from controlled laboratory environments to practical implementation in commercial cherry orchards?
Rationale: Real-world validation is crucial because controlled environments do not adequately capture the variability of commercial orchards (e.g., variable lighting, diverse viewing angles, and natural obstructions). Moreover, diagnostic errors—such as false negatives that miss diseased plants or false positives that trigger unnecessary treatments—have direct economic consequences for growers and can undermine disease management strategies.
Hence, this paper investigates the potential of transfer learning for automated visual assessment of cherry tree health, focusing on its operational viability in real-world agricultural settings. Building upon established methodologies in agricultural AI [10,11], we critically examine how pre-trained convolutional neural networks perform when adapted for disease detection in commercial cherry orchards, with particular attention to discrepancies between laboratory and field performance.
The remainder of this paper is structured as follows: Section 2 provides machine learning background; Section 3 reviews previous work involving artificial intelligence and machine learning for plant disease detection; Section 4 presents our transfer learning approaches and compares three deep learning architectures for leaf health classification; Section 5 presents the experimental results; Section 6 discusses threats to validity; Section 7 analyzes the findings; and Section 8 provides conclusions and future research directions.
2. Theoretical Background
Cherry tree health plays an important role in ensuring the sustainability and profitability of the cherry export industry. Advances in artificial intelligence (AI) and machine learning (ML) offer transformative solutions by enabling automated, accurate, and scalable methods for plant health assessment. Therefore, we explore the theoretical foundations underlying our approach.
2.1. Transfer Learning
Transfer Learning is a technique that seeks to transfer the knowledge acquired by a model, when solving a task in a source domain, and to apply it in a different but related target domain [12]. This is achieved by reusing pre-trained models on large and general datasets and adjusting them to specific tasks through refinement in the last layers. This approach is particularly useful when the specific dataset is limited or expensive to label, as it allows for reduced training time and computational requirements.
2.2. Deep Learning
Deep learning (DL) or deep neural network (DNN) is a machine learning subcategory that deals with nonlinear datasets. DNNs consist of layers of stacked nodes, with activation function and associated weights, (fully/partially) connected and usually trained (weight adjustments) by back-propagation and optimization algorithms [13].
2.3. Image Classification with AI
Image classification using AI relies on ML algorithms to assign labels to images based on their visual features [14]. This process involves extracting relevant patterns from input images, representing them in a mathematical space, and using these representations to train a model capable of making predictions on new images [15].
2.4. Convolutional Neural Network
Convolutional neural networks (CNNs) are one of the main types of neural networks used for image recognition and classification [16]. A CNN is essentially a neural network that employs the convolution operation (instead of a fully connected layer) as one of its layers [17]. As shown in Figure 1, a CNN usually takes a third-order tensor as its input, e.g., an image with H rows, W columns, and three channels (R, G, B color channels) [18].
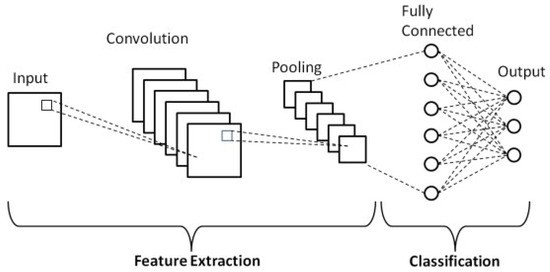
Figure 1.
Schematic diagram of a basic convolutional neural network (CNN) architecture [19].
The tensor passes through several layers, including convolutional, pooling, and fully connected layers, each performing different operations to extract hierarchical features.
2.5. ResNet Architecture
The ResNet50 architecture solves the vanishing gradient problem through its residual blocks with skip connections. This enables deeper networks, thereby allowing better transfer learning and improving performance in complex tasks. For cherry leaf analysis, its 23.5M frozen parameters provide mid-level feature extraction, balancing computational complexity and performance [20]. Figure 2 shows a graphical representation of ResNet. The four-stage block design (conv3_x to conv5_x) proves effective for leaf texture analysis.
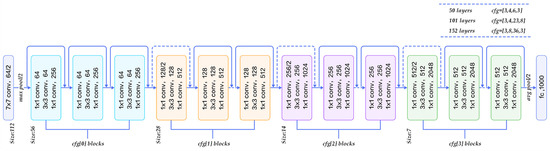
Figure 2.
Flow chart of ResNet-50 [21].
2.6. VGG16
VGG16 is a convolutional network developed by Simonyan and Zisserman [22] for the 2015 ImageNet Large Scale Visual Recognition Challenge, which included two main competitions: (i) given an image, detect objects within a range of 200 classes and (ii) classify an image among 1000 categories [23]. VGG16 is depicted in Figure 3. For our cherry leaf analysis, we utilize the network’s 14.7M frozen parameters to extract hierarchical features. The network processes 224 × 224 × 3 input images through consecutive convolution blocks, each applying convolution operations, ReLU activation functions, and dimensionality reduction via pooling layers. The architecture ends with a softmax activation function that computes classification probabilities across the 1000 predefined categories.
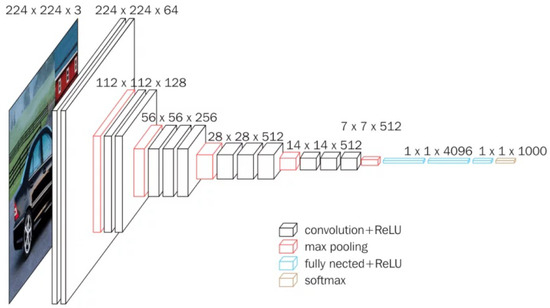
Figure 3.
Standard illustration of a VGG16 Architecture [22].
2.7. EfficientNetB0 Architecture
EfficientNetB0 employs compound scaling (depth–width–resolution) for optimal resource use. As illustrated in Figure 4, its mobile inverted bottleneck (MBConv) layers with integrated squeeze-and-excitation modules are particularly well-suited for field deployment applications, requiring only 4.0M frozen parameters [24]. With its remarkably lightweight requirement (29MB), EfficientNetB0 architecture enables practical implementation on edge devices, making it ideal for in situ cherry leaf analysis. Although it has shown limited learning performance in both laboratory and field evaluations, it was selected for its low computational requirements, which align with future deployment goals on resource-constrained edge devices. More complex variants of this architecture (e.g., EfficientNetB3 or B4) are not explored in this study due to their increased hardware demands, but represent promising candidates for future work aiming to improve robustness without compromising deployability.
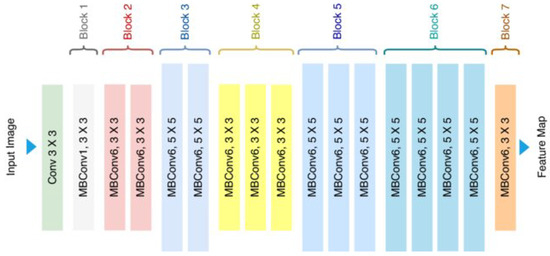
Figure 4.
Standard illustration of the EfficientNetB0 Architecture [25].
3. Related Work
AI is increasingly employed in plant health to enhance disease detection, improve plant breeding, and optimize growth conditions [26]. In the context of disease detection, ML techniques, including DL, are leveraged to develop advanced methods for identifying and classifying plant diseases. These methods enable early disease detection, facilitating timely intervention and significantly reducing plant mortality rates [27]. Algorithms such as random forests, neural networks, and support vector machines are commonly used to predict plant diseases based on observable symptoms, including changes in shape, size, and wilting [28,29]. Considering health assessment techniques, artificial neural networks (ANN) and stacked models have proven particularly effectivity in analyzing phenotypic data [30]. Additionally, ML plays an important role in uncovering complex interactions within cellular systems, especially in identifying pathogen effector genes involved in plant immunity [31]. Indeed, ML serves as a powerful tool in plant health, providing innovative solutions for disease detection, health assessment, phenotyping, and genomics analysis.
For sweet cherries, ML algorithms, such as YOLOv5, are used to detect and characterize stressed tissues by identifying infected leaves and branches. This supports the early detection of diseases or stress factors, such as water shortages, which is vital for preserving tree health and maximizing yield [32]. Moreover, ANN and adaptive neuro-fuzzy inference systems are employed to estimate antioxidant activity and anthocyanin content in sweet cherries during ripening, offering a faster and more economical alternative to traditional laboratory techniques [33]. Likewise, drones and predictive models have been developed to estimate antioxidant content in cherry fruits using multispectral imagery captured by drones [34]. In this context, ML is also utilized in automating sweet cherry harvesting. Machine vision systems are designed to detect and segment cherry tree branches, streamlining automated harvesting processes. This reduces labor costs and enhances efficiency by minimizing manual handling and operations [35]. Furthermore, datasets such as Cherry CO are employed to train machine learning algorithms for cherry detection, segmentation, and maturity recognition, enabling the development of high-performance models that automate assessment and harvesting tasks, thereby further improving fruit farming efficiency [36].
To better understand the evolution of these methods, a comparison between traditional and technological approaches is presented in Table 1. This comparison highlights key differences in aspects such as speed, accuracy, scalability, and cost-effectiveness. Traditional methods, while accessible, are often limited by their manual and time-consuming nature. Conversely, technological approaches driven by AI offer scalable, automated solutions that significantly reduce operational costs and improve consistency.

Table 1.
Comparison between traditional and technological approaches for assessing the health and quality of cherry trees.
As can be seen, AI, ML, and DL have played an important role in sweet cherry agriculture by improving disease detection, estimating fruit quality attributes, and automating harvesting processes. These advancements contribute to more efficient and sustainable farming practices, ultimately enhancing productivity and fruit quality. However, these approaches tend to focus primarily on the fruit itself, which does not necessarily enable the early detection of potential diseases affecting the tree. Therefore, our study aims to deepen the care of sweet cherry plants through a proactive approach that leverages AI to analyze tree leaves for potential diseases, even before the fruit has developed.
4. Methodology
Our study implements a standardized framework to evaluate three CNN architectures (namely, VGG16, ResNet50, and EfficientNetB0) for automated cherry tree health assessment. The methodology ensures direct comparability through consistent training protocols, data processing pipelines, and evaluation metrics across all models.
4.1. Model Architecture
We adapt three pre-trained models for binary classification (healthy vs. diseased leaves) using transfer learning:
- Base Networks:
- -
- VGG16: Frozen convolutional base (14.7 M parameters)
- -
- ResNet50: Frozen residual blocks (23.5 M parameters)
- -
- EfficientNetB0: Frozen MBConv blocks (4.0 M parameters)
- Custom Classification Head:
- -
- Flatten layer
- -
- Single dense output layer (2 units, softmax activation)
4.2. Dataset
The cherry leaf dataset has been obtained from Kaggle (https://www.kaggle.com/datasets/khalil18/cherry-dataset accessed on 4 March 2025). It comprises 1826 leaves categorized as Healthy and 1683 leaves categorized as Powdery Mildew, representing 52% and 48% of the dataset, respectively.
Later, we perform standard data augmentation, consisting of vertical flips and 90-degree rotations to the left and right applied randomly. To improve model recognition of diseased leaves, we apply augmentation with higher probability to this category. As a result, we obtain a final dataset of 7614 images, with approximately 55% diseased leaves and 45% healthy leaves. A sample of the healthy and diseased leaves can be seen in Figure 5.
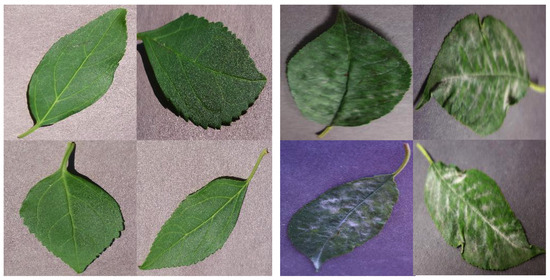
Figure 5.
Sample of Kaggle cherry leaves dataset: healthy leaves (Left) and diseased leaves (Right).
4.3. Data Pipeline
The dataset comprises cherry leaf images from cherry orchards processed through:
- Data Partitioning: After augmentation, the dataset exhibited a mild but manageable class imbalance of approximately 55% diseased leaves.
- -
- Training: 6080 images (80% with augmentation)
- -
- Validation: 1534 images (20%)
- Image Processing:
- -
- Resizing to 224 × 224 pixels
- -
- Pixel value scaling to [0, 1] range
- -
- Augmentation: Random rotation (), horizontal flip, and zoom (20%)
4.4. Training Protocol
All models share identical training parameters (shown in Table 2).
Table 2.
Uniform Training Configuration.
4.5. Evaluation Protocol
The models are evaluated on the validation set using:
- Metrics:
- -
- Accuracy:
- -
- Precision:
- -
- Recall:
- -
- False Negative Rate:
- Implementation:
- -
- Fixed classification threshold: 0.5
- -
- A 1472 images set used for final evaluation
- -
- Identical evaluation pipeline for all models
5. Results
This section presents a comprehensive evaluation of the three deep learning architectures (VGG16, ResNet50, and EfficientNetB0) for cherry leaf disease detection; systematically comparing their performance under both controlled laboratory conditions and real-world orchard environments. The analysis is structured into two principal dimensions:
- Laboratory metrics: Quantitative assessment of validation accuracy, loss dynamics, and overfitting tendencies using standardized test sets.
- Field performance: Operational effectiveness evaluated through confusion matrices and robustness to environmental variables (lighting, occlusion, etc.).
5.1. Training and Validation Dynamics
The models are trained for 20 epochs with early stopping (patience = 3). Figure 6 shows the training progression versus validation metrics, both for accuracy (a) and loss (b), revealing fundamental differences in the learning behavior of the three architectures.
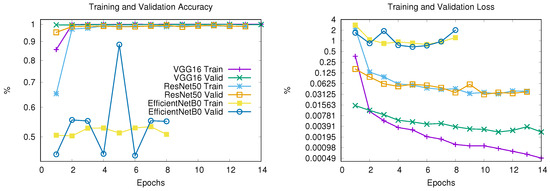
Figure 6.
Training and validation accuracy (left) and loss (right) for VGG16, ResNet50, and EfficientNetB0 architectures. For clarity, both subfigures share the same legend and display results up to Epoch 14.
VGG16
- It stopped at Epoch 18 due to early stopping
- Training accuracy reached 99.97% by epoch 5
- Validation accuracy plateaued at 99.73% by epoch 5
- Validation loss increased from 0.31 to 0.52 after epoch 5
- Possible overfitting after Epoch 5
ResNet50
- It stopped at Epoch 13 due to early stopping
- Achieved 98.80% training accuracy and 98.64% validation accuracy
- Smooth validation loss reduction (0.0379 → 0.0367)
- Possible stable convergence
EfficientNetB0
- It stopped at Epoch 8 due to early stopping
- Stagnant at 50.78% training/55.03% validation accuracy
- Erratic validation loss (0.6743–2.0118 range)
- No meaningful learning occurred
- Failed convergence
Computational Performance
The resource utilization during training highlights important operational considerations, as shown in Table 3.
Table 3.
Training resource utilization (per epoch average).
5.2. Field Performance Validation
For a comprehensive evaluation, and regardless of what training performance might suggest, the models are evaluated under real-world orchard conditions using 1472 unseen images. Table 4,Table 5 and Table 6 present the classification performance through confusion matrices, while Table 7 summarizes key operational metrics.
VGG16 (from Table 4):
- Field accuracy dropped to 50% (vs. ≈99% in lab)
- High false negatives (23.98% of diseased leaves missed)
Table 4.
Confusion Matrix for VGG16 Field Performance, showing ≈24.0% false negative rate.
Table 4.
Confusion Matrix for VGG16 Field Performance, showing ≈24.0% false negative rate.
| Predicted | Count | ||||
|---|---|---|---|---|---|
| Actual | Diseased | Healthy | Total |  | |
| Diseased | 460 | 387 | 847 | ||
| Healthy | 353 | 272 | 625 | ||
| Total | 813 | 659 | 1472 | ||
ResNet50 (from Table 5):
- Field accuracy dropped to 52% (vs. ≈98% in lab)
- An important false negative rate (22.44% of diseased leaves missed)
Table 5.
Confusion Matrix for ResNet50 Field Performance, showing ≈22.4% false negatives.
Table 5.
Confusion Matrix for ResNet50 Field Performance, showing ≈22.4% false negatives.
| Predicted | Count | ||||
|---|---|---|---|---|---|
| Actual | Diseased | Healthy | Total |  | |
| Diseased | 470 | 377 | 847 | ||
| Healthy | 331 | 294 | 625 | ||
| Total | 801 | 671 | 1472 | ||
EfficientNetB0 (from Table 6):
- Severe performance degradation (48% accuracy)
- Highest false positive rate (32.40% unusable for disease control)
Table 6.
Confusion Matrix for EfficientNetB0 showing that field performance is equivalent to random guessing (48% accuracy).
Table 6.
Confusion Matrix for EfficientNetB0 showing that field performance is equivalent to random guessing (48% accuracy).
| Predicted | Count | ||||
|---|---|---|---|---|---|
| Actual | Diseased | Healthy | Total |  | |
| Diseased | 370 | 477 | 847 | ||
| Healthy | 287 | 338 | 625 | ||
| Total | 657 | 815 | 1472 | ||
Operational Metrics
The quantitative field performance metrics reveal critical differences in model reliability under real-world conditions for diseased leaves, as shown in Table 7.
Table 7.
Field performance comparison.
Table 7.
Field performance comparison.
| Model | Accuracy | F1-Score | Recall | Precision |
|---|---|---|---|---|
| VGG16 | 0.50 | 0.55 | 0.54 | 0.57 |
| ResNet50 | 0.52 | 0.57 | 0.55 | 0.59 |
| EfficientNetB0 | 0.48 | 0.49 | 0.44 | 0.56 |
Three key operational insights emerge from these metrics:
- Laboratory performance does not guarantee field reliability: All models showed significant accuracy drops in real-world conditions despite high laboratory validation scores, revealing a major domain adaptation gap.
- False negatives compromise disease control: Even the best-performing model (ResNet50) missed over 22% of diseased leaves, posing a serious risk for timely phytosanitary intervention.
- Model architecture affects robustness: While ResNet50 maintained relatively better field performance, EfficientNetB0 failed to generalize, highlighting that lightweight models may lack the capacity needed for noisy, real-world inputs.
5.3. Laboratory vs. Field Performance Gap
Despite the promising results observed during controlled training and validation, a substantial gap emerged when models were deployed under real-world orchard conditions. This discrepancy highlights a key limitation in the practical use of transfer learning for agricultural diagnostics.
Two of the three architectures demonstrated high accuracy in laboratory settings, exceeding 98% in the case of VGG16 and ResNet50. However, when exposed to real-world variability such as uneven lighting, occlusion by other leaves or branches, and natural leaf deformities, their performance degraded dramatically. VGG16 and ResNet50 dropped to 50% and 52% accuracy, respectively, while EfficientNetB0 failed to generalize altogether, reaching only 48% accuracy.
This sharp decline is not merely a quantitative drop but a qualitative shift in behavior: laboratory-optimized models failed to capture the complexity and noise inherent in field data. In particular, the elevated false negative rates across all models indicate that diseased leaves are frequently misclassified as healthy, an outcome that directly threatens the timeliness and effectiveness of phytosanitary management.
These findings suggest that conventional training pipelines, even when using transfer learning and early stopping, are insufficient for deployment in unstructured, outdoor environments. Closing this performance gap will likely require domain adaptation strategies, more diverse and field-representative training datasets, and architectures explicitly designed for robustness under environmental variability.
To better understand the nature of this gap, a qualitative inspection of misclassified field images was performed. Most errors were associated with non-ideal lighting conditions (e.g., shadowed leaves or overexposure), occlusions from branches or neighboring leaves, and natural deformations such as curled or partially damaged leaves. These findings suggest that environmental variability, rather than model limitations alone, significantly contributed to reduced field accuracy.
6. Threats to Validity
We identify three key threats to the validity of our study and discuss how they are addressed:
- External Validity (Generalizability): While our models achieved high accuracy in controlled laboratory settings, their performance declined in real-world orchard conditions. This limitation is explicitly acknowledged in our results (Section 5.3). To mitigate this, we standardized evaluation protocols across both laboratory and field testing, ensuring a fair comparison.
- Internal Validity (Selection Bias): Potential biases arise from our dataset composition (6080 training images from cherry orchards). We minimized this by: (a) using stratified sampling to balance healthy/diseased cases, (b) applying identical augmentation techniques across all models, and (c) validating on an independent field-collected subset (1472 images). The consistent performance drop across architectures (Table 4) confirms this bias affects all models equally.
- Construct Validity (Operationalization): Binary classification (healthy vs. diseased) may oversimplify phytosanitary diagnostics. We have justified this approach through industry consultation—Chilean growers prioritize early disease detection over specific pathogen identification. The high false-negative rates reported (Section 5.2) transparently quantify this limitation for operational use.
7. Discussion
The results presented in this study reveal a significant gap between the performance of deep learning models in controlled laboratory settings and their operational effectiveness in real-world orchard environments. While the VGG16 and ResNet50 architectures achieved validation accuracies exceeding 98% during training, their field performance dropped drastically to 50% and 52%, respectively. This sharp decline underscores the fragility of transfer learning-based systems when exposed to domains characterized by high variability and noise—conditions that are inherent to agricultural environments. While advanced domain adaptation techniques such as DeepCORAL [37] and DANN [38] could potentially address the domain shift challenges observed in our study, we deliberately excluded these methods to establish baseline transfer learning performance under realistic deployment constraints. This decision reflects practical considerations for agricultural applications: edge devices deployed in orchard environments typically operate under severe computational limitations that preclude complex adaptation pipelines. Moreover, the inherent variability of orchard conditions—including frequent occlusions, varying lighting, and seasonal changes—violates the assumptions of coherent domain shifts that underpin many adaptation algorithms.
A particularly concerning observation is the elevated false-negative rate, which exceeded 22% even in the best-performing model (ResNet50). In agricultural disease monitoring contexts, such misclassifications have direct operational consequences: undetected diseased leaves can lead to delayed interventions, pathogen spread, and substantial economic losses, while our study employed F1-scores to partially address the inherent class imbalance (approximately 55% diseased leaves in our dataset), these findings underscore the need for more nuanced evaluation frameworks in future research. Specifically, metrics such as Area Under the Precision–Recall Curve (AUC-PR) and 95% confidence intervals would provide more robust performance assessments, particularly under field conditions where disease prevalence varies significantly across orchards and seasons. Such metrics would better illuminate the critical trade-offs between false alarms and missed detections—distinctions that are often obscured by aggregate accuracy measures but are essential for informing deployment decisions in real-world agricultural monitoring systems.
The poor convergence performance of EfficientNetB0 under both laboratory and field conditions underscores a fundamental tension between architectural efficiency and domain adaptability. Our results suggest that the model’s failure stems not from inherent representational limitations, but from the mismatch between its architectural requirements and our standardized training protocol. EfficientNetB0’s MBConv blocks are specifically designed for higher input resolutions (≥240 px) and exhibit sensitivity to batch normalization parameters under small batch conditions—neither of which were accommodated in our uniform experimental setup. This finding has broader implications for the deployment of efficient architectures in specialized domains: while computational efficiency remains crucial for edge applications, it cannot substitute for proper architectural adaptation to domain-specific constraints. The challenge lies not in achieving computational efficiency per se, but in developing training protocols that can effectively leverage the architectural strengths of different models within the constraints of agricultural monitoring scenarios.
Moreover, qualitative analysis of misclassified images reveals that natural environmental factors—such as uneven lighting, leaf occlusions, and morphological deformations—had a tangible impact on model predictions. These observations suggest that simple transfer of pre-trained models is insufficient; instead, domain adaptation techniques, expanded datasets with representative field conditions, and robust learning strategies are necessary to bridge the lab-to-field performance gap.
Collectively, these findings call for a reassessment of validation protocols in AI-based agricultural applications. Evaluating systems solely under idealized conditions could produce results that may not generalize to operational conditions in their real-world utility. Future development should prioritize early-stage field validation to ensure proposed solutions are not only accurate in theory but also reliable and actionable in practice.
8. Conclusions and Future Work
This study investigated the application of transfer learning for automated cherry tree health monitoring, focusing on the performance gap between controlled laboratory conditions and real-world orchard environments. Three deep learning architectures—VGG16, ResNet50, and EfficientNetB0—were evaluated, revealing significant discrepancies in their effectiveness across these settings. While VGG16 and ResNet50 achieved high validation accuracies (exceeding 97% and 98%, respectively) under laboratory conditions, their field performance dropped dramatically to approximately 50%, with elevated false negative rates posing a critical risk for disease management. EfficientNetB0, despite its computational efficiency, failed to generalize effectively, underscoring the limitations of lightweight models in noisy agricultural environments.
These findings highlight a fundamental challenge in deploying AI for agricultural diagnostics: models optimized for controlled conditions may lack the robustness required for real-world variability. Factors such as uneven lighting, occlusions, and natural leaf deformations significantly degraded model performance, emphasizing the need for domain-specific adaptations. The high false-negative rates observed in this study are particularly concerning, as they could delay interventions and exacerbate disease spread, with tangible economic consequences for cherry producers.
These results call for a paradigm shift in how AI models are validated for agricultural applications. Laboratory performance alone is insufficient to guarantee operational reliability; field testing must be integrated early in the development cycle to identify and address domain-specific challenges.
In terms of future work, research should empirically evaluate four complementary approaches to address the indoor-to-outdoor domain shift observed in this study: adversarial domain adaptation methods (e.g., Domain-Adversarial Neural Networks [38]) to align feature distributions between controlled and field environments; feature-level alignment techniques (e.g., DeepCORAL [37], Maximum Mean Discrepancy [39]) to minimize distributional discrepancies; parameter-efficient fine-tuning strategies using limited field-acquired samples to adapt pre-trained models to specific orchard conditions; and visual explanation techniques such as Class Activation Mapping (CAM) or Grad-CAM [40] to enhance model interpretability and prediction reliability under field conditions. These investigations will be essential for quantifying the performance gains achievable through domain adaptation while maintaining the computational efficiency required for practical edge deployment in agricultural monitoring systems. Such work will ultimately inform the development of robust, deployable AI-assisted solutions that can bridge the gap between laboratory research and real-world agricultural applications, particular in Chilean cherry orchards.
Author Contributions
All authors contributed to the current work. Conceptualization, R.P. and M.H.; methodology, R.G. and F.Y.; validation, R.P., R.G. and M.L.; formal analysis, F.Y. and S.K.S.; investigation, M.H. and R.P.; data curation, M.H. and M.L.; writing—original draft preparation, M.H.; writing—review and editing, R.P.; visualization; supervision, R.G. and S.K.S. All authors have read and agreed to the published version of the manuscript.
Funding
This research received no external funding.
Data Availability Statement
The data presented in this study are available on request from the corresponding author.
Acknowledgments
The authors sincerely thank Fernanda Lopez-Gallegos for granting access to her sweet cherry field, which allowed for the collection of images used in this study. The authors also gratefully acknowledge Universidad Finis Terrae for funding the Article Processing Charge (APC).
Conflicts of Interest
The authors declare no conflicts of interest.
Abbreviations
The following abbreviations have been used in this manuscript:
| AI | Artificial Intelligence |
| ML | Machine Learning |
| DL | Deep Learning |
| ANN | Artificial Neural Networks |
| CNN | Convolutional Neural Network |
References
- Cherry Burst is the Emerging Variety of this Chilean Season. 2024. Available online: https://cherrytimes.it/en/news/Cherry-Burst-is-the-emerging-variety-of-this-Chilean-season (accessed on 11 December 2024).
- iQonsulting Official Website. 2024. Available online: https://www.iqonsulting.com/ (accessed on 10 December 2024).
- ASOEX Official Website. 2024. Available online: https://www.asoex.cl/ (accessed on 15 December 2024).
- Rosenberger, C.; Emile, B.; Laurent, H. Calibration and quality control of cherries by artificial vision. J. Electron. Imaging 2004, 13, 539–546. [Google Scholar] [CrossRef]
- Ricardo-Rodrigues, S.; Laranjo, M.; Agulheiro-Santos, A.C. Methods for quality evaluation of sweet cherry. J. Sci. Food Agric. 2023, 103, 463–478. [Google Scholar] [CrossRef]
- Chockchaisawasdee, S.; Golding, J.B.; Vuong, Q.V.; Papoutsis, K.; Stathopoulos, C.E. Sweet cherry: Composition, postharvest preservation, processing and trends for its future use. Trends Food Sci. Technol. 2016, 55, 72–83. [Google Scholar] [CrossRef]
- Romano, G.S.; Cittadini, E.D.; Pugh, B.; Schouten, R. Sweet cherry quality in the horticultural production chain. Stewart Postharvest Rev. 2006, 6, 1–9. [Google Scholar] [CrossRef]
- Baiocco, G.; Almonti, D.; Guarino, S.; Tagliaferri, F.; Tagliaferri, V.; Ucciardello, N. Image-based system and artificial neural network to automate a quality control system for cherries pitting process. Procedia CIRP 2020, 88, 527–532. [Google Scholar] [CrossRef]
- Szabo, G.; Vitalis, F.; Horvath-Mezofi, Z.; Gob, M.; Aguinaga Bosquez, J.P.; Gillay, Z.; Friedrich, L. Application of Near Infrared Spectroscopy to Monitor the Quality Change of Sour Cherry Stored under Modified Atmosphere Conditions. Sensors 2023, 23, 479. [Google Scholar] [CrossRef] [PubMed]
- Ma, Y.; Chen, S.; Ermon, S.; Lobell, D.B. Transfer learning in environmental remote sensing. Remote Sens. Environ. 2024, 301, 113924. [Google Scholar] [CrossRef]
- Altalak, M.; Ammad uddin, M.; Alajmi, A.; Rizg, A. Smart agriculture applications using deep learning technologies: A survey. Appl. Sci. 2022, 12, 5919. [Google Scholar] [CrossRef]
- Torrey, L.; Shavlik, J. Transfer learning. In Handbook of Research on Machine Learning Applications and Trends: Algorithms, Methods, and Techniques; IGI Global: Hershey, PA, USA, 2010; pp. 242–264. [Google Scholar]
- Iman, M.; Arabnia, H.R.; Rasheed, K. A Review of Deep Transfer Learning and Recent Advancements. Technologies 2023, 11, 40. [Google Scholar] [CrossRef]
- Sharma, S.; Guleria, K. Deep learning models for image classification: Comparison and applications. In Proceedings of the 2022 2nd International Conference on Advance Computing and Innovative Technologies in Engineering (ICACITE), Greater Noida, India, 28–29 April 2022; IEEE: New York, NY, USA; pp. 1733–1738. [Google Scholar]
- LeCun, Y.; Bengio, Y.; Hinton, G. Deep Learning. Nature 2015, 521, 436–444. [Google Scholar] [CrossRef]
- Taye, M.M. Theoretical Understanding of Convolutional Neural Network: Concepts, Architectures, Applications, Future Directions. Computation 2023, 11, 52. [Google Scholar] [CrossRef]
- Ketkar, N.; Moolayil, J. Convolutional Neural Networks. In Deep Learning with Python: Learn Best Practices of Deep Learning Models with PyTorch; Apress: Berkeley, CA, USA, 2021; pp. 197–242. [Google Scholar] [CrossRef]
- Wu, J. Introduction to Convolutional Neural Networks; National Key Lab for Novel Software Technology, Nanjing University: Nanjing, China, 2017; Volume 5, p. 495. [Google Scholar]
- Phung, V.H.; Rhee, E.J. A High-Accuracy Model Average Ensemble of Convolutional Neural Networks for Classification of Cloud Image Patches on Small Datasets. Appl. Sci. 2019, 9, 4500. [Google Scholar] [CrossRef]
- He, K.; Zhang, X.; Ren, S.; Sun, J. Deep Residual Learning for Image Recognition. In Proceedings of the 2016 IEEE Conference on Computer Vision and Pattern Recognition (CVPR), Las Vegas, NV, USA, 27–30 June 2016; pp. 770–778. [Google Scholar] [CrossRef]
- Yadav, R.K.; Mishra, A.K.; Jang Bahadur Saini, D.K.; Pant, H.; Biradar, R.G.; Waghodekar, P. A Model for Brain Tumor Detection Using a Modified Convolution Layer ResNet-50. Indian J. Inf. Sources Serv. 2024, 14, 29–38. [Google Scholar] [CrossRef]
- Simonyan, K.; Zisserman, A. Very Deep Convolutional Networks for Large-Scale Image Recognition. In Proceedings of the 3rd International Conference on Learning Representations (ICLR 2015), San Diego, CA, USA, 7–9 May 2015; pp. 1–14. [Google Scholar]
- Hidalgo Barrientos, M.F.; Hayes Ortiz, B.I.; Delgadillo Vera, I.; Goyo Escalona, M. Deep learning aplicado para a detecção de hemorragias e tumores cerebrais. AtoZ: Novas Práticas em Informação e Conhecimento 2021, 10, 1–10. [Google Scholar] [CrossRef]
- Nigam, S.; Jain, R.; Singh, V.K.; Marwaha, S.; Arora, A.; Jain, S. EfficientNet architecture and attention mechanism-based wheat disease identification model. Procedia Comput. Sci. 2024, 235, 383–393. [Google Scholar] [CrossRef]
- Ahmed, T.; Sabab, N. Classification and Understanding of Cloud Structures via Satellite Images with EfficientUNet. SN Comput. Sci. 2022, 3, 99. [Google Scholar] [CrossRef]
- Jafar, A.; Bibi, N.; Naqvi, R.A.; Sadeghi-Niaraki, A.; Jeong, D. Revolutionizing agriculture with artificial intelligence: Plant disease detection methods, applications, and their limitations. Front. Plant Sci. 2024, 15, 1356260. [Google Scholar] [CrossRef]
- Balafas, V.; Karantoumanis, E.; Louta, M.; Ploskas, N. Machine Learning and Deep Learning for Plant Disease Classification and Detection. IEEE Access 2023, 11, 114352–114377. [Google Scholar] [CrossRef]
- Ahmed, I.I.; Yadav, P.K. Plant disease detection using machine learning approaches. Expert Syst. 2022, 40, e13136. [Google Scholar] [CrossRef]
- Prem, G.; Kranth, R.; Lalitha, M.; Basava, L.; Mathur, A. Plant Disease Prediction using Machine Learning Algorithms. Int. J. Comput. Appl. 2018, 182, 1–7. [Google Scholar] [CrossRef]
- Centorame, L.; Gasperini, T.; Ilari, A.; Gatto, A.D.; Pedretti, E.F. An Overview of Machine Learning Applications on Plant Phenotyping, with a Focus on Sunflower. Agronomy 2024, 14, 719. [Google Scholar] [CrossRef]
- Silva, J.C.; Teixeira, R.M.; Silva, F.F.; Brommonschenkel, S.; Fontes, E. Machine learning approaches and their current application in plant molecular biology: A systematic review. Plant Sci. Int. J. Exp. Plant Biol. 2019, 284, 37–47. [Google Scholar] [CrossRef]
- Chaschatzis, C.; Karaiskou, C.; Mouratidis, E.G.; Karagiannis, E.; Sarigiannidis, P. Detection and Characterization of Stressed Sweet Cherry Tissues Using Machine Learning. Drones 2021, 6, 3. [Google Scholar] [CrossRef]
- Taghadomi-Saberi, S.; Omid, M.; Emam-djomeh, Z.; Ahmadi, H. Evaluating the potential of artificial neural network and neuro-fuzzy techniques for estimating antioxidant activity and anthocyanin content of sweet cherry during ripening by using image processing. J. Sci. Food Agric. 2014, 94, 95–101. [Google Scholar] [CrossRef] [PubMed]
- Karydas, C.; Iatrou, M.; Kouretas, D.; Patouna, A.; Iatrou, G.; Lazos, N.; Gewehr, S.; Tseni, X.; Tekos, F.; Zartaloudis, Z.; et al. Prediction of Antioxidant Activity of Cherry Fruits from UAS Multispectral Imagery Using Machine Learning. Antioxidants 2020, 9, 156. [Google Scholar] [CrossRef] [PubMed]
- Amatya, S.; Karkee, M.; Gongal, A.; Zhang, Q.; Whiting, M. Detection of cherry tree branches with full foliage in planar architecture for automated sweet-cherry harvesting. Biosyst. Eng. 2016, 146, 3–15. [Google Scholar] [CrossRef]
- Cossio-Montefinale, L.; del Solar, J.R.; Verschae, R. Cherry CO Dataset: A Dataset for Cherry Detection, Segmentation and Maturity Recognition. IEEE Robot. Autom. Lett. 2024, 9, 5552–5558. [Google Scholar] [CrossRef]
- Sun, B.; Saenko, K. Deep CORAL: Correlation Alignment for Deep Domain Adaptation. In Proceedings of the Computer Vision—ECCV 2016 Workshops, Amsterdam, The Netherlands, 8–10 and 15–16 October 2016; Springer International Publishing: Cham, Switzerland, 2016; pp. 443–450. [Google Scholar]
- Sicilia, A.; Zhao, X.; Hwang, S.J. Domain adversarial neural networks for domain generalization: When it works and how to improve. Mach. Learn. 2023, 112, 2685–2721. [Google Scholar] [CrossRef]
- Wang, W.; Li, H.; Ding, Z.; Nie, F.; Chen, J.; Dong, X.; Wang, Z. Rethinking Maximum Mean Discrepancy for Visual Domain Adaptation. IEEE Trans. Neural Netw. Learn. Syst. 2023, 34, 264–277. [Google Scholar] [CrossRef]
- He, M.; Li, B.; Sun, S. A Survey of Class Activation Mapping for the Interpretability of Convolution Neural Networks. In Signal and Information Processing, Networking and Computers; Springer: Singapore, 2023; pp. 399–407. [Google Scholar]


Disclaimer/Publisher’s Note: The statements, opinions and data contained in all publications are solely those of the individual author(s) and contributor(s) and not of MDPI and/or the editor(s). MDPI and/or the editor(s) disclaim responsibility for any injury to people or property resulting from any ideas, methods, instructions or products referred to in the content. |
© 2025 by the authors. Licensee MDPI, Basel, Switzerland. This article is an open access article distributed under the terms and conditions of the Creative Commons Attribution (CC BY) license (https://creativecommons.org/licenses/by/4.0/).