Article

Optimizing Aspergillus oryzae Inoculation Dosage and Fermentation Duration for Enhanced Protein Content in Soybean Meal and Its Influence on Dog Food Extrusion

by
Youhan Chen
1,
Thomas Weiss
2,
Donghai Wang
2,
Sajid Alavi
1 and
Charles Gregory Aldrich
1,*
1
Department of Grain Science and Industry, Kansas State University, Manhattan, KS 66506, USA
2
Department of Biological and Agricultural Engineering, Kansas State University, Manhattan, KS 66506, USA
*
Author to whom correspondence should be addressed.
Processes 2025, 13(8), 2441; https://doi.org/10.3390/pr13082441 (registering DOI)
Submission received: 15 June 2025 / Revised: 17 July 2025 / Accepted: 23 July 2025 / Published: 1 August 2025
(This article belongs to the Special Issue Feature Papers in the "Food Process Engineering" Section)

Abstract

This study aimed to optimize the inoculation dosage and fermentation duration to enhance the protein content and reduce soluble oligosaccharides in soybean meal using Aspergillus oryzae and assessed its performance in dog food extrusion. A 3 × 5 factorial design was used to determine the optimal fermentation conditions. These conditions were applied to ferment soybean meal in bulk for nutritional analysis. Finally, the impact of fermentation on extrusion processing was assessed by formulating and extruding four diets: SBM (30% soybean meal), AMF (30% soybean meal with 1% Amaferm®A. oryzae biomass), FSBM (30% fermented soybean meal), and SPI (18% soy protein isolate). Diets were extruded with a single-screw extruder, and physical characteristics of kibbles, particle size distribution, and viscosity of raw mixes were analyzed. The optimal fermentation conditions were 1 × 10⁴ spore/g substrate for 36 h, which increased the crude protein content by 4.63% DM, methionine and cysteine total content by 0.15% DM, and eliminated sucrose, while significantly reducing stachyose, raffinose, and verbascose (95.22, 87.37, and 41.82%, respectively). The extrusion results showed that FSBM had intermediate specific mechanical energy (SME), in-barrel moisture requirements, and sectional expansion index (198.7 kJ/kg, 28.2%, and 1.80, respectively) compared with SBM (83.7 kJ/kg, 34.5%, and 1.30, respectively) and SPI (305.3 kJ/kg, 33.5%, and 2.55, respectively). The FSBM also exhibited intermediate particle size distribution and the least raw mix viscosity. These findings demonstrate that A. oryzae fermentation enhances the nutrient profile of soybean meal while improving extrusion efficiency and kibble quality, supporting its potential use as a sustainable pet food ingredient.

1. Introduction

The USA produced 4.2 billion bushels of soybeans in 2023, contributing to around 29% of worldwide soybean supply [1]. Soybean meal, a by-product of soybean oil separation through solvent and/or mechanical extraction, is primarily used as animal feed [2]. In the USA, over 70% of soybean meal is fed to poultry, swine, and cattle, while less than 5% is used in pet food, mostly in cat and dog foods [3,4]. A portion of the pet food industry is looking for more sustainable ingredients with health benefits for animals. Soybeans are considered a good plant protein source for monogastric animals with less impact on the environment than animal proteins. However, the utilization of soybean products in pet foods remained limited due to several factors, including an incomplete amino acid profile, presence of anti-nutritional factors such as trypsin inhibitors and oligosaccharides, and a generally negative perception among consumers.
Fermentation is a natural process during which microorganisms produce bioactive enzymes to metabolize the substrates and convert or modify them into products with desirable features. The fungus Aspergillus oryzae is widely used to ferment soybean meal for producing human food such as saké, shoyu (soy sauce), and miso [5]. Many studies have proven that fermentation with A. oryzae can effectively decrease protein molecular weight, increase protein content, modify amino acid composition, and eliminate antinutritional factors in soybean meal [6,7,8,9,10]. Fermented soybean products also bring benefits when fed to animals, such as improved growth performance, nutrient digestibility, and intestinal enzyme activities in both ruminant and monogastric animals [8,11,12,13,14,15,16]. Unlike other fungus species, A. oryzae is not capable of producing aflatoxins [5], which brings greater safety as a pet food ingredient component. However, previous studies conducted with various fungus inoculation dosages, fermentation durations, and fermentation conditions such as substrate moisture content, environmental humidity, and solid versus liquid fermentation phase, have made it complicated to determine the optimal protocol to modify soybean meal with desired nutrient modifications, especially protein quality, through fermentation with A. oryzae. The optimal protocol for improving soybean meal protein quality may not impact other nutrients in the same direction. Additionally, previous animal studies have provided scant information on processing methods for both the ingredients and diets of interest.
When incorporating fermented soybean meal into pet food, it is critical to understand its impacts on extrusion—the primary processing method for the most popular form of dog and cat foods. Soy protein is reported to have decreased viscosity and emulsifying activity but increased water-holding capacity [17], while another study on a maize–soybean blend found that fermentation reduced sectional expansion and the water absorption index [18]. Meanwhile, the reduction in soybean insoluble fiber is reported to promote sectional expansion [19]. It remains to be investigated how solid-state fermentation by A. oryzae would influence the extrusion performance of soybean meal.
Therefore, the objectives of this study were to (1) determine the proper inoculation dosage and fermentation duration to improve protein and methionine content in soybean meal, (2) investigate changes in protein, methionine, sucrose, stachyose, raffinose verbascose, and trypsin inhibitors in soybean meal fermented with a certain protocol, and (3) evaluate extrusion feasibility and kibble expansion when fermented soybean meal is used in a complete and balanced dog food formula. We hypothesized that both inoculation dosage and fermentation duration would affect the nutrient profile of soybean meals. Furthermore, we expected fermentation to significantly alter the nutrients and anti-nutritional factor profile of soybean meal without introducing technical challenges to the extrusion process.

2. Materials and Methods

This study consists of three experiments: experiment 1 used a 3 × 5 factorial design to investigate the optimal inoculation dosage of A. oryzae and fermentation duration to improve protein quality in the soybean meal; experiment 2 investigated the modification of macronutrients, flatulence-causing soybean sugars (sucrose, stachyose, raffinose, and verbascose), and energy content in soybean meal through the fermentation protocol determined in experiment 1; experiment 3 focused the extrusion performance of A. oryzae fermented soybean meal when included at 30% in a complete and balanced dog food formula.

2.1. Spore Suspension Preparation

Freeze-dried A. oryzae (lyophilized, ATCC 42149) was obtained from the American Type Culture Collection (Manassas, VA, USA) and recovered on a Czapek-Dox agar plate (Difco Laboratories Inc., Franklin lakes, NJ, USA) (unit: gram/liter; sucrose 30.0, sodium nitrate 3.0, potassium chloride 0.5, magnesium sulfate heptahydrate 0.5, iron sulfate heptahydrate 0.01, di-potassium hydrogen phosphate 1.0, and agar 15.0) and harvested in 50% glycerol solutions. A hemacytometer chamber (Hausser Scientific, Horsham, PA, USA) was used for spore counting under a microscope. Solutions with estimated spore concentrations were used for inoculation.

2.2. Fermentation of Soybean Meal

Commercial soybean meal (SBM) was purchased from a local distributor (MKC, Manhattan, KS, USA). Distilled water was added to the soybean meal to achieve an initial moisture content of 50%, after which it was retorted at 121.1 °C for 2 h. A prolonged retort time was required to avoid substrate spoilage during fermentation. Retorted soybean meal was then evenly divided into 3 groups and inoculated with A. oryzae spore suspensions at a dosage of 1 × 10⁴ (dose 1), 5 × 10⁵ (dose 2), or 1 × 10⁶ (dose 3) spore/g substrate DM [7,8,9,20]. Fermentation was carried out in a ventilation chamber (GEN2000, Conviron, Pembina, ND, USA) under 37 °C, 80 ± 5% relative humidity and a light cycle of 2 h of darkness per day. During fermentation, the substrate was sprayed with distilled water with a spray bottle and flipped every 12 h using sanitized spatulas. Samples were collected from each group at 0, 12, 24, 36, and 48 h of fermentation and immediately dried in an oven at 60 °C for 36 h to reduce the moisture content below 10% and stored at room temperature for further analysis. The entire fermentation process was repeated 3 times blocked by days and tray location in the chamber (left, middle or right) as technical replicates.

2.3. Chemical Analysis

Dry matter (DM), organic matter (OM), and ash were determined according to the Association of Official Analytical Collaboration International (AOAC) methods 934.01 and 942.05 [21]. Crude protein (CP) was determined by the Dumas combustion method (AOAC 990.03) [21] using a nitrogen analyzer (FP928, LECO Corporation, Saint Joseph, MI). The conversion factor from nitrogen to CP was 6.25. Crude fat (CF) was determined by acid hydrolysis followed by hexane extraction (ISO11085:2015 using semi-automated equipment (Hydrotec 8000 and ST 255 Soxtec, Foss, Denmark). Gross energy was measured as total heat of sample combustion by a calorimeter (Parr 6200, Parr Instrument Company, Moline, IL, USA). The soluble dietary fiber (SDF), insoluble dietary fiber (IDF), and total dietary fiber (TDF) contents of diet samples were measured (AOAC 991.43) [21] using an ANKOM Dietary Fiber Analyzer (ANKOM Technology, Macedon, NY, USA). Aflatoxin (B1, B2, G1 and G2) analysis was conducted with test strips (Reveal Q+, Neogen Ltd., Lansing, MI, USA) and quantified with an AccuScan Gold reader (Neogen Ltd., Lansing, MI, USA) following the manufacturer’s instruction. The detection limit was 2 ppb.
Sugars (sucrose, stachyose, raffinose, and verbascose) and amino acids were determined at the University of Missouri Agricultural Experiment Station Chemical Laboratories; Columbia, MO, USA. Sucrose, stachyose, raffinose, and verbascose contents were determined by gas chromatography [22]. All amino acids (L-amino acids), except for methionine, cysteine, and tryptophan, were digested with 6 N HCl for 24 h at 110 °C. The amino acids were then separated by ion-exchange chromatography and the concentration was determined with a Beckman 6300 amino acid analyzer (Beckman, Palo Alto, CA, USA). Methionine and cysteine were first oxidized by performic acid to methionine sulfone and cysteic acid, respectively, prior to acid hydrolysis. Tryptophan was hydrolyzed in 3 M mercaptoethanesulfonic acid before analysis. Available lysine was determined (AOAC 975.44) and lysine availability (%) was calculated as the ratio of available lysine to total lysine.
The Kunitz trypsin inhibitors (KTIs) and Bowman–Birk trypsin inhibitors (BBIs) were determined in triplicate by a simplified spectrophotometry method [23] and expressed as trypsin inhibitor unit (TIU)/g of sample. For KTI analysis, 20 mg of ground sample and 1 mL of 10 mM NaOH were added to a 2 mL tube and vigorously agitated on a vortex mixer at room temperature for 10 min followed by a 10 min centrifugation at 16,000× g. The protein concentration in the supernatant was measured by the Bio-Rad protein assay [24]. Add 50 μL of protein concentration and 150 μL assay buffer (50 mM Tris-HCl, pH 8.2, and 20 mM CaCl2) to a 1.5 mL tube followed by the addition of 500 μL of Nα-benzoyl-DL-arginine p-nitroanilide hydrochloride (BAPNA, Sigma-Aldrich, Burlington, MA, USA) solution (0.4 mg/mL) and 200 μL of trypsin (20 μg/mL) and vortex the solution. The reaction was run for 10 min at 37 °C in a water bath and terminated by adding 100 μL of 30% (v/v) acetic acid. Absorbance was measured at 410 nm using a microplate reader (Tecan Spark 10 M, Tecan Group Ltd., Männedorf, Switzerland). The positive control, substrate blank, and enzyme blank were used in parallel. For BBI analysis, the same procedure was used but BAPNA and trypsin were replaced with AAPF (N-Succinyl-Ala-Ala-Pro-Phe-p-nitroanilide) and α-chymotrypsin. In the analysis, one TIU was defined as a decrease in 0.1 absorbance units at 410 nm [23].

2.4. In Vitro Protein Digestibility

The in vitro pepsin–pancreatin protein digestibility was determined in duplicate according to de-Godoy et al. (2009) [25] with modifications. Two additional blanks were created with 1 mL of deionized water. For each replicate, 1 g of sample was weighed into 50 mL centrifuge tubes, followed by the addition of 15 mL of 0.1 N HCl–pepsin solution (porcine; Sigma-Aldrich, Inc., St. Louis, MO, USA). The tubes were incubated in a shaking water bath at 37 °C for 6 h. The pepsin hydrolysis was stopped by adding 7.5 mL of 0.5 N NaOH to neutralize the solution. Subsequently, a mixture of 4 mg of porcine pancreatin (Sigma-Aldrich, Inc., St. Louis, MO, USA), 7.5 mL of phosphate buffer (pH 8), and 1 mL of sodium azide (for microbial control) was added to each tube. The tubes were then placed in the shaking water bath and incubated at 37 °C for 18 h. After the 18 h incubation, 1 mL of 10% trichloroacetic acid was added to each tube to end the reaction and help with protein precipitation. The tubes were then centrifuged at 3700× g for 20 min. The supernatant was discarded after filtration with Whatman 541 filter paper. Then, the sediments were washed with distilled water, centrifuged, and filtered again 3 times (the supernatant became clear). The final sediments on the filter paper were oven-dried overnight at 105 °C and then analyzed for CP (AOAC 990.03) using a nitrogen analyzer (FP928, LECO Corporation, Saint Joseph, MI, USA). In vitro protein digestibility was calculated using the following Equations (1)–(3):
Weight of sample CP (g) = Sample weight (g) × sample CP (%)
Weight of residue CP (g) = residue weight (g) × residue CP (%)
C P   d i g e s t i b i l i t y % = W e i g h t   o f   s a m p l e   C P W e i g h t   o f   r e s i d u e   C P W e i g h t   o f   s a m p l e   C P × 100

2.5. Diet Formulation

Soybean meal fermented with A. oryzae, following the protocol established in experiment 1, was used as an ingredient to formulate a dog diet. To produce adequate dog food for the feeding trial, 19 fermentation sessions were conducted, yielding over 200 lbs of product. Four diets were formulated to meet the nutritional requirements for the maintenance of adult dogs (AAFCO, 2016 [26] with different soybean meal products as the major plant protein source for comparison (Table 1): SBM with 30% soybean meal; AMF with 30% soybean meal plus 1% dried A. oryzae wheat bran fermentation product (Amaferm®, BioZyme, Inc., St. Joseph, MO, USA) where the latter served to differentiate any effects from A. oryzae biomass on processing conditions; FSBM with 30% A. oryzae fermented soybean meal; and SPI with 18% soybean protein isolate. Note that the soybean meal and fermented soybean meal had closer CP contents (51–55% DM basis), while the soybean protein isolate had 92% CP on DM basis. To maintain similar levels of soybean protein across diets, the inclusion level of SPI was reduced to 18% instead of 30% of soybean protein isolate in SPI diet. Brewers’ rice was used only in the SPI diet to complete the formula. All ingredients but Amaferm® and fermented soybean meal were purchased and mixed from a commercial mill (Wilbur-Ellis Holdings, Inc., St. Joseph, MO, USA). The diets were formulated to have similar nutritional composition and included titanium dioxide (TiO2; 0.4%) as an indigestible marker for the determination of apparent total tract digestibility (ATTD) of dietary nutrients. As predicted by the formulation, the concentrations of minerals (calcium, phosphorous, potassium, magnesium, sodium, sulfur, manganese, copper iron, and zinc) were similar among diets and met AAFCO (2016) [26] nutrient profile recommendations for adult dogs at maintenance.

2.6. Rapid Viscosity Analysis

Rapid Visco Analysis (RVA) was used to measure the viscosity of materials under conditions of heat and shear. The analysis was conducted following AACC method 76-21.02 using an RVA 4500 (Perten Instruments, Waltham, MA, USA). For each sample, a portion of 3.5 g was weighed and mixed with 25 mL deionized water in the test cup. The testing cycle kept the sample at 50 °C for 1 min, and then heated up to 95 °C at a rate of 12.2 °C/min; it was then held at 95 °C for 2.5 min. The sample was then cooled to 50 °C at 11.8 °C per minute before being held for 2 min.

2.7. Particle Size Distribution

An alpine jet sieve (E200 LS, Hosokawa Micron, Augsberg, Germany) was used to measure the particle size distributions (PSD) of raw mixes of the four experimental diets. Raw mix was defined as the unextruded mixture of ingredients in the formula except chicken fat and dry dog digest. The ASTM standard sieves with sizes ranging from 125 µm to 1000 µm were used for evaluating granulation. The analysis was carried out in duplicate by taking 100 g of raw mix for each run, from the smallest sieve size to the largest. The PSD was determined based on the weight of raw mix (g) passing through the sieves. Additionally, by measuring the weights of materials retained over each sieve, the geometric mean diameter (dgw) and geometric standard deviation of the particle diameter (Sgw) were calculated using the equations provided in the study of Patwa et al. (2014) [27].

2.8. Extrusion Processing

Prior to extrusion, feed rate calibration was conducted with raw mixes of SBM and SPI diets to understand the influences of feeder screw speed and the material height in the feed hopper on actual feeding rate. Measurements were taken at two hopper fill levels (high and low) and two screw speeds (11 and 14 RPMs). Raw mixes were fed into the preconditioner (PC) via a volumetric screw feeder on a live bottom feed hopper. The materials were then hydrated with steam and water in the PC (Model 2 Differential Conditioner, Wenger Manufacturing, Sabetha, KS, USA) before entering a 3.25-inch-diameter barrel single-screw pilot-scale extruder (X-20, Wenger Manufacturing, Sabetha, KS, USA). The extruder had six-barrel heads that were divided into three heating zones. The feed intake used single-flight full-pitch screws and then transitioned into double-flighted half-pitch cone screws at the discharge end followed by a die with a single 7.07 mm opening. Four steam locks were used (two small, one medium, and one large) inter-screw (Figure 1). During extrusion, some input variables were kept the same across diets, including feeder screw speed (13 rpm), PC shaft speed (400 rpm), PC steam flow (13.1 ± 0.09 kg/h), barrel set temperatures (50 °C, 70 °C, and 90 °C for each head zone), and knife speed (1842 rpm). The extruder shaft speed was 636 rpm for SBM, AMF, and FSBM, but had to decrease to 342 rpm for SPI due to surging.
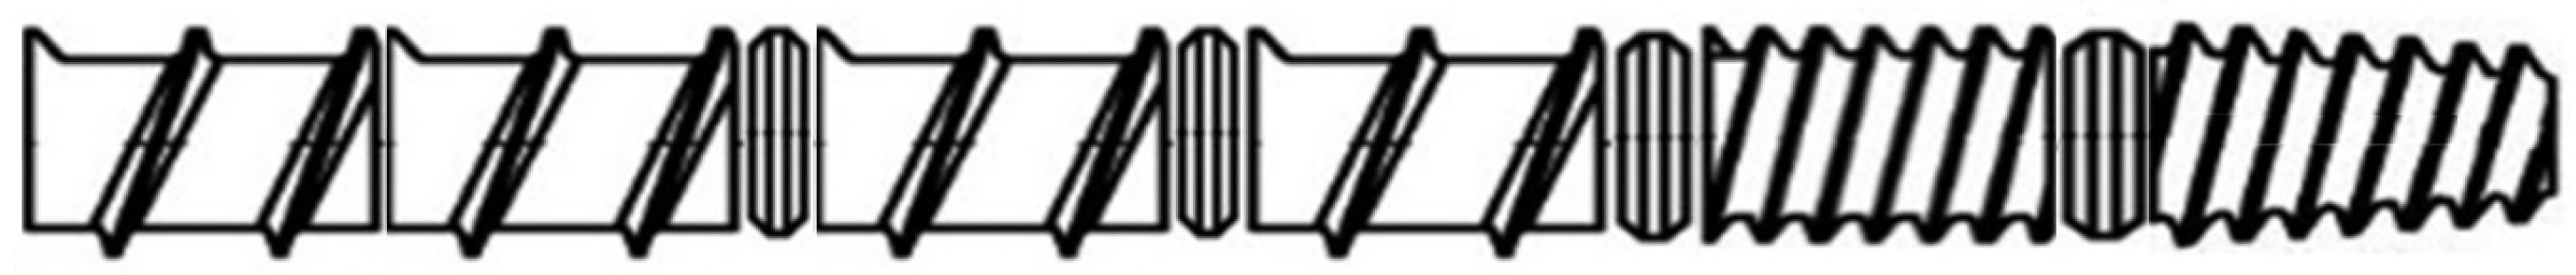
  • Screw element 1: inlet screw, single-flight full-pitch;
  • Screw element 2: single-flight, full-pitch screw;
  • Screw element 3: small steam lock;
  • Screw element 4: single-flight full-pitch screw;
  • Screw element 5: small steam lock;
  • Screw element 6: single-flight, full-pitch screw;
  • Screw element 7: medium steam lock;
  • Screw element 8: double-flight, ½-pitch screw;
  • Screw element 9: large steam lock;
  • Screw element 10: double--flight, ½-pitch, cone screw.
The die temperature and pressure were measured during processing using two separate probes inserted in the material stream, located 5 cm behind the die exit. Products were cut with 6 hard knives upon leaving the extruder. The extrudates were then transported via a negative-pressure air-conveying system to a pilot-scale dryer, where they were dried at 220 °F (104.4 °C) for 12 min. This was followed by 6 min in the cooler (Wenger Manufacturing, Sabetha, KS, USA) to reach a final moisture content below 10%. Processing parameters were kept constant across treatments, though some natural variability was observed. Kibble samples out of the extruder and process data were collected at 0, 30, and 60 min of the production of each diet. After drying, chicken fat and digest (dry dog flavor) were applied to the kibbles using a double-ribbon blender (Wenger Manufacturing, Sabetha, KS, USA). Samples were collected before and after coating for further analysis.
The throughput of the extruder was measured twice during the final ten minutes of each diet production by weighing the extrudates collected from the extruder discharge portal in 1 min. The raw mix feed rate (as-is basis) was calculated by a mass balance Equation (4):
F e e d   r a t e   ( k g / h )   = T × 1 X w k 1 X f w
where T is throughput (kg/h), Xwk is the moisture content of wet kibbles, and Xfw is the moisture content of the feed material.
In-barrel moisture (IBM) was calculated using the following Equation (5):
I B M   ( % )   = m f * X f w + m p s + m p w + m e w m f + m p s + m p w + m e w × 100
where mf is the feed rate (kg/h, as-is), Xfw is the moisture content of the feed material, and mps and mpw are the steam injection rate (kg/h) and water injection rate (kg/h) in the preconditioner, respectively. mew is the water injection rate (kg/h) in the extruder barrel.
SME was calculated using the following Equation (6):
S M E   ( k J / k g )   τ τ 0 100 × N N r × P r m
where τ is the extruder motor load, τ0 is the extruder no-load % torque, N is the extruder screw speed (rpm), Nr is the rated extruder screw speed (rpm), Pr is the rated extruder motor power (kW), and m is the dry matter feed rate (kg/s).

2.9. Kibble Physical Characteristics

The sectional expansion index (SEI) was determined by comparing the squared diameter of the dried extruded kibbles by the squared die diameter of the extruder (7):
S E I   =   D 2 d 2
where D (mm) is the extrudate diameter and d (mm) is the extruder die diameter.
Specific length was determined using Equation (8):
s p e c i f i c   l e n g t h   ( m m / g )   =   l m
where l (mm) is the extrudate length and m (g) is the extrudate mass.
Piece volume was determined using Equation (9):
P i e c e   v o l u m e   ( V , c m 3 )   =   π D 2 l 4
Piece density (g/cm3) was determined using Equation (10):
P i e c e   d e n s i t y   ( g / c m 3 )   =   m V
where m is the piece mass (g).
The wet bulk density was measured off the extruder in three replicates manually during each treatment processing using a 1 L cup and leveling the kibbles with a metal ruler and weighing on a digital scale with 0.1 g sensitivity. The dry bulk density was measured off the dryer in three replicates using the same method.

2.10. Statistical Analysis

In Experiment 1, a 2-way ANOVA was performed to analyze the effects of inoculation dosage, fermentation duration, and their interaction on CP content and in vitro protein digestibility using a generalized linear mixed model in statistical software (GLIMMIX, SAS version 9.4, SAS Institute, Inc., Cary, NC, USA) with position and day as random effects. Tukey’s post hoc test was applied for least-squares means separation. In Experiment 2, a paired t-test was used to analyze the nutrient content changes through fermentation. Extrusion and kibble characteristic data (Experiment 3) were analyzed with a generalized linear mixed model in statistical software (GLIMMIX, SAS version 9.4, SAS Institute, Inc., Cary, NC, USA). Tukey’s post hoc test was applied for the least-squares means separation. Significance was considered at p < 0.05 for all analyses. For each diet production, sampling was conducted at evenly spaced intervals (30 min), which were considered replicates.

3. Results

3.1. Optimal Inoculation Dosage and Fermentation Duration (Experiment 1)

Content of OM, CP, TDF and IDF on DM basis were only influenced by fermentation duration (p < 0.05) but not by inoculation dosage (p value ranged from 0.2 to 1.0) or the interaction (p value ranged from 0.6 to 1.0) of inoculation dosage and fermentation duration (Figure 2). The CP content was greater (55.77%, p < 0.05) in soybean meal fermented with A. oryzae for 48 h compared to that of soybean meal fermented for 24 h or less (at an average of 52.60%). The in vitro protein digestibility of A. oryzae fermented soybean meal was not affected by any factors studied. However, OM and IDF in A. oryzae fermented soybean meal decreased significantly (p < 0.05) after 24-h fermentation (93.01%) compared to unfermented soybean meal (93.33%), with no further changes observed after 24 h. The SDF in the A. oryzae fermented soybean meal showed a trend (p = 0.097) of increase from 36-h to 48-h (5.85% and 7.68%, respectively) fermentation duration; but was not influenced by inoculation dosage, or the interaction between inoculation dosage and fermentation duration. To achieve our goal of increasing protein content and limiting SDF in fermented soybean meal, an inoculation dosage of 1 × 10⁴ spore/g substrate DM and a fermentation duration of 36 h was determined to be optimal.

3.2. Impact of Fermentation on Nutrient Profiles and Antinutritional Factors (Experiment 2)

Over 200 lbs of soybean meal fermented with A. oryzae from 19 batches using the optimal fermentation conditions identified from Experiment 1 were used to produce adequate ingredient for experimental diet production and subsequent animal feeding trials. However, 11 batches of unfermented soybean meal samples were moldy due to accidental exposure to tap water. Unfermented soybean meal and the corresponding fermented soybean meal samples from the remaining eight batches were used for analysis of macronutrients. One composite sample of unfermented soybean meal and another composite sample of fermented soybean meal from these eight batches were used for analysis of amino acid composition, sugars (sucrose, stachyose, raffinose, and verbascose) and aflatoxins. The trypsin inhibitor (Kunitz trypsin inhibitor and Bowman-Birk trypsin inhibitor) analysis data came from corresponding unfermented soybean meal, retorted but not fermented soybean meal, and fermented soybean meal from five batches.
The fermentation of soybean meal with A. oryzae decreased (p < 0.05) OM, IDF, and gross energy (GE) in soybean meal, while it increased (p < 0.05) the CP and SDF content (Table 2). The CF and TDF contents were not influenced by fermentation. For amino acid composition, the methionine content numerically increased from 0.72% to 0.81% DM and cysteine content numerically increased from 0.76 to 0.82% DM (Table 3). Sucrose was completely eliminated, while stachyose, raffinose, and verbascose were greatly reduced by 95.22, 87.37, and 41.82%, respectively, in fermented soybean meal. Both KTI and BBI in unfermented soybean meal (3.17 and 2.29 TIU/g DM) were completely inactivated by retort processing. The aflatoxin content of fermented soybean meal was 2.6 ppm, which is well below the U.S. Food and Drug Administration (FDA) guideline limit in pet food (20 ppm).

3.3. Raw Mix Characteristics

3.3.1. Rapid Viscosity Analysis

The rapid viscosity analysis (RVA) revealed the peak viscosity for each experimental treatment (Figure 3). The results showed clear differences among soybean products, with SPI exhibiting the highest peak viscosity (360 cp), followed by SBM and AMF (both less than 200 cp), and FSBM showing the lowest peak viscosity (less than 100 cp). The inclusion of 1% Amaferm® in AMF did not affect the peak or final viscosity, as their viscosity curves overlapped. The SPI also took less time for hydration and swelling, which enabled it to have a lower pasting temperature (around 78 °C) than the other three diets (>80 °C). In contrast, FSBM showed less changes in viscosity compared with the other three diets during the entire cycle. However, FSBM started to build up viscosity and reached the peak viscosity (both in less than 4 min) faster than SBM and AMF (at around 5 min).

3.3.2. Particle Size Distribution

Both the geometric particle size (Dgw) and geometric standard deviation of the particle diameter (Sdw) decreased in the order of SBM, AMF, FSBM, and SPI (Table 4). The cumulative particle size distribution showed that the raw mix of SPI had over 60% particles under 300 μm, while that of the raw mixes of the other three diets were no more than 50% (Figure 4). The greater slope of the SPI line at small particle size area also reflected a greater portion of small-sized particles compared with the other three diets.

3.4. Extrusion Performance of A. oryzae Fermented Soybean Meal (Experiment 3)

3.4.1. Extrusion Processing

The objective of the extrusion process was to evaluate the performance of fermented soybean meal compared with regular soybean meal and soybean protein isolate in terms of extrusion conditions and outcomes. The PC discharge temperature was consistent across treatments, but the PC water injection rate was greater (p < 0.05) for SBM and AMF (18.50 and 19.30 kg/h, respectively) than that for FSBM and SPI (11.27 and 13.07 kg/h, respectively) (Table 5). The motor power and die temperature were both greater (p < 0.05) for FSBM and SPI (10.57 kW, 117 °C and 10.03 kW, 117.33 °C, respectively) than those for SBM and AMF (5.90 kW, 100.33 °C and 7.57 kW, 104.67 °C, respectively). The in-barrel moisture (IBM) content was the lowest (p < 0.05) for FSBM (28.21%), while SPI (33.45%) had lower (p < 0.05) IBM than SBM and AMF (34.46% and 34.69%, respectively). The SPI (305.3 kJ/kg) generated the greatest (p < 0.05) SME, with the SBM (83.7 kJ/kg) generating the least (p < 0.05) SME.

3.4.2. Kibble Characteristics

The kibbles from the SBM and AMF diets had poor expansion, leading to inefficient drying with a moisture content of about 15% after the initial drying session. To address this, these kibbles were manually re-fed into the dryer at a rate matching the extrusion throughput for a second drying session on the following day. All reported dry kibble data reflect samples that underwent two drying sessions. Both wet and dry kibbles followed a similar ranking in SEI, with the kibbles from SPI showing the greatest expansion (p < 0.05), followed by kibbles from FSBM. Kibbles from the SBM and AMF diets had the least expansion (p < 0.05) (Table 5). The differences in bulk density among diets were more distinguishable in dry kibbles than in wet kibbles. For the dry kibbles, bulk density decreased (p < 0.05) in the order of SBM, AMF, FSBM, and SPI (520.3, 481.0, 385.0, and 324.7 g/L, respectively).

3.4.3. Experimental Diets

All experimental diets reached a moisture content below 10%, with FSBM slightly dryer than the other three diets (Table 6). The CP and CF contents were similar among diets at an average of 33.4% and 11.8% DM basis, respectively. For dietary fiber composition, the SPI was lower in TDF (14.0% DM basis) and IDF (9.4% DM basis) than the other three diets (at an average of 18.4% TDF and 13.9% IDF on DM basis). The gross energy content was similar among all diets at an average of 4925 kJ/kg DM basis.

4. Discussion

4.1. Optimal Inoculation Dosage and Fermentation Duration (Experiment 1)

Many studies investigating factors affecting enzyme production of A. oryzae used a single material or a combination of wheat, wheat bran, rice hull, rice bran and other grains commonly used in the commercial enzyme industry. These studies primarily focused on enzyme harvest instead of nutrient changes in the substrate through fermentation [28,29,30,31,32,33,34,35,36]. Industrial fermentation of soybean meal with A. oryzae for traditional human foods has mostly utilized enzyme-assisted fermentation or co-fermentation with other microorganisms in liquid-state rather than solid-state fermentation [6,7,8,9,20,37]. To our knowledge, this is the first study to evaluate the effects of inoculation dosage and fermentation duration on nutritional properties of soybean meal through pilot-scale solid-state fermentation with A. oryzae alone. In this study, we evaluated three inoculation dosages (1 × 10⁴, 5 × 10⁵ and 1 × 10⁶ spore/g substrate DM) and fermentation durations of up to 48 h.
A. oryzae is a major source of commercial protease production in the food industry, with the additional advantage of lacking the gene to produce aflatoxins [5]. This fungal species produces multiple types of proteases including acid, neutral, alkaline proteases, and prolyl endopeptidases [30,33,35,38]. These enzymes play a crucial role in modifying soybean proteins during fermentation, making them essential to the production of fermented soy-based products. Battaglino et al. (1991) [39] found that an initial pH of 7.0 and moisture content of 35–40% were favorable for protease production, while Chutmanop et al. (2018) [28] found that 50% was the ideal substrate moisture content for A. oryzae to produce protease. The latter also reported that an initial pH of 7.5 yielded about 30% greater protease activity than an initial pH of 5.5. However, the two studies used different buffer pH values for protease activity measurement (7.0 and 10.0, respectively), which is a critical factor to consider when interpreting results from different studies. The initial pH of the substrate was not investigated in this study, which may be a limitation of the results. Other factors, including temperature, initial moisture content, relative humidity, and solid versus liquid/submerged state, were all set at optimal levels for A. oryzae growth according to previous studies [28,32,36,40].

4.1.1. Crude Protein

Crude protein (CP) did not increase significantly for the first 24 h before increasing steadily until 36 h. The A. oryzae, like most filamentous fungi, follows a biphasic growth regime, which was seen in this study. The first phase is characterized by logarithmic growth and involves the consumption of carbohydrates [28,39] During this phase, the fungus is scavenging proteins from the soybean meal and incorporating them into the biomass. This leads to no net increase in CP, since no new protein is being generated. As the process continues, more and more of the soybean meal is consumed and converted into A. oryzae biomass, which has a native CP of 39.6% to 49% [41]. As the fungus runs out of protein to integrate, it will begin generating protein from other nitrogen sources. Where the nitrogen is sourced from is, unfortunately, understudied and these sources remain undefined.
Surprisingly, inoculation dosage did not affect CP content in the fermented soybean meal in this study, although a positive relation between protease activity and inoculation dosage had been reported (from 104 to 106 spore/g substrate) [39]. We can assume protease production, despite the lack of protein generation during the initial growth phase since protease production does not necessarily indicate protein production. Instead, steady consumption of the native protein by A. oryzae marked by a steadily increasing amount of protease as protein becomes more scarce, eventually leading to the conversion of other nitrogen sources [28,39]. For example, in the early stage of rice bran fermentation with A. oryzae, the amylase activity peaked between 10 and 20 h before declining, while protease activity increased mildly at the beginning and then accelerated from 24 to 60 h [28]. Meanwhile, protease activity was previously found to reach the plateau at hour 48 during the solid-state fermentation of cracked whole soybean with A. oryzae [42] Soybean meal, being a less starchy but more protein-rich substrate compared with rice bran, did not appear to accelerate protease activity under our fermentation conditions, as indicated by the trend in the CP content change. Neutral proteases are the most important type of enzymes to break down soybean proteins during A. oryzae fermentation, though acidic proteases may dominate in the early stages of solid-state fermentation [35]. Instead of substrate nutrient composition, pH may play a more significant role in regulating protease activity, warranting further investigation.

4.1.2. In Vitro Protein Digestibility

Fermentation with A. oryzae has been shown to be able to decrease the overall protein molecular weights in soybean meal [6,7,9]. Studies also found that soybean meal protein had greater in vitro trypsin or pepsin digestibility after fermentation with A. oryzae or Lactobacillus plantarum [8,43]. In this study where in vitro protein digestibility was measured using porcine pepsin and pancreatin, the protein digestibility of fermented soybean meal ranged between 80 and 90%, regardless of inoculation dosage and fermentation duration. It is important to note that we used a prolonged retort process (2 h) to sterilize fermentation substrate, which very likely have decreased protein digestibility due to the formation of indigestible protein aggregates or complexes with other dietary components (e.g., protein, fiber and starch). This reduction may be attributed to the formation of indigestible protein aggregates or complexes with other dietary components during harsh retort process, a phenomenon reported in other studies [44,45]. However, protein aggregation should be broken down and incorporated into the A. oryzae, raising the digestibility back up since A. oryzae has a native digestibility of 82–96% [41]. While in vitro protein digestion is a rather simple process compared with in vivo digestion, several factors still significantly affect protein digestibility, including protein structure (including amino acid composition and sequence), protein solubility, formation of disulfide bonds and cross-linking, molecular size/peptide length, and presence of antinutritional factors. An additional observation during trypsin inhibitor analysis in this study was that NaOH soluble protein markedly decreased after fermentation, which agreed with the study of Frias et al. (2008) [6]. This might have compromised the protease accessibility of the soybean protein, despite the lower molecular weight. The maintained in vitro protein digestibility of A. oryzae-fermented soybean meal may be related to the amino acid profile change, decreased protein solubility (as observed during trypsin inhibitor activity analysis), and possible negative influences from fungal biomass that require further investigation.

4.1.3. Fiber Composition

The SDF in soybean meal consists of pectic polysaccharides, hemicelluloses (e.g., β-glucans, mannans, xyloglucan, and arabinoxylans), and other non-starch polysaccharides (NSP) and oligosaccharides [46,47]. They all serve as substrates for colonic fermentation, leading to complex impacts on the host. The effects of dietary NSP and oligosaccharide (OS) on nutrient digestibility depend on the inclusion level, sources, and composition. Soy NSPs seem to decrease nutrient digestibility to a greater extent than other common dietary fiber sources, such as wheat bran and sugar beet pulp [48]. The addition of soy OS to diets also decreased nutrient digestibility in swine [49,50]. This study focused on improving soybean protein content and digestibility through fermentation with A. oryzae. To achieve this, avoiding an increase in SDF was prioritized. Note that the SDF analysis method used in this study did not take account of soybean OS. Our results showed that neither TDF nor IDF content in the soybean meal changed from hour 24 to 48, regardless of inoculation dosage. However, the SDF content was maintained until the late stage of fermentation, showing a trend of increasing from 36 to 48 h (p = 0.0969, from 5.85% to 7.8% of DM). Fermentation for 36 h seemed to be a conservative and time-efficient choice to balance the changes in CP and SDF during the solid-state fermentation with A. oryzae.
The trend of increased SDF was very likely multifactorial. Gomi’s (2014) [5] review highlighted genes in A. oryzae related to extracellular enzymes that contribute to the solubilization of carbohydrates. For example, A. oryzae extracts have been found to stimulate the in vitro degradation of cellulose and hemicellulose after 12 h [51]. Mohammadi et al. (2024) [52] reported 100% solubilization of arabinoxylan fiber with xylanase treatment. A linear increase in the in vitro digestibility of DM and neutral detergent fiber associated with A. oryzae dosage was also reported [53]. Notably, A. oryzae is also famous for reducing OS, which is also a type of SDF in soybean meal. The synthesis of α-galactosidase and β-galactosidase by A. oryzae breaks down α-1,6 and β-1,6 glycosidic bonds, respectively, reducing the OS content [34,54]. A study found α-galactosidase synthesis of A. oryzae plateaued when inoculation dosage reached 1 × 10⁵ spore/g substrate [31,34]. Though the substrate for α-galactosidase (e.g., the OS) was not measured, the lack of dosage effects at a higher level on general SDF hydrolase content was consistent with our results as the second-highest dosage (5 × 10⁵ spore/g substrate) used in our study was already greater than the “adequate” dosage found by Shankar and Muliani (2007) [34].
Additionally, the fungal biomass of A. oryzae formed during fermentation also contained dietary fiber in the cell wall and hyphae, mostly β-glucans and chitin [55]. In filamentous fungus species such as A. oryzae, the soluble β-glucans and insoluble chitin comprise around 50–60% and 10–20% of the dry cell wall weight, respectively. Therefore, the accumulation of fungal biomass also contributed to the increase in SDF in the fermented soybean meal. The maintained SDF content during the early to middle stage of fermentation in this study could be a balance of the degradation of soybean SDF, solubilization of soybean IDF, and formation of fungal SDF.
Based on these fundings, we scaled up the soybean meal fermentation with A. oryzae using an inoculation dosage of 1 × 10⁴ spore/g and a fermentation duration of 36 h. This approach was chosen to increase the CP content while minimizing the increase in SDF.

4.2. Impact of Fermentation on Nutrient Profiles and Antinutritional Factors (Experimental 2)

4.2.1. Changes of Macronutrient Contents

In this experiment, all soybean meals were fermented with A. oryzae at 1 × 10⁴ spore/g DM for 36 h, while the other conditions remained the same as those in experiment 1. The reductions in OM and CP, along with the retention of TDF and reduction in IDF after fermentation, aligned with the results observed in experiment 1 (Figure 1). However, the increase in SDF became statistically significant (it was numerically greater in experiment 1), likely due the enhanced power of the statistical model (replicates increased from 3 to 8). The decrease in GE after fermentation was likely due to sampling and analytical variation because the ash, CP, and CF contents all increased, which should have increased GE content from a chemical perspective. Hong et al. (2004) [7] reported an average 5% increase in soybean meal CP content after solid-state fermentation with A. oryzae. This was similar to the 4.65% increase observed in this study. However, they also observed an increase in CF after fermentation; this was probably due to the longer fermentation duration (48 h) that increased the biomass proportion [56]. Similarly, Teng et al. (2012) [8] reported an average 2.9% increase in CP in A. oryzae fermented soybean meal. The low initial CP content of their substrates (34.46%) suggests that the increase in CP may be also related to the initial CP level or overall carbohydrate to protein ratio in the substrate. Other studies have also supported significant increases in the CP content in soybean meal fermented by A. oryzae alone or in combination with other microorganisms or enzymes under various conditions [9,20,37,57].
Any time that filamentous fungi, such as A. oryzae, are utilized in food production, the concern of mycotoxins must be addressed. These toxins (such as aflatoxin and ochratoxin) are not typically produced by A. oryzae in quantity [5]. It is even possible for A. oryzae to degrade aflatoxin and suppress its production in other fungal species under certain conditions [58]. However, it must be noted that some species of A. oryzae have been recently reported to produce aflatoxins under high sucrose and some other conditions [59], though 80–95% of aflatoxins produced by A. oryzae or contaminants in this case would be destroyed by the extrusion process [60].

4.2.2. Amino Acid Composition

Combined with CP content, amino acid composition provides a better reflection of the quality of a protein ingredient. The limiting amino acid in soybean for cats and dogs is methionine and/or sulfur-containing amino acids (SAAs) [61,62]. One study reported that solid-state fermentation with A. oryzae increased the methionine content per unit of protein in cracked soybean seeds [6]. However, our study found that solid-state fermentation with A. oryzae did not increase the methionine content. This is consistent with findings from previous studies using similar procedures [7,8,9,20,57]. Methionine synthase was reported as one of the five most abundant proteins in A. oryzae during solid-state fermentation of pea protein isolate, and the abundance of this enzyme peaked at 36 h during fermentation [29]. They postulated that the failure of A. oryzae in efficiently increasing the methionine or SAA content possibly resulted from the rapid methionine degradation rate.
Methionine plays a significant role in the biosynthesis of aflatoxins in Aspergillus species, primarily through its conversion into S-adenosylmethionine (SAM), which acts as a methyl donor in various methylation reactions essential for aflatoxin production [63]. A. oryzae is known to be incapable of aflatoxin synthesis [5], which may have decreased demands for methionine biosynthesis. Betaine and choline supplementation were reported to repress methionine synthase transcription by decreasing the demand for methyl group while homocysteine supplementation enhanced the transcription [64]. The amino acid analysis of a commercial A. oryzae biomass product (Amaferm®, BioZyme, Inc., St. Joseph, MO) showed greater cysteine content but similar methionine content compared with soybean meal (data from the same first author to be published, Chen et al.). This indicated that A. oryzae might be able to accumulate cysteine, but barely convert it to methionine. Meanwhile, the majority of proteins in the solid-state fermentation product originate from the initial substrate, rather than the fungal biomass, accounting for 93.2% and 6.8%, respectively, after 36 h of fermentation. Therefore, even if the fungus itself can efficiently accumulate a certain amino acid, the accumulation in the biomass would have minor impacts on the overall amino acid content of the fermentation end product.
In summary, multiple factors may have limited the capacity of A. oryzae in accumulating methionine within fungal cells, such as low cysteine content in substrate (true for the soybean meal used in this study), limited inorganic sulfur resources from the substrate and the environment, low demands for methyl from methionine due to the existence of alternative methyl resources of the fungus, etc.

4.2.3. Oligosaccharides

Research has shown that the galacto-oligosaccharides (GOSs), including raffinose, stachyose and verbascose, are fermented more rapidly in the colon of monogastric animals compared with other types of SDF found in soybean meal [50,65]. This rapid fermentation is associated with complaints of flatulence and abdominal discomfort in monogastric animals.
In this study, the removal of or reduction in sucrose and GOS through fermentation was expected as A. oryzae is known to produce α-galactosidase [5]. Soybean meal sucrose was found to be fully digested after 20 h of fermentation, while GOS needs at least 28 h for complete breakdown [57]. The A. oryzae in our study more effectively reduced stachyose compared with raffinose and verbascose (relative reductions of 95.2, 87.4, and 41.8%, respectively). Another study reported 88% and 76% relative reductions in stachyose and raffinose, respectively, after 10 days of solid-state fermentation of soybean meal with A. oryzae [66]. Our greater reduction was likely due to the promoted ventilation allowed by the lower initial moisture content and large trays instead of glass flasks. Shankar and Muliani (2007) [34] found that increasing the solid substrate spatial concentration (from 100 to 400 g/tray) during solid-state fermentation, while keeping the inoculation dosage constant, decreased enzyme production, likely due to poor ventilation from the increased substrate thickness on the tray. This highlights the importance of proper ventilation during fermentation to maximize OS degradation. Our practice of breaking, flipping, and spraying the surface of caked substrate every 12 h improved ventilation and substrate exposure, facilitating more efficient enzymatic activity and carbohydrate breakdown, which played a critical role in enhancing GOS degradation.

4.2.4. Trypsin Inhibitor

Previous studies have confirmed that TIs in soybean meal can be greatly reduced or inactivated through fermentation, partly due to potent proteases from A. oryzae [7,8,20,57]. There are two major types of TI in soybeans that these enzymes target on trypsin or both trypsin and chymotrypsin: Kunitz TI (KTI) and the Bowman–Birk TI (BBI), respectively [67,68]. The BBI is more resistant to physical and chemical inactivation, such as heat or acids for proteolysis by pepsin, compared with KTI owing to its different compositions and conformations [69]. Both trypsin and chymotrypsin are important serine proteases with similar catalytic mechanisms but different substrate specificities: KTI prefers basic amino acids like lysine and arginine, while BBI prefers aromatic amino acids like phenylalanine, tryptophan, and tyrosine [70]. The standard methods for soybean TI activity analysis are American Oil Chemists’ Society (AOCS) and the American Association of Cereal Chemists International (AACCI) approved methods [23]. These methods measure the total inhibition on trypsin by KTI and BBI. The residual 10–20% TI activity in soybean meal after standard inactivation treatments usually comes from the heat-insensitive BBI [67,71]. In order to evaluate the impacts of solid-state fermentation with A. oryzae on BBI in soybean meal, chymotrypsin inhibition was also measured in addition to trypsin inhibition, which would be able to reflect the level of BBI alone.
However, our study found that the retort at 121 °C for 2 h eliminated total TI activity in the unfermented soybean meal. Other studies either did not measure TI activities in retorted soybean meal or retorted at relatively low temperature or/and much shorter duration [7,8,20]. The reason for the longer retort duration in our study was to control field contamination during fermentation as our batch size was much greater than that of previous studies (at least 14 kg per batch vs. less than 100 g in the flask). Chen et al. (2013) [57] reported 2.1 TIU/mg autoclaved (121 °C, 15 min) soybean meal, which was completely eliminated after 36 h of solid-state fermentation with A. oryzae. Our study did not detect any TI activity in retorted soybean meal, probably due to the longer retort time and the use of different measuring methods. Moreover, our study used a relatively novel method of trypsin inhibitor activity analysis, which seemed to be less sensitive than traditional methods [23].

4.3. Extrusion Performance of A. oryzae Fermented Soybean Meal (Experiment 3)

4.3.1. Raw Mix Characteristics and Extrusion Process

Considering the experimental diet formulations, the distinct particle size distribution of the SPI raw mix is likely attributed to the fine particles in the soybean protein isolate and possibly the brewer’s rice as well. It was reported that soybean protein isolate is more viscous than corn starch under similar shear rates using a capillary rheometer [72], which better reflects the viscosity of material in an extruder barrel. This could explain the extraordinarily high peak and final viscosity of the SPI raw mix observed in our study. The fermented soybean meal ingredient was ground through a 1.00 mm sieve before mixing with the rest of the formula, which explained that the raw mix of FSBM had less sample retained on the 1000 μm sieve compared with the SBM and AMF mixes, considering that they had very similar base ration. A smaller particle size of material usually leads to greater SME and expansion as intra-particle friction would be greater [73,74].
Under the same feeder screw speed, the raw mix of FSBM tended to have a greater feed rate which indicated greater flowability than the other three formulas, consistent with its low viscosity. This also indicated that, under the same extruder screw speed, the FSBM had greater barrel fill than the SBM and AMF diets, hence possibly less mechanical energy per unit of material. The FSBM had relatively higher preconditioner (PC) discharge temperature in spite of its lower PC water injection rate compared with SBM and AMF. The moisture content of the FSBM raw mix (7.42%) was approximately 1.5% lower than that of SBM and AMF (8.86 and 9.18%, respectivley). This indicated that the FSBM raw mix required lower moisture to generate heat for cooking in the PC. Considering the low feed rate of the SPI, the extruder shaft speed had to be decreased to avoid surging by inadequate material supply, which was necessary to maintain the die pressure. The greater motor power and die temperature for FSBM compared with those for SBM and AMF were expected as the FSBM feed rate was relatively high and IBM was lower. The in-barrel moisture (IBM) content for FSBM was the lowest among all experimental diets. The extruder water injection rate was automatically adjusted by the extruder system to maintain the fixed barrel temperature. This suggested that FSBM material may have required much less moisture than the other three diet materials to build up viscosity to generate SME. However, this finding does not align with the RVA results in this study. Instead, the increased SME for FSBM may also be influenced by particle size, as smaller particles usually create more mechanical energy due to increased contact surface per unit volume [73,74]. The particle size distribution analysis confirmed that the FSBM had smaller geometric mean diameter compared with both SBM and AMF. It also explained the greatest SME in the SPI raw mix when it had slightly lower IBM than both SBM and AMF.
The greater IBM in the SPI compared with the FSBM may explained the similar diet temperature regardless of the greater SME in the former: water acts as a heat sink that absorbs thermal energy and lower die temperatures [75]. Bhattacharya et al. (1987) [75] reported that lower IBM increased die pressure due to the more viscous material, which is opposite to observation on the FSBM and the SPI. This may be explained by the RVA results showing that the SPI raw mix had the greatest viscosity while the FSBM raw mix barely built-up viscosity. The feed rate and extruder shaft speed influence die pressure in an opposite way. Another possible reason for the higher die pressure for SPI than FSBM could be that the decreased extruder screw speed led to increased barrel fill, despite the slightly decreased feed rate.

4.3.2. Kibble Characteristics

The poorly expanded kibbles from SBM and AMF resulted in high dry kibble bulk density. The cause should be the low SME and die temperatures as a consequence of high IBM and lower viscosity compared with FSBM kibbles. Again, it is important to note that RVA results are not directly related to the actual material viscosity within the extruder barrel, where significantly higher pressure, moisture content, heat, and shear forces are present. Previous studies showed that high pressure increases soybean protein viscosity [76,77]. Additionally, higher moisture content can decrease the overall protein mixture viscosity because water acts as a plasticizer that reduces the viscosity of protein mixtures and moderates the effect of pressure [78]. The great kibble expansion of the SPI diet is attributed to the high-functionality (film-forming) of soy protein isolate and brewer’s rice compared with regular soybean meal, which were reflected by greater SME, die temperature, and pressure even though the SPI had much greater IBM that the FSBM. Additionally, IDF tends to decrease kibble expansion [79]. The low IDF content in SPI diet should also have contributed to kibble expansion.
The specific length of FSBM kibbles was greater than that of SBM and AMF (wet) or SBM and SPI (dry kibbles), indicating greater longitudinal expansion of FSBM kibbles. Compared with SPI, the greater longitudinal expansion of FSBM kibbles was probably at the expense of sectional expansion as the two are usually negatively related [79,80]. However, the FSBM kibbles had both greater sectional and longitudinal expansion than SBM and AMF kibbles.
We also observed shrinkage (decreased SEI) of kibbles after drying for the SBM, AMF, and FSBM diets, but the opposite for SPI diet. The extended drying time may have caused significant shrinkage due to moisture loss. Additionally, the mild fluctuation in kibble expansion during extrusion and sampling timing for wet and dry kibbles may also have contributed to the observed changes in SEI after drying.

4.3.3. Experimental Diets

The SBM and AMF formulas only differed by less than 2% of corn. In the latter, corn was replaced by Amaferm® to produce this experimental diet. As anticipated, the macronutrient compositions of these two diets were very similar, except for the SDF concentration, which is more likely due to analytical variation. The slightly higher IDF and SDF in FSBM than in SBM and AMF reflects the differences in fiber contents between their corresponding ingredients (soybean meal and fermented soybean meal) [2]. The SPI had markedly lower IDF and TDF content compared with all other diets. The primary variation among formulas was the type of soybean product used. Due to the soybean protein isolate’s high CP content (over 90%) [72], matching the protein levels of the other diets without major ingredient adjustments was not feasible. Instead, we maintained similar ratios of soybean protein to overall diet protein, resulting in 18% soybean protein isolate and 10.68% brewers’ rice to balance the composition.
Both soybean protein isolate and brewers’ rice contain significantly lower levels of TDF and IDF compared with soybean meal and fermented soybean meal [81], leading to decreases IDF and TDF in the SPI. However, the SDF levels in the SPI remained comparable to those of the other diets, likely due to effective compensatory increases in brewers’ rice, corn, and/or reductions in poultry by-product meal.

5. Conclusions

The fermentation of soybean meal with A. oryzae at 1 × 10⁴ spore/g substrate DM for 36 h improved protein quality by increasing its crude protein content (from 50.05 to 54.69% DM) and sulfur-containing amino acids (methionine + cysteine, from 1.48 to 1.63% DM), eliminated sucrose and reduced soybean oligosaccharides (a total of 86.91% reduction). When including the fermented soybean meal in a dog food formula at 30%, a practical extrusion processing with a single-screw extruder was achieved, yielding greater SME generation and kibble expansion compared with traditional soybean meal. This study provides a potential solution to the pet food industry to facilitate greater utilization of soybean meal in dog foods and proved its processability. However, further animal feeding studies are needed to investigate its impact on digestibility, stool quality, and palatability when fed to dogs.

Author Contributions

Conceptualization, D.W. and C.G.A.; methodology, Y.C.; software, Y.C.; validation, C.G.A. and S.A.; formal analysis, Y.C.; investigation, Y.C. and T.W.; resources, C.G.A.; and S.A. data curation, Y.C.; writing—original draft preparation, Y.C.; writing—review and editing, D.W., T.W., and C.G.A.; visualization, Y.C.; supervision, D.W. and C.G.A.; project administration, C.G.A.; funding acquisition, C.G.A. All authors have read and agreed to the published version of the manuscript.

Funding

This research was funded by Kansas Soybean Commissions (#2397).

Informed Consent Statement

Not applicable.

Data Availability Statement

Data are contained within the article.

Conflicts of Interest

The authors declare no conflicts of interest. The funders had no role in the design of the study; in the collection, analyses, or interpretation of data; in the writing of the manuscript; or in the decision to publish the results.

Abbreviations

The following abbreviations are used in this manuscript:
TITrypsin inhibitor
OSOligosaccharides
KTIKunitz trypsin inhibitor
BBIBowman–Birk trypsin inhibitor
DMDry matter
CPCrude protein
CFCrude fat
OMOrganic matter
TDFTotal dietary fiber
IDFInsoluble dietary fiber
SDFSoluble dietary fiber
GEGross energy
SEISectional expansion index
SMESpecific mechanical energy
RVARapid viscosity analysis
PSDParticle size distribution

References

  1. USDA FAS Soybeans|USDA Foreign Agricultural Service. Available online: https://fas.usda.gov/data/production/commodity/2222000 (accessed on 6 June 2024).
  2. Grieshop, C.M.; Kadzere, C.T.; Clapper, G.M.; Flickinger, E.A.; Bauer, L.L.; Frazier, R.L.; Fahey, G.C. Chemical and Nutritional Characteristics of United States Soybeans and Soybean Meals. J. Agric. Food Chem. 2003, 51, 7684–7691. [Google Scholar] [CrossRef]
  3. Ruiz, N.; Parsons, C.M.; Stein, H.H.; Coon, C.N.; van Eys, J.E.; Miles, R.D. A Historical Look at the Soybean and Its Use for Animal Feed. Available online: https://nutrition.ansci.illinois.edu/node/1566 (accessed on 14 July 2024).
  4. Stein, H.H.; Berger, L.L.; Drackley, J.K.; Fahey, G.C.; Hernot, D.C.; Parsons, C.M. Nutritional Properties and Feeding Values of Soybeans and Their Coproducts. In Soybeans; Johnson, L.A., White, P.J., Galloway, R., Eds.; AOCS Press: Champaign, IL, USA, 2008; pp. 613–660. ISBN 978-1-893997-64-6. [Google Scholar]
  5. Gomi, K. Aspergillus: Aspergillus oryzae. In Encyclopedia of Food Microbiology, 2nd ed.; Elsevier Inc.: Amsterdam, The Netherlands, 2014; pp. 92–96. [Google Scholar]
  6. Frias, J.; Song, Y.S.; Martínez-Villaluenga, C.; De Mejia, E.G.; Vidal-Valverde, C. Immunoreactivity and Amino Acid Content of Fermented Soybean Products. J. Agric. Food Chem. 2008, 56, 99–105. [Google Scholar] [CrossRef]
  7. Hong, K.-J.; Lee, C.-H.; Kim, S.W. Aspergillus oryzae GB-107 Fermentation Improves Nutritional Quality of Food Soybeans and Feed Soybean Meals. J. Med. Food 2004, 7, 430–435. [Google Scholar] [CrossRef]
  8. Teng, D.; Gao, M.; Yang, Y.; Liu, B.; Tian, Z.; Wang, J. Bio-Modification of Soybean Meal with Bacillus Subtilis or Aspergillus oryzae. Biocatal. Agric. Biotechnol. 2012, 1, 32–38. [Google Scholar] [CrossRef]
  9. Yang, H.; Qu, Y.; Li, J.; Liu, X.; Wu, R.; Wu, J. Improvement of the Protein Quality and Degradation of Allergens in Soybean Meal by Combination Fermentation and Enzymatic Hydrolysis. LWT 2020, 128, 109442. [Google Scholar] [CrossRef]
  10. Sukhikh, S.; Kalashnikova, O.; Ivanova, S.; Prosekov, A.; Krol, O.; Kriger, O.; Fedovskikh, N.; Babich, O. Evaluating the Influence of Microbial Fermentation on the Nutritional Value of Soybean Meal. Fermentation 2022, 8, 458. [Google Scholar] [CrossRef]
  11. Beloshapka, A.N.; De Godoy, M.R.C.; Detweiler, K.B.; Newcomb, M.; Ellegård, K.H.; Fahey, G.C.; Swanson, K.S. Apparent Total Tract Macronutrient Digestibility, Fecal Characteristics, and Fecal Fermentative End-Product Concentrations of Healthy Adult Dogs Fed Bioprocessed Soy Protein1. J. Anim. Sci. 2016, 94, 3826–3834. [Google Scholar] [CrossRef]
  12. Cervantes-Pahm, S.K.; Stein, H.H. Ileal Digestibility of Amino Acids in Conventional, Fermented, and Enzyme-Treated Soybean Meal and in Soy Protein Isolate, Fish Meal, and Casein Fed to Weanling Pigs1. J. Anim. Sci. 2010, 88, 2674–2683. [Google Scholar] [CrossRef]
  13. Feng, J.; Liu, X.; Xu, Z.R.; Lu, Y.P.; Liu, Y.Y. The Effect of Aspergillus oryzae Fermented Soybean Meal on Growth Performance, Digestibility of Dietary Components and Activities of Intestinal Enzymes in Weaned Piglets. Anim. Feed. Sci. Technol. 2007, 134, 295–303. [Google Scholar] [CrossRef]
  14. Sumi, H.; Hamada, H.; Nakanishi, K.; Hiratani, H. Enhancement of the Fibrinolytic Activity in Plasma by Oral Administration of Nattokinase. Acta Haematol. 1990, 84, 139–143. [Google Scholar] [CrossRef]
  15. Kim, M.H.; Yun, C.H.; Lee, C.H.; Ha, J.K. The Effects of Fermented Soybean Meal on Immunophysiological and Stress-Related Parameters in Holstein Calves after Weaning. J. Dairy Sci. 2012, 95, 5203–5212. [Google Scholar] [CrossRef]
  16. Yuan, L.; Chang, J.; Yin, Q.; Lu, M.; Di, Y.; Wang, P.; Wang, Z.; Wang, E.; Lu, F. Fermented Soybean Meal Improves the Growth Performance, Nutrient Digestibility, and Microbial Flora in Piglets. Anim. Nutr. 2017, 3, 19–24. [Google Scholar] [CrossRef]
  17. Tsumura, K.; Saito, T.; Tsuge, K.; Ashida, H.; Kugimiya, W.; Inouye, K. Functional Properties of Soy Protein Hydrolysates Obtained by Selective Proteolysis. LWT-Food Sci. Technol. 2005, 38, 255–261. [Google Scholar] [CrossRef]
  18. Ojokoh, A.O.; Yimin, W.; Eromosele, O.S. Effect of Some Extrusion Variables on Fermented Maize-Soybean Blend. J. Food. Sci. Technol. 2015, 52, 5763–5771. [Google Scholar] [CrossRef]
  19. Jin, Z.; Hsieh, F.; Huff, H.E. Effects of Soy Fiber, Salt, Sugar and Screw Speed on Physical Properties and Microstructure of Corn Meal Extrudate. J. Cereal Sci. 1995, 22, 185–194. [Google Scholar] [CrossRef]
  20. Gao, Y.; Wang, C.; Zhu, Q.; Qian, G. Optimization of Solid-State Fermentation with Lactobacillus Brevis and Aspergillus oryzae for Trypsin Inhibitor Degradation in Soybean Meal. J. Integr. Agric. 2013, 12, 869–876. [Google Scholar] [CrossRef]
  21. AOAC. Official Methods of Analysis, 21st ed.; Association of Official Analytical Chemists: Arlington, VA, USA, 2019. [Google Scholar]
  22. Bhatti, T.; Chambers, R.E.; Clamp, J.R. The Gas Chromatographic Properties of Biologically Important N-Acetylglucosamine Derivatives, Monosaccharides, Disaccharides, Trisaccharides, Tetrasaccharides and Pentasaccharides. Biochim. Biophys. Acta (BBA)—Gen. Subj. 1970, 222, 339–347. [Google Scholar] [CrossRef]
  23. Kim, S.; Krishnan, H.B. A Fast and Cost-Effective Procedure for Reliable Measurement of Trypsin Inhibitor Activity in Soy and Soy Products. In Methods in Enzymology; Biochemical Pathways and Environmental Responses in Plants: Part, B; Jez, J., Ed.; Academic Press: Cambridge, MA, USA, 2023; Volume 680, pp. 195–213. [Google Scholar]
  24. Bradford, M.M. A Rapid and Sensitive Method for the Quantitation of Microgram Quantities of Protein Utilizing the Principle of Protein-Dye Binding. Anal. Biochem. 1976, 72, 248–254. [Google Scholar] [CrossRef]
  25. de Godoy, M.R.C.; Bauer, L.L.; Parsons, C.M.; Fahey, G.C., Jr. Select Corn Coproducts from the Ethanol Industry and Their Potential as Ingredients in Pet Foods. J. Anim. Sci. 2009, 87, 189–199. [Google Scholar] [CrossRef]
  26. AAFCO Dog Food Nutrient Profiles Based on Dry Matter. 2016 Official Publication; Association of American Feed Control Officials Inc: Champaign, IL, USA, 2016; pp. 158–159. [Google Scholar]
  27. Patwa, A.; Malcolm, B.; Wilson, J.; Ambrose, R.P.K. Particle Size Analysis of Two Distinct Classes of Wheat Flour by Sieving. ASABE 2014, 57, 151–159. [Google Scholar] [CrossRef]
  28. Chutmanop, J.; Chuichulcherm, S.; Chisti, Y.; Srinophakun, P. Protease Production by Aspergillus oryzae in Solid-state Fermentation Using Agroindustrial Substrates. J. Chem. Technol. Biotechnol. 2008, 83, 1012–1018. [Google Scholar] [CrossRef]
  29. Das, P.P.; Xu, C.; Lu, Y.; Khorsandi, A.; Tanaka, T.; Korber, D.; Nickerson, M.; Rajagopalan, N. Snapshot of Proteomic Changes in Aspergillus oryzae during Various Stages of Fermentative Processing of Pea Protein Isolate. Food Chem. Mol. Sci. 2023, 6, 100169. [Google Scholar] [CrossRef]
  30. Eugster, P.J.; Salamin, K.; Grouzmann, E.; Monod, M. Production and Characterization of Two Major Aspergillus oryzae Secreted Prolyl Endopeptidases Able to Efficiently Digest Proline-Rich Peptides of Gliadin. Microbiology 2015, 161, 2277–2288. [Google Scholar] [CrossRef]
  31. Ferreira, J.G.; Reis, A.P.; Guimarães, V.M.; Falkoski, D.L.; da Silva Fialho, L.; de Rezende, S.T. Purification and Characterization of Aspergillus Terreus α-Galactosidases and Their Use for Hydrolysis of Soymilk Oligosaccharides. Appl. Biochem. Biotechnol. 2011, 164, 1111–1125. [Google Scholar] [CrossRef]
  32. Hoa, B.T.; Hung, P.V. Optimization of Nutritional Composition and Fermentation Conditions for Cellulase and Pectinase Production by Aspergillus oryzae Using Response Surface Methodology. Int. Food Res. J. 2013, 20, 3269–3274. [Google Scholar]
  33. Samarntarn, W.; Cheevadhanarak, S.; Tanticharoen, M. Production of Alkaline Protease by a Genetically Engineered Aspergillus oryzae U1521. J. Gen. Appl. Microbiol. 1999, 45, 99–103. [Google Scholar] [CrossRef]
  34. Shankar, S.K.; Mulimani, V.H. α-Galactosidase Production by Aspergillus oryzae in Solid-State Fermentation. Bioresour. Technol. 2007, 98, 958–961. [Google Scholar] [CrossRef]
  35. Vishwanatha, K.S.; Rao, A.G.A.; Singh, S.A. Acid Protease Production by Solid-State Fermentation Using Aspergillus oryzae MTCC 5341: Optimization of Process Parameters. J. Ind. Microbiol. Biotechnol. 2010, 37, 129–138. [Google Scholar] [CrossRef]
  36. Zhao, G.; Ding, L.-L.; Pan, Z.-H.; Kong, D.-H.; Hadiatullah, H.; Fan, Z.-C. Proteinase and Glycoside Hydrolase Production Is Enhanced in Solid-State Fermentation by Manipulating the Carbon and Nitrogen Fluxes in Aspergillus oryzae. Food Chem. 2019, 271, 606–613. [Google Scholar] [CrossRef]
  37. Suprayogi, W.P.S.; Ratriyanto, A.; Akhirini, N.; Hadi, R.F.; Setyono, W.; Irawan, A. Changes in Nutritional and Antinutritional Aspects of Soybean Meals by Mechanical and Solid-State Fermentation Treatments with Bacillus subtilis and Aspergillus oryzae. Bioresour. Technol. Rep. 2022, 17, 100925. [Google Scholar] [CrossRef]
  38. Sandhya, C.; Sumantha, A.; Szakacs, G.; Pandey, A. Comparative Evaluation of Neutral Protease Production by Aspergillus oryzae in Submerged and Solid-State Fermentation. Process Biochem. 2005, 40, 2689–2694. [Google Scholar] [CrossRef]
  39. Battaglino, R.A.; Huergo, M.; Pilosof, A.M.R.; Bartholomai, G.B. Culture Requirements for the Production of Protease by Aspergillus oryzae in Solid State Fermentation. Appl. Microbiol. Biotechnol. 1991, 35, 292–296. [Google Scholar] [CrossRef]
  40. Park, M.K.; Seo, J.-A.; Kim, Y.-S. Comparative Study on Metabolic Changes of Aspergillus oryzae Isolated from Fermented Foods According to Culture Conditions. Int. J. Food Microbiol. 2019, 307, 108270. [Google Scholar] [CrossRef] [PubMed]
  41. Barker, T.W.; Drouliscos, N.J.; Worgan, J.T. Composition and Nutritional Evaluation of Aspergillus oryzae Biomass Grown on Palm Oil Processing Effluents. J. Sci. Food Agric. 1981, 32, 1014–1020. [Google Scholar] [CrossRef]
  42. Sardjono; Zhu, Y.; Knol, W. Comparison of Fermentation Profiles between Lupine and Soybean by Aspergillus oryzae and Aspergillus Sojae in Solid-State Culture Systems. J. Agric. Food Chem. 1998, 46, 3376–3380. [Google Scholar] [CrossRef]
  43. Amadou, I.; Amza, T.; Foh, M.; Le, M. Influence of Lactobacillus Plantarum Lp6 Fermentation on the Functional Properties of Soybean Protein Meal. Emir. J. Food Agric. 2010, 22, 456. [Google Scholar] [CrossRef]
  44. Li, L.; Liu, Y.; Zou, X.; He, J.; Xu, X.; Zhou, G.; Li, C. In Vitro Protein Digestibility of Pork Products Is Affected by the Method of Processing. Food Res. Int. 2017, 92, 88–94. [Google Scholar] [CrossRef]
  45. Wei, Z.; Kang, J.; Liao, M.; Ju, H.; Fan, R.; Shang, J.; Ning, X.; Li, M. Investigating Changes of Proteome in the Bovine Milk Serum after Retort Processing Using Proteomics Techniques. Food Sci. Nutr. 2021, 10, 307–316. [Google Scholar] [CrossRef]
  46. Choct, M. Feed Non-Starch Polysaccharides: Chemical Structures and Nutritional Significance. Feed Milling Int. 1997, 191, 13–26. [Google Scholar]
  47. Choct, M.; Dersjant-Li, Y.; Mcleish, J.; Peisker, M. Soy Oligosaccharides and Soluble Non-Starch Polysaccharides: A Review of Digestion, Nutritive and Anti-Nutritive Effects in Pigs and Poultry. Asian-Australas. J. Anim. Sci. 2010, 23, 1386–1398. [Google Scholar] [CrossRef]
  48. Freire, J.P.B.; Guerreiro, A.J.G.; Cunha, L.F.; Aumaitre, A. Effect of Dietary Fibre Source on Total Tract Digestibility, Caecum Volatile Fatty Acids and Digestive Transit Time in the Weaned Piglet. Anim. Feed. Sci. Technol. 2000, 87, 71–83. [Google Scholar] [CrossRef]
  49. Smiricky, M.R.; Grieshop, C.M.; Albin, D.M.; Wubben, J.E.; Gabert, V.M.; Fahey, G.C., Jr. The Influence of Soy Oligosaccharides on Apparent and True Ileal Amino Acid Digestibilities and Fecal Consistency in Growing Pigs12. J. Anim. Sci. 2002, 80, 2433–2441. [Google Scholar] [CrossRef] [PubMed]
  50. Smiricky-Tjardes, M.R.; Flickinger, E.A.; Grieshop, C.M.; Bauer, L.L.; Murphy, M.R.; Fahey, G.C., Jr. In Vitro Fermentation Characteristics of Selected Oligosaccharides by Swine Fecal Microflora1. J. Anim. Sci. 2003, 81, 2505–2514. [Google Scholar] [CrossRef] [PubMed]
  51. Varel, V.H.; Kreikemeier, K.K.; Jung, H.-J.G.; Hatfield, R.D. In Vitro Stimulation of Forage Fiber Degradation by Ruminal Microorganisms with Aspergillus oryzae Fermentation Extract. Appl. Environ. Microbiol. 1993, 59, 3171–3176. [Google Scholar] [CrossRef]
  52. Mohammadi, M.; Norlander, S.; Hedström, M.; Adlercreutz, P.; Grey, C. Xylanases and High-Degree Wet Milling Improve Soluble Dietary Fibre Content in Liquid Oat Base. Food Chem. 2024, 442, 138619. [Google Scholar] [CrossRef]
  53. Souza, J.M.; Souza, J.C.S.M.; Sousa, D.O.; Del Valle, T.A.; Ghizzi, L.G.; Alcântara, A.H.D.; Mesquita, L.G.; Sousa, R.L.M.; Bueno, I.C.S.; Balieiro, J.C.C. The Effects of Compound Treatment of Aspergillus oryzae and Fibrolytic Enzyme on in Vitro Degradation, Gas Production and Fermentative Profile of Maize Silage and Sugarcane Silage. J. Agric. Sci. 2021, 159, 147–158. [Google Scholar] [CrossRef]
  54. de Fátima Viana, S.; Guimarães, V.M.; José, I.C.; de Almeida e Oliveira, M.G.; Brunoro Costa, N.M.; de Barros, E.G.; Moreira, M.A.; de Rezende, S.T. Hydrolysis of Oligosaccharides in Soybean Flour by Soybean α-Galactosidase. Food Chem. 2005, 93, 665–670. [Google Scholar] [CrossRef]
  55. Garcia-Rubio, R.; de Oliveira, H.C.; Rivera, J.; Trevijano-Contador, N. The Fungal Cell Wall: Candida, Cryptococcus, and Aspergillus Species. Front. Microbiol. 2020, 10, 2993. [Google Scholar] [CrossRef]
  56. Pedersen, H.; Carlsen, M.; Nielsen, J. Identification of Enzymes and Quantification of Metabolic Fluxes in the Wild Type and in a Recombinant Aspergillus oryzae Strain. Appl. Environ. Microbiol. 1999, 65, 11–19. [Google Scholar] [CrossRef]
  57. Chen, L.; Madl, R.L.; Vadlani, P.V. Nutritional Enhancement of Soy Meal via Aspergillus oryzae Solid-State Fermentation. Cereal Chem. 2013, 90, 529–534. [Google Scholar] [CrossRef]
  58. Choi, D.; Alshannaq, A.F.; Yu, J.-H. Safe and Effective Degradation of Aflatoxins by Food-Grade Culture Broth of Aspergillus oryzae. PNAS Nexus 2024, 3, pgae271. [Google Scholar] [CrossRef]
  59. Akinola, S.A.; Ateba, C.N.; Mwanza, M. Polyphasic Assessment of Aflatoxin Production Potential in Selected Aspergilli. Toxins 2019, 11, 692. [Google Scholar] [CrossRef]
  60. Massarolo, K.C.; Mendoza, J.R.; Verma, T.; Kupski, L.; Badiale-Furlong, E.; Bianchini, A. Fate of Aflatoxins in Cornmeal during Single-Screw Extrusion: A Bioaccessibility Approach. LWT 2021, 138, 110734. [Google Scholar] [CrossRef]
  61. Berry, T.H.; Becker, D.E.; Rasmussen, O.G.; Jensen, A.H.; Norton, H.W. The Limiting Amino Acids in Soybean Protein. J. Anim. Sci. 1962, 21, 558–561. [Google Scholar] [CrossRef]
  62. Zarkadas, C.G.; Gagnon, C.; Gleddie, S.; Khanizadeh, S.; Cober, E.R.; Guillemette, R.J.D. Assessment of the Protein Quality of Fourteen Soybean [Glycine max (L.) Merr.] Cultivars Using Amino Acid Analysis and Two-Dimensional Electrophoresis. Food Res. Int. 2007, 40, 129–146. [Google Scholar] [CrossRef]
  63. Yu, J.; Cary, J.W.; Bhatnagar, D.; Cleveland, T.E.; Keller, N.P.; Chu, F.S. Cloning and Characterization of a cDNA from Aspergillus Parasiticus Encoding an O-Methyltransferase Involved in Aflatoxin Biosynthesis. Appl. Environ. Microbiol. 1993, 59, 3564–3571. [Google Scholar] [CrossRef]
  64. Kacprzak, M.M.; Lewandowska, I.; Matthews, R.G.; Paszewski, A. Transcriptional Regulation of Methionine Synthase by Homocysteine and Choline in Aspergillus Nidulans. Biochem. J. 2003, 376, 517–524. [Google Scholar] [CrossRef]
  65. Kim, H.S.; Titgemeyer, E.C.; Aldrich, C.G. Evaluation of Fermentability of Whole Soybeans and Soybean Oligosaccharides by a Canine In Vitro Fermentation Model. Fermentation 2023, 9, 414. [Google Scholar] [CrossRef]
  66. Opazo, R.; Ortúzar, F.; Navarrete, P.; Espejo, R.; Romero, J. Reduction of Soybean Meal Non-Starch Polysaccharides and α-Galactosides by Solid-State Fermentation Using Cellulolytic Bacteria Obtained from Different Environments. PLoS ONE 2012, 7, e44783. [Google Scholar] [CrossRef]
  67. Birk, Y. Purification and Some Properties of a Highly Active Inhibitor of Trypsin and α-Chymotrypsin from Soybeans. Biochim. Biophys. Acta 1961, 54, 378–381. [Google Scholar] [CrossRef]
  68. Kunitz, M. Crystallization of a Trypsin Inhibitor from Soybean. Science 1945, 101, 668–669. [Google Scholar] [CrossRef]
  69. Huang, H.; Kwok, K.-C.; Liang, H.-H. Inhibitory Activity and Conformation Changes of Soybean Trypsin Inhibitors Induced by Ultrasound. Ultrason. Sonochem. 2008, 15, 724–730. [Google Scholar] [CrossRef]
  70. Vajda, T.; Szabó, T. Specificity of Trypsin and Alpha-Chymotrypsin towards Neutral Substrates. Acta Biochim. Biophys. Acad. Sci. Hung. 1976, 11, 287–294. [Google Scholar]
  71. Murphy, P.A. Soybean Proteins. In Soybeans; Johnson, L.A., White, P.J., Galloway, R., Eds.; Elsevier: Amsterdam, The Netherlands, 2008; pp. 229–267. ISBN 978-1-893997-64-6. [Google Scholar]
  72. Zhang, W.; Zhao, D.; Dong, Z.; Li, J.; Zhang, B.; Yu, W. The Consistency Factor and the Viscosity Exponent of Soybean-Protein-Isolate/Wheat-Gluten/Corn-Starch Blends by Using a Capillary Rheometry. Molecules 2022, 27, 6693. [Google Scholar] [CrossRef]
  73. Al-Rabadi, G.J.; Torley, P.J.; Williams, B.A.; Bryden, W.L.; Gidley, M.J. Particle Size of Milled Barley and Sorghum and Physico-Chemical Properties of Grain Following Extrusion. J. Food Eng. 2011, 103, 464–472. [Google Scholar] [CrossRef]
  74. Carvalho, C.W.P.; Takeiti, C.Y.; Onwulata, C.I.; Pordesimo, L.O. Relative Effect of Particle Size on the Physical Properties of Corn Meal Extrudates: Effect of Particle Size on the Extrusion of Corn Meal. J. Food Eng. 2010, 98, 103–109. [Google Scholar] [CrossRef]
  75. Bhattacharya, M.; Hanna, M.A. Influence of Process and Product Variables on Extrusion Energy and Pressure Requirements. J. Food Eng. 1987, 6, 153–163. [Google Scholar] [CrossRef]
  76. Torrezan, R.; Tham, W.P.; Bell, A.E.; Frazier, R.A.; Cristianini, M. Effects of High Pressure on Functional Properties of Soy Protein. Food Chem. 2007, 104, 140–147. [Google Scholar] [CrossRef]
  77. Zhang, H.; Li, L.; Tatsumi, E.; Isobe, S. High-Pressure Treatment Effects on Proteins in Soy Milk. LWT-Food Sci. Technol. 2005, 38, 7–14. [Google Scholar] [CrossRef]
  78. Guy, R. Extrusion Cooking: Technologies and Applications; Woodhead Publishing: Boca Raton, FL, USA, 2001; ISBN 978-1-85573-559-0. [Google Scholar]
  79. Robin, F.; Schuchmann, H.P.; Palzer, S. Dietary Fiber in Extruded Cereals: Limitations and Opportunities. Trends Food Sci. Technol. 2012, 28, 23–32. [Google Scholar] [CrossRef]
  80. Kumar, A.; Ganjyal, G.M.; Jones, D.D.; Hanna, M.A. Experimental Determination of Longitudinal Expansion During Extrusion of Starches. Cereal Chem. 2007, 84, 480–484. [Google Scholar] [CrossRef]
  81. Calabrò, S.; Carciofi, A.C.; Musco, N.; Tudisco, R.; Gomes, M.O.S.; Cutrignelli, M.I. Fermentation Characteristics of Several Carbohydrate Sources for Dog Diets Using the In Vitro Gas Production Technique. Ital. J. Anim. Sci. 2013, 12, e4. [Google Scholar] [CrossRef]
Figure 1. Schematic of extruder screw profile. Inlet starting on the left to discharge ending on the right.
Processes 13 02441 g001
Figure 2. Nutrient contents of soybean meal fermented with A. oryzae with different inoculation dosages and fermentation durations. (a) Organic matter (OM) content, (b) crude protein (CP) content, (c) in vitro protein digestibility, (d) total dietary fiber (TDF) content, (e) insoluble dietary fiber (IDF) content, and (f) soluble dietary fiber (SDF) content. abc Mean fermentation durations without a common superscript letter differ (p < 0.05).
Processes 13 02441 g002
Figure 3. Rapid viscosity analysis results of raw mixes of four experimental diets (SBM, 30% soybean meal; AMF, 30% soybean meal and 1% Amaferm®; FSBM, 30% fermented soybean meal; SPI, 18% soybean protein isolate).
Processes 13 02441 g003
Figure 4. Particle size distribution of raw mixed material of four experimental diets (SBM, 30% soybean meal; AMF, 30% soybean meal and 1% Amaferm®; FSBM, 30% fermented soybean meal; SPI, 18% soybean protein isolate).
Processes 13 02441 g004
Table 1. Experimental diet formulas (SBM, 30% soybean meal; AMF, 30% soybean meal and 1% Amaferm®; FSBM, 30% fermented soybean meal; SPI, 18% soybean protein isolate).
Ingredient, % DMSBMAMFFSBMSPI
Soybean meal30.0030.000.000.00
Amaferm®0.001.000.000.00
Fermented soybean meal0.000.0030.000.00
Soybean protein isolate0.000.000.0018.00
Brewer’s rice0.000.000.0010.68
Corn37.2335.8739.1140.00
Beet pulp3.793.793.793.79
Poultry by-produce meal19.3119.2516.0016.06
Chicken fat5.826.066.076.00
Dog dry digest1.001.001.001.00
Fish oil1.001.001.001.00
Calcium carbonate0.470.510.600.68
Dicalcium phosphate0.370.310.820.84
Potassium chloride0.000.200.600.95
Salt0.250.250.250.25
Choline chloride0.100.100.100.10
Titanium dioxide0.400.400.400.40
Vitamin Premix 10.150.150.150.15
Trace mineral premix 20.100.100.100.10
Total100.00100.00100.00100.00
1 Vitamin premix: 5.51% moisture, 4.02% crude protein, 34.5% ash, 13.4% calcium, 17,162,999 IU/kg Vitamin A, 920,000 IU/kg Vitamin D, 79,887 IU/kg Vitamin E, 14,252 mg/kg thiamine, 4719 mg/kg riboflavin, 12,186 mg/kg pantothenic acid, 64,736 mg/kg Niacin, 5537 mg/kg pyridoxine, 720 mg/kg Folic acid, 70 mg/kg biotin, 22 mg/kg vitamin B12. 2 Trace mineral premix: 0.66% moisture, 21.5% calcium, 0.02% sodium, 0.57% magnesium, 38,910 mg/kg iron, 11,234 mg/kg copper, 5842 mg/kg manganese, 88,000 mg/kg zinc, 1584 mg/kg iodine, 310 mg/kg selenium, 19% carbohydrate, and 1% crude fat. DM, dry matter.
Table 2. Paired t-test analysis results of nutrient changes from 8 batches of unfermented soybean meal (U-SBM) and A. oryzae fermented soybean meal (F-SBM).
NutrientU-SBMF-SBMDifference 1SEM of Difference 2p-Value
Organic matter, %DM92.5291.51−1.010.001<0.001
Crude protein, %DM50.0554.694.630.004<0.001
Crude fat, %DM2.212.400.190.0020.2874
TDF, %DM25.0623.88−1.180.0090.2104
IDF, %DM19.3215.29−4.030.0090.0026
SDF, %DM5.748.592.850.005<0.001
GE, kcal/kg DM4720.24555.6−164.613.78<0.001
1 Calculated by (F-SBM)—(U-SBM). 2 SME means standard error of mean. TDF—total dietary fiber; IDF—insoluble dietary fiber; SDF—soluble dietary fiber; GE—gross energy.
Table 3. Amino acid composition, common soybean sugar contents, and trypsin inhibitor units (TIUs) in unfermented soybean meal (U-SBM) and A. oryzae fermented soybean meal (F-SBM).
ChemicalsU-SBMF-SBM
Amino acids, % DM
Arginine3.643.46
Histidine1.341.36
Isoleucine2.462.72
Leucine3.994.43
Lysine3.212.96
Methionine0.720.81
Phenylalanine2.642.92
Threonine1.962.17
Tryptophan0.630.63
Valine2.552.84
Alanine2.232.52
Aspartic acid5.696.21
Cysteine0.760.82
Glutamic acid9.3410.11
Glycine2.142.35
Serine2.152.33
Proline2.562.85
Tyrosine1.902.11
Hydroxylysine0.020.01
Hydroxyproline0.070.08
Taurine0.090.06
Lanthionine0.000.07
Ornithine0.030.08
Sugars, % DM
Sucrose6.580.00
Raffinose0.950.12
Stachyose2.930.14
Verbascose0.550.32
Trypsin inhibitor, TIU/g DMU-SBMR-SBMF-SBM
Kunitz TI3.17Not detectedNot detected
Bowman–Birk TI2.29Not detectedNot detected
DM—dry matter; R-SBM—retorted but not fermented soybean meal.
Table 4. Geometric mean diameter (Dgw) of raw mixes and geometric standard deviation of the particle diameter (Sdw) of each raw mix for four experimental diets (SBM, 30% soybean meal; AMF, 30% soybean meal and 1% Amaferm®; FSBM, 30% fermented soybean meal; SPI, 18% soybean protein isolate).
SBMAMFFSBMSPI
Dgw382.8347.1286.8223.1
Sgw300.6284.3240.8206.9
Table 5. Extrusion processing data and out-of-extruder kibble measurements of treatment diets (SBM, 30% soybean meal; AMF, 30% soybean meal and 1% Amaferm®; FSBM, 30% fermented soybean meal; SPI, 18% soybean protein isolate).
ParameterSBMAMFFSBMSPISEM 1p-Value
Feed rate (as-is), kg/h113.05117.00124.2098.854.5830.0681
PC water injection, kg/h18.50 a19.30 a11.27 b13.07 b0.604<0.001
PC discharge temperature, °C93.992.795.094.30.710.1723
EX Screw speed, rpm636 ab637 a636 b342 c0.2<0.001
EX Water injection, kg/h12.6013.2311.6011.900.5330.2109
Motor power, kW5.90 b7.57 b10.57 a10.03 a0.512<0.001
Die temperature, °C100.33 b104.67 b117.00 a117.33 a1.581<0.001
Die pressure, psig200 b250 a210 b250 a5.0<0.001
In-barrel moisture, %34.46 a34.69 a28.21 c33.45 b0.002<0.001
SME, kJ/kg83.7 c115.9 bc198.7 b305.3 a14.570.0015
Wet kibble characteristics
SEI, mm2/mm21.44 c1.50 c1.87 b2.45 a0.030<0.001
Piece density, g/cm30.788 a0.759 a0.575 b0.449 c0.0227<0.001
Specific length, mm/g22.95 b22.69 b25.75 a23.68 ab0.6510.0049
Bulk density, g/L520.7 a484.0 ab419.0 bc348.3 c17.31<0.001
Dry kibble characteristics
SEI, mm2/mm21.30 c1.31 c1.80 b2.55 a0.024<0.001
Piece density, g/cm30.74 a0.68 b0.49 c0.41 d0.010<0.001
Specific length, mm/g26.63 b28.60 a29.19 a24.26 c0.314<0.001
Bulk density, g/L520.3 a481.0 b385.0 c324.7 d5.73<0.001
1 SME on the header row means standard error of mean. abcd Means within a row lacking a common superscript letter are different (p < 0.05). PC—preconditioner; EX—extruder; SEM—specific mechanical energy; SEI—sectional expansion index.
Table 6. Nutrient composition of the coated experimental diets with different soybean products (SBM, 30% soybean meal; AMF, 30% soybean meal plus 1% Amaferm®; FSBM, 30% A. oryzae fermented soybean meal; SPI, 18% soybean protein isolate).
NutrientSBMAMFFSBMSPI
DM, %93.6393.8995.9993.89
Crude protein, % DM33.2133.8231.4635.04
Crude fat, % DM12.4112.3211.5110.95
Ash, % DM7.787.288.617.18
Total dietary fiber, % DM17.9017.6019.8014.00
Insoluble dietary fiber, % DM13.3013.7014.709.40
Soluble dietary fiber, % DM4.603.905.104.60
Gross energy, kcal/kg DM4955.74975.64829.54938.1
DM—dry matter.
Disclaimer/Publisher’s Note: The statements, opinions and data contained in all publications are solely those of the individual author(s) and contributor(s) and not of MDPI and/or the editor(s). MDPI and/or the editor(s) disclaim responsibility for any injury to people or property resulting from any ideas, methods, instructions or products referred to in the content.

