Abstract
The scientific investment decision of Park-level Integrated Energy System (PIES) projects is of great significance to energy enterprises for improving the efficient utilization of funds, promoting green and low-carbon transformation, and achieving the goal of carbon neutrality. This paper proposed a two-stage investment framework that integrates a multi-objective 0–1 programming model with a multi-criteria decision-making (MCDM) technique to determine the optimal PIES project investment portfolios under the constraint of quota investment. First, a multi-objective (MO) 0–1 programming model was constructed for typical PIES projects in Stage-I, which considers economic and environmental benefits to obtain Pareto frontier solutions, i.e., PIES project portfolios. Second, an evaluation index system from multiple dimensions was established, and a hybrid MCDM technique was adopted to comprehensively evaluate the Pareto frontier solutions in Stage-II. Finally, the proposed model was applied to an empirical case, and the simulation results show that the decision framework can achieve the best overall benefit of PIES project portfolios with maximal economic benefit and minimum carbon emissions. In addition, the robustness analysis was performed by changing the indicator weights to verify the stability of the proposed framework. This research work could provide a theoretical tool for investment decisions regarding PIES projects for energy enterprises.
1. Introduction
With the rapid development of the global economy and society, a series of problems, such as the over-exploitation of fossil fuels, severe environmental pollution, and the low efficiency of energy utilization, have gradually emerged in the traditional energy system, which has accelerated the transformative shift towards clean, low-carbon, and high-efficiency systems [1,2]. The integrated energy system (IES), through cascading utilization of multiple energy sources to realize energy conservation and carbon emission reduction, has become a promising direction. The PIES, one of the main engineering applications, retains the advantages of the IES. PIES project investments are heavy-asset investments with large initial investments, long payback periods, and numerous uncertainties in investment returns [3]; therefore, it is crucial for energy enterprises to determine the optimal investment and implement effective decision-making of PIES alternatives.
In recent years, an increasing number of studies have shown that researchers have paid more significant attention to IESs, including system design, operational optimization, and benefit assessment. IES planning encompasses equipment configuration planning and capacity planning [4]. Equipment configuration planning includes equipment type selection and connection layouts. For example, Wang et al. [5] introduced and defined the configuration planning of a community-level Multiple Energy System (MES) using the energy hub concept. Meanwhile, capacity planning aims to optimize the capacity of each equipment unit based on its designated type and connection relationship. Specifically, Park et al. [6] found the optimal generation capacity within a reasonable time through the generation capacity planning model they presented. Moreover, Alizad et al. [7] developed a dynamic planning framework oriented towards resilience for optimizing the sizing of community IES components. Mansouri et al. [8] and Gai et al. [9] proposed an integrated approach for optimal planning and operation considering the demand response to achieve synergies among various energy sources. Shabanian-Poodeh et al. [10] presented a reliability-constrained two-stage stochastic model with the goal of minimizing investment, operation, and reliability costs. Beuzekom et al. [11], Wu et al. [12], and Lei et al. [13] each formulated a multi-stage planning approach for IESs that is long-term, dynamic, and stochastic, respectively, aiming to optimize the planning of the system. Peng et al. [14] constructed a robust capacity planning model, considering renewable energy uncertainties, to promote the cascade utilization of energy and the economic performance of an IES. Wang et al. [15] realized the scientific capacity allocation of the integrated energy system, thus providing a theoretical basis and technical support for the planning and design of integrated energy systems.
Currently, the relevant studies on system operational optimization involve coupling an IES with different kinds of equipment or energy networks for economic operation, such as a heating network incorporated into an IES [16,17,18], IES operation with electricity–thermal–natural gas networks [19,20] or even an extended cooling system [21], an IES combining renewable energy or hydrogen [22,23,24], and an IES with various energy storages [25,26,27]. The normal operation models adopted in certain studies include the single-stage optimization technique and even two-stage and three-stage optimization methods that can carefully deal with critical uncertainties. Zhang et al. [28] dealt with the uncertainties from load and wind power and established a two-stage robust optimization for electricity–gas–heat integrated multi-energy microgrids. Zhang et al. [29] considered the charging issue and load uncertainty in new energy vehicles and then set up a three-stage optimization model for a natural gas hybrid integrated energy system. With the application of IESs, representative studies focus on park IESs, industrial park IESs, community IESs, and multi-park IESs. Xu et al. [30] and Zhang et al. [31] presented a multi-energy collaborative optimization model and a day-ahead operation optimization scheduling for PIESs, respectively. Wang et al. [32] put forward a distributed collaborative optimization strategy for community IES operation. Ma et al. [33] and Dong et al. [34] proposed, respectively, a two-stage dispatching strategy and bi-level coordinated operation optimization for multiple PIESs.
Relevant studies on IES benefit assessment mainly pertain to economic evaluation, cost–benefit analysis, techno-economic assessment, operational benefit evaluation, and comprehensive benefit analysis. The economic benefit of industrial park IESs was evaluated by Zhao et al. [35]. Xiang et al. [36] and Guo et al. [37] implemented cost–benefit analysis for IESs considering the demand response and an IES incorporated with photovoltaic storage, respectively. Regarding the techno-economic assessment of IESs, Abdussami et al. [38], Ba-swaimi et al. [39], and Gimelli et al. [40], respectively, conducted techno-economic evaluations of transitioning from CPPs to IESs, of an integrated solar/wind energy system, and of an integrated power, cooling, and heating system. The combination of more than two types of benefits is called a comprehensive benefit. The following are several representative studies regarding the comprehensive benefit assessment. The operational benefits involving the operation economy, reliability, new energy absorption, and environmental benefits were evaluated for an IES by Zhang et al. [41]. Zhou et al. [42] synthesized energy efficiency, energy equipment, and end users to set up a comprehensive benefit evaluation of an MES for a smart city. Kim et al. [43] proposed a renewable energy source and a carbon capture and utilization (CCU) system and conducted a corresponding economic and environmental benefit analysis. Ba-swaimi et al. [44] built a comprehensive assessment model from the perspectives of the economy, technology, and the environment for integrated hybrid renewable energy systems.
The aforementioned studies established detailed models of IES planning, operational optimization, and benefit evaluation, while the decision-making techniques from the IES project investment aspect are rarely investigated. Yi et al. [1] constructed a project investment decision model combining strategic objectives and the weight operator via the Interval Type-2 Trapezoidal Fuzzy Number Sets technique and the Preference Ranking Organization Method for Enrichment Evaluations (IT2TrFNs-PROMETHEE-II) method. Zhou et al. [45] set up an IES planning framework by incorporating optimization theory with the multi-criteria decision technique. Ma et al. [46] presented an evaluation index system for a PIES and conducted a comprehensive performance assessment. In fact, the most adopted method of the multi-project investment decision is the comprehensive evaluation or conventional MCDM methods. Aragonés-Beltrán et al. [47] proposed an Analytic Hierarchy Process (AHP)/Analytic Network Process (ANP) based the MCDM approach to determine the investment preference among alternative solar–thermal power plant projects for a Spanish solar power investment company. Wu et al. [48] employed the TIFN-fuzzy TOmada de Decisão Iterativa Multicritério (TODIM) technique to optimize alternative photovoltaic–hydrogen storage projects. Manirathinam et al. [49] adopted a hybrid fuzzy decision-making technique (fuzzy AHP-MARCOS (Measurement Alternatives and Ranking according to Compromise Solution)) to select household renewable energy systems. Ji et al. [50] set up an investment decision-making method based on the TODIM method with combined weights to rank distributed generation projects. Silva et al. [51] constructed a CRITIC (Criteria Importance Through Inter-criteria Correlation)—GRA (Grey Relevant Analysis) model to assess investment alternatives and validate of the proposed approach. Ke et al. [52] put forward a novel MCDM decision technique through BWM (Bayesian Best–Worst Method)-CRITIC-VIKOR (VlseKriterijumska Optimizacija I Kompromisno Resenje) to evaluate urban IES projects.
The main contributions of this paper are summarized as follows: (1) An investment portfolio decision-making technique from typical IES projects considering investment constraints is researched. (2) A novel two-stage decision framework is put forward to select optimal PIES project portfolios and achieve the maximum utilization of funds. Using the MO 0–1 programming model, the Pareto frontier solution set could be obtained; then, using the hybrid MCDM technique, the overall optimal PIES project portfolios could be determined.
2. Two-Stage Model for Multi-Objective Programming and Decision-Making in PIES Investment
2.1. Multi-Objective 0–1 Programming Model for PIES Projects
2.1.1. Objectives Functions
The objective functions involve two aspects, i.e., economic benefit and environmental benefit .
(1) Economic benefit —the net present value (NPV) per unit investment.
Regarding the economic benefit, the NPV per unit investment is a crucial object commonly adopted to evaluate the economic effect of invested projects, which is defined as follows.
where i represents the ith PIES project, I represents the total number of PIES projects, is the decision variable for the ith PIES project, is the NPV per unit investment for the ith PIES project, n represents the nth year, N is the service year of the project (including the construction period and the operation period), is the Internal Rate of Return (IRR), represents the total investment of the ith PIES project, calculated by Equation (2), and and are the cash inflows and outflows of the ith PIES project in the nth year, respectively, which are determined as Equations (3) and (4).
In Equation (2), indicates different types of equipment in different PIES projects, representing gas turbine, waste heat boiler, absorption chiller, electric refrigeration machine, gas boiler, photovoltaic equipment, wind turbine, and electric energy storage, is the planned installed capacity for different types of the equipment in the ith PIES project, is the corresponding unit installation cost, and represents other investment costs, such as construction costs, labor costs, etc.
In Equation (3), and are the construction period and operation period of the PIES project, respectively, , and represent the revenue from the electricity, heat, and cold sales of the ith PIES project in the nth year, respectively, , and are the unit price of the power, heat, and cold of the ith PIES project in the nth year for the user side, and , and are the demand of the electrical load, heating load, and cooling load from the user side in the nth year.
In Equation (4), is the construction investment of the ith PIES project in the nth year, is the annual operation and maintenance costs of the ith PIES project, is the energy consumption cost of the ith PIES project in the nth year, is the proportion of the annual operation and maintenance cost to the initial investment of the PIES project, is the initial equipment investment of the ith PIES project, and are the purchase cost of the electricity from the power grid and the gas from the gas network of the ith PIES project in the nth year, and are the unit purchase price of electricity and gas, respectively, and and are the purchase quantity of the electricity and the gas of the ith PIES project in the nth year, respectively.
(2) Environmental benefit —carbon dioxide (CO2) emissions.
The environmental benefit goal refers to the minimum CO2 emissions mainly from the purchased power form grid, the gas consumption from the gas boiler, and the gas turbine in different PIES projects, which is formulated as follows.
In Equation (5), is the CO2 emissions of the ith PIES project in the nth year, and are the emission coefficients of gas and electricity, respectively, and are the amount of natural gas consumed by the gas boiler and the gas turbine of the ith PIES project in the nth year, respectively, and is the power generation from the ith PIES project in the nth year.
2.1.2. Constraints
(1) Capacity constraints for equipment investment.
where is the equipment investment capacity of the ith PIES project and is the maximum allowable investment capacity of the equipment.
(2) Investment scale constraints.
where is the total investment quota.
(3) Reliability constraint of energy supply.
The energy supply reliability consists of the cooling load, the thermal load, and the power load supply and demand balances. The cooling supply is fulfilled by the absorption chiller and the electric refrigeration machine. The heating is provided by the waste heat boiler and the gas boiler. The electric generation is the output power of the photovoltaic equipment, the wind turbine, and the gas turbine. The corresponding annual demand of cooling, heating, and electric power are determined from different PEIS projects.
In Equation (13), and are the output cooling power from the absorption chiller and the electric refrigeration machine of the ith PIES project in the nth year, respectively, is the maximum cooling load demand in the nth year, and are the heating output from the waste heat boiler and the gas boiler of the ith PIES project in the nth year, respectively, is the maximum heating load demand in the nth year, , , and are the power generation from the photovoltaic equipment, the wind turbine, and the gas turbine of the ith PIES project in the nth year, respectively, and is the maximum electric load demand in the nth year.
2.1.3. Optimization Algorithm
In our work, the improved grey wolf optimization algorithm (GWO) is adopted to solve the MO 0–1 programming model. The GWO algorithm, pioneered by Mirjalili in 2014 [53], belongs to the swarm intelligent optimization algorithm, whose inspiration comes from the hunting behavior of grey wolf groups in nature. The GWO algorithm simulates the social hierarchy mechanism and collaboration pattern exhibited by grey wolf populations during predation to achieve optimization objectives [54]. However, the basic GWO algorithm has the problem of a sharp decline in population diversity in the later stage of evolution, and it is prone to premature convergence and local optimality. Therefore, several improvement points are integrated with the basic GWO algorithm (Quantum-inspired Multi-Objective Grey Wolf Optimization with Manta Ray Foraging and Associative Learning, MAQMOGWO), which are described as follows. (1) Using a quantum-bit Bloch sphere to initialize the population. (2) Introducing a nonlinear convergence factor to adjust the search position of the alpha wolf. (3) Integrating the foraging behavior of manta rays with the hunting strategy of grey wolves. (4) Updating the archive through associative learning. Through the combined effect of these four improvement strategies, the global search ability and convergence performance of the algorithm is effectively enhanced. The specific principles are shown in relevant references [55,56,57,58].
2.2. MCDM for Selecting PIES Project Portfolios
Similar to MO 0–1 optimization stated above, investment decision-making for PIES project portfolios is a type of MCDM issue, and the three key steps are listed as follows: constructing an evaluation index system of the PIES projects, determining the index weight, and selecting a suitable comprehensive evaluation method.
2.2.1. Evaluation Index System of the PIES Project Portfolio Selection
Based on the relevant references [52,59,60,61,62,63,64,65,66,67], an evaluation index system for the PIES project portfolios selection is constructed, shown as Table 1. The detailed explanation of each indicator is shown as follows.

Table 1.
Evaluation index system for PIES project portfolio selection.
(1) Economic benefit criterion.
The energy supply benefit per unit of investment (S1) is defined as the ratio between the increased energy supply benefit of a certain PIES project portfolio to the corresponding investment amount, shown as follows.
where represents the energy supply benefit per unit of investment, refers to the increased energy supply benefit of the portfolio , and is the investment amount of the portfolio .
The return on investment (S2), a key index to evaluate the profitability of a certain invested project, can reflect the annual net income created by a unit investment, which is defined as the ratio between the annual profit and the investment for a certain PIES project portfolio, shown as follows.
where represents the return of the investment for project portfolio and is the annual profit of the portfolio .
The revenue per unit of power generation (S3) is introduced to make the revenue from different PIES project portfolios comparable, shown as follows.
where is the revenue per unit of power generation, is the annual income for the portfolio , and is the increased power generation for the invested PIES project portfolio .
The market share (S4) refers to the market quota occupied by a project during its operation, which reflects the project’s competitive advantages and profitability. The project operation capability (S5) represents the comprehensive market capability of energy enterprises to effectively manage, organize, coordinate, and control projects during project implementation, thus improving efficiency and effectiveness, achieving the established goal, and enhancing the competitiveness of enterprises.
(2) Environmental benefit criterion.
The CO2 emission reduction per unit energy supply (S6) is calculated as follows.
where represents the CO2 emission reduction per unit energy supply, is the equivalent CO2 emission factor per unit of electricity, and and are the electricity purchased from the external power grid and the power supply of the portfolio , respectively. and are the cooling supply from the electric refrigeration machine and the absorption chiller of the portfolio , respectively. is the heat supply of the portfolio . is the thermal efficiency of the gas turbine for the heat supply. and are the coefficients of performance for the absorption chiller and the electric refrigeration machine, respectively.
The ratio of the clean energy installed capacity (S7) is defined as Equation (13).
where refers to the ratio of the clean energy installed capacity, is the clean energy installed capacity of the portfolio , and is the total installed capacity of the portfolio .
Considering the scarcity of land resources and high land occupation of the PIES project, a land occupation evaluation is necessarily carried out to reflect the environmental benefits of different projects. In our work, the covered area per unit installed capacity (S8) is used to make the resource occupation effect of different PIES project portfolios comparable, shown as follows.
where refers to the covered area per unit installed capacity and refers to the total occupied land for the portfolio .
The renewable energy penetration rate index (S9) refers to the proportion of the renewable energy consumption in the entire park’s energy supply system. The higher the value of this indicator, the better the energy utilization effect of the PIES project. This indicator is defined as follows.
where represents the renewable energy penetration rate, and are the photovoltaic power generation and the wind turbine power generation of the portfolio , respectively, is the proportion of the renewable energy in the electricity purchased from the external power grid and , , and are the demand loads of power, heat, and cooling of the entire park.
The solid waste emission level (S10) is a comprehensive measurement of the generation amount, the emission amount, and the disposal status of various solid wastes during the operation of the PIES project.
2.2.2. Weight Determination Based on AHP and the Entropy Technique
(1) Subjective weight method—AHP.
AHP is a multi-attribute decision-making method proposed by American professor Saaty T.L. [68,69], which is widely used in MO decision-making problems. By setting up a layered structure in the form of a target layer, criterion layer, and index layer, Saaty’s nine-point preference scale, shown in Table 2, is adopted to construct the pairwise comparison matrix and determine the relative importance (weights) of criteria to the goal layer and the weights of the index to the criterion layer.
Table 2.
Saaty’s 9-point scale of the relative importance.
The form of the comparison matrix is shown as follows.
where the element (i = 1, 2, …, n, j = 1, 2, …, n) represents the relative importance between the criteria (indices) i and j. By calculating the maximum eigenvalue of the comparison matrix and its corresponding eigenvector, the relative importance (weights) of elements (criteria or indices) in the same layer can be obtained under the premise of passing the consistency test.
(2) Objective weight method—entropy.
The information entropy, originated from the communication field, is used to measure the uncertainty or the disorder in a system [70]. It is employed later in the evaluation field to assess the relative importance of the indicators, called the entropy weight. The smaller the entropy of an indicator, the more information it provides, resulting in a higher importance or weight of the indicator. By assessing the information of the indicators, the entropy, and thus, the weight, of the indicators can be obtained, which can effectively reduce the subjectivity and human interference existing in subjective weighting methods. The concrete procedures are as follows.
Step 1. Calculate the normalized matrix and the probability matrix.
In order to eliminate the influence of different dimensions and units of the indicators, data normalization should be carried out. Suppose there are m evaluation indicators and n samples; through the normalization process, the normalization matrix can be obtained, shown as Equation (17).
Based on the normalization matrix Z, the probability matrix P can be determined by Equation (18).
where the element is calculated as .
Step 2. Calculate the information entropy of each indicator.
where represents the information entropy of indicator j.
Step 3. Determine the weight of each indicator.
where is the weight of indicator j.
(3) Combined weight.
By integrating the subjective weight value and objective value, the combined weight can be obtained, shown as follows.
where is the combined weight for the indicator i, and represent the subjective weight and the objective weight, respectively, and and are the contribution of the subjective weight and the objective weight in the combined weight, respectively.
2.2.3. Rank the Alternatives of the PIES Project Portfolio by TOPSIS
The key idea of the Technique for Order Preference by Similarity to Ideal Solution (TOPSIS) is based on the distance between the alternatives and the ideal solution [71]. The concrete procedures are as follows.
Step 1. Construct the weighted normalization matrix .
where is the weight vector for all the criteria or indicators .
Step 2. Determine the positive and the negative ideal solutions.
Step 3. Calculate the relative closeness of each alternative to select the optimal one.
where represents the relative closeness of the alternative i, and are the Euclidean distances of the alternative i to the positive ideal solution and the negative ideal solution, respectively, which are determined using Equations (26) and (27).
The alternatives can be ranked or the optimal alternative can be chosen based on , which ranges between 0 and 1. The larger is, the better the alternative is.
3. Case Study
3.1. PEIS Project Description
In this section, the proposed method integrating MO 0–1 programming and a hybrid MCDM is simulated among 10 alternative PIES projects to be constructed in an industrial park located in a northern city of China, and these projects are selected from the project database of an energy enterprise [1,13,15,45,72]. One example of a possible PIES project is shown in Figure 1. Based on the project feasibility report of the energy enterprise and the relevant literature [73,74,75,76], the detailed information of the PIES projects is shown in Table 3.
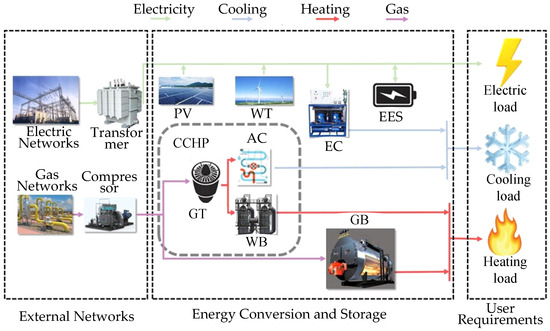
Figure 1.
An example of a possible PIES.
Table 3.
Detailed PIES project alternatives.
Figure 2 shows the energy price, including the power supply price, the heating price, and the cooling price. In our work, the natural gas price implements a fixed price strategy of CNY 2.65 per cubic meter [77]. Figure 3 shows the annual load demand of electricity, cooling, and heating [1,13,15,45,72,74,76].
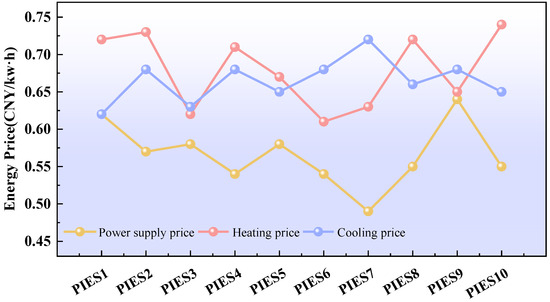
Figure 2.
Energy supply price curve.
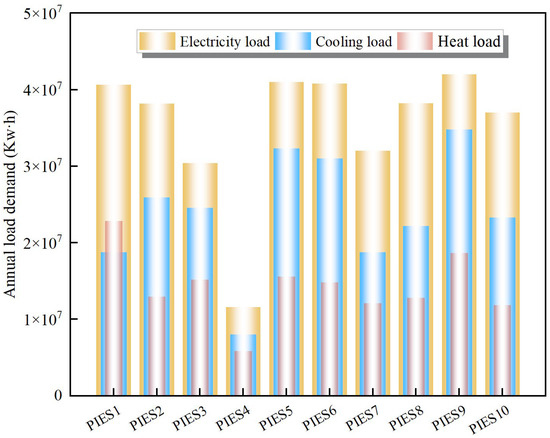
Figure 3.
Annual load demand.
3.2. Pareto Frontier Solution Set—PIES Project Portfolio
There are 210 = 1024 possible potential PIES project investment portfolio schemes based on 10 PIES project alternatives through permutation and combination. Taking the economic and environmental benefits of each PIES project portfolio as the objective function, and incorporating the constraints, including the equipment investment capacity, the investment scale, and the energy supply reliability, the Pareto frontier solution set ( = 1, 2, 3, …, 1024) could be obtained via the improved GWO (MAQMOGWO) algorithm, shown in Figure 4. Through an adaptive strategy, the algorithm parameters could be set, and the specific parameters are shown in Table 4.
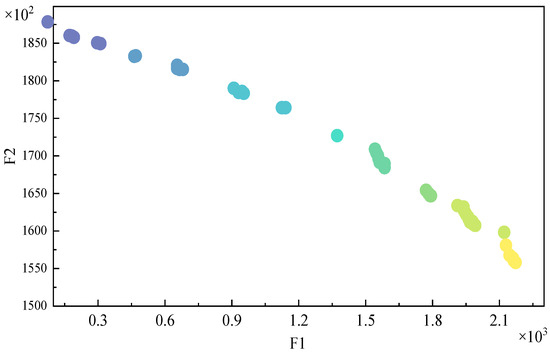
Figure 4.
Pareto frontiers obtained by the improved GWO algorithm (MAQMOGWO) (Note: Different colors can represent different decision-making preferences).
Table 4.
Optimal parameter configuration for MAQMOGWO.
In the Pareto frontier solution set, seven investment PIES project portfolios with satisfactory economic benefit and environmental benefit are taken as alternatives, written as follows.
To verity the superiority of the improved GWO (MAQMOGWO) algorithm in solving the MO 0–1 programming problem, three other algorithms, (NSGA-Ⅱ [78], Multi-Objective Multi-Verse Optimizer (MOMVO) [79], Multi-Objective Grey Wolf Optimizer (MOGWO) [54]) were also employed to address the same programming problem by setting the same parameters. The performance of convergence speed and the solution set distribution for the MAQMOGWO algorithm, the MOGWO algorithm, the NSGA-Ⅱ algorithm, and the MOMVO algorithm are exhibited in Figure 5a–d, respectively. It is clear from Figure 5a–d that the convergence speed and the solution set distribution obtained via the MAQMOGWO algorithm outperform those obtained by the other three algorithms, which demonstrates that the MAQMOGWO algorithm can enhance the global optimization performance.
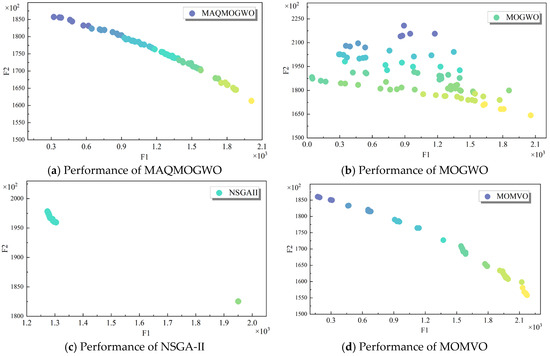
Figure 5.
Pareto frontiers obtained by different algorithms.
Moreover, in order to evaluate further performance of this algorithm, the Spacing Metric (SP) index [80] was introduced to reflect the convergence and the distribution uniformity of the Pareto frontiers. The smaller the SP value, the more uniform the distribution of the Pareto frontiers and the better the algorithm performance. Based on 30 independent runs of each algorithm, Table 5 shows that the maximum value, the minimum value, and the average value of SP obtained via MAQMOGWO perform better than those obtained by the other three algorithms. In addition, the standard deviation of the MAQMOGWO algorithm is the smallest, verifying that the algorithm has stronger robustness. Therefore, the MO 0–1 programming model with MAQMOGWO can help energy enterprise investors screen out the expected investment schemes that satisfy the economic and environmental benefits, and moreover, the Pareto PIES project portfolio scheme solution set with a uniform distribution can provide decision-makers with a more flexible scheme selection space.
Table 5.
The performance comparison for four algorithms.
Next, a comparative analysis was conducted on the target of economic benefits and the environmental benefits for the seven selected alternative project investment portfolio schemes (written as P1, P2, P3, P4, P5, P6, P7), as shown in Figure 6. The rank order of the economic benefits for the seven selected PIES project portfolios is P4 > P1 > P2 > P6 > P3 > P5 > P7, while the rank order of the environmental benefits is P7 > P3 > P5 > P4 > P2 > P1 > P6. Based on the above analysis, it is not feasible to make investment decisions merely considering the economic benefits or the environmental benefits. Specifically, the annual total profit of P1 reaches CNY 82.5083 million, and the NPV per unit investment is CNY 16.30924 million. However, the CO2 emissions of P1 are 128,246.042 tons, which is significantly higher than the other portfolios, belonging to the high-profit with high-emission type. And P2, P4, and P6 also belong to the same type. P3 and P5 belong to the high-profit with low-emission type. For example, the NPV per unit investment of P3 is CNY 12.90694 million, while the CO2 emissions are 70,125.006 tons, showing the typical characteristics of high profit with low emissions. For P7, the CO2 emissions are 57,638.004 tons at the lowest level, while the NPV per unit investment is CNY 8.80125 million, only 54% of that of P1, belonging to the low-profit with low-emission type. Based on the above analysis, it can be found that the seven alternative project investment portfolios show a significant Pareto trade-off relationship between the economic and environmental benefits. That is, pursuing a higher NPV per unit investment will lead to an increase in CO2 emissions. Conversely, pursuing higher environmental benefits will result in a downward trend in the economic benefits. This dilemma makes it difficult for energy enterprise investors to determine the optimal project investment portfolios based on experience, so it is necessary to further establish an MCDM method that considers the coordinated development of investment project attributes and multi-objective benefits.
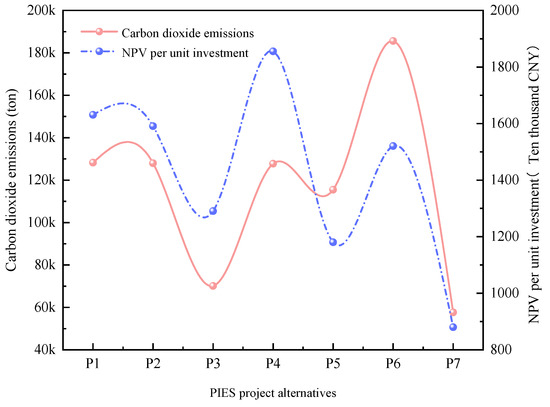
Figure 6.
Economic–environmental benefit trade-off diagram for alternative portfolios.
To prevent energy enterprise investors from making investment decisions solely based on single-project indicator data, such as the smallest investment scale, the highest profit, the largest NPV per unit investment, or the smallest carbon emissions, a comparative analysis of the investment allocation efficiency between 10 PIES projects (PIES1-PIES10) and 7 selected investment portfolios (P1–P7) was carried out, as shown in Figure 7. Although P1 shows the worst performance in the investment capital allocation efficiency among P1–P7, its investment capital allocation efficiency is still 11.4% higher than that of PIES1, which only considers the smallest investment scale, 11.1% higher than PIES2, which only considers the highest profit, 14.8% higher than PIES3, which only considers the largest net present value per unit investment, and 12.3% higher than PIES4, which only considers the smallest carbon emissions. The analysis indicates that pursuing a single objective may lead to a significant decline in the investment capital allocation efficiency of the projects, which verifies the necessity of carrying out the project investment portfolio selection work using 0–1 programming.
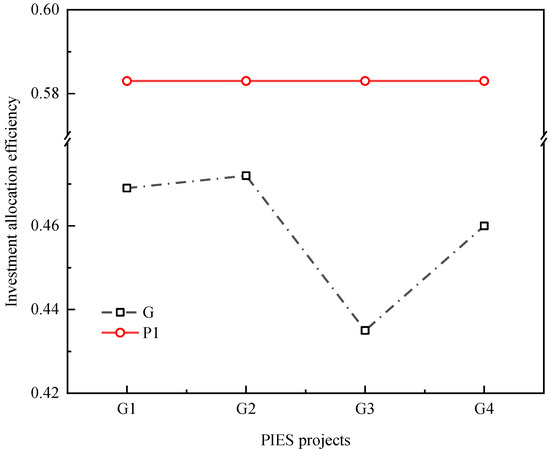
Figure 7.
Investment capital allocation efficiency comparative analysis.
3.3. PIES Project Portfolio Selection
Based on the results of the MO 0–1 programming issue and the evaluation index system of the PIES project portfolios, the MCDM model was employed to rank the PIES project portfolios.
3.3.1. Weighting Process
After establishing a scientific and reasonable evaluation index system for ranking the PIES project portfolios, it is the important to determine the weights of the indicators. The subjective weights of each indictor according to AHP method can be calculated using Equation (14). The objective entropy weight of each criterion can be determined using Equations (10)–(13). To guarantee the rationality of the weight determination, the coefficient of the subjective weight and the objective weight is set based on the experts’ opinions, at 0.5 for AHP and 0.5 for entropy [1]. The subjective weights, objective weights, and combined weights are shown in Table 6.
Table 6.
Weights of indicators.
In the combined weight results, the indicators with larger weights include the project operation capability S5, the solid waste emission level S10, the return on investment S2, the revenue per unit of power generation S3, and the CO2 emission reduction per unit energy supply S6. The results indicate that the main influencing factors for PIES project investment are the revenue- and the profitability-relevant indicators. In addition, the solid waste emissions and the CO2 emissions cannot be ignored.
3.3.2. Comprehensive Evaluation Results of PIES Project Portfolios and Analysis
In this section, TOPSIS was employed to integrate the indicator weights with the PIES project portfolios (selected seven Pareto solutions) to identify the optimal investment scheme. First, the weighted normalization matrix was calculated via Equation (22), shown in Table 7.
Table 7.
Normalization data matrix.
Then, the positive ideal solution and the negative ideal solution were determined by Equations (23) and (24), respectively, shown as follows.
A better PIES project portfolio should be closer to and further away from ; thus, the Euclidean distance was applied as Equations (26) and (27) to evaluate the similarity degree between the alternative PIES project portfolios and the ideal solutions and . Based on Equation (25), the relative closeness was calculated to rank the seven selected PIES project portfolios, where the larger , the more preferable the investment portfolio scheme. The calculation results are shown in Table 8. The rank order of the seven selected PIES project portfolios is P3 > P7 > P6 > P4 > P5 > P1 > P2.
Table 8.
Similarity to ideal solution, relative closeness, and ranking results.
From the data and weights of the indicators for the PIES project portfolios, P3 showed more significant advantages than the other alternative portfolios on the revenue per unit of power generation (S3), the project operation capability (S5), the CO2 emission reduction per unit energy supply (S6), and the solid waste emission level (S10). The main reason is that the weights of the advantageous indicators are relatively large; meanwhile, the data of the advantageous indicators for P3 showed excellent performance. And, at the same time, the data of the other indicators for P3 showed a medium level. This indicates that energy enterprise investors should focus on these advantageous indicators when selecting optimal PIES project portfolios. In Table 8, P2 shows unsatisfactory performance with rank 7. Although the revenue-relevant indicators, such as the energy supply benefit per unit of investment (S1) and the return on investment (S2), showed good performance, the environment-relevant indicators, including the ratio of the clean energy installed capacity (S7), the covered area per unit installed capacity (S8), the CO2 emission reduction per unit energy supply (S6), and the solid waste emission level (S10), showed unsatisfactory performance. Therefore, when making a comprehensive consideration of the investment decisions in energy projects, energy enterprises should pay more attention to the expected environmental benefits goal. For P6 and P7, the certain economic benefit indicators (S1, S2) and the environment benefit indicators (S9, S7) showed medium levels. The performance of almost all the indicators for P1 and P5 is at or below the medium level, which results in a relatively low ranking.
3.4. Robustness Analysis
To verify the stability of the MCDM-based optimal portfolio evaluation model for the PIES project investments proposed in this study, a robustness analysis of the ranking results was conducted in this section. The coefficient of the subjective weight and the objective weight was set to 0.3 and 0.7, 0.4 and 0.6, 0.5 and 0.5, 0.6 and 0.4, and 0.7 and 0.3. The corresponding ranking order results are shown in Table 9. It shows that the ranking of the top two project portfolios (P3, P7) remained unchanged, as did the ranking of the last two project portfolios (P2, P1). The ranking of the remaining project portfolios (P4, P5, P6) changed slightly. This indicated that the changes in the coefficient of the subjective weight and the objective weight have a small impact on the ranking of different project portfolios, even the final decision-making results.
Table 9.
Ranking order results with different coefficients of subjective weight and objective weight.
In addition, supposing the combined weights of the indicators fluctuate by ±5%, ±10%, ±20%, and ±30% based on the original combined weights, the impact of indicator weight changes on the final ranking results is shown in Figure 8. It can be seen that when the indicator weights fluctuate by 10%, 20%, and 30% above and below the original weights, the ranking for the seven selected PIES project portfolios is P3 > P7 > P6 > P4 > P5 > P1 > P2. When the indicator weights fluctuate by 5%, the ranking for the seven selected PIES project portfolios changes to P3 > P7 > P6 > P4 > P5 > P2 > P1. Therefore, the changes in indicator weights have a small impact on the investment decision-making framework, which verifies the effectiveness and the feasibility of the MCDM evaluation method.
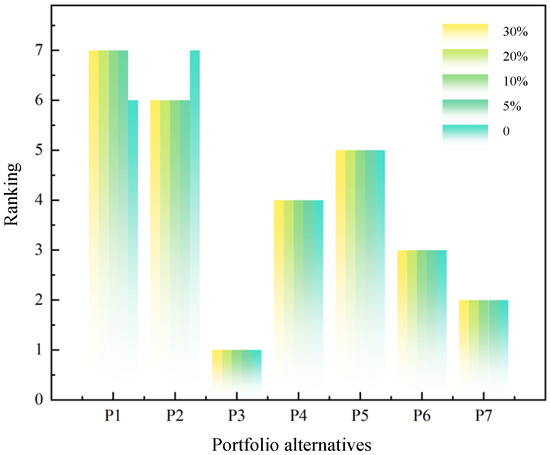
Figure 8.
Comparison of ranking changes for weight fluctuations.
Moreover, the return on investment indicator (S2) was taken as a robustness analysis example for further analysis of the weight fluctuations. Although the weight fluctuates significantly, as shown in Figure 9a, the relative closeness of P1 and P2 fluctuates slightly, as shown in Figure 9b.
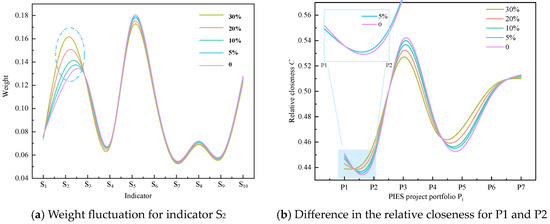
Figure 9.
Weight fluctuation in a certain indictor and the influence on certain portfolios.
3.5. Benchmark Comparative Analysis
In order to further verify the effectiveness of the two-stage investment decision model proposed in this paper, three comparative scenarios were set up in this section:
Scenario 1:
Considering the economic and environmental benefits, the constructed two-stage model was used to make investment decisions;
Scenario 2:
Considering the economic and environmental benefits, only multi-objective optimization [81] was used for decision-making;
Scenario 3:
Considering the economic benefits, single-objective optimization [82] was adopted for decision-making.
The decision effects under the three scenarios are shown in Table 10. It can be seen that the two-stage investment decision model proposed in this paper has higher efficiency in utilizing funds compared to the single-stage multi-objective optimization method, and it generates higher economic benefits without significantly increasing the environmental burden. Compared with the single economic goal, the capital utilization efficiency of the model in this paper is 25.4% higher. Although the NPV of unit investment decreases by 7.3%, the carbon emissions decrease by 14.12%, which has significant environmental benefits. Overall, the two-stage investment decision model considering multiple objectives has shown good performance in improving the efficiency of fund utilization and promoting the balance between economic and environmental benefits.
Table 10.
Decision effects under the three scenarios.
4. Conclusions
The scientific investment decision of PIES projects is the basis of enhancing the investment decision-making capability for energy enterprises when facing complex market competition. The aim of this research on the investment decision was to select optimal PIES project portfolios using a programming model with an MCDM technique. Using the MO 0–1 programming model solved by an improved grey wolf optimization algorithm, the Pareto frontier solution set (PIES project portfolios) was obtained. Next, the PIES project portfolios considering the overall benefits were ranked using an MCDM method. An empirical study was conducted with typical PIES projects, and the main conclusions are as follows.
- (1)
- In the investment decision-making process of PIES projects, solely pursuing economic benefits or environmental benefits is not reasonable. For example, for the seven selected PIES project portfolios, the ranking only considering the economic benefits is P4 > P1 > P2 > P6 > P3 > P5 > P7, while the ranking only considering the environmental benefits is P7 > P3 > P5 > P4 > P2 > P1 > P6. Pursuing higher NPV per unit investment will lead to an increase in CO2 emissions, and vice versa. This means that different portfolios may show different types, like the high-profit with high-emission type or the low-profit with low-emission type. Moreover, pursuing a single objective may lead to a significant decline in the investment capital allocation efficiency. Therefore, only by taking into account both economic and environmental benefits can the investment decision be more scientific.
- (2)
- The AHP–entropy–TOPSIS-based MCDM technique can rank the PIES project alternative portfolios exported from the MO 0–1 programming model. It can not only coordinate the economic and environmental benefits but also intuitively demonstrate the relative gaps among various alternative portfolios. P3 outperformed the other portfolios because the weights of the advantageous indicators were relatively high and, at the same time, the data of these indicators for P3 showed an excellent performance. On the contrary, certain indicators (S7, S8, S6, S10) with large weights for P2 showed unsatisfactory performance, resulting in the last rank.
- (3)
- The robustness analysis was conducted from two aspects. On one hand, the convergence speed and the solution set distribution of the MAQMOGWO algorithm outperformed those obtained by the other three algorithms mentioned in Section 3.2. In addition, the MAQMOGWO algorithm had a smaller Spacing Metric (SP) value and standard deviation, which indicated a more uniform distribution of the Pareto frontiers and stronger robustness. On the other hand, the stability of the hybrid MCDM-based evaluation technique was also verified. By changing the combined weights of the indicators, the ranking for the seven selected PIES project portfolios showed almost no change, which validated the effectiveness and the feasibility of the MCDM evaluation method. Through the benchmark comparative analysis, the two-stage investment decision framework showed better performance not only in fund utilization efficiency but also in promoting the balance between the economic benefits and the environmental benefits.
Author Contributions
Conceptualization, J.Y., R.M. and B.L.; methodology, R.M. and B.L.; validation, J.Y., R.M. and W.S.; investigation, W.S. and B.L.; data curation, R.M. and B.L.; writing—original draft preparation, J.Y. and W.S.; writing—review and editing, J.Y. and W.S.; visualization, J.Y. and W.S.; supervision, B.L. and W.S.; project administration, B.L.; funding acquisition, W.S. All authors have read and agreed to the published version of the manuscript.
Funding
This research was funded by the Fundamental Research Funds for the Central Universities (2024MS162).
Data Availability Statement
The original contributions presented in this study are included in the article. Further inquiries can be directed to the corresponding authors.
Conflicts of Interest
The authors declare no conflicts of interest.
References
- Yi, L.Q.; Li, T.; Zhang, T. Optimal investment selection of regional integrated energy system under multiple strategic objectives portfolio. Energy 2021, 218, 119409. [Google Scholar] [CrossRef]
- Shi, C.; Yu, M. Flexible solid-state lithium-sulfur batteries based on structural designs. Energy Storage Mater. 2023, 57, 429–459. [Google Scholar] [CrossRef]
- Zeng, M. Integrated Energy System; China Electric Power Press: Beijing, China, 2020. [Google Scholar]
- Dong, W.; Chen, C.F.; Fang, X.L.; Zhang, F.; Yang, Q. Enhanced integrated energy system planning through unified model coupling multiple energy and carbon emission flows. Energy 2024, 307, 132799. [Google Scholar] [CrossRef]
- Wang, Y.; Zhang, N.; Zhuo, Z.Y.; Kang, C.Q.; Kirschen, D. Mixed-integer linear programming-based optimal configuration planning for energy hub: Starting from scratch. Appl. Energy 2018, 210, 1141–1150. [Google Scholar] [CrossRef]
- Park, H.; Baldick, R. Optimal Capacity planning of generation system integrating uncertain solar and wind energy with seasonal variability. Electr. Power Syst. Res. 2020, 180, 106072. [Google Scholar] [CrossRef]
- Alizad, E.; Hasanzad, F.; Rastegar, H. A tri-level hybrid stochastic-IGDT dynamic planning model for resilience enhancement of community-integrated energy systems. Sustain. Cities Soc. 2024, 117, 105948. [Google Scholar] [CrossRef]
- Mansouri, S.A.; Ahmarinejad, A.; Ansarian, M.; Javadi, M.S.; Catalao, J.P.S. Stochastic planning and operation of energy hubs considering demand response programs using benders decomposition approach. Int. J. Electr. Power Energy Syst. 2020, 120, 106030. [Google Scholar] [CrossRef]
- Gai, C.; Zhang, K.; Chen, J.; Chi, X.W.; Liu, Y. Research on the planning for integrated energy system planning of typical scenarios considering demand response. Shandong Electr. Power 2023, 50, 75–86. [Google Scholar] [CrossRef]
- Shabanian-Poodeh, M.; Hooshmand, R.A.; Shafie-khah, M. Reliability-constrained configuration optimization for integrated power and natural gas energy systems: A stochastic approach. Reliab. Eng. Syst. Saf. 2025, 254, 110600. [Google Scholar] [CrossRef]
- Beuzekom, I.V.; Hodge, B.M.; Slootweg, H. Framework for optimization of long-term, multi-period investment planning of integrated urban energy systems. Appl. Energy 2021, 292, 116880. [Google Scholar] [CrossRef]
- Wu, M.; Xu, J.; Zeng, L.; Li, C.; Liu, Y.; Yi, Y.; Wen, M.; Jiang, Z. Two-stage robust optimization model for park integrated energy system based on dynamic programming. Appl. Energy 2022, 308, 118249. [Google Scholar] [CrossRef]
- Lei, Y.; Wang, D.; Jia, H.; Li, J.; Chen, J.; Li, J.; Yang, Z. Multi-stage stochastic planning of regional integrated energy system based on scenario tree path optimization under long-term multiple uncertainties. Appl. Energy 2021, 300, 117224. [Google Scholar] [CrossRef]
- Peng, C.; Fan, G.; Xiong, Z.; Zeng, X.; Sun, H.; Xu, X. Integrated energy system planning considering renewable energy uncertainties based on multi-scenario confidence gap decision. Renew. Energy 2023, 216, 119100. [Google Scholar] [CrossRef]
- Wang, Y.; Li, R.; Dong, H.; Ma, Y.; Yang, J.; Zhang, F.; Zhu, J.; Li, S. Capacity planning and optimization of business park-level integrated energy system based on investment constraints. Energy 2019, 189, 116345. [Google Scholar] [CrossRef]
- Shi, J.Y.; Xu, J.; Zeng, B.; Zhang, J.H. A bi-level optimal operation for energy hub based on regulating heat-to-electric ratio mode. Power Syst. Technol. 2016, 40, 2959–2966. [Google Scholar] [CrossRef]
- Gu, W.; Lu, S.; Wang, J.; Xiang, Y.; Zhang, C.; Wang, Z. Modeling of the heating network for multi-district integrated energy system and its operation optimization. Proc. CSEE 2017, 37, 1305–1315. [Google Scholar] [CrossRef]
- Ma, W.; Deng, W.; Pei, W.; Yang, H.; Wang, Y.; Wang, L.; Li, Q.; Zhang, L.; Wan, L.; Liang, Z. Operation optimization of electric power-hot water-steam integrated energy system. Energy Rep. 2022, 8, 475–482. [Google Scholar] [CrossRef]
- Gu, J.; Bai, K.F.; Shi, Y.J. Optimized operation of regional integrated energy system based on multi-agent master-slave game optimization interaction mechanism. Power Syst. Technol. 2019, 43, 3119–3129. [Google Scholar] [CrossRef]
- Wang, Y.; Wang, Y.; Huang, Y.; Yang, J.; Ma, Y.; Yu, H.; Zeng, M.; Zhang, F.; Zhang, Y. Operation optimization of regional integrated energy system based on the modeling of electricity-thermal-natural gas network. Appl. Energy 2019, 251, 113410. [Google Scholar] [CrossRef]
- Yang, M.; Liu, Y.S. Research on Multi-energy collaborative operation optimization of integrated energy system considering carbon trading and demand response. Energy 2023, 283, 129117. [Google Scholar] [CrossRef]
- Kim, J.-K.; Park, H.; Kim, S.-J.; Lee, J.; Song, Y.; Yi, S.C. Optimization models for the cost-effective design and operation of renewable-integrated energy systems. Renew. Sustain. Energy Rev. 2023, 183, 113429. [Google Scholar] [CrossRef]
- Zhen, J.L.; Liu, X.R.; Wu, C.B.; Ji, L.; Huang, G.H. Operation optimization and performance evaluation of photovoltaic-wind-hydrogen-based integrated energy system under carbon trading mechanism and uncertainty for urban communities. J. Clean. Prod. 2024, 476, 143688. [Google Scholar] [CrossRef]
- Mahmud, S.; Ponkiya, B.; Katikaneni, S.; Pandey, S.; Mattimadugu, K.; Yi, Z.; Walker, V.; Wang, C.; Westover, T.; Javaid, A.Y.; et al. Design and optimization of a modular hydrogen-based integrated energy system to maximize revenue via nuclear-renewable sources. Energy 2024, 313, 133763. [Google Scholar] [CrossRef]
- Diao, H.B.; Li, P.Q.; Wang, J.F.; Wang, D.; Li, Z.S. Optimal dispatch of integrated energy system considering complementary coordination of electric/thermal energy storage. Trans. China Electrotech. Soc. 2020, 35, 4532–4543. [Google Scholar] [CrossRef]
- Cin, E.D.; Carraro, G.; Volpato, G.; Lazzaretto, A.; Tsatsaronis, G. DOMES: A general optimization method for the integrated design of energy conversion, storage and networks in multi-energy systems. Appl. Energy 2025, 377, 124702. [Google Scholar] [CrossRef]
- Shafiei, K.; Seifi, A.; Hagh, M.T. A Novel Multi-objective optimization approach for resilience enhancement considering integrated energy systems with renewable energy, Energy Storage, Energy Sharing, and Demand-side Management. J. Energy Storage 2025, 115, 115966. [Google Scholar] [CrossRef]
- Zhang, R.F.; Chen, Y.; Li, Z.M.; Jiang, T.; Li, X. Two-stage robust operation of electricity-gas-heat integrated multi-energy microgrids considering heterogeneous uncertainties. Appl. Energy 2024, 371, 123690. [Google Scholar] [CrossRef]
- Zhang, X.; Zhan, Y.; Zhao, T.; Mei, J.; Jiao, F.; Zeng, R.; Sun, X.; Wang, M. Three-stage optimization of integrated energy system considering source/load uncertainties and orderly charging of NEVs. Energy 2024, 313, 133717. [Google Scholar] [CrossRef]
- Xu, H.; Dong, S.F.; He, Z.X.; Shi, Y.H. Comprehensive energy system with multi-energy synergistic optimization in a factory considering energy cascade utilization. Autom. Electr. Power Syst. 2018, 42, 123–130. [Google Scholar] [CrossRef]
- Zhang, S.T.; Lu, H.; Lin, X.J.; Zhong, W.; Liu, S.B. Operation scheduling optimization of integrated-energy system in industrial park in consideration of energy storage. High Volt. Eng. 2021, 47, 93–103. [Google Scholar] [CrossRef]
- Wang, H.Y.; Li, K.; Zhang, C.H.; Ma, X. Distributed coordinative optimal operation of community integrated energy system based on stackelberg game. Proc. CSEE 2020, 40, 5435–5444. [Google Scholar] [CrossRef]
- Ma, L.; Xie, L.R.; Ye, J.H.; Bian, Y.F. Two-stage dispatching strategy for park-level integrated energy systems based on a master-slave-cooperative hybrid game model. Renew. Energy 2024, 232, 120971. [Google Scholar] [CrossRef]
- Dong, Y.C.; Wuken, E.; Zhang, H.L.; Ren, P.; Zhou, X.J. Bi-level coordinated operation optimization of multi-park integrated energy systems considering categorized demand response and uncertainty: A unified adaptive robust optimization approach. Renew. Energy 2025, 241, 122331. [Google Scholar] [CrossRef]
- Zhao, E.M.; Zhang, B.; Li, H.Z.; Wu, Z.C.; Lei, X. Economic benefit evaluation of regional integrated energy systems based on an improved minimum cross-entropy method. Electr. Power Eng. Technol. 2022, 41, 215–223. [Google Scholar] [CrossRef]
- Xiang, Y.; Cai, H.H.; Gu, C.H.; Shen, X.D. Cost-benefit analysis of integrated energy system planning considering demand response. Energy 2020, 192, 116632. [Google Scholar] [CrossRef]
- Guo, Y.T.; Xiang, Y. Cost–benefit Analysis of Photovoltaic-storage investment in integrated energy systems. Energy Rep. 2022, 8, 66–71. [Google Scholar] [CrossRef]
- Abdussami, M.R.; Verma, A. Future Energy Landscapes: Analyzing the cost-effectiveness of nuclear-renewable integrated energy systems in retrofitting of coal power plants. Appl. Energy 2025, 377 Pt A, 124460. [Google Scholar] [CrossRef]
- Ba-swaimi, S.; Verayiah, R.; Ramachandaramurthy, V.K.; ALAhmad, A.K.; Abu-Rayash, A. Development and techno-economic assessment of an optimized and integrated solar/wind energy system for remote health applications. Energy Convers. Manag. 2025, 26, 100985. [Google Scholar] [CrossRef]
- Gimelli, A.; Iossa, R.; Karimi, A.; Muccillo, M.; Braccio, S.; Phan, H. Energy-saving and economic feasibility of a battery-integrated combined cooling, heating and power (CCHP) plant through waste heat recovery for H2O-NH3 based absorption, power and cooling (APC) system. Energy 2025, 317, 134640. [Google Scholar] [CrossRef]
- Zhang, Y.Y.; Li, L.; Liu, X.M. A comprehensive evaluation method for the operational benefits of integrated energy systems considering uncertainties. Renew. Energy Resour. 2019, 37, 1671–1678. [Google Scholar] [CrossRef]
- Zhou, P.C.; Cheng, Y.X.; Zeng, M. Research on supply and demand characteristics and comprehensive benefit evaluation of multi-energy system for smart city. Shandong Electr. Power 2019, 46, 1–7. [Google Scholar]
- Kim, M.; Kim, K.; Kim, T.-H.; Kim, J. Economic and environmental benefit analysis of a renewable energy supply system integrated with carbon capture and utilization framework. Chem. Eng. Res. Des. 2019, 147, 200–213. [Google Scholar] [CrossRef]
- Ba-swaimi, S.; Verayiah, R.; Ramachandaramurthy, V.K.; Alahmad, A.K. An integrated and optimized framework for hybrid renewable and hydrogen energy systems in the healthcare sector: Economic, technical, and environmental assessment. Int. J. Hydrogen Energy 2025, 115, 361–378. [Google Scholar] [CrossRef]
- Zhou, X.J.; Tan, W.; Sun, Y.; Huang, T.W.; Yang, C.H. Multi-objective optimization and decision making for integrated energy system using STA and fuzzy TOPSIS. Expert Syst. Appl. 2024, 240, 122539. [Google Scholar] [CrossRef]
- Ma, Y.Z.; Zhang, T.; Deng, L.; Song, Z.C.; Li, T. Research on investment selection of park-level integrated energy system considering electricity-heat-cooling-storage based on matter element extension. Energy 2024, 304, 132054. [Google Scholar] [CrossRef]
- Aragonés-Beltrán, P.; Chaparro-González, F.; Pastor-Ferrando, J.-P.; Pla-Rubio, A. An AHP (Analytic Hierarchy Process)/ANP (Analytic Network Process)-based multi-criteria decision approach for the selection of solar-thermal power plant investment projects. Energy 2014, 66, 222–238. [Google Scholar] [CrossRef]
- Wu, Y.; Wu, C.; Zhou, J.; He, F.; Xu, C.; Zhang, B.; Zhang, T. An investment decision framework for photovoltaic power coupling hydrogen storage project based on a mixed evaluation method under intuitionistic fuzzy environment. J. Energy Storage 2020, 30, 101601. [Google Scholar] [CrossRef]
- Manirathinam, T.; Narayanamoorthy, S.; Geetha, S.; Othman, M.F.I.; Alotaibi, B.S.; Ahmadian, A.; Kang, D. Sustainable renewable energy system selection for self-sufficient households using integrated fermatean neutrosophic fuzzy stratified AHP-MARCOS approach. Renew. Energy 2023, 218, 119292. [Google Scholar] [CrossRef]
- Ji, Z.S.; Yu, X.Y.; Li, W.Y.; Niu, D.X. A multi-criteria decision-making framework for distributed generation projects investment considering the risk of electricity market trading. J. Clean. Prod. 2023, 416, 137837. [Google Scholar] [CrossRef]
- Silva, N.F.; dos Santos, M.; Simões Gomes, F.S.; de Andrade, L.P. An integrated CRITIC and grey relational analysis approach for investment portfolio selection. Decis. Anal. J. 2023, 8, 100285. [Google Scholar] [CrossRef]
- Ke, Y.; Liu, J.; Meng, J.; Fang, S.; Zhuang, S. Comprehensive evaluation for plan selection of urban integrated energy systems: A novel multi-criteria decision-making framework. Sustain. Cities Soc. 2022, 81, 103837. [Google Scholar] [CrossRef]
- Mirjalili, S.; Mirjalili, S.M.; Lewis, A. Grey Wolf Optimizer. Adv. Eng. Softw. 2014, 69, 46–61. [Google Scholar] [CrossRef]
- Mirjalili, S.; Saremi, S.; Mirjalili, S.M.; Coelho, L.D.S. Multi-objective grey wolf optimizer: A novel algorithm for multi-criterion optimization. Expert Syst. Appl. 2016, 47, 106–119. [Google Scholar] [CrossRef]
- Li, P.; Wang, H. Bloch coordinates-based quantum particle swarm optimization algorithm and its application. Comput. Syst. Appl. 2012, 21, 76–79, 84. [Google Scholar]
- Li, P.; Wang, Q.; Shi, G. Quantum Particle Swarm Optimization Algorithm Based on Bloch Spherical Search. Chin. J. Comput. Phys. 2013, 30, 454–462. [Google Scholar] [CrossRef]
- Zhao, C.; Wang, B.; Sun, Z.; Wang, X. Optimal configuration optimization of islanded microgrid using improved grey wolf optimizer algorithm. Acta Energiae Solaris Sin. 2022, 43, 256–262. [Google Scholar]
- Heidari, A.A.; Aljarah, I.; Faris, H.; Chen, H.; Luo, J.; Mirjalili, S. An enhanced associative learning-based exploratory whale optimizer for global optimization. Neural Comput. Appl. 2020, 32, 5185–5211. [Google Scholar] [CrossRef]
- Wen, Q.; Liu, G.; Wu, W.; Liao, S. Multicriteria comprehensive evaluation framework for industrial park-level distributed energy system considering weights uncertainties. J. Clean. Prod. 2021, 282, 124530. [Google Scholar] [CrossRef]
- Wang, Q.; Lu, Y.; Liu, Y.; Xie, N.; Xu, L. Investment evaluation method of integrated energy system. Smart Power 2020, 48, 20–27. [Google Scholar]
- Zhong, Y.; Wang, L.; Zheng, Y.; Yin, J.; Guo, Z.; Li, Z. Comprehensive evaluation index system for integrated energy system in industrial park. Power Demand Side Manag. 2020, 22, 51–56. [Google Scholar]
- Li, J.; Xu, W.; Feng, X.; Lu, H.; Qiao, B.; Gu, W.; Zhang, G.; Jiao, Y. Comprehensive evaluation system for optimal configuration of multi-energy systems. Energy Build. 2021, 252, 111367. [Google Scholar] [CrossRef]
- Aghdam, F.H.; Mohammadi-ivatloo, B.; Abapour, M.; Marzband, M.; Rasti, M.; Pongracz, E. Enhancing the risk-oriented participation of wind power plants in day-ahead, balancing, and hydrogen markets with shared multi-energy storage systems. J. Energy Storage 2025, 107, 114911. [Google Scholar] [CrossRef]
- Raos, S.; Hranić, J.; Rajšl, I. Multi-criteria decision-making method for evaluation of investment in enhanced geothermal systems projects. Energy AI 2024, 17, 100390. [Google Scholar] [CrossRef]
- Leng, Y.-J.; Peng, D.; Zhang, H. Integrated energy system evaluation method based on dimensionality reduction and indexes updating with incomplete information. Energy 2023, 277, 127552. [Google Scholar] [CrossRef]
- Shen, M.; Zhang, G.; Zhang, K. Comprehensive Evaluation Method and Application Study of Campus-level Regional Integrated Energy System. J. Beijing Inst. Technol. 2022, 24, 52–65. [Google Scholar] [CrossRef]
- Wang, Z.; Ren, J.; Goodsite, M.E.; Xu, G. Waste-to-energy, municipal solid waste treatment, and best available technology: Comprehensive evaluation by an interval-valued fuzzy multi-criteria decision making method. J. Clean. Prod. 2018, 172, 887–899. [Google Scholar] [CrossRef]
- Saaty, T.L. A scaling method for priorities in hierarchical structures. J. Math. Psychol. 1977, 15, 234–281. [Google Scholar] [CrossRef]
- Saaty, T.L. Decision making with the analytic hierarchy process. Int. J. Serv. Sci. 2008, 1, 83–98. [Google Scholar] [CrossRef]
- Shannon, C.E. A mathematical theory of communication. Bell Syst. Tech. J. 1948, 27, 623–656. [Google Scholar] [CrossRef]
- Hwang, C.L.; Yoon, K. Multiple Attribute Decision Making: Methods and Applications; Springer: Berlin/Heidelberg, Germany, 1981. [Google Scholar]
- Wang, Y.; Guo, L.; Zhou, M. Research on integrated energy system planning optimization based on fixed investment. Power Demand Side Manag. 2020, 22, 38–44, 57. [Google Scholar]
- Microgrid. N.E.A.W.G.O. Technical Design and Operational Management of Microgrid in Three Typical Areas. 2013. Available online: http://www.efchina.org/Attachments/Report/report-cre-20151126/ (accessed on 16 July 2025).
- Guo, L.; Liu, W.; Cai, J.; Hong, B.; Wang, C. A two-stage optimal planning and design method for combined cooling, heat and power microgrid system. Energy Convers. Manag. 2013, 74, 433–445. [Google Scholar] [CrossRef]
- Ma, W.; Fang, S.; Liu, G. Hybrid optimization method and seasonal operation strategy for distributed energy system integrating CCHP, photovoltaic and ground source heat pump. Energy 2017, 141, 1439–1455. [Google Scholar] [CrossRef]
- Wu, D.; Han, Z.; Liu, Z.; Zhang, H. Study on configuration optimization and economic feasibility analysis for combined cooling, heating and power system. Energy Convers. Manag. 2019, 190, 91–104. [Google Scholar] [CrossRef]
- Dou, C. Study of Combined Cooling Heating and Power System Coupled with Ground Source Heat Pump. Master’s Thesis, North China Electric Power University, Beijing, China, 2018. [Google Scholar]
- Deb, K.; Pratap, A.; Agarwal, S.; Meyarivan, T. A fast and elitist multiobjective genetic algorithm: NSGA-II. IEEE Trans. Evol. Comput. 2002, 6, 182–197. [Google Scholar] [CrossRef]
- Jangir, P.; Mirjalili, S.Z.; Saremi, S.; Trivedi, I.N. Optimization of problems with multiple objectives using the multi-verse optimization algorithm. Knowl.-Based Syst. 2017, 134, 50–71. [Google Scholar] [CrossRef]
- Zhou, B.; Cao, Y.; Li, C.; Wu, Q.; Liu, N.; Huang, S.; Wang, H. Many-criteria optimality of coordinated demand response with heterogeneous households. Energy 2020, 207, 118267. [Google Scholar] [CrossRef]
- Gao, L.; Zhao, Z.Y.; Li, C. An investment decision-making approach for power grid projects: A multi-objective optimization model. Energies 2022, 15, 1112. [Google Scholar] [CrossRef]
- Liu, J.; Zhang, Q.; Teng, F.; Wang, L.; Gao, Z.; Wang, G. A new investment decision-making model of hydrogen energy storage technology based on real-time operation optimization and learning effects. J. Energy Storage 2024, 96, 112745. [Google Scholar] [CrossRef]
Disclaimer/Publisher’s Note: The statements, opinions and data contained in all publications are solely those of the individual author(s) and contributor(s) and not of MDPI and/or the editor(s). MDPI and/or the editor(s) disclaim responsibility for any injury to people or property resulting from any ideas, methods, instructions or products referred to in the content. |
© 2025 by the authors. Licensee MDPI, Basel, Switzerland. This article is an open access article distributed under the terms and conditions of the Creative Commons Attribution (CC BY) license (https://creativecommons.org/licenses/by/4.0/).