1. Introduction
Remanufacturing is a green manufacturing mode that restores or surpasses the original state of used products, and is an important path to realize energy saving and emission reduction [
1,
2,
3]. Remanufacturing design is a core component of remanufacturing systems because it determines the remanufacturing potential of products, carbon emissions during remanufacturing, and the ergonomics of products. Undoubtedly, Remanufactured design is an important factor in reducing carbon emissions and improving product comfort levels [
4,
5].
However, the remanufacturing design process often results in multiple design alternatives, and it is necessary to make sound decisions to select the optimal solution. Remanufacturing design should not only consider the possibility of enhancing the reuse value of products through remanufacturing but also focus on the carbon emissions generated during the remanufacturing process in order to reduce the greenhouse effect. Meanwhile, the design scheme should also consider ergonomics to make it more comfortable and convenient for customers to use the product. These make it much more difficult to make decisions on design solutions. In order to make the correct design scheme decision, it is necessary to establish a reasonable design scheme evaluation indicator system. Nowadays, a large number of scholars have conducted relevant research on the remanufacturing design scheme evaluation. Cai et al. [
6] proposed a fuzzy decision-making method for green design, which considered the product remanufacturability and reliability. Ding et al. [
7] constructed the evaluation indicator system of machine tool guideway materials and proposed a multi-objective decision-making method for guideway material selection. Jiang et al. [
8] proposed a data-driven evaluation method for eco-performance remanufacturing processes, which constructed an evaluation indicator system for energy-saving efficiency, remanufacturing cost, and remanufacturing efficiency. Dang et al. [
9] applied the Knowledge Graph (KG) to develop a green design evaluation methodology and have conducted extensive work in building a global electrical and electronic Knowledge Graph (KG), including green design requirements in global standards, regulations, and certifications. Ng et al. [
10] proposed a methodology combining fuzzy sets, mainly considering environmental impact indicators, for decision makers to evaluate design alternatives in the early stages of product development. There is no doubt that the above-mentioned scholars have conducted in-depth studies on remanufacturing design schemes for evaluation and decision making, from the perspectives of environmental impact, material selection, remanufacturability, and eco-performance. This has contributed to the smooth implementation of the remanufacturing process.
Unfortunately, these studies only considered the impact of remanufacturing design on process operability, cost, and product reliability, but it does not adequately consider the impact of the design scheme on the carbon emissions of the remanufacturing process and the ergonomic comfort of the customer with the product. This will lead to potentially excessive carbon emissions from the remanufacturing process, as well as low product comfort, which can reduce product sustainability and customer purchasing intentions. In the remanufacturing process, if the designer does not fully consider the ergonomic and functional requirements of the product during the remanufacturing stage, it may lead to a decline in product comfort. For example, changes in the structure or materials of the product during remanufacturing may affect its fit, usability, or sensory experience, thereby reducing the comfort of the product for users. A decrease in product comfort can further reduce customer purchasing intentions, as consumers usually prefer products that can provide a good user experience. Studies have shown that product comfort is an important factor affecting consumer purchasing decisions [
11,
12]. Some scholars have also conducted research on product design that focuses on carbon emissions and ergonomics, such as low-carbon concept design [
13], low-carbon design based on design structure [
14], low-carbon optimization design [
15], product aesthetics evaluation [
16], ergonomic design based on a multi-criteria decision-making approach [
17], Human-Centered Generative Design [
18], etc. The above studies consider carbon emissions during the manufacturing stage from the perspectives of product probability design, product structure, and design optimization, which can reduce manufacturing carbon emissions through product design, but none of them consider the product remanufacturability factors. In addition, ergonomic design studies fully consider factors such as safety, comfort, and efficiency when customers use products and can improve the human–machine characteristics of products, but they rarely consider product remanufacturability and manufacturing carbon emissions in a coordinated manner.
Remanufacturing design considers the remanufacturability at the initial design stage, which can improve remanufacturing efficiency at the end of the product’s life cycle, but the design scheme also affects the carbon emissions of the remanufacturing process, and excessive carbon emissions can directly reduce the advantages of remanufacturing. Moreover, the ergonomic characteristics of the product directly affect the comfort, safety, and willingness to buy, so designers should also consider whether the product has good ergonomic characteristics. Therefore, the evaluation indicator system of the remanufacturing design scheme should include remanufacturability, carbon emissions, and ergonomic characteristics. Meanwhile, when designers ensure product remanufacturability, ergonomic characteristics, and carbon emissions, they may increase the manufacturing cost of the product, thereby increasing the financial risk of the enterprise and reducing profits. Therefore, the design scheme also needs to consider whether the manufacturing cost can satisfy the needs of the enterprise. In summary, decision making on remanufacturing design schemes needs to consider four aspects, remanufacturability, human–machine characteristics, carbon emissions, and cost, to ensure the rationality and feasibility of the design scheme.
Furthermore, designers need to reasonably assign weights to each evaluation indicator in order to ensure the accuracy of design scheme decisions. However, there are both subjective and objective evaluation indicators; for example, the comfort indicator in the ergonomic characteristics is evaluated by the subjective feeling of human beings, while the carbon emission indicator requires specific numerical values to be evaluated. The simple subjective or objective evaluation method cannot obtain accurate indicator weights, so a combination of subjective and objective quantitative methods needs to be used. The analytic hierarchy process (AHP) is a structured technique for analyzing complex decision-making situations that relies heavily on human scoring and the comparison of indicator scores for weighting, which has been applied in many fields [
19], such as machinery manufacturing [
20], energy consumption in commercial building [
21], meteorological evaluation [
22], transportation [
23], etc. The AHP is capable of utilizing human subjective feelings for indicator weight calculation, which provides a good way to calculate weights for ergonomic indicators. The entropy weight method (EW) is an objective weighting method, which calculates the information entropy of an indicator and determines the weight of the indicator based on the relative degree of change in the indicator on the system as a whole. Therefore, the entropy weighting method is able to calculate the weights according to the specific values of the evaluation indicators of the design scheme, which has been applied in many fields, such as ground collapse risk evaluation [
24], urban infrastructure [
25], city transportation [
26], energy efficiency evaluation [
27], etc. According to the advantages of the entropy weight method, the subjectivity in the allocation of the weights of the evaluation indicators of the design scheme can be avoided. In order to balance the perceptual and rational indicators, the AHP and EW need to be used jointly to ensure the rationality of the allocation of indicator weights.
For the multi-attribute decision problem, it is necessary to apply a rational decision scheme for design option selection. Currently, the commonly used multi-attribute decision analysis methods include TOPSIS, VIKOR, and DEMATEL, etc. The remanufacturing design scheme decision is based on a comprehensive assessment of multiple design objectives, including product economics, environmental and functional characteristics, etc. TOPSIS is suitable for scenarios involving multiple attributes (such as cost, functionality, aesthetics, environmental friendliness, etc.) and can simultaneously process quantitative indicators and calculate intuitively, which is suitable for the indicator characteristics of the remanufacturing design scheme. Moreover, TOPSIS has been widely used in various fields, such as regional green development [
28], solar energy [
29], earthen sites [
30], financial risk assessment [
31], etc. From the above study, it is clear that TOPSIS is able to quickly and efficiently rank solutions to help decision makers make rational decisions. However, TOPSIS makes a default linear relationship between attributes in the decision-making process, ignoring nonlinear or interaction effects (e.g., threshold triggers for some indicators), which will affect the reliability of the decision results. For this reason, it is necessary to introduce the other auxiliary methods to enhance the adaptability of TOPSIS to nonlinear attributes, such as gray correlation analysis (GRA), the fuzzy comprehensive evaluation method, rough set theory, and gray clustering method. These methods can effectively deal with issues such as incomplete information and uncertainty. Yet, gray correlation analysis has simple calculation logic and is good at handling mixed quantitative and qualitative indicators. Additionally, many studies have been conducted to combine GRA and TOPSIS for accurate decision making, such as underwater vehicles [
32], threat assessment of targets [
33], water resource carrying capacity [
34], risk assessment for urban areas [
35], etc. GRA can partially capture nonlinear features by reflecting the dynamic relationship between sequences through correlation coefficients to compensate for the weak nonlinear interactions of TOPSIS. The combination of GRA and TOPSIS can improve the robustness of decision making for remanufacturing design schemes.
To improve the accuracy of decision making for remanufacturing design schemes, this paper proposes an integrated multi-attribute remanufacturing design scheme decision-making method to select the optimal scheme. This paper has the following innovative points: (1) The evaluation indicator system for remanufacturing design schemes is constructed, focusing on product remanufacturability, cost, carbon emissions, and ergonomics, which makes the product design solutions more environmentally friendly and human-friendly. (2) A multi-attribute decision-making method is proposed that takes full account of the subjective and objective character of indicator weights and the nonlinearity between indicator attributes. (3) A remanufacturing design decision-making software was developed to improve the operability and efficiency of the design process. This paper is mainly composed of the following structure:
Section 2 presents a general framework for decision making on remanufacturing design schemes.
Section 3 constructs an evaluation indicator system for remanufacturing design schemes, including remanufacturability, ergonomics, cost, and carbon emissions.
Section 4 proposes a design scheme decision-making method that integrates GRA and TOPSIS, while subjective and objective metric weights are computed using AHP and EW.
Section 5 validates the proposed methodology with the remanufacturing design of the coffee machine, and
Section 6 presents the conclusion of this study.
2. Decision-Making Framework for Remanufacturing Design
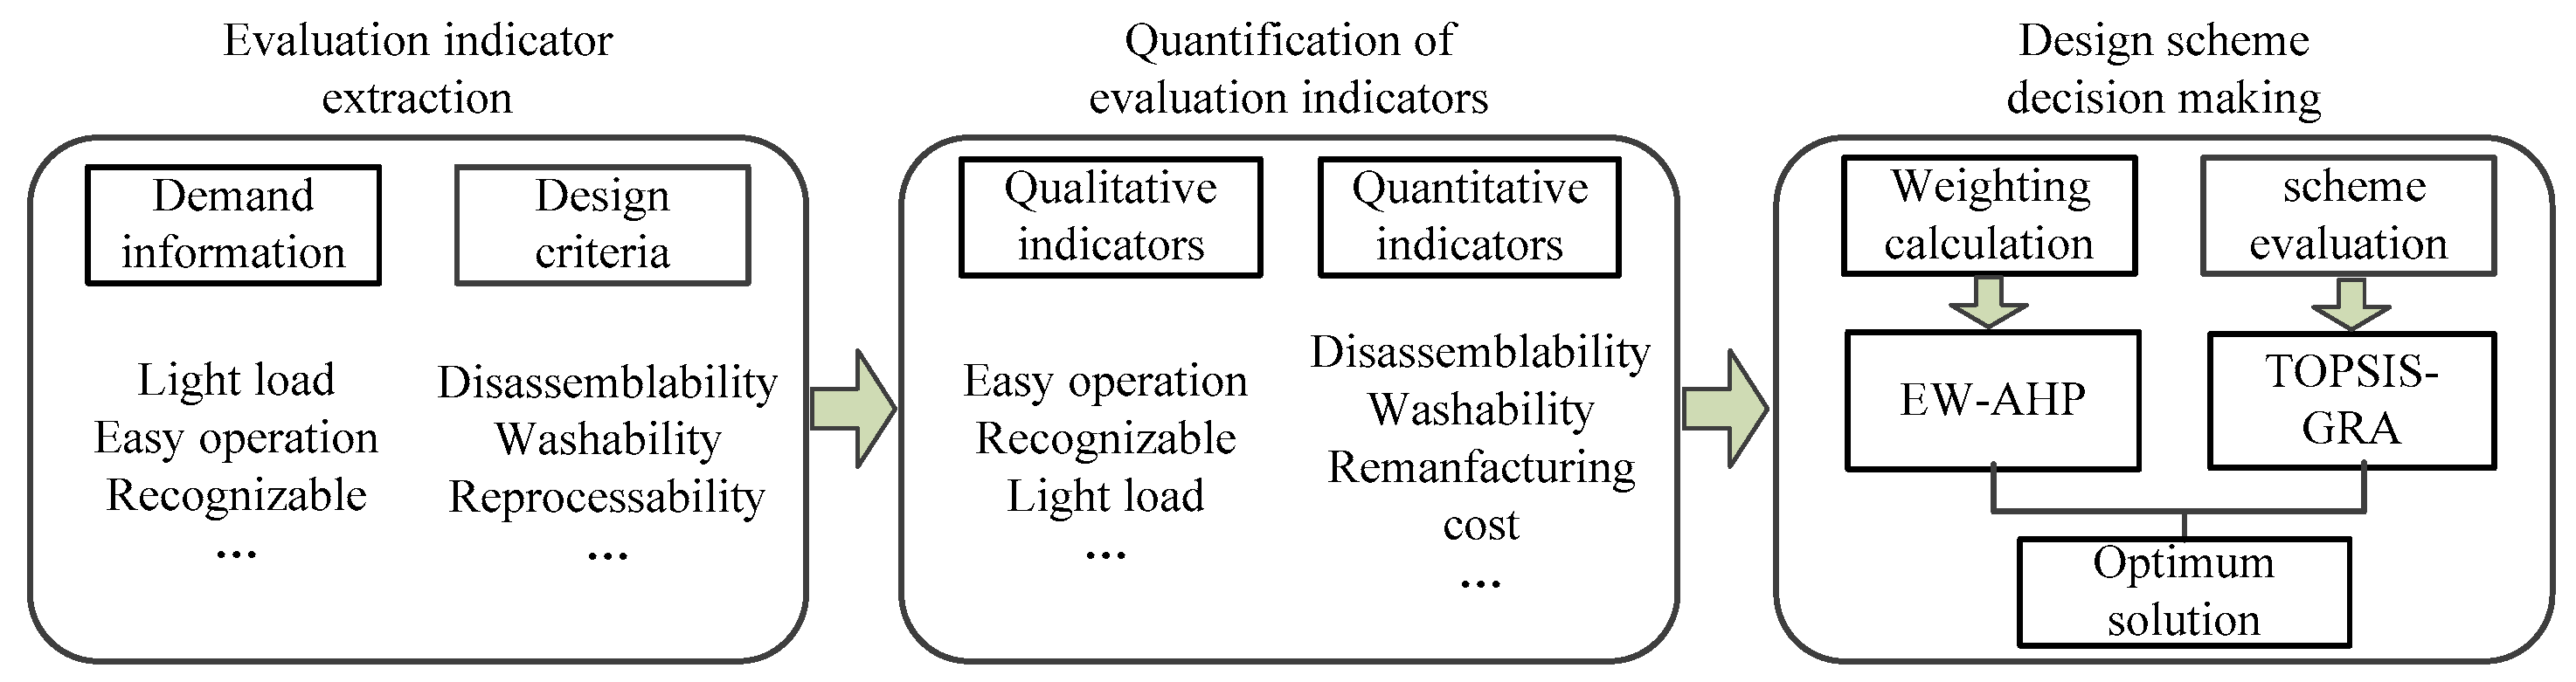
The decision-making framework for remanufacturing design contains three parts: (1) Evaluation indicator extraction: This initial stage focuses on identifying and defining the critical factors that will guide the design process, which involves demand information and design criteria. (2) Quantification of evaluation indicators: Once the evaluation indicators are identified, they are categorized into qualitative and quantitative measures to facilitate a structured analysis, which involves qualitative indicators and quantitative indicators. (3) Design scheme decision making: First, EW-AHP is used to determine the relative importance of each evaluation indicator; then, TOPSIS combined with GRA is employed to evaluate and rank the different design schemes. TOPSIS measures the similarity of each scheme to the ideal solution, while GRA assesses the relational grade between the schemes and the reference sequence, providing a comprehensive evaluation of the alternatives. Finally, the results from the weighting calculation and scheme evaluation are integrated to identify the optimal design solution that best meets the established evaluation criteria.
This framework provides a robust and systematic approach to remanufacturing design decision making, ensuring that both user demands and technical criteria are considered. By quantifying and evaluating design indicators through a combination of analytical methods, the framework helps in selecting the most suitable design scheme that balances user satisfaction, technical feasibility, and sustainability. The specific process is shown in
Figure 1.
2.1. Extraction of Evaluation Indicators
Design evaluation indicators mainly consider design requirements, design constraints, and design criteria. Design requirements include the customer’s ergonomic demands, such as color recognition, ease of operation, and low-load operation, as well as the manufacturer’s demands, such as cost and carbon emission; design constraints include site constraints, tool constraints, and technical constraints; and design guidelines include ease of dismantling, reprocessing, and cleaning, etc. Designers need to collect evaluation information through questionnaires, customer visits, and reviewing manuals and extract key design evaluation indicators. Different information is expressed and quantified in different ways, so it needs to be converted into a unified description method by using the material unit method in order to extract evaluation indicators, which is shown in Equation (1). The core idea of the matter-element method is to describe the characteristics and values of things by constructing object models and to use the extensibility of objects (i.e., the ability of things to expand and change) to solve incompatibility problems.
In the formula, represents the r-th objective (e.g., product, component); represents the i-th feature; represents the corresponding quantitative value of the r-th object; and represents the design requirement of the i-th feature of the r-th objective.
2.2. Quantification of Evaluation Indicators
Design scheme evaluation indicator quantification is the premise of design scheme decision making, and the indicator quantification method is generally divided into qualitative and quantitative descriptions. Qualitative descriptions are verbal descriptions made by experts, designers, or customers based on their own feelings and experiences, which is a subjective quantification method. Quantitative descriptions use specific numerical values to describe evaluation indicators, which are objective. Due to differences in the types of evaluation indicators, standardization is necessary to ensure accurate evaluation.
2.3. Design Scheme Decision
From the perspectives of customers’ perceptual demand, enterprise demand, as well as energy saving and emission reduction, the evaluation indicator system of product design solutions with ergonomics, technology, economy, and low carbon is constructed. Multi-attribute decision making of product design solutions is carried out by using assignment approximation of ideal solution ranking and gray correlation analysis (TOPSIS-GRA), and the preferential selection of remanufacturing design solutions can be realized by introducing GRA in the analysis of the TOPSIS method.
3. Evaluation Indicator System Construction of Remanufacturing Design Scheme
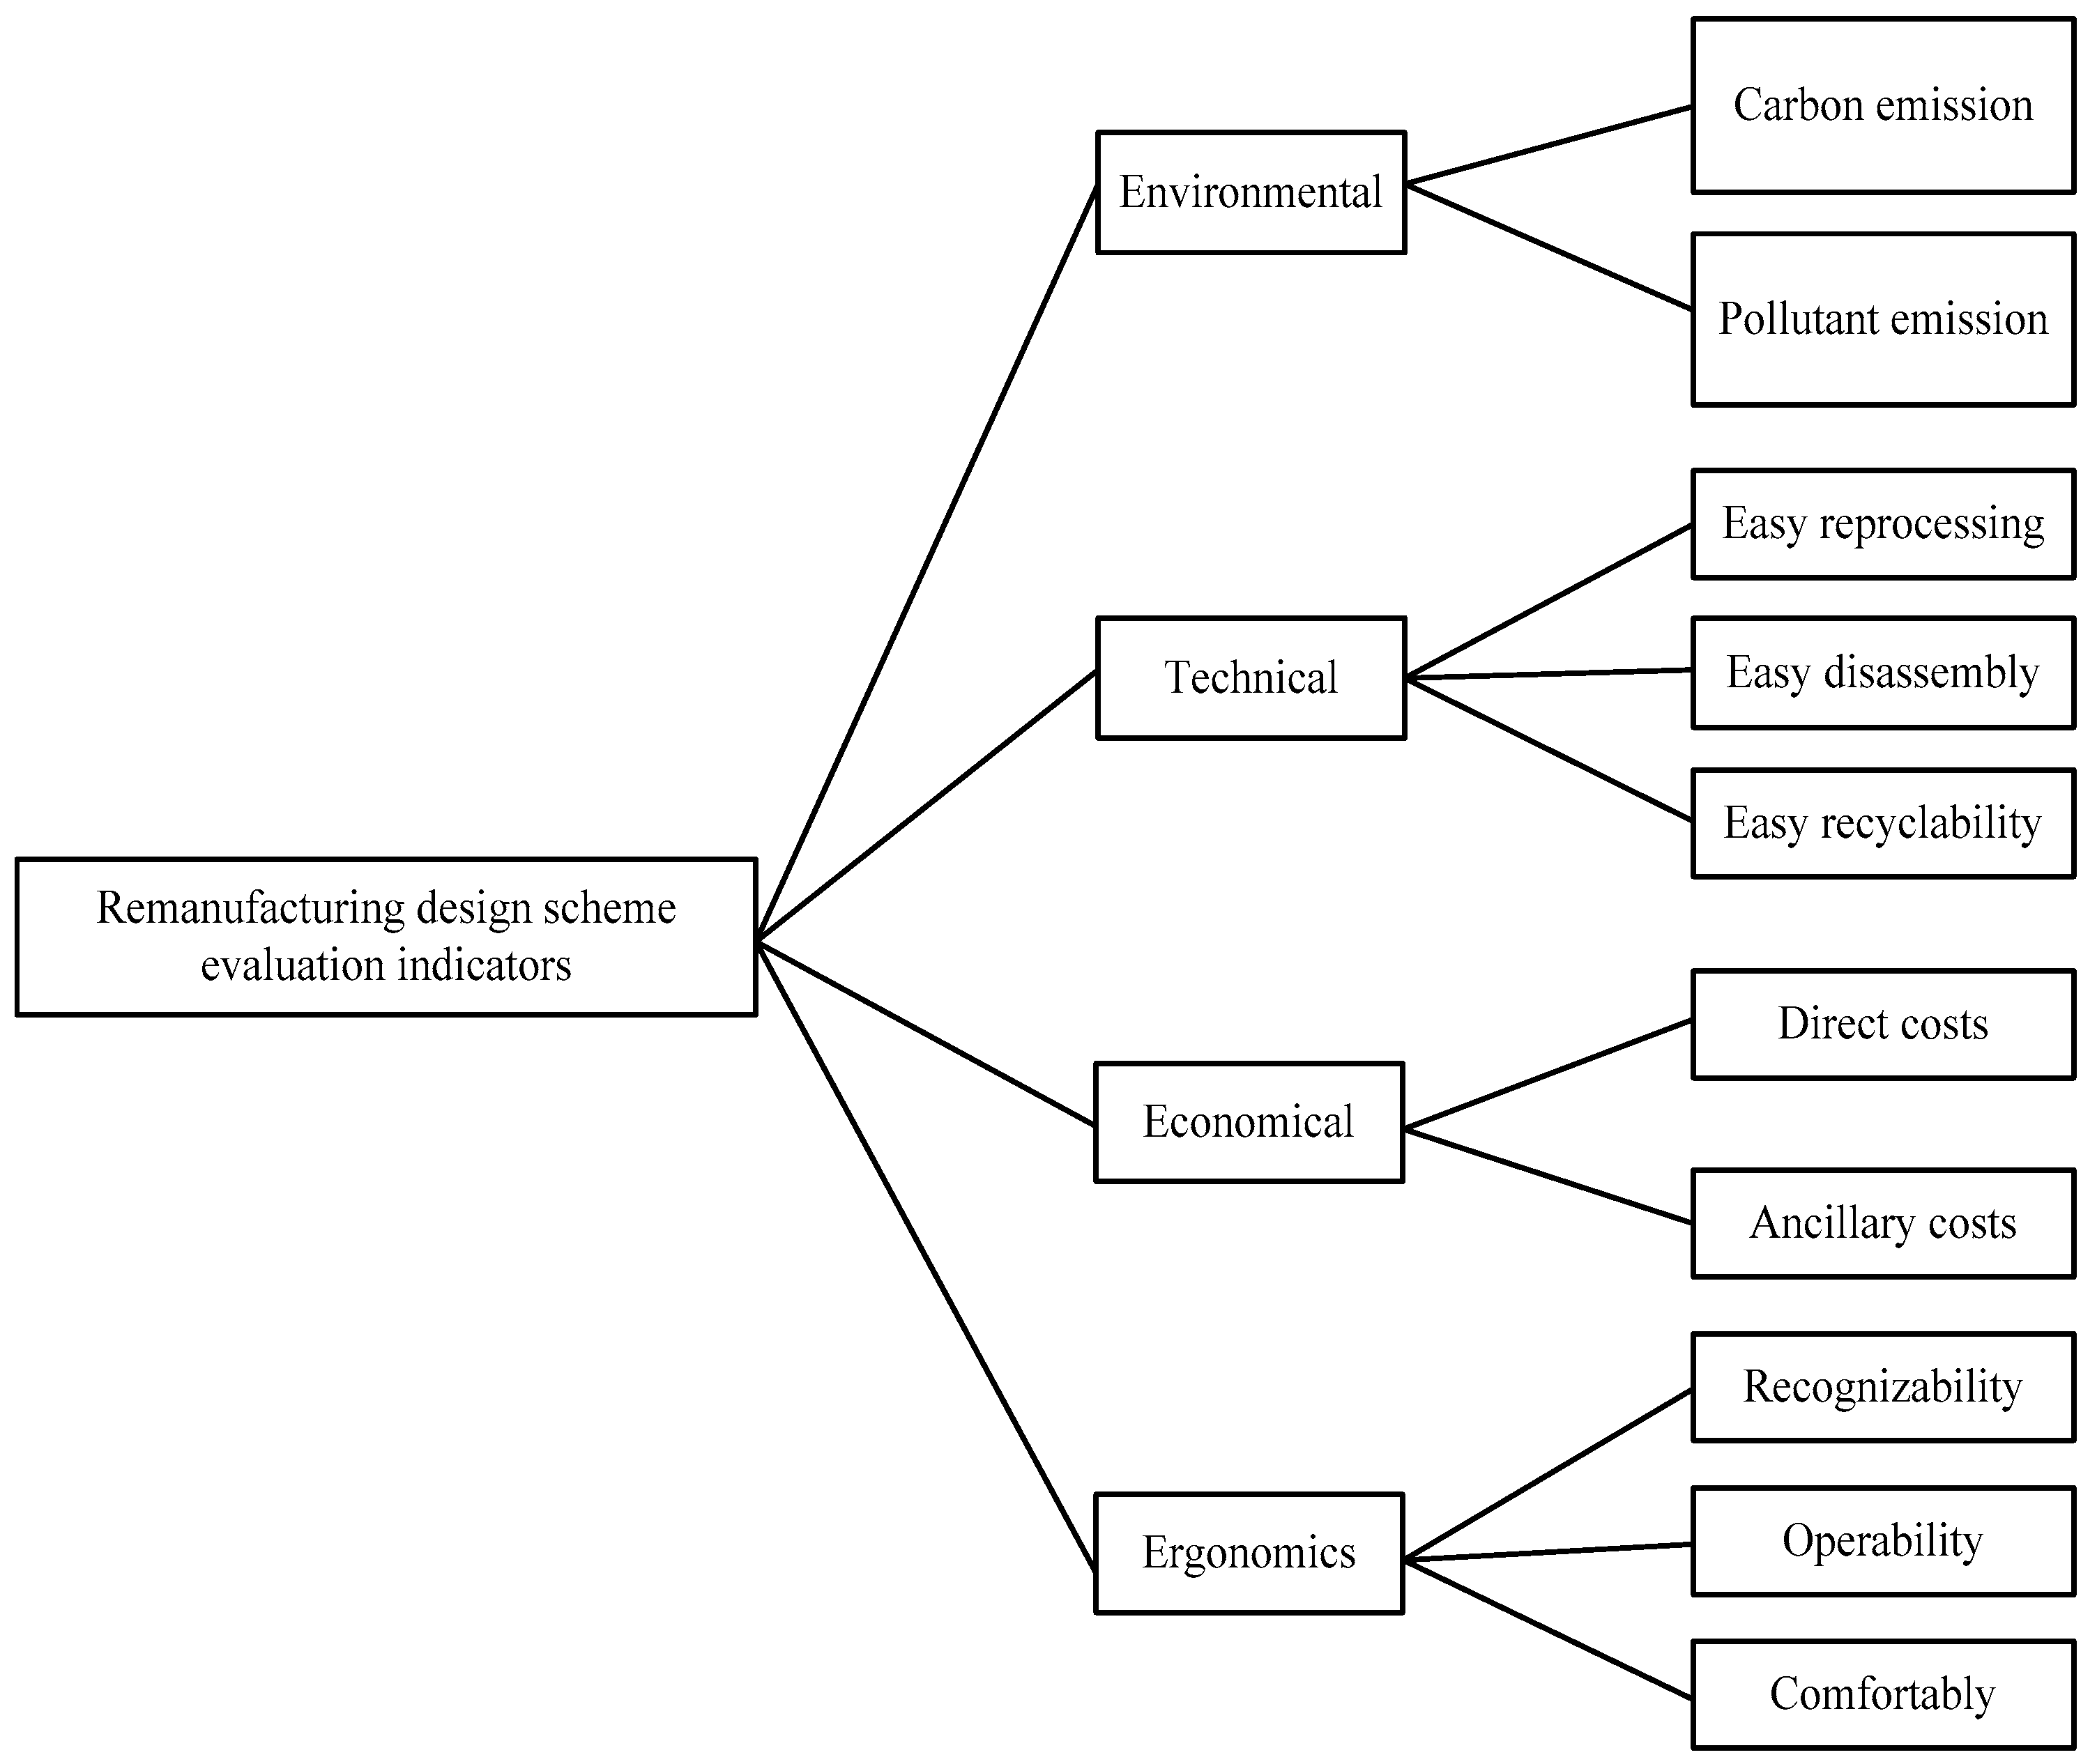
In order to more accurately classify design evaluation indicators, the remanufacturing design evaluation indicator system is divided into three levels. The secondary indicators mainly include economic, technical, ergonomic, and environmental aspects, while the tertiary indicators are further refinements of the secondary indicators. For example, the technological indicators contain easy recyclability, easy cleaning, and easy reprocessing, etc., The overall evaluation indicator system is shown in
Figure 2.
According to the different categories of indicators, the quantification of indicators requires a combination of qualitative and quantitative methods and normalization according to the corresponding formula. Quantitative indicators are generally calculated to determine the value of the indicator, and normalized, qualitative indicators are fuzzy evaluation of design schemes, such as ergonomic indicators, generally quantified by perceptual engineering scoring; for example, the comfort of the product can be described as ‘very comfortable’, ‘comfortable’, ‘general’, ‘uncomfortable’, ‘very uncomfortable’, etc., and the corresponding indicator scores are 0.2, 0.4, 0.6, 0.8, and 1.0. The quantification of remanufacturability is analyzed based on historical product remanufacturing process data. For example, for the historical cleaning and reprocessing data of used parts to determine the reprocessability of new product parts, the specific quantification process is shown below.
3.1. Ergonomic Indicator
Some of the ergonomic indicators can be quantified; others can only be measured by a perceptual description of the level of the indicator. Therefore, a combination of quantitative and qualitative methods is needed to quantify the indicators.
3.1.1. Easy Recognizability
This mainly refers to the difficulty of a product’s logo, color, and interface graphics accurately understood by the user. Customers judge the recognizability of a product based on their own psychological feelings, which can be quantified using the five-point Likert scale method, which was developed by American social psychologist Richard Likert in 1932 based on the original total sum scale [
36,
37]. The scale consists of a set of statements, each with five response options: “strongly agree,” “agree,” “not sure,” “disagree,” and “strongly disagree”, scored as 1.0, 0.8, 0.6, 0.4, and 0.2, respectively. The total score for each respondent indicates the strength of their attitude or their different states on this scale. The specific quantification method is shown in
Table 1.
The five-point Likert scale was used to perceptually describe the recognizability of the product and to score the degree of recognizability. The degree of recognizability was divided into five levels: {difficult to recognize, very difficult to recognize, average, good to recognize, very good to recognize}, with corresponding scores of {0.2, 0.4, 0.6, 0.8, 1.0}.
3.1.2. Operability
This mainly refers to how difficult it is for the user to operate the product. The operability of the product is mainly influenced by factors such as structure, functional modules, and display. The operability can be measured by the operation time, and the process is as follows:
where
R denotes the quantitative value of the product operation indicator,
denotes the operation time of the
i-th module of the product,
denotes the number of the
i-th module, and
denotes the standard time of the operation of similar products. The time unit is minutes.
3.1.3. Comfortability
This generally refers to the user’s comfort level with the product’s appearance, materials, and color. Comfortability is a psychological sensation generated by multimodal information from human touch, sight, and hearing, which can be quantified using the five-point Likert scale method. The specific quantification method is shown in
Table 2.
The five-point Likert scale was used to perceptually describe the comfortability of the product and to score the degree of comfort. The degree of comfort was divided into five levels: {very uncomfortable, uncomfortable, average, comfortable, very comfortable}, with corresponding scores of {0.2, 0.4, 0.6, 0.8, 1.0}.
3.2. Technical Indicator
3.2.1. Easy Recycling
This focuses on the difficulty of recycling used products through reverse logistics to remanufacturers. Recyclability mainly considers factors such as the ease of packaging, transportation, and encapsulation of hazardous materials. Recyclability can be measured by recycling time, which is mainly related to the structure, material, and modularity of the product, and it is quantified as follows:
C indicates the quantitative value of the recovery indicator, represents the psychological expected recovery time of the manufacturer, represents the average time required for product packaging, represents the packaging time coefficient of different product structures, mainly related to the precision and complexity of the product, represents the average time required for transportation, represents the transportation time coefficient of different products, mainly related to the type of product structure and the degree of modularity, and the values of and are in the range of (0,1]. The time unit is minutes.
3.2.2. Easy Disassembly
Disassembly is the first step in the product remanufacturing process. The ease of disassembly is mainly determined by the precision of the assembly and the type of connection, and it is important to minimize the damage to the parts during the disassembly process. The ease of disassembly can be quantified in terms of disassembly time. The specific process is as follows:
where
R denotes the quantitative value of the product disassembly index,
denotes the disassembly time of the
i-th connection type,
denotes the number of the
i-th connection type, and
denotes the standard time for general product disassembly. The time unit is minutes.
3.2.3. Easy Reprocessing
Reprocessing is a key step in restoring or upgrading used parts and is primarily determined by the degree of failure of the parts. The higher the degree of failure, the more difficult the reprocessing process becomes and generally the longer the reprocessing time required. The reprocessing difficulty can be expressed in terms of reprocessing, and the specific calculation method is as follows:
Herein, denotes the normal reprocessing time of the component, denotes the normalized value of the easy reprocessing indicator, denotes the longest reprocessing time, and denotes the shortest reprocessing time; the time unit is minutes.
3.3. Economic Indicator
Economy is primarily demonstrated by the remanufacturing cost, which consists mainly of direct and ancillary costs. Direct costs are the costs incurred in the remanufacturing process, such as the consumption of materials and energy, and auxiliary costs are the taxes, management fees, and other costs incurred to ensure the smooth operation of remanufacturing, which are calculated below.
3.3.1. Direct Cost
Direct costs are a series of costs consumed in the processing of used products, including costs incurred for cleaning, disassembly, and the purchase of spare parts. The calculation process is as follows:
represents the direct costs of the remanufacturing process. represents all costs incurred in the remanufacturing process, including cleaning, disassembly, and reprocessing; represents costs incurred in the purchase of new parts; and represents the cost of material consumption in the reprocessing process. represents the quantitative value of the indicator for direct costs, represents the minimum value of direct costs, and represents the maximum value of direct costs. Cost units are expressed in USD.
3.3.2. Ancillary Costs
Ancillary costs are additional costs incurred in the remanufacturing process, including taxes, publicity, and overhead. The calculation process is as follows:
represents the Ancillary costs of the remanufacturing process. represents taxes on remanufactured products; represents operating and administrative expenses on remanufactured products; represents advertising and promotional expenses on remanufactured products; and represents other expenses on remanufactured products. represents the quantitative value of the indicator for ancillary costs, represents the minimum value of ancillary costs, and represents the maximum value of ancillary costs. Cost units are expressed in USD.
3.4. Environmental Indicator
The environmental indicators mainly contain carbon and pollutant emissions from the remanufacturing process, which are described below.
3.4.1. Carbon Emission
Carbon emissions are mainly generated by the consumption of materials and energy in the remanufacturing process; for example, the reprocessing process consumes metal as well as electricity, which will generate carbon emissions, while the carbon emissions from the remanufacturing process are calculated as follows:
where
represents the total carbon emissions from the remanufacturing process, and
represents the normalized results of carbon emission indicators.
represents the carbon emissions from the recycling process,
represents the carbon emissions from the disassembly process,
represents the carbon emissions from the reprocessing process, and
represents the carbon emissions from the reassembly process.
represents the minimum carbon emissions from the previous remanufacturing process, and
represents the maximum carbon emissions from the previous remanufacturing process. Carbon emission units are expressed in kgCO2.
3.4.2. Pollutant Emission
Remanufacturing design includes design elements such as product structure, material properties, and form, which directly determine the amount of material, energy, and water consumed in the remanufacturing process, and partly generates pollutants through processing and material extraction. The main pollutants of the remanufacturing process are noise, dust, and waste, etc. Environmental indicators such as pollutant emissions are scored according to historical remanufacturing process data and environmental protection experts, and the environmental indicators are evaluated as {high, high, average, low, very low}, with the corresponding scores as .
4. Decision-Making Methods for Remanufacturing Design Schemes
In order to make more objective and reasonable decisions on design solutions, a multi-attribute decision-making method for product remanufacturing design schemes based on combined assignment-TOPSIS-GRA is proposed for the complex attribute characteristics of product remanufacturing design. Firstly, standardized processing and thresholding methods are used to realize the quantization of qualitative indicators, and then the subjective and objective combinations of evaluation indicators are assigned by the nonlinear multiplication. Finally, the gray correlation degree is introduced into the TOPSIS method for comprehensive analysis, and the preference of remanufacturing design scheme is accomplished through the multi-dimensional portrayal of the degree of design scheme advantages and disadvantages. The specific decision-making process is detailed below.
4.1. Subjective and Objective Weighting of Evaluation Indicators
Setting the number of evaluation indicators as
m and the number of design schemes to be evaluated as
n, in the judgment matrix
,
represents the quantified value of subjective judgment in the matrix, which is obtained by using the 1–9 scale method. In the decision matrix
,
represents the membership values of each indicator. Based on the judgment matrix
, the subjective weights of the evaluation indicators can be expressed as follows:
Further normalization is performed to obtain the eigenvalues,
Then, the maximum characteristic root is computed,
CR denotes the consistency ratio indicator of importance of remanufacturing design demand, which can be expressed as follows:
where
RI is the random consistency indicator, and the value is related to the number of evaluation indicators, which can be obtained by checking the table. When
CR ≤ 0.1, it can be regarded that the current demand importance satisfies the consistency test.
Objective weights can be assigned to benefit and cost indicators, and a normalized decision matrix can be obtained by de-weighting .
Benefit-based indicators are calculated as follows:
Cost-based indicators are calculated as follows:
This is the entropy value calculation of the remanufacturing design evaluation indicator. Combined with the basic definition of entropy weight, the entropy value of the
j-th indicator in the evaluation system can be expressed as follows:
where
k is the reciprocal of the number of evaluation indicators,
.
The objective weights of the indicators at the factor level of the evaluation system can be expressed as follows:
4.2. Nonlinear Combination Weighting of Evaluation Indicators
The nonlinear combination weighting method is a technique used in multi-criteria comprehensive evaluation to integrate subjective and objective weights by employing nonlinear mathematical methods (such as multiplicative synthesis, geometric mean, power functions, etc.) for comprehensive weighting. It overcomes the limitations of traditional linear weighting methods (such as weighted arithmetic mean) and is more suitable for complex scenarios where there are interaction effects, weight compensation relationships, or non-independence among indicators. The subjective weight calculated by the AHP is denoted as
, and the objective weight calculated by the EW is denoted as
. The weight of the
j-th indicator combination based on the nonlinear multiplicative addition can be denoted as follows:
where
denotes the weight of the
j-th indicator.
4.3. Design Scheme Decision Making
In order to make decisions on remanufacturing design schemes more scientifically and accurately, gray correlation is introduced into the design scheme analysis of the TOPSIS method to rank the comprehensive convergence index of the design schemes, and the basic process is described as follows:
(1) Data preprocessing: The decision matrix is normalized using the polar deviation method to obtain the normalized decision matrix , and the weight vector of each indicator attribute is set to be , which can be obtained as the weighted normalized decision matrix , where .
(2) Calculation of ideal solution and Euclidean distance: Let the positive ideal solution
, i.e., the best design scheme among all the current schemes, with the attribute value of the
j-th metric as
, and the negative ideal solution
, i.e., the worst design scheme among all the current schemes, with the attribute value of the
j-th metric as
, be mathematically expressed as follows:
The Euclidean distance is the standard method for measuring the “straight-line distance” between two points in Euclidean space. The Euclidean distances
,
of positive and negative ideal solutions can be expressed as follows:
Calculate the degree of closeness for each alternative, which is a measure of how close each alternative is to the ideal optimal solution. It can be calculated as follows:
where
Di represents the degree of closeness between each scheme and the optimal scheme, the closer the value of
Di is to 1, the closer the alternative is to the optimal solution.
(3) Calculation of gray correlation degree of design scheme: Based on the normalized decision matrix and the ideal solution, the gray correlation coefficient is calculated between the
i-th alternative and the positive ideal solution (or the negative ideal solution) with respect to the
j-th indicator, which can be expressed as follows:
where
represents the positive correlation coefficient,
represents the negative correlation coefficient, and
ρ is the resolution factor, which is usually taken as 0.5.
The process of calculating the gray correlation relative to the positive and negative ideal design options is shown below.
The gray correlation closeness of the design solutions to be evaluated is calculated as
Ri.
where a larger value of
Ri indicates that the scheme is more desirable and converges to the optimal solution.
(4) Calculation of the comprehensive convergence index: The comprehensive convergence index is used to quantify the degree to which a solution set (or solution scheme set) approximates the theoretically optimal solution. The higher the index value, the closer the solution set is to the ideal optimal solution.
When the degree of similarity or Euclidean distance between alternative design schemes and ideal design schemes is equal, the indicators of the design schemes may have large differences, and a single method may be difficult to support the decision of the design schemes. And the use of Euclidean distance and gray correlation to portray the design scheme from the two dimensions of spatial location and shape difference, respectively, can effectively improve the reliability of decision making.
The Euclidean distance as well as the gray correlation are normalized infinitely as follows:
where
.
The ideal solution of Euclidean distance, relative closeness, and gray correlation relative closeness are jointly expressed. The preference coefficients θ are introduced to construct the positive and negative ideal solution convergence indexes
,
, which are expressed as follows:
where
θ1 and
θ2 are used to characterize the decision maker or designer, and
θ1 +
θ2 = 1. To construct the composite convergence index
Ti, the formula is expressed as follows:
Ti denotes the degree of convergence between design alternative i and the ideal solution, which integrally considers the degree of similarity between the alternative design and the ideal design in terms of spatial location and shape changes. The larger the value of Ti, the closer the solution is to the positive ideal solution, the better the solution is; on the contrary, the closer the solution is to the negative ideal solution, the worse the solution is.
5. Case Study
5.1. Design Scheme Analysis
An example of a coffee machine is used to verify the feasibility of the proposed method; the external structure of the coffee machine is shown in
Figure 3. Reliability and ergonomics are directly determined by the structure, material, and dimensional accuracy of the coffee machine. The design scheme of the coffee machine is developed to realize mass production based on customer and manufacturer requirements. The company expects the coffee machine to have high performance and to improve its human–machine interaction as much as possible. Meanwhile, coffee machines have a large market share, and it is hoped that they will have good remanufacturability to increase their reuse value. Based on the initial design of the designers, three feasible solutions are proposed with the following information in
Table 3.
Design scheme A: The water tank and heating cup of the coffee machine are on the left side, showing the upper and lower split connection structure; the water storage cup adopts inverted triangle structure, choosing transparent SAN material, and the heating layer adopts cylindrical structure, choosing silver-white PP material; the control buttons are set at the bottom of the coffee machine, adopting round buttons. The thermal cup is made of SUS304 metal, sprayed with silver-white paint, and the filter basket is made of black PP, with a snap-on connection.
Design scheme B: The water tank and heating cup of the coffee maker are on the left side, which are in the structure of upper and lower split connection; the water storage cup is made of a trapezoidal structure, and transparent SAN material is selected; the heating layer is made of a trapezoidal structure and black PP material is selected; the control part is set at the bottom of the coffee maker, and it adopts the knob method. The thermal cup is made of SUS304 metal, sprayed with black paint, the filter basket is made of black PP, and the connection method is snap type.
Design scheme C: The water tank and heating cup of the coffee maker are on the left side, in a left-right split connection structure; the water storage cup adopts a rectangular structure, choosing transparent SAN material, and the heating layer adopts a rectangular structure, choosing silver-white PP material; the control buttons are set at the bottom of the coffee maker, adopting a square button. The thermal cup is made of SUS304 metal, sprayed with silver-white paint, the filter basket is made of black PP, and the connection is snap type.
5.2. Decision Making on Design Schemes
Based on the design scheme information, historical remanufacturing data, and professional designer evaluation, the design scheme evaluation indicators were quantified, and the results are shown in
Table 4.
Then, based on the definition of the AHP, MATLAB software 2022 was used to calculate the subjective weight of each evaluation indicator, and the results are shown in
Table 5.
And , , . Since CR < 0.1, the judgment matrix passes the consistency test.
Finally, the subjective weight .
Meanwhile, based on the definition of the EW method, MATLAB software 2022 was used to calculate the objective weight of each evaluation indicator, and the results are shown in
Table 6.
And the objective weight .
Finally, according to Equation (20), the subjective and objective weights are nonlinearly weighted and calculated as follows:
Based on the weight values and the normalized standard values of the design solution evaluation indicators, the TOPSIS method was applied to calculate the ideal solution and the Euclidean distance.
First, a weighted standardized decision matrix is constructed, which is shown as
Table 7.
Then, the positive and negative ideal solutions for each indicator are calculated according to Equations (21) and (22), and the results are shown below.
And the Euclidean distances
,
of positive and negative ideal solutions are calculated according to Equations (23) and (24), and the results are shown below.
The degree of closeness for each alternative is calculated according to Equation (25), and the results are shown below.
To further optimize or supplement the evaluation results, the correlation analysis method is used for scheme optimization decision making. First, the gray correlation degree of the design scheme is calculated, and the results are shown as follows:
Then, the comprehensive convergence index is calculated, which is mainly used to jointly express the relative closeness of the Euclidean distance to the ideal solution and the relative closeness of the gray correlation. The result is shown as follows:
Based on the calculation results, design scheme B is closest to the positive ideal solution and furthest away from the negative ideal solution, which is shown in
Figure 4. Design scheme B has the best performance in terms of easy reprocessing, comfort, and cost control and is recommended as the optimal design choice.
As can be seen in
Figure 4, the control mode of the coffee machine is the knob mode, so that the user’s fingers can operate in a natural state, which is more comfortable. In addition, the coffee machine can be directly lifted and filled when refilling water without taking out the tank, which makes the operation easier. The tank and the heating cup are a slide-type connection, which is easy to disassemble for later maintenance, and the filter basket is a slide-type connection, which is easy to assemble and replace. The main material of the coffee machine is made of PP, which is cost-effective and easy to process. However, the water reservoir cup has an inverted trapezoidal structure, which is not easy to be injection-molded, resulting in high production costs.
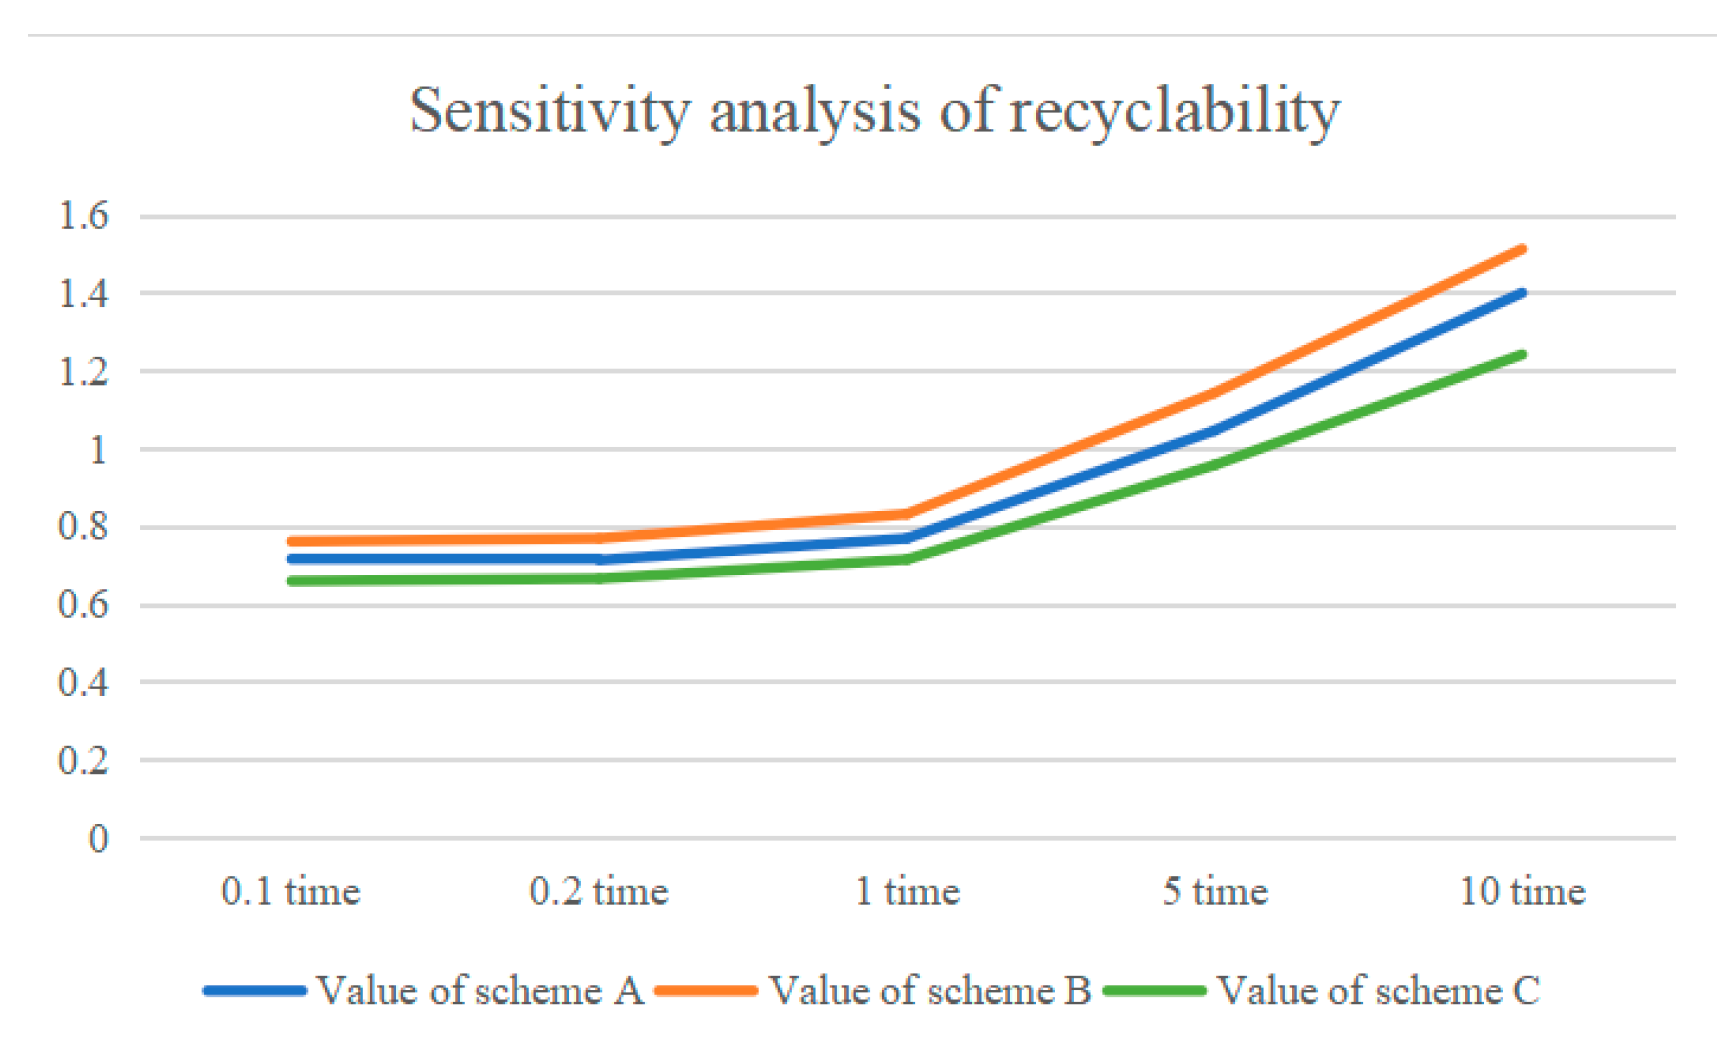
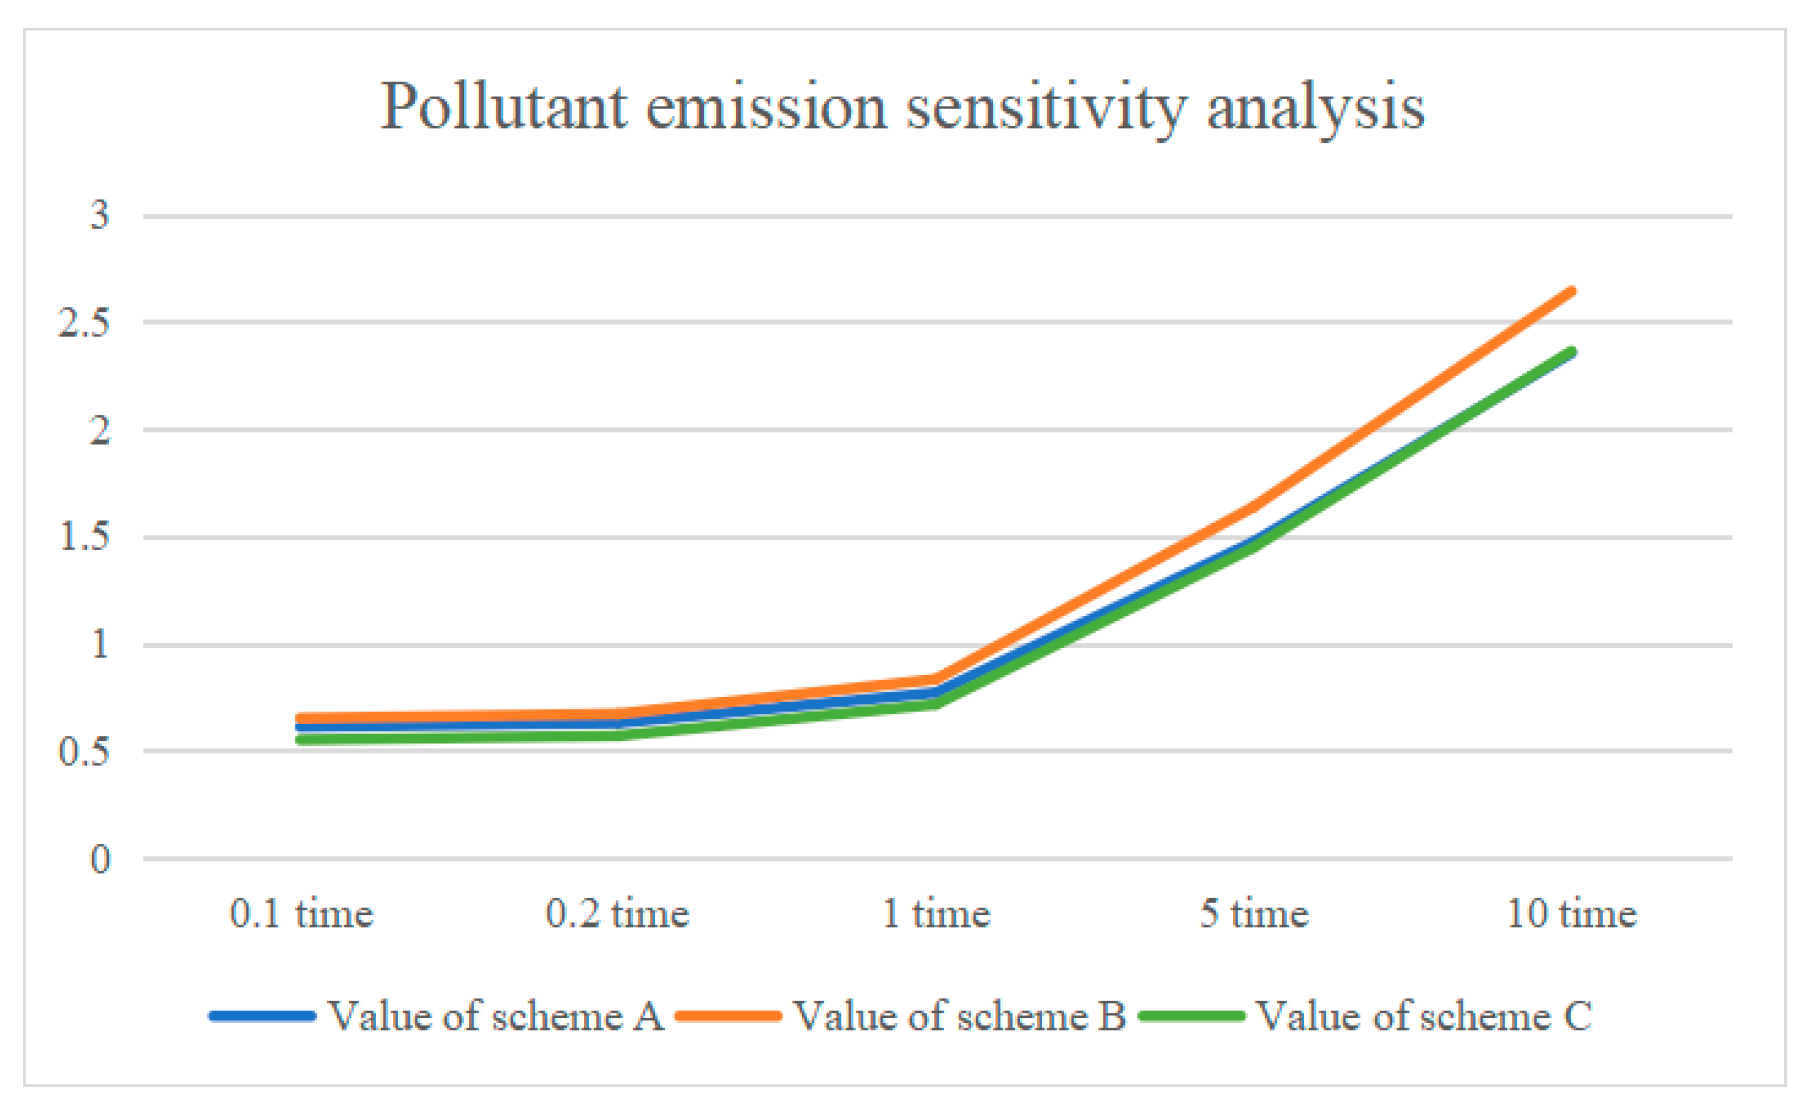
5.3. Sensitivity Analysis
To verify the reliability of the decision-making method, sensitivity analysis of the results of the overall assessment was performed by adjusting the relative weighting values of various assessment indicators. The extent of the variations in the relative weight of the indicators was set at 0.1 times, 0.2 times, the original value, 5 times, and 10 times the original value. The results of the experiment are presented below (
Figure 5,
Figure 6,
Figure 7,
Figure 8,
Figure 9,
Figure 10,
Figure 11,
Figure 12,
Figure 13 and
Figure 14).
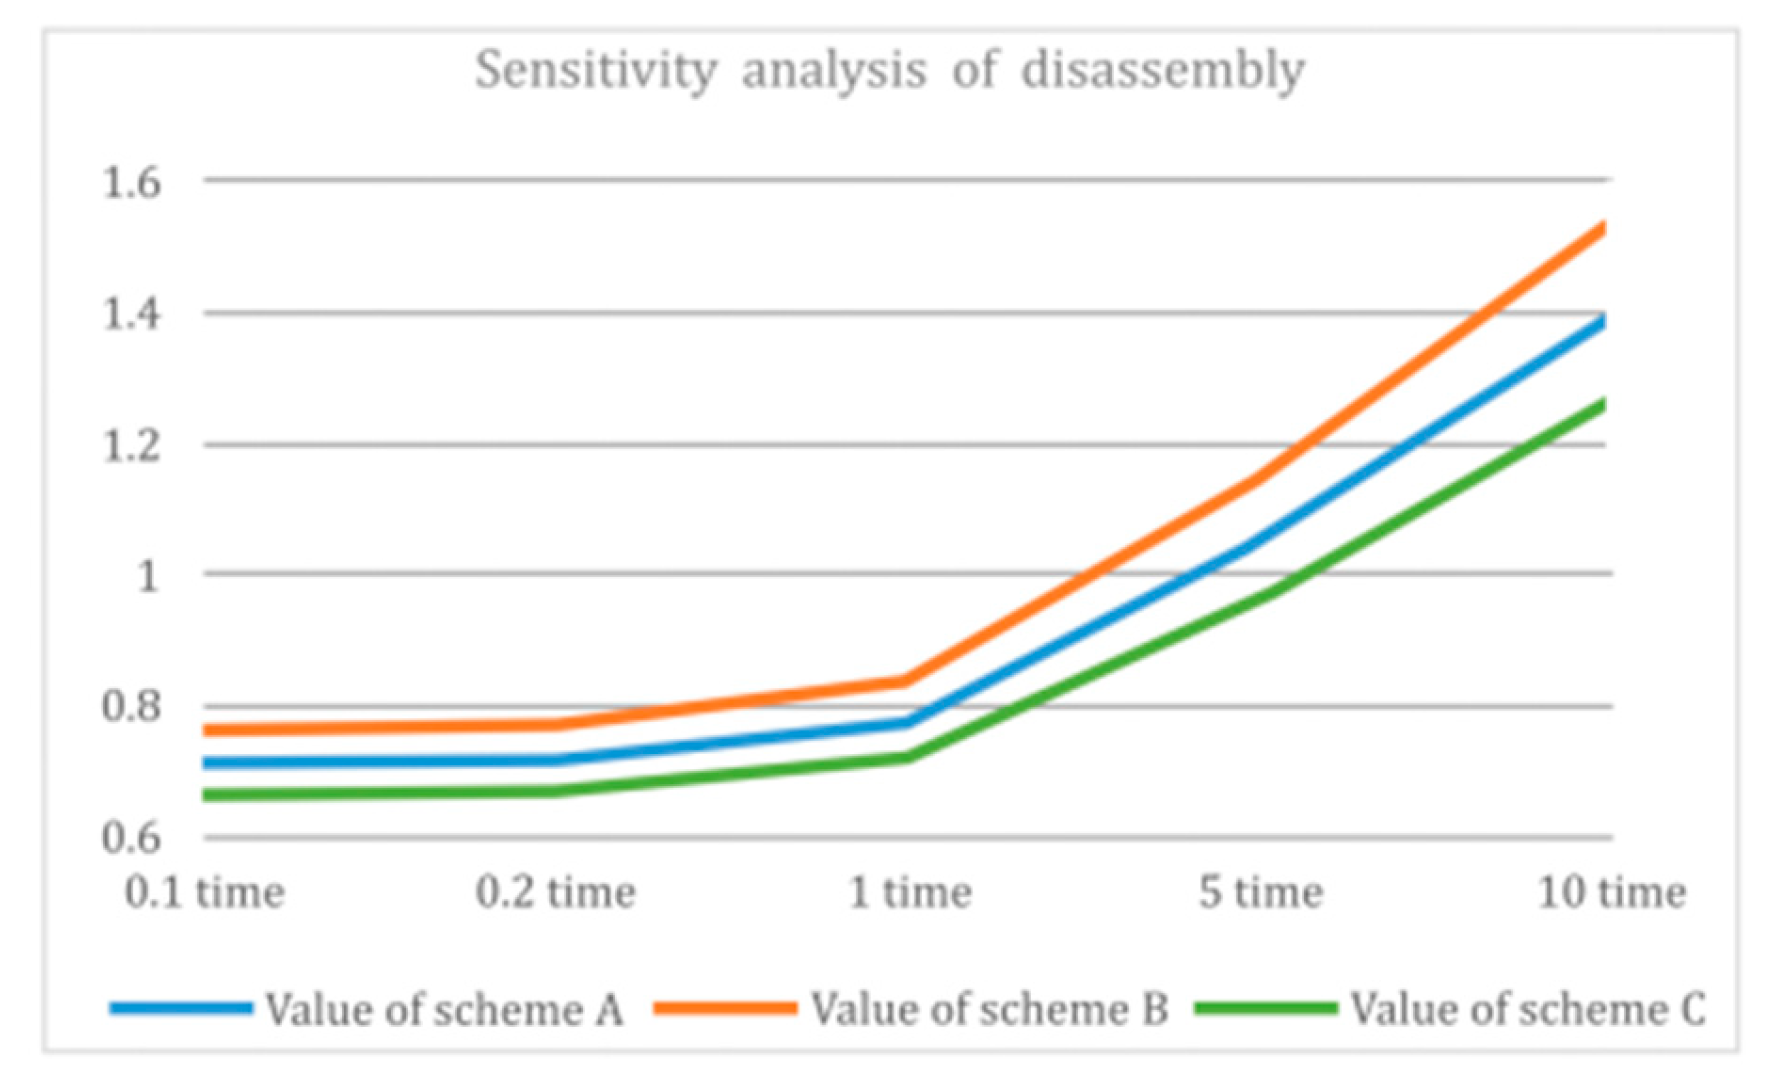
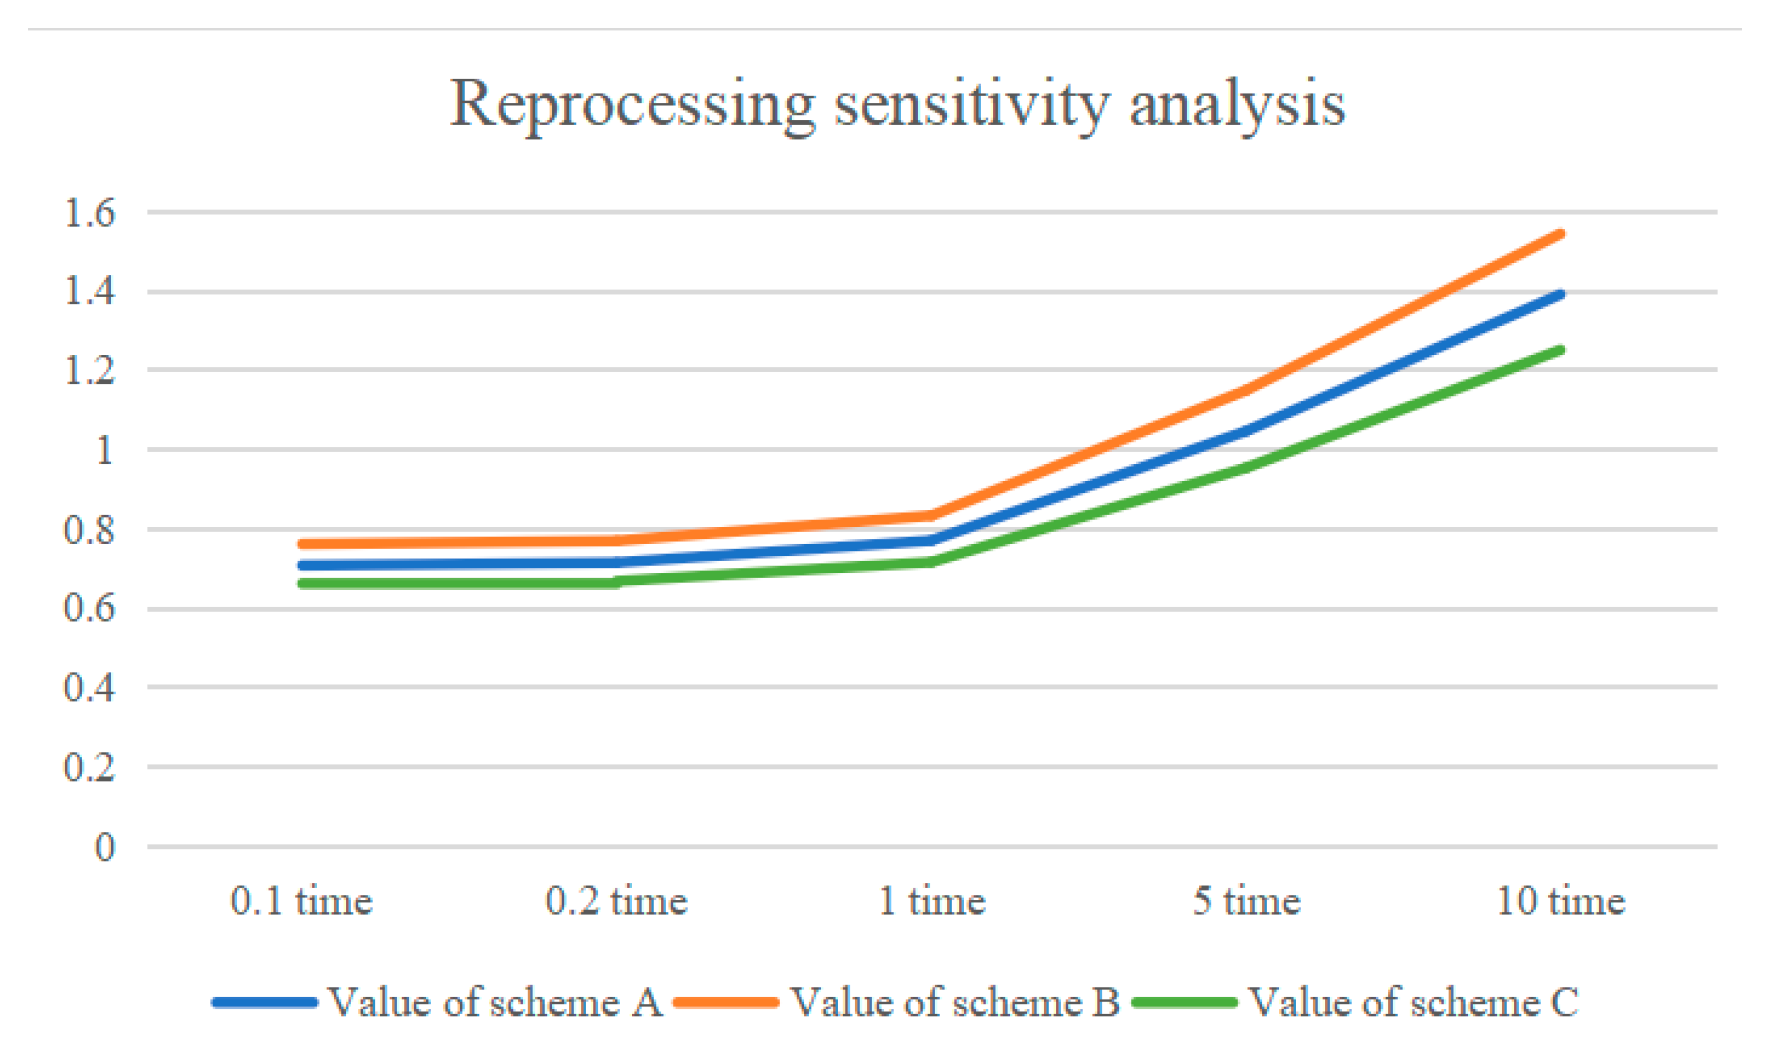
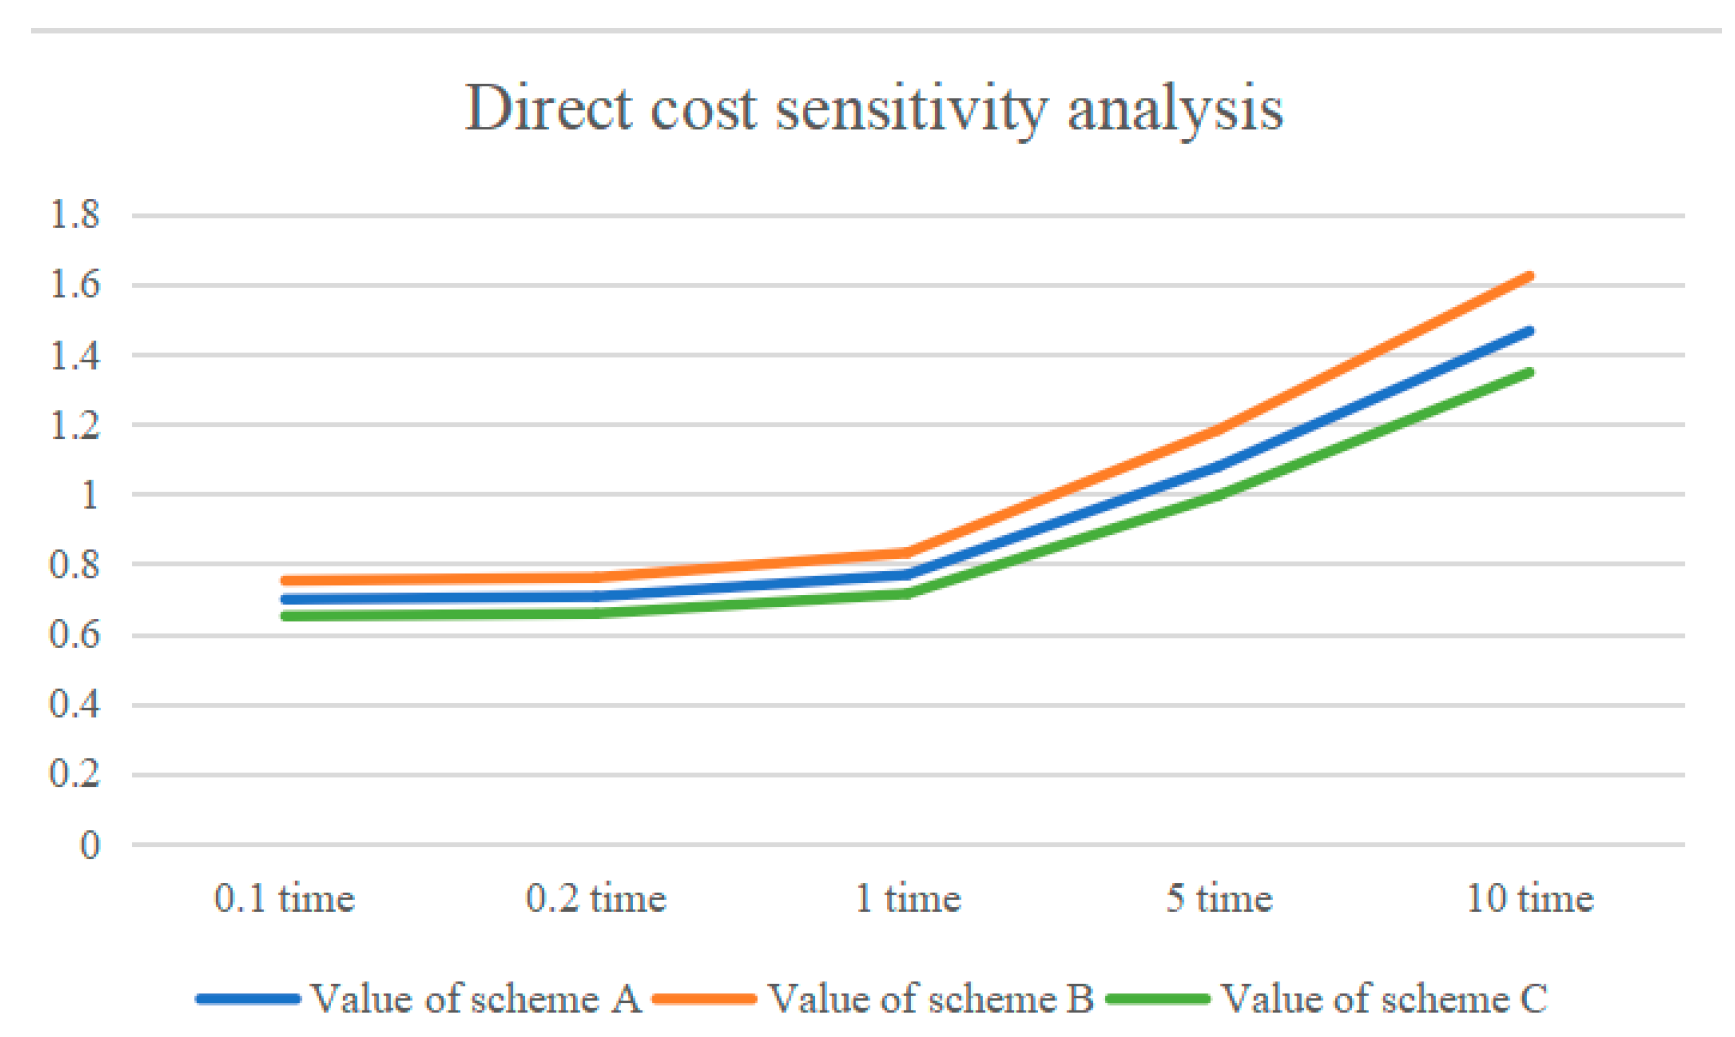
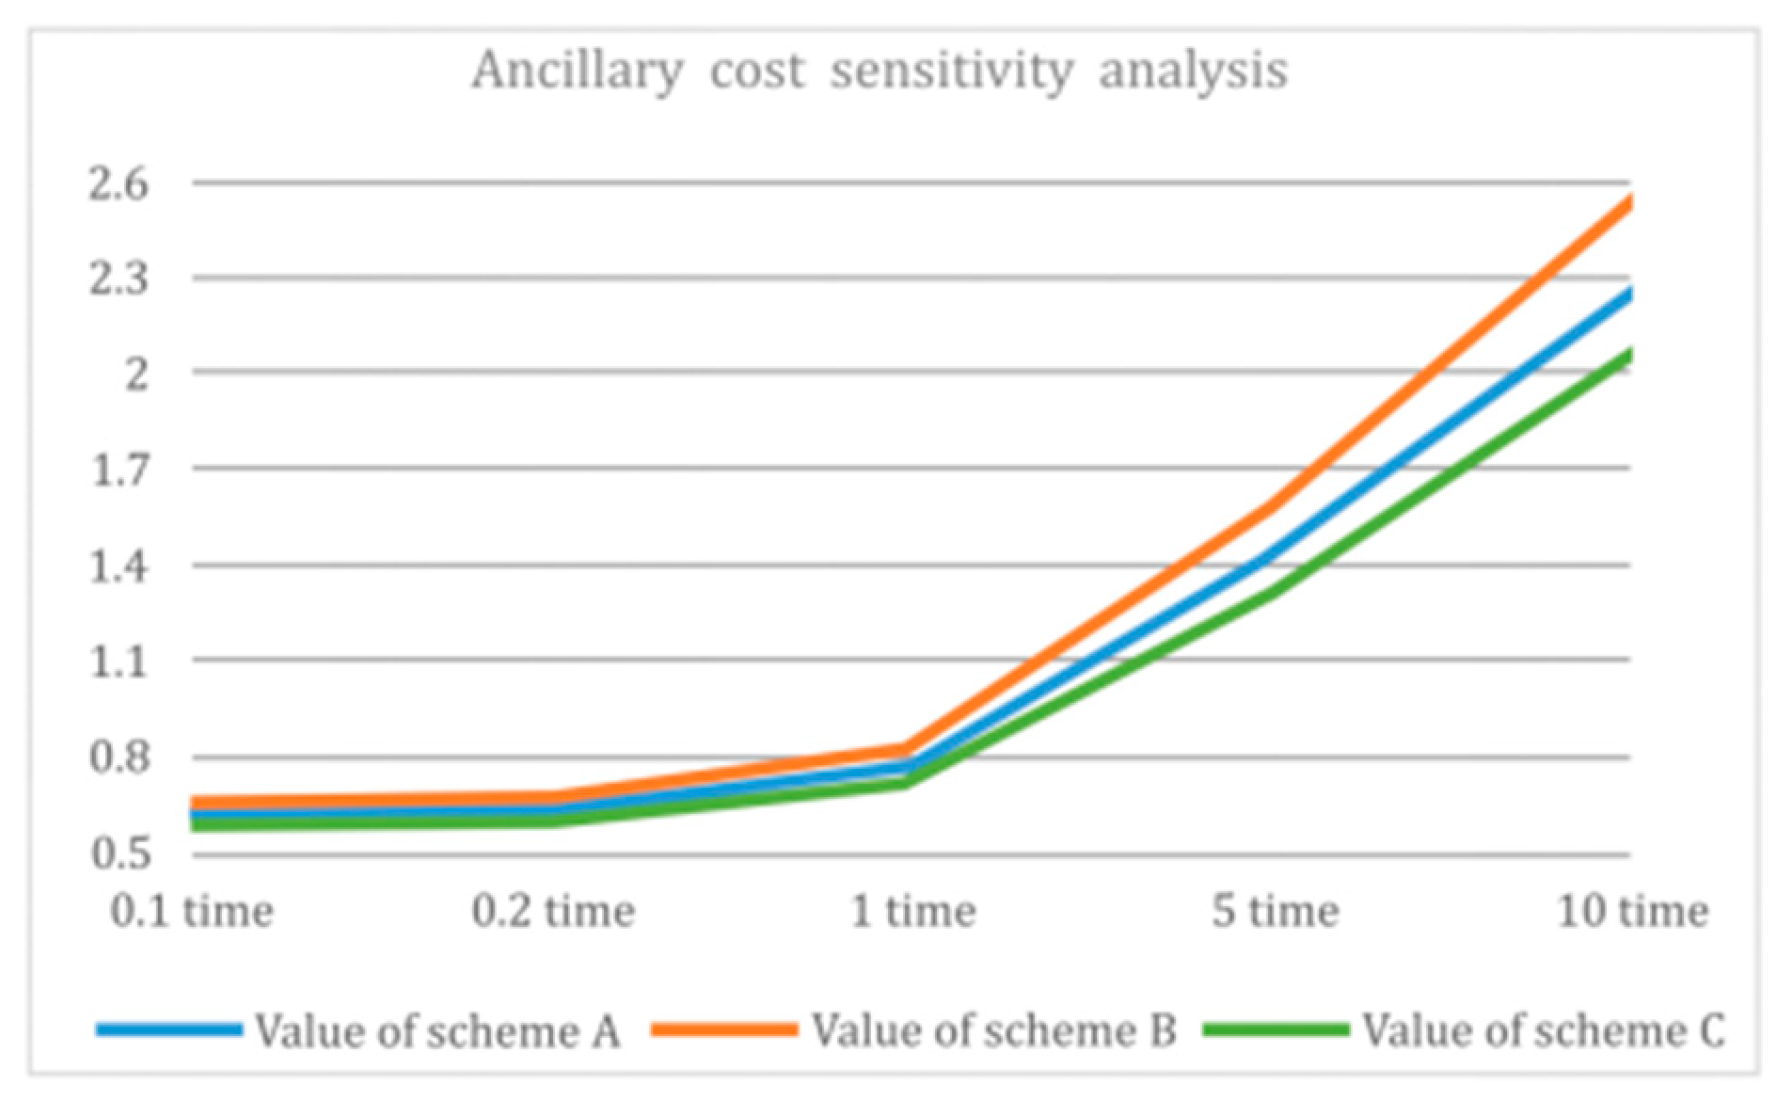
(1)
Figure 5,
Figure 8,
Figure 9,
Figure 11 and
Figure 12 show that, during the weighting of the indicators, including easy reprocessing, easy disassembly, recognizability, direct costs, and ancillary costs, the evaluation values for all three design alternatives increase, but design alternative B always receives the highest overall score, indicating that the evaluation model is stable.
(2) As shown in
Figure 6, the evaluation value of all three design solutions increases with the increase in the weight of the operability indicators. Scheme B is the design scheme that received the highest overall evaluation at 0.1, 0.2, and 5 times the original weight, but, at 10 times the original weight, the evaluation value of design scheme B is slightly lower than that of design scheme A, which ranks second and has better overall stability.
(3) As shown in
Figure 7, the evaluation value of all three design solutions increases with the increase in the weight of the comfortability indicators. Scheme B is the design scheme that received the highest overall evaluation at 0.1, 0.2, 5 times, 10 times and the original weight, which has better overall stability.
(4) As shown in
Figure 10, the evaluation value of all three design solutions increases with the increase in the weight of the recyclability indicators. Scheme B is the design scheme that received the highest overall evaluation at 0.1, 0.2, 5 times, 10 times and the original weight, which has better overall stability.
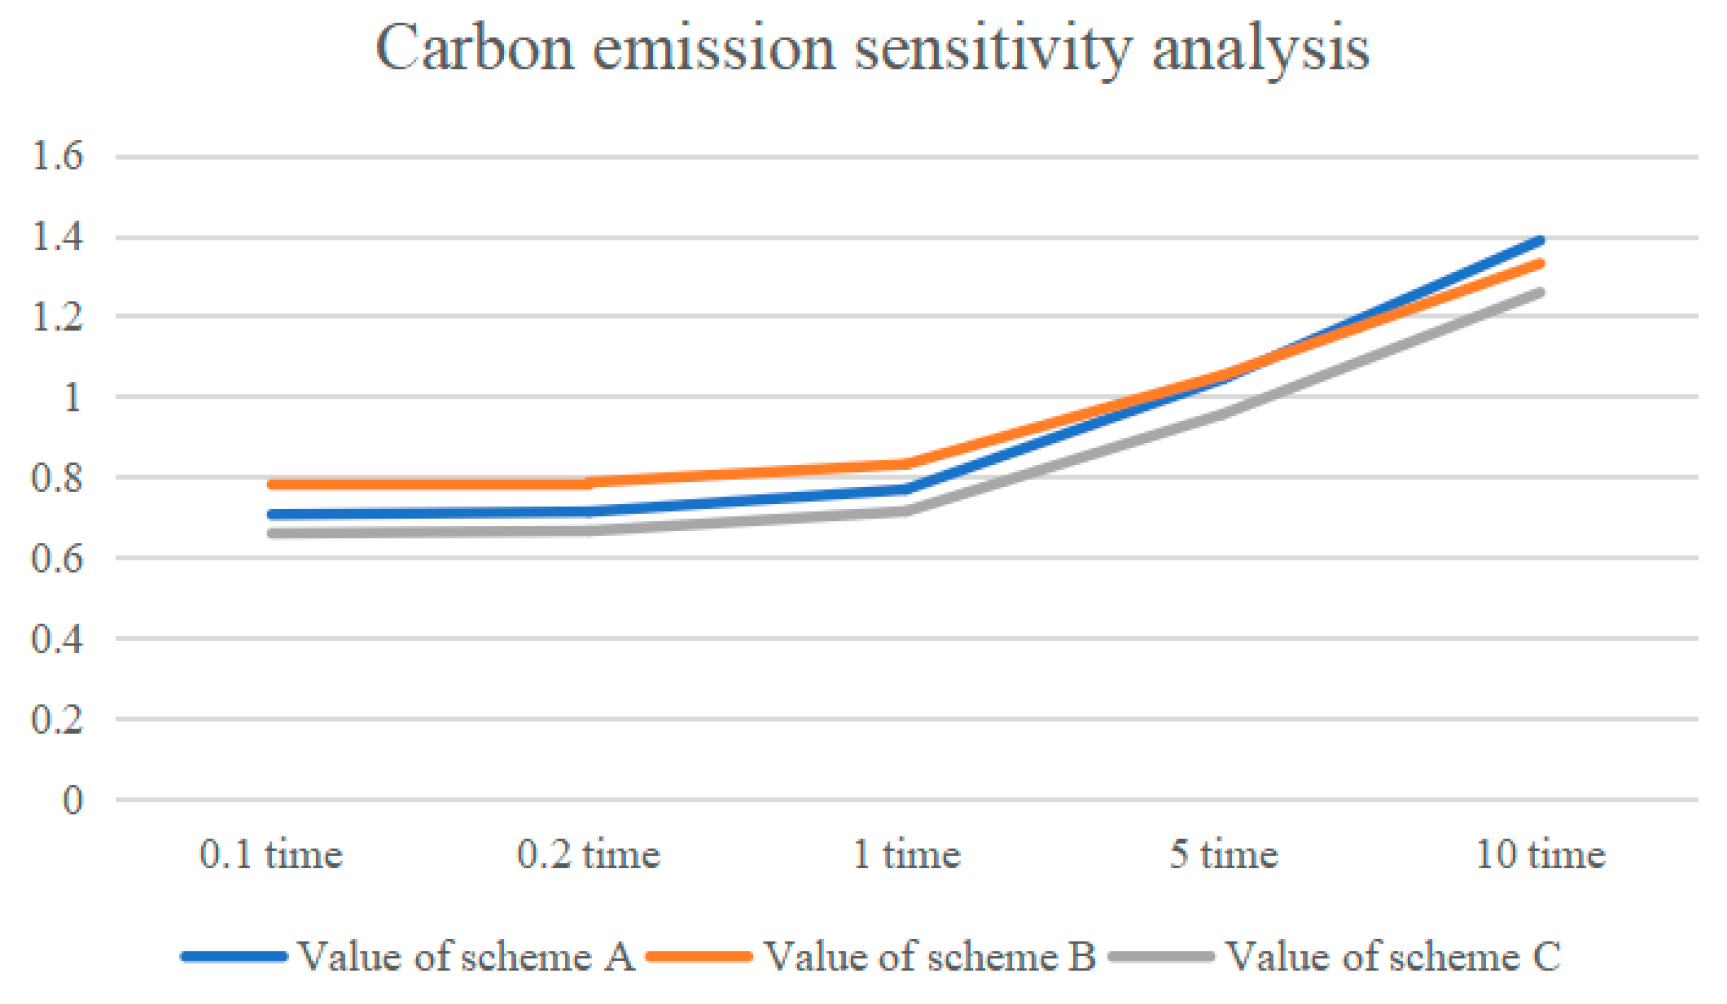
(5) As shown in
Figure 13, when the weight of the carbon emissions indicator increases, the scores of all three designs increase. Scheme B obtained the highest total score with 0.1, 0.2, and 5 times the original weight, but, with 10 times the original weight, the total score is slightly lower than that of scheme A and ranks second, which shows better overall stability.
(6) In
Figure 14, it can be seen that, as the weight of the pollutant emission indicators from the remanufacturing process increases, the evaluation value of the three design schemes increases. The evaluation values for all three design alternatives increase, but design alternative B always receives the highest overall score, indicating that the evaluation model is stable, and the stability of the evaluation model is better.
From the results of the sensitivity analysis of each indicator, it can be seen that the ten secondary indicators of the design scheme evaluation system have a minimal impact on the evaluation results in the event of fluctuations and that scheme B is always the optimal solution; therefore, the stability of the evaluation model is relatively good.
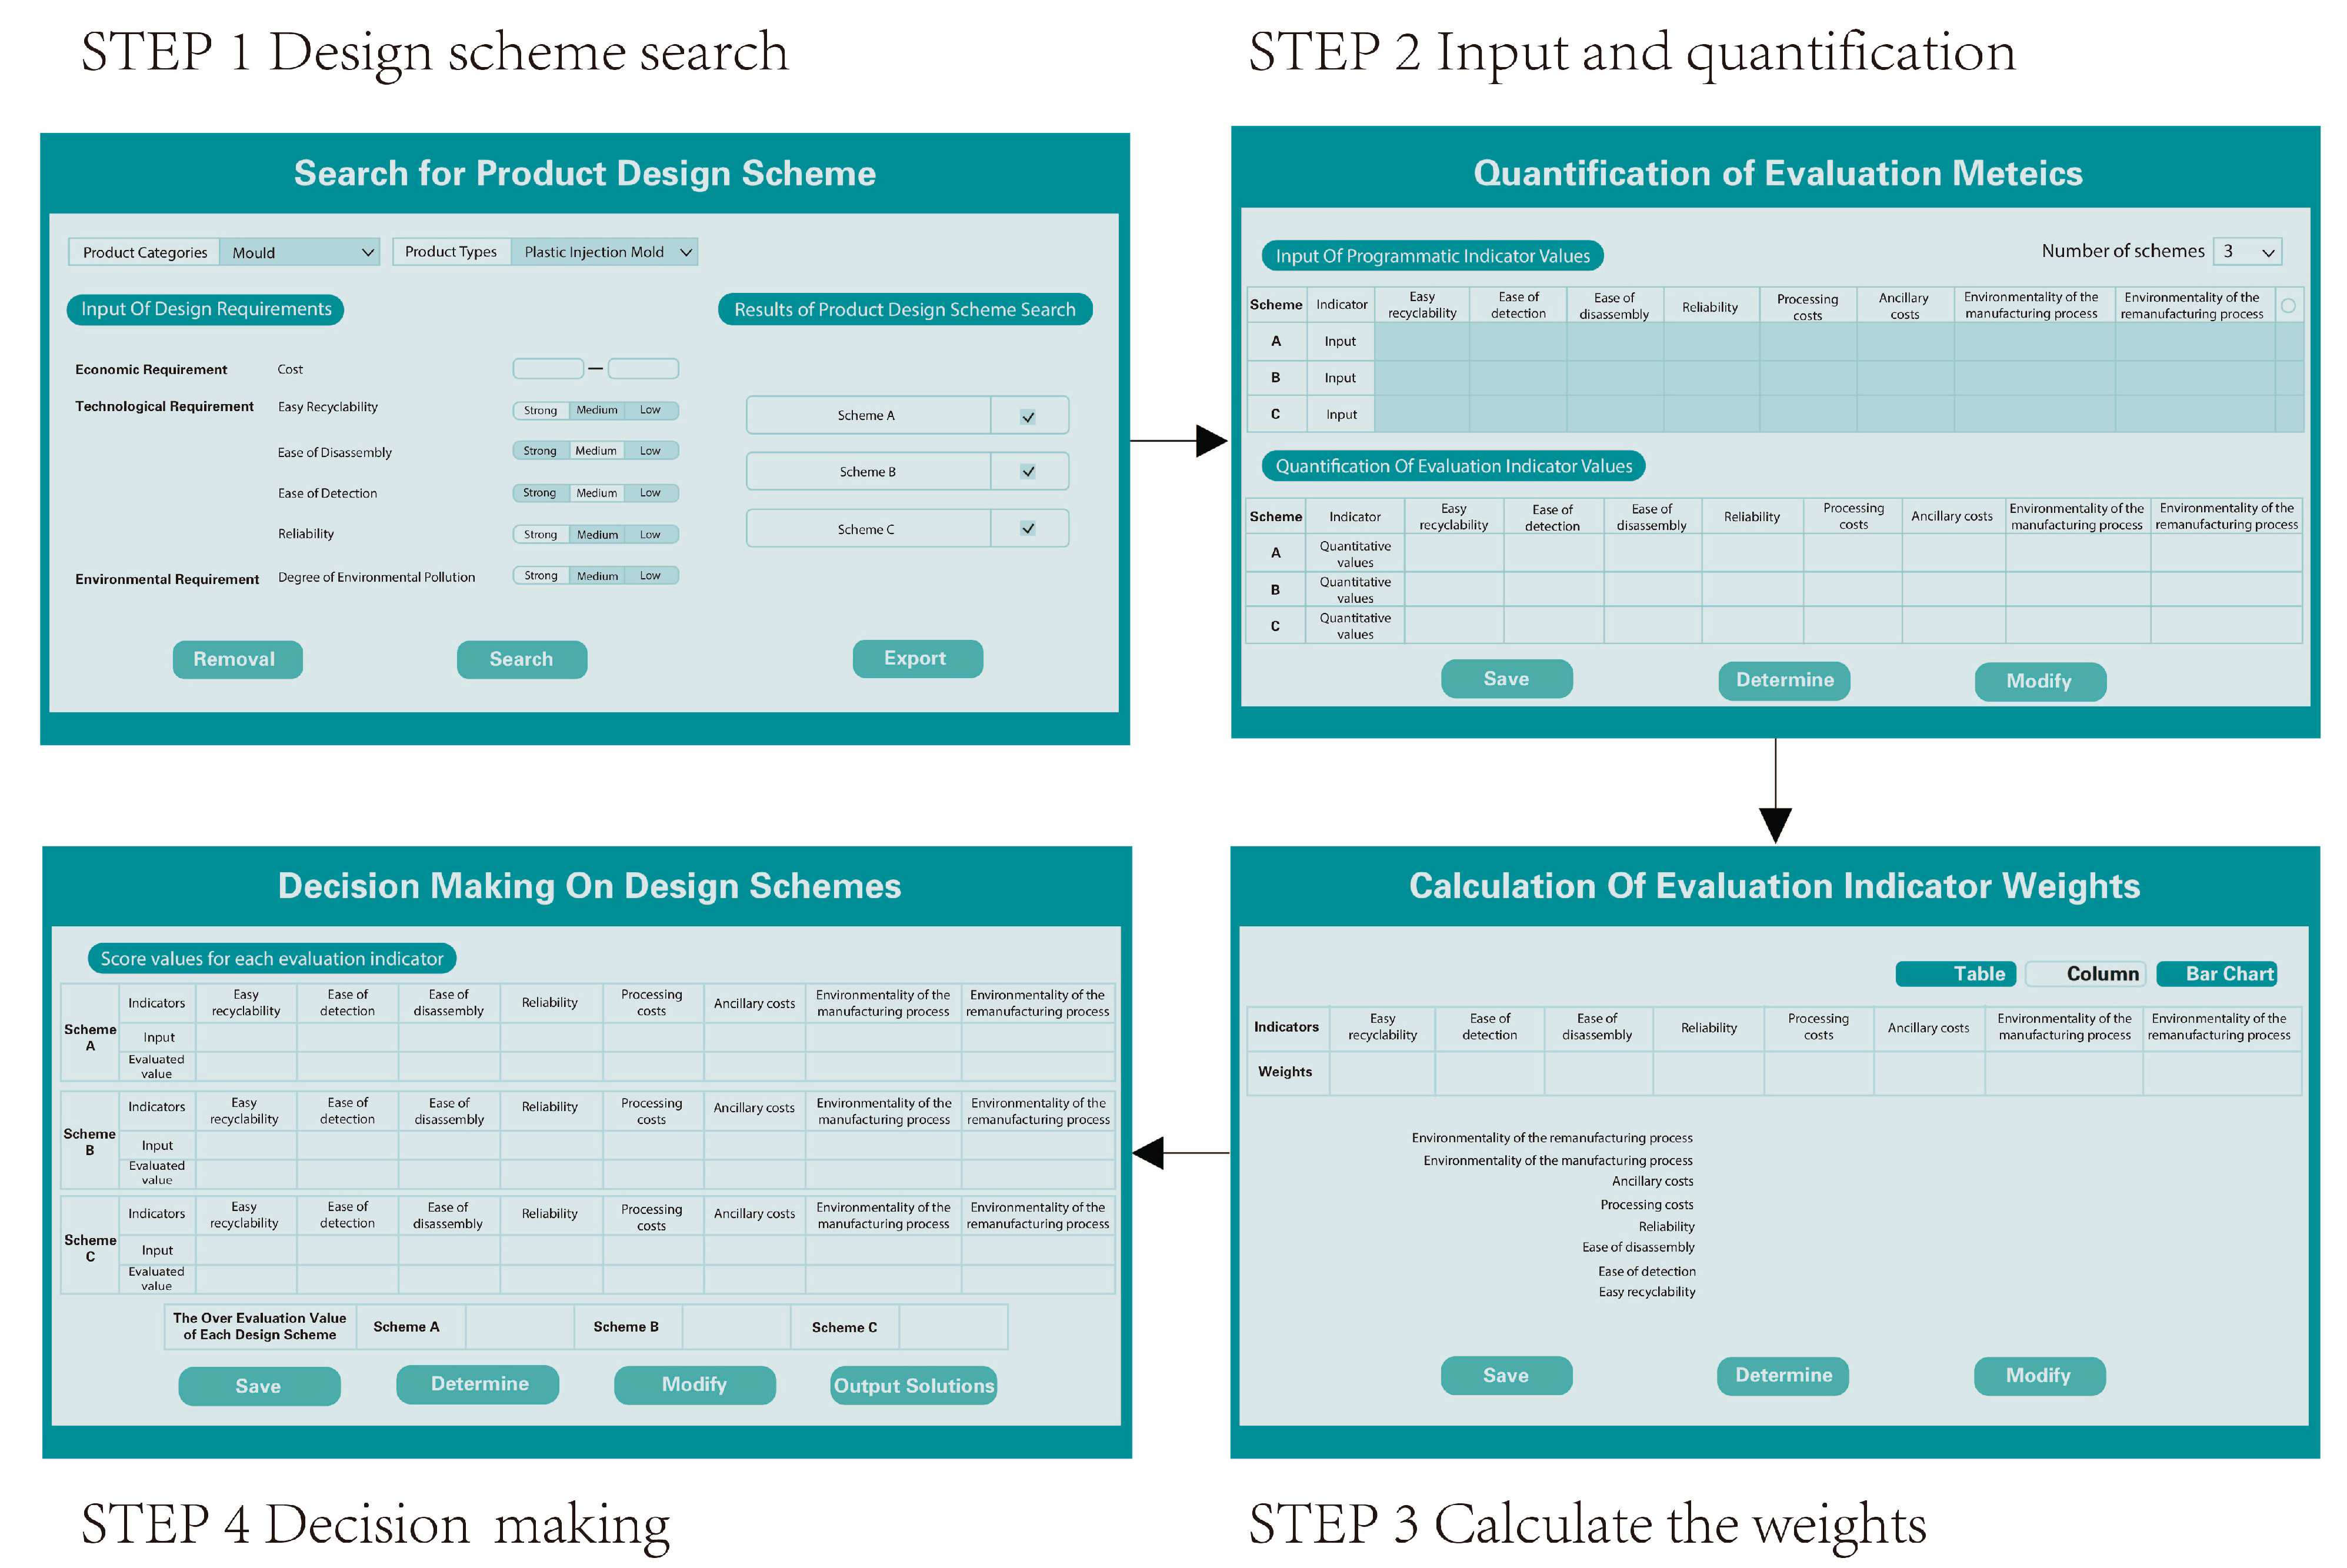
5.4. Design Decision Application Construction
To improve the operability of decision-making methods for remanufacturing design solutions, a design scheme decision-making interactive application was developed with Visual Studio 2022 and Microsoft SQL Server2022, which is shown as
Figure 15. The interactive application consists of four main parts: the design scheme search layer, the evaluation indicator quantization layer, the evaluation indicator weight calculation layer, and the design scheme decision layer. The design scheme search layer is primarily a search for design scheme sets that roughly satisfy the requirements based on the demand intensity of the design scheme evaluation indicators. The evaluation indicator quantization layer is the entry of quantitative values for each indicator based on expert scores, numerical calculations, and data collection; meanwhile, the indicators can also be normalized. The evaluation indicator weight calculation layer is a method to generate the corresponding weights based on the quantitative values of the indicators, and appropriate corrections can be made when the results do not make sense. The design scheme decision layer is based on the weights and quantitative values of the indicators for scheme preference. The design scheme decision-making application can improve the design efficiency of designers and more easily to operate the decision-making process.
6. Conclusions and Future Work
This paper proposes an integrated decision-making method for remanufacturing design schemes, which includes the construction of design scheme evaluation indicators such as remanufacturability indicators, ergonomic indicators, and carbon emission indicators. In addition, AHP and EW methods are applied to jointly calculate the weights of the indicators, and GRA and TOPSIS methods are used to make a comprehensive decision on the design schemes. Meanwhile, a design scheme decision-making interactive application is constructed to improve design efficiency and operability. Finally, the remanufacturing design of a coffee machine is used as an example to verify the feasibility of the proposed method.
From the evaluation indicator system, it can be seen that the ergonomic indicators are subjective indicators that require human subjective judgment to quantify, while the remanufacturability and carbon emission indicators can be calculated by measuring data and formulas to obtain accurate values. Therefore, a single subjective or objective weighting method cannot accurately assign indicator weights. In this paper, the AHP and EW are applied to synergistically calculate the subjective and objective weights to obtain the weights of each indicator, which ensures the accuracy of the weights of each indicator. To ensure the reliability of the decision-making results, the integrated design scheme decision making using GRA and TOPSIS can effectively solve the nonlinear relationship between indicators and improve the robustness of the ranking results.
The prospective research needs to work in the following directions: (1) The ergonomic indicators in the evaluation indicator system of the design scheme are not comprehensive enough, and the quantification method is too single. In the future, more comprehensive ergonomic evaluation indicators need to be added, as well as the collection of physiological data for synergistic quantification. (2) Existing decision-making methods still rely on traditional methods such as indicator quantification and weight calculation for design scheme decision making, which requires high-quality indicator data and is a cumbersome process. In the future, big data models can be considered for the decision-making process integration, such as human physiology measurement data, remanufacturing data, carbon emission data, etc., and design scheme decision making can be carried out through big data analysis technologies, such as neural networks and support vector machines, to improve the efficiency of design decision making.


 ,
, 


