Article

Manufacturing Considerations in the Aerodynamic Design Process of Turbomachinery Components

1
Institute of Jet Propulsion and Turbomachinery (IST), RWTH Aachen University, Templergraben 55, 52062 Aachen, Germany
2
Fraunhofer-Institute for Production Technology IPT, Steinbachstraße 17, 52074 Aachen, Germany
3
Manufacturing Technology Institute (MTI), RWTH Aachen University, Campus Boulevard 30, 52074 Aachen, Germany
*
Author to whom correspondence should be addressed.
These authors contributed equally to this work.
Processes 2025, 13(8), 2363; https://doi.org/10.3390/pr13082363
Submission received: 28 May 2025 / Revised: 8 July 2025 / Accepted: 22 July 2025 / Published: 24 July 2025
(This article belongs to the Section Manufacturing Processes and Systems)

Abstract

This paper presents a CFD-based method for the aerodynamic design of a high-pressure compressor rotor blisk, taking into account manufacturing constraints. Focus is placed on the influence of geometric deviations caused by the dynamic constraints of the milling machine. Special attention is given to the leading edge region of the blade, where high curvature results in increased sensitivity in both aerodynamic behavior and manufacturability. The generic blisk geometry on which this study is based is characterized by an elliptical leading edge. For the optimization, the leading edge is described by Bézier curves that transition smoothly to the suction and pressure sides with continuous curvature and a non-dimensional length ratio. In steady-state RANS parameter studies, the length ratio is systematically varied while the chord length is kept constant. For the aerodynamic evaluation of the design’s key performance parameters such as blade pressure distribution, total pressure loss and compressor efficiency are considered. To evaluate the machine dynamics for a given design, compliance with the nominal feed rate and the deviation between the planned and actual tool tip positions were used as evaluation parameters. Compared to the reference geometry with an elliptical leading edge, the purely aerodynamic optimization achieved an isentropic efficiency improvement of +0.24 percentage points in the aerodynamic design point and a profile deviation improvement of 3   µ m in the 99th quantile. The interdisciplinary optimization achieved an improvement of +0.20 percentage points and 30   µ m, respectively. This comparative study illustrates the potential of multidisciplinary design approaches that balance aerodynamic performance goals with manufacturability via a novel approach for Design-to-Manufacture-to-Design.

1. Introduction

High-pressure compressors (HPCs) are among the most critical components in modern aero engines, playing a central role in determining thermal efficiency, fuel consumption, and overall engine performance [1]. Within these compressors, blade design is a decisive factor, as it directly influences aerodynamic efficiency, stability margins, and the structural integrity of the rotating components. Consequently, the design of compressor blades is a highly multidisciplinary task that must take into account fluid dynamics, structural mechanics, and the influence of manufacturing processes.
However, at the beginning of the development and design process of components with complex functional surfaces, specific boundary conditions of the manufacturing process have so far only been taken into account to a limited extent [2]. Manufacturing is only brought into the process after all the engineering disciplines involved in the design (e.g., aero and structural mechanics) have been worked through and a nominal design has been created [3]. Consequently, the manufacturing department seeks to develop a manufacturing process that is as stable as possible within the specified tolerance limits of the CAD model that is based on the nominal design. From the perspective of the relevant design disciplines, as well as from the manufacturing side, separate solution spaces exist in which an optimized design can be achieved. To identify an interdisciplinary optimum, it is essential to also evaluate the component design based on its manufacturability.
Anderson and Klein [4] found that for centrifugal compressors, the optimal design is not necessarily the most efficient from an aerodynamic and structural–mechanical point of view (design optimum), but rather the one that incorporates manufacturing at an early design stage to enable the economically and ecologically optimized manufacturing of the component (interdisciplinary optimum). A work methodology that emphasizes the parallelization of tasks is assigned to the area of concurrent engineering, also known as simultaneous engineering. In the domain of aero engine development, Joly et al. [5] and Gishu et al. [6] have previously explored this approach. However, the focus of these studies was on the interplay between aero and structural mechanics and did not include manufacturing.
The leading edge region of a compressor blade is one of the most critical areas of the entire blade profile with respect to shape deviations and has a particular influence on the loss behavior and the operating range of the compressor [2,7,8,9]. Liu et al. [10] showed that the shape of the leading edge has a very strong influence on the development of the boundary layer and that potential boundary layer separation is closely related to the geometry of the leading edge. Goodhand and Miller [11] studied the effect of local pressure peaks in the blade pressure distribution for different leading edge geometries (circular, elliptical, and continuous curvature) and defined a criterion for spike-induced flow separation. They concluded that a continuous-curvature leading edge is the best because it allows the greatest leading edge thickness while keeping the flow attached over the range of incidences studied. Song et al. [12] demonstrated through numerical calculations that maintaining curvature continuity at the leading edge blend point helps to eliminate a separation bubble, thereby enhancing blade performance. Their findings, supported by theoretical analysis, indicate that two factors govern the leading edge pressure spike. Specifically, they identified the curvature discontinuity at the blend point as the dominant factor at small incidences and the nose curvature as the primary factor at large incidences.
Describing the edge of a blade as a curvature-continuous curve improves not only the aerodynamics of a blade but also its manufacturability [13]. It circumvents a high change of curvature, thus preventing the process from exceeding the machine’s dynamic limits. This improves quality, precision, and efficiency [14]. In recent years, several methods have been developed to consider the process design during the component design phase [15,16,17,18]. Only Damtew et al. [18] consider the machine dynamics. Exceeding the operational limits of a machine will inevitably lead to discrepancies between the planned and the actual tool path. Thus, considering a machine’s dynamics is essential, in order to obtain, e.g., a constant feed rate. To address this, Damtew et al. provide a novel and efficient method to predict feed rate deviations according to a 2D blade cross-section. Thus, allowing an optimization during the early design phase of a high-pressure compressor.
In this article, we devise and investigate a new interdisciplinary optimization method that introduces into the aerodynamic optimization additional manufacturing-related constraints based on [18]. We validate our results by milling one reference geometry of a blisk and two differently optimized geometries. In Section 2, we introduce the new optimization method and our methodology. In Section 3, we analyze the geometries according to their manufacturability and aerodynamics. Finally, in Section 4, we draw a conclusion.

2. Methodology

2.1. Blisk Model

We used a blisk model that is representative of a high-pressure compressor (HPC) rotor with double circular arc (DCA) blades. The model incorporates three-dimensional design features such as blade twist and bow, as well as forward sweep at the tip. The leading and trailing edges are defined by ellipses that transition tangent-continuous into the DCA profile. It is important to note that aerodynamic optimization was not performed on this model. A comprehensive description of the blisk can be found in [19].
To enable a flexible parameterization of the leading edge geometry for subsequent optimization, we described the leading edge using fifth-degree Bézier curves. This approach provides a smooth and curvature-continuous transition into the suction and pressure sides, thereby approximating the original elliptical profile. This approach enables precise control over the local curvature distribution. We characterized the leading edge geometry by the ratio of the local thickness d at the point where the leading edge merges into the suction and pressure sides to the length of the leading edge segment l (Figure 1). This d / l ratio served as the central design variable in our study and was systematically varied to assess its influence on aerodynamic performance and manufacturing feasibility.
The aerodynamic evaluation was carried out at the design operating point of the blisk model, which corresponds to a rotor speed of 12,000 rpm and a midspan-relative Mach number representative of cruise conditions. At this operating point, the relative Mach number at the midspan is approximately 0.4, placing the flow clearly in the subsonic regime. The Reynolds number, based on axial chord length and total conditions, is approximately 9 · 10 5 . These conditions are representative of the front stages in high-pressure compressors and provide a realistic basis for evaluating the aerodynamic sensitivity of leading edge modifications. No incidence angle variations were applied, as the focus was on the sensitivity of the leading edge geometry rather than the overall performance of the blisk under varying inflow conditions.

2.2. Optimization Methodology

In this section, we first introduce methods to assess the aerodynamic performance and the manufacturability of the blisk model. Secondly, the workflow of the optimization process is described.

2.2.1. Aerodynamic Assessment

For the assessment of aerodynamic performance parameters, we solved the three-dimensional Reynolds-averaged Navier–Stokes (RANS) equations using the flow solver TRACE, a joint development of the German Aerospace Center (DLR) and MTU Aero Engines AG. Detailed specifications on the models implemented in TRACE can be found in [20]. We used the finite volume solver of TRACE with second order spatial accuracy. Convective fluxes are discretized using the total variation diminishing upwind scheme of Roe, whereas diffusive fluxes are discretized using a central scheme. Turbulent effects were modeled by the k- ω -SST model by Menter et al. [21] with the Kato–Launder stagnation point correction [22]. Transition on the blade surfaces was modeled by the γ - Re θ transition model [23]. Boundary layers were fully resolved by ensuring a non-dimensional wall distance y + 1 on all walls. We used structured multi-block meshes with a total of approximately 2.5 million cells for one rotor passage and conducted steady-state analyses. A mesh convergence study was was conducted on the reference geometry to verify the grid independence of the results. Four different grid resolutions ranging from 0.8 to 4.1 million cells were evaluated. As shown in Figure 2, the relative deviations in isentropic efficiency and mass flow were evaluated with respect to the baseline mesh containing 2.5 million cells. The results show that for the finer mesh, both parameters converge with deviations below 0.01%, confirming that the selected mesh resolution provides a reliable balance between accuracy and computational effort.

2.2.2. Assessment of Manufacturability

In order to assess the manufacturability of a geometry in its initial design phase, we employed an algorithm introduced by Damtew et al. [18]. This algorithm analyzes a 2D blade cross-section in conjunction with the dynamic constraints of the milling machine in four steps:
  • Compute WCS tool tip positions, given the 2D blade cross-section and the additional inputs detailed in Table A1.
  • Compute the axes’ positions in MCS for each WCS point.
  • Compute the ratio of each MCS velocity, acceleration and jerk and the machine’s theoretical limits.
  • Return the highest ratio.
To estimate the WCS positions in Step I, the algorithm assumes the additional inputs, such as the side tilt angle, to stay constant throughout the whole operation. A ratio of greater than one suggests that the machine’s dynamic limits will be breached. Damtew et al. demonstrated that this algorithm achieves an accuracy of 86% in predicting these deviations. As an approximation of the cross-section of the blade and to serve as an input for the algorithm, we utilized a composite of Beziér curves and linear line segments.

2.2.3. Workflow

Two optimization strategies were applied to investigate the impact of the leading edge geometry on aerodynamic performance under varying design constraints: a purely aerodynamic approach and an interdisciplinary approach incorporating manufacturability considerations.
In the aerodynamic optimization, a series of leading edge geometries was generated by systematically varying the leading edge ratio while keeping both the chord length and the blend point between the suction and pressure side constant. In addition to maximizing aerodynamic efficiency, the optimization aimed to minimize curvature in the leading edge region to reduce flow sensitivity and enhance robustness. A numerical optimizer was employed to adjust the positions of the control points of the Bézier curves describing the leading edge. The objective was to minimize the maximum curvature while ensuring that the resulting contour remained close to the original elliptical shape. Additionally, a constraint was enforced to ensure a G3-continuous transition to both the suction and pressure sides. This ensured not only curvature continuity but also curvature–gradient continuity, avoiding abrupt curvature jumps, which can lead to sharp pressure gradients and flow separation. For each selected leading edge ratio, a corresponding blade geometry was created and evaluated using steady-state CFD simulations. The isentropic efficiency served as the primary performance metric. Among the candidates, the geometry with the highest efficiency was selected as the optimal aerodynamic design.
Building upon the aerodynamic optimization, the interdisciplinary approach introduced additional manufacturing-related constraints into the optimization loop for generating new leading edge geometries. Here, the manufacturability evaluation function described in Section 2.2.2 was integrated into this process to ensure manufacturing feasibility. Specifically, the maximum dynamic ratio computed by the algorithm was incorporated as a penalty term into the objective function of the optimizer. This ensured that geometries likely to violate machine dynamics were systematically disfavored during the design process. The optimization routine thus aimed to identify leading edge shapes that minimize manufacturing difficulties while maintaining aerodynamic potential. Each geometry was subsequently analyzed using steady-state CFD simulations to evaluate its aerodynamic performance. As in the aerodynamic optimization, the isentropic efficiency served as the primary evaluation metric. The final design was selected from this set as the geometry that offered the best aerodynamic performance while satisfying the manufacturability criteria.

2.3. Manufacturing Process and Data Acquisition

Given the two new optimized geometries, we continued with the CAM planning. In order to mill the geometries, we applied the block strategy or waterfall machining [24]. This is a technique to suppress chatter by dividing the blade into individual blocks, which are processed sequentially. Based on experience in manufacturing the original geometry, we divided the blades of each geometry into seven blocks of varying height, with the hub and the fillet not being included in any of the seven blocks. Each block consists of a roughing, semi-finishing and finishing operation, resulting in six different kinds of tools necessary to mill a single blade. During finishing of each block, we used a ball end mill of diameter 12 mm, with four teeth and a cantilever length of 105 mm. Additionally, we set the feed per tooth f z to 0.06 mm.
The machine’s tolerances influence how many feed or positional deviations can be observed. Hence, we chose them such that feed and positional deviations are more likely to occur to ensure a more rigorous analysis of each geometries’ manufacturability. Table 1 shows the defined tolerances for the finishing operations of the blade airfoil.
For every blade variant, two blades were fabricated, all of which were milled from a single Ti64 ASTM B348 (Grade 5) disk. The milling process itself was performed on a GF Mikron HPM 800U HD. Throughout the milling process, we collected data on the position, orientation, and actual feed rate from the Siemens Sinumerik 840D sl. Comparing them with their intended counterparts gives us insight into the actual manufacturability of the different geometries, although in this paper we focus on the feed rate. Following this, both blades of each geometry were scanned using the Zeiss ATOS Q 12M. This allows us to determine the aerodynamics of the manufactured parts, as well as their profile deviations, in the next step.

3. Results

In the previous section, we introduced an existing optimization method alongside a newly developed one. Utilizing a reference geometry in conjunction with these optimization methods, we derived two new geometries—an aerodynamic (aer.) optimum and an interdisciplinary (int.) optimum. In this section, we will perform a comprehensive analysis of the acquired process data during machining, as well as the optical measurements of blade profile deviations obtained from quality inspections.

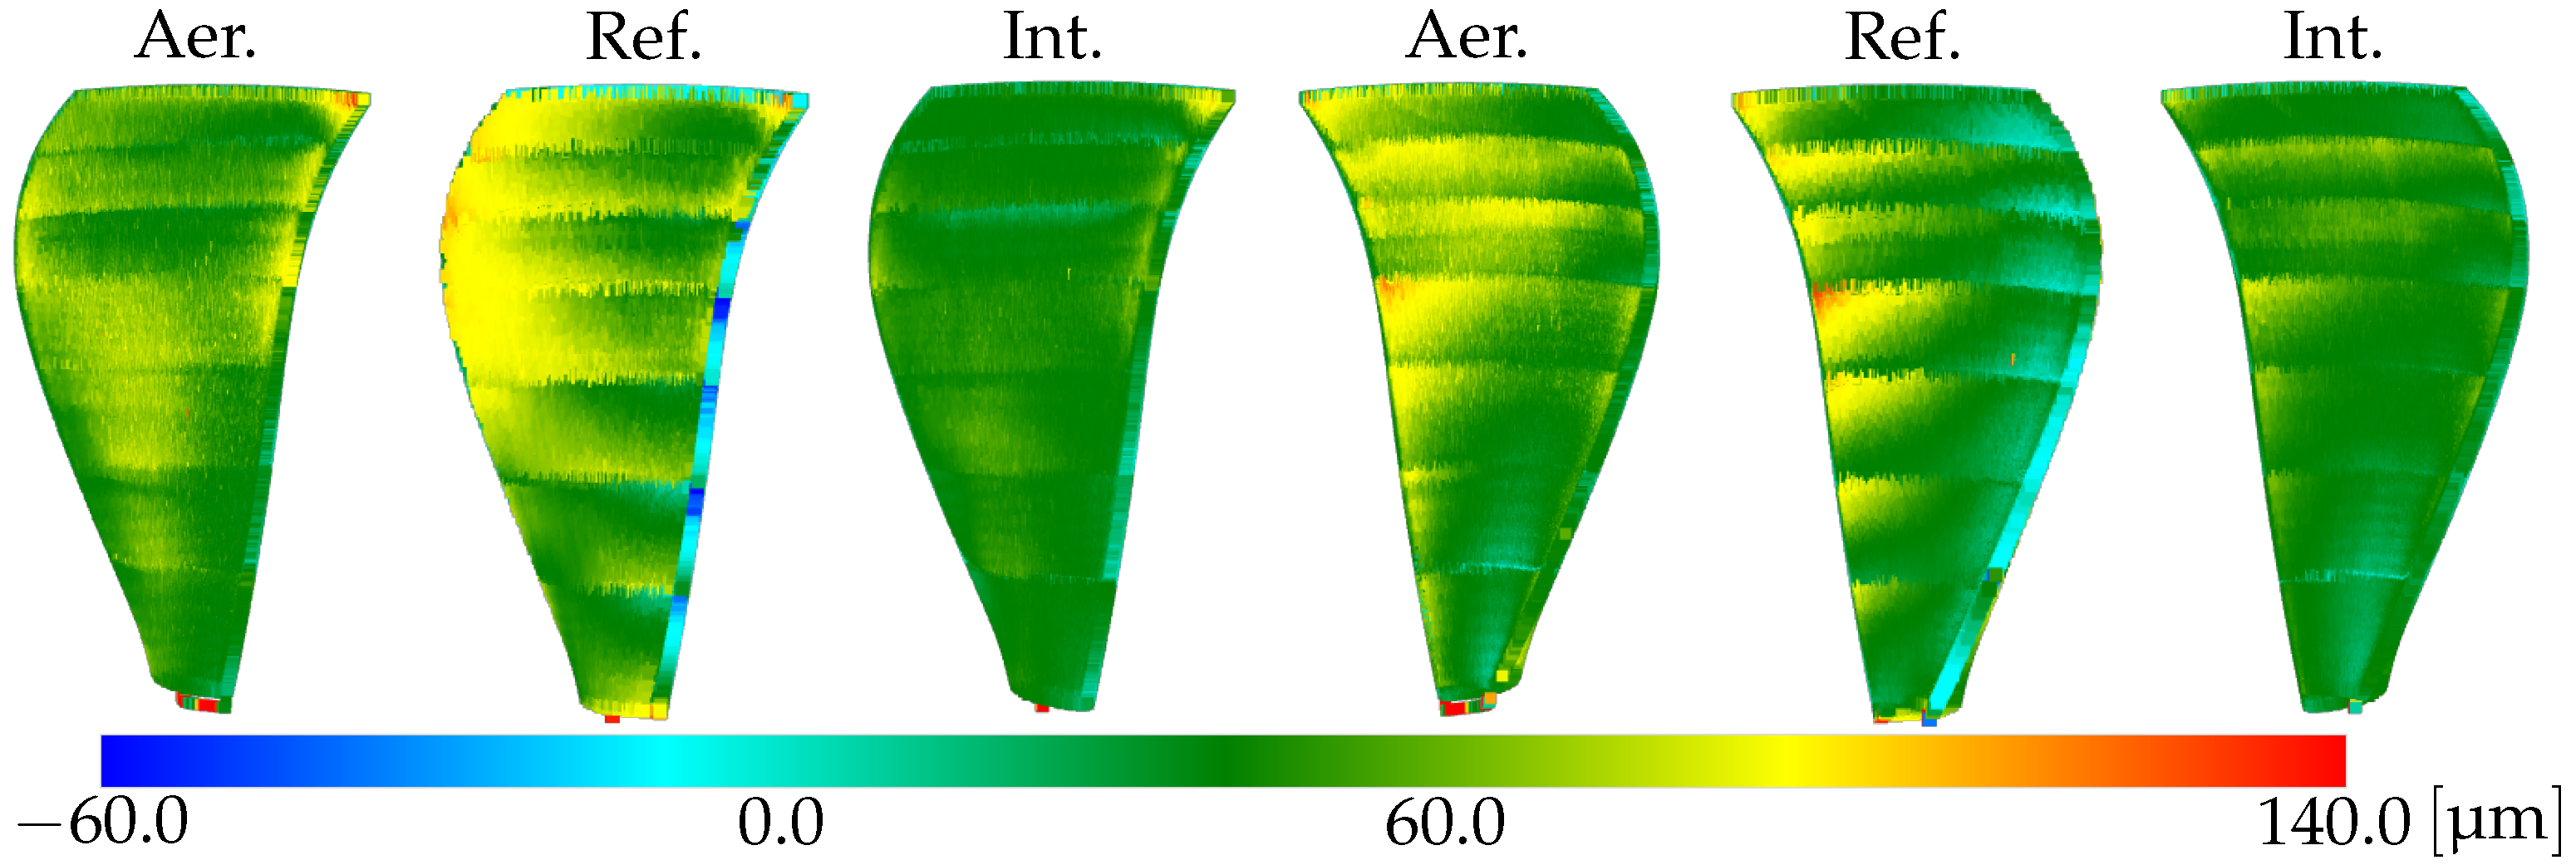
3.1. Evaluation of Manufacturability

In this section, we assess and compare the manufacturability of each geometry by analyzing the amount of feed deviations along the edges of the blade and the profile deviations along the whole blade.
To analyze the feed rate deviations along the edges of each blade, we sorted them into three different categories—low (0–10%), medium (10–30%) and high (30–60%)—depending on their severity. No deviation higher than 60% occurred during manufacturing. Figure 3 shows the number of feed deviations that occurred during the finishing operation of each block, excluding block 4, where data acquisition was not completed as intended.
As can be seen, the interdisciplinary optimum has much fewer feed deviations during the manufacturing of the first block, compared to the aerodynamic optimum. For blocks three to six, the number of deviations of both optima are similar, and for block seven, the interdisciplinary optimum has 28 fewer high deviations than the aerodynamic optimum. Only for block two does the interdisciplinary optimum seem to have performed worse than the aerodynamic optimum, with 32 more high deviations. Table A2 gives a more extensive overview of the number of feed deviations. Thus, according to the number of feed rate deviations, both optima perform similarly and are preferred over the reference geometry. This implies not only a better manufacturability but also a higher productivity. The fact that both optima outperform the reference is also reflected by the performance indicator of Damtew et al. [18]. The algorithm predicted a better manufacturability of 23.5% for the aerodynamic optimum and 43.1% for the interdisciplinary optimum, compared to the reference. Thus, even though the objective of manufacturability was only considered during construction of one of the optima, both perform better than the reference geometry. This is most likely due to the construction of the blades’ edges. For both geometries, the edges were constructed via continuous Bézier curves. Therefore, the geometries avoid discontinuities and are less likely to exceed the dynamic limits of the machine tool.
Further, we analyze the quality of the manufacturability by inspecting the profile deviations. Determining the profile deviation of a single blade requires first computing a best fit between the scanned and intended geometry. In order to reduce the influence of distortion, we perform a best fit for each block separately. Figure 4 shows the profile deviation of the measured and the ideal blade geometry given the block-wise best fit. Since the best fit is performed block-wise, the seven blocks can be made out distinctly within Figure 4.
As shown by Figure 4, the interdisciplinary optimum exhibits the least amount of profile deviation and is more homogeneous throughout than the others. This is further exemplified by Table 2. It shows the 99th quantile (Q99), median, mean and standard deviation (std) of the profile deviations for each geometry. In addition to showcasing that the interdisciplinary optimum has the least profile deviation, Table 2 also shows that the aerodynamic optimum exhibits a higher profile deviation than the reference.
Hence, in terms of feed deviations, both new optima perform better than the reference but still similar to each other. Meanwhile, in terms of profile deviation, the interdisciplinary optimum performs best, the reference performs second best, and the aerodynamic optimum performs the worst. Therefore, the interdisciplinary optimum is preferred over the other two geometries, in terms of manufacturability. This might explain why the algorithm [18] predicted twice the manufacturability improvement for the interdisciplinary optimum compared to the aerodynamic optimum, thus further proving the predictable capabilities of the algorithm by Damtew et al.

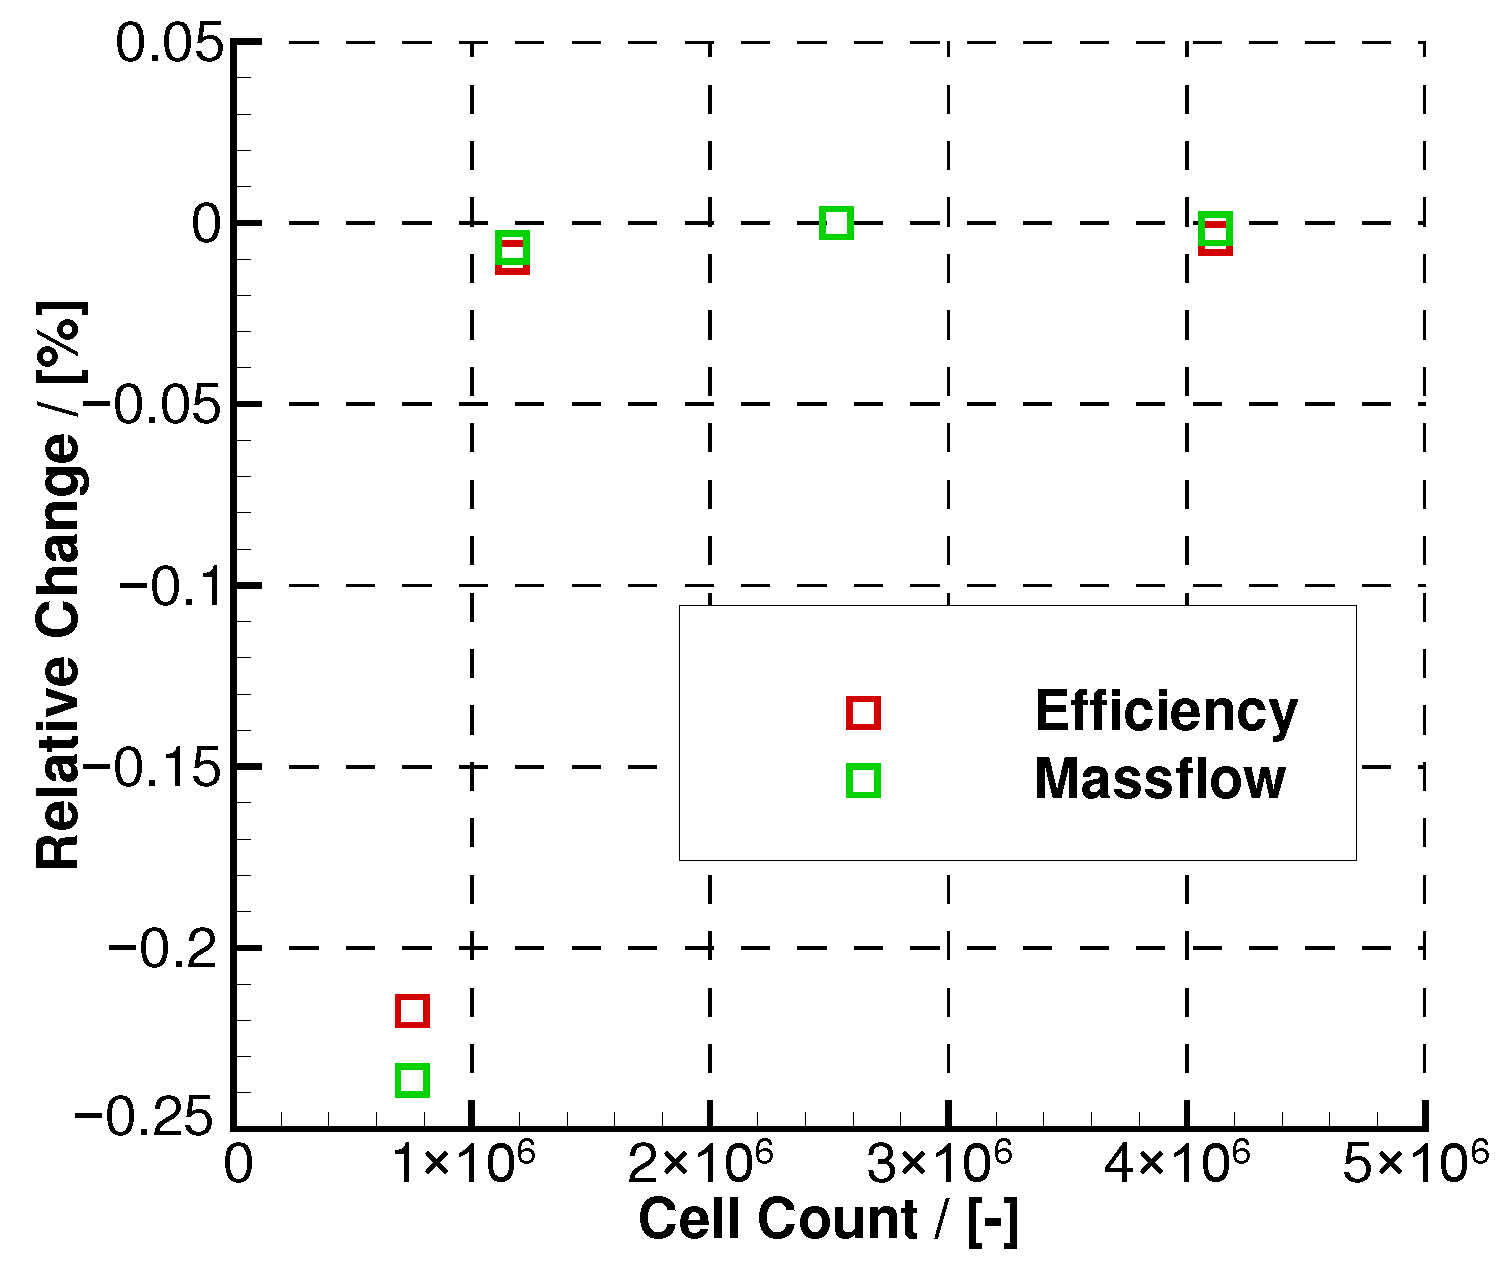
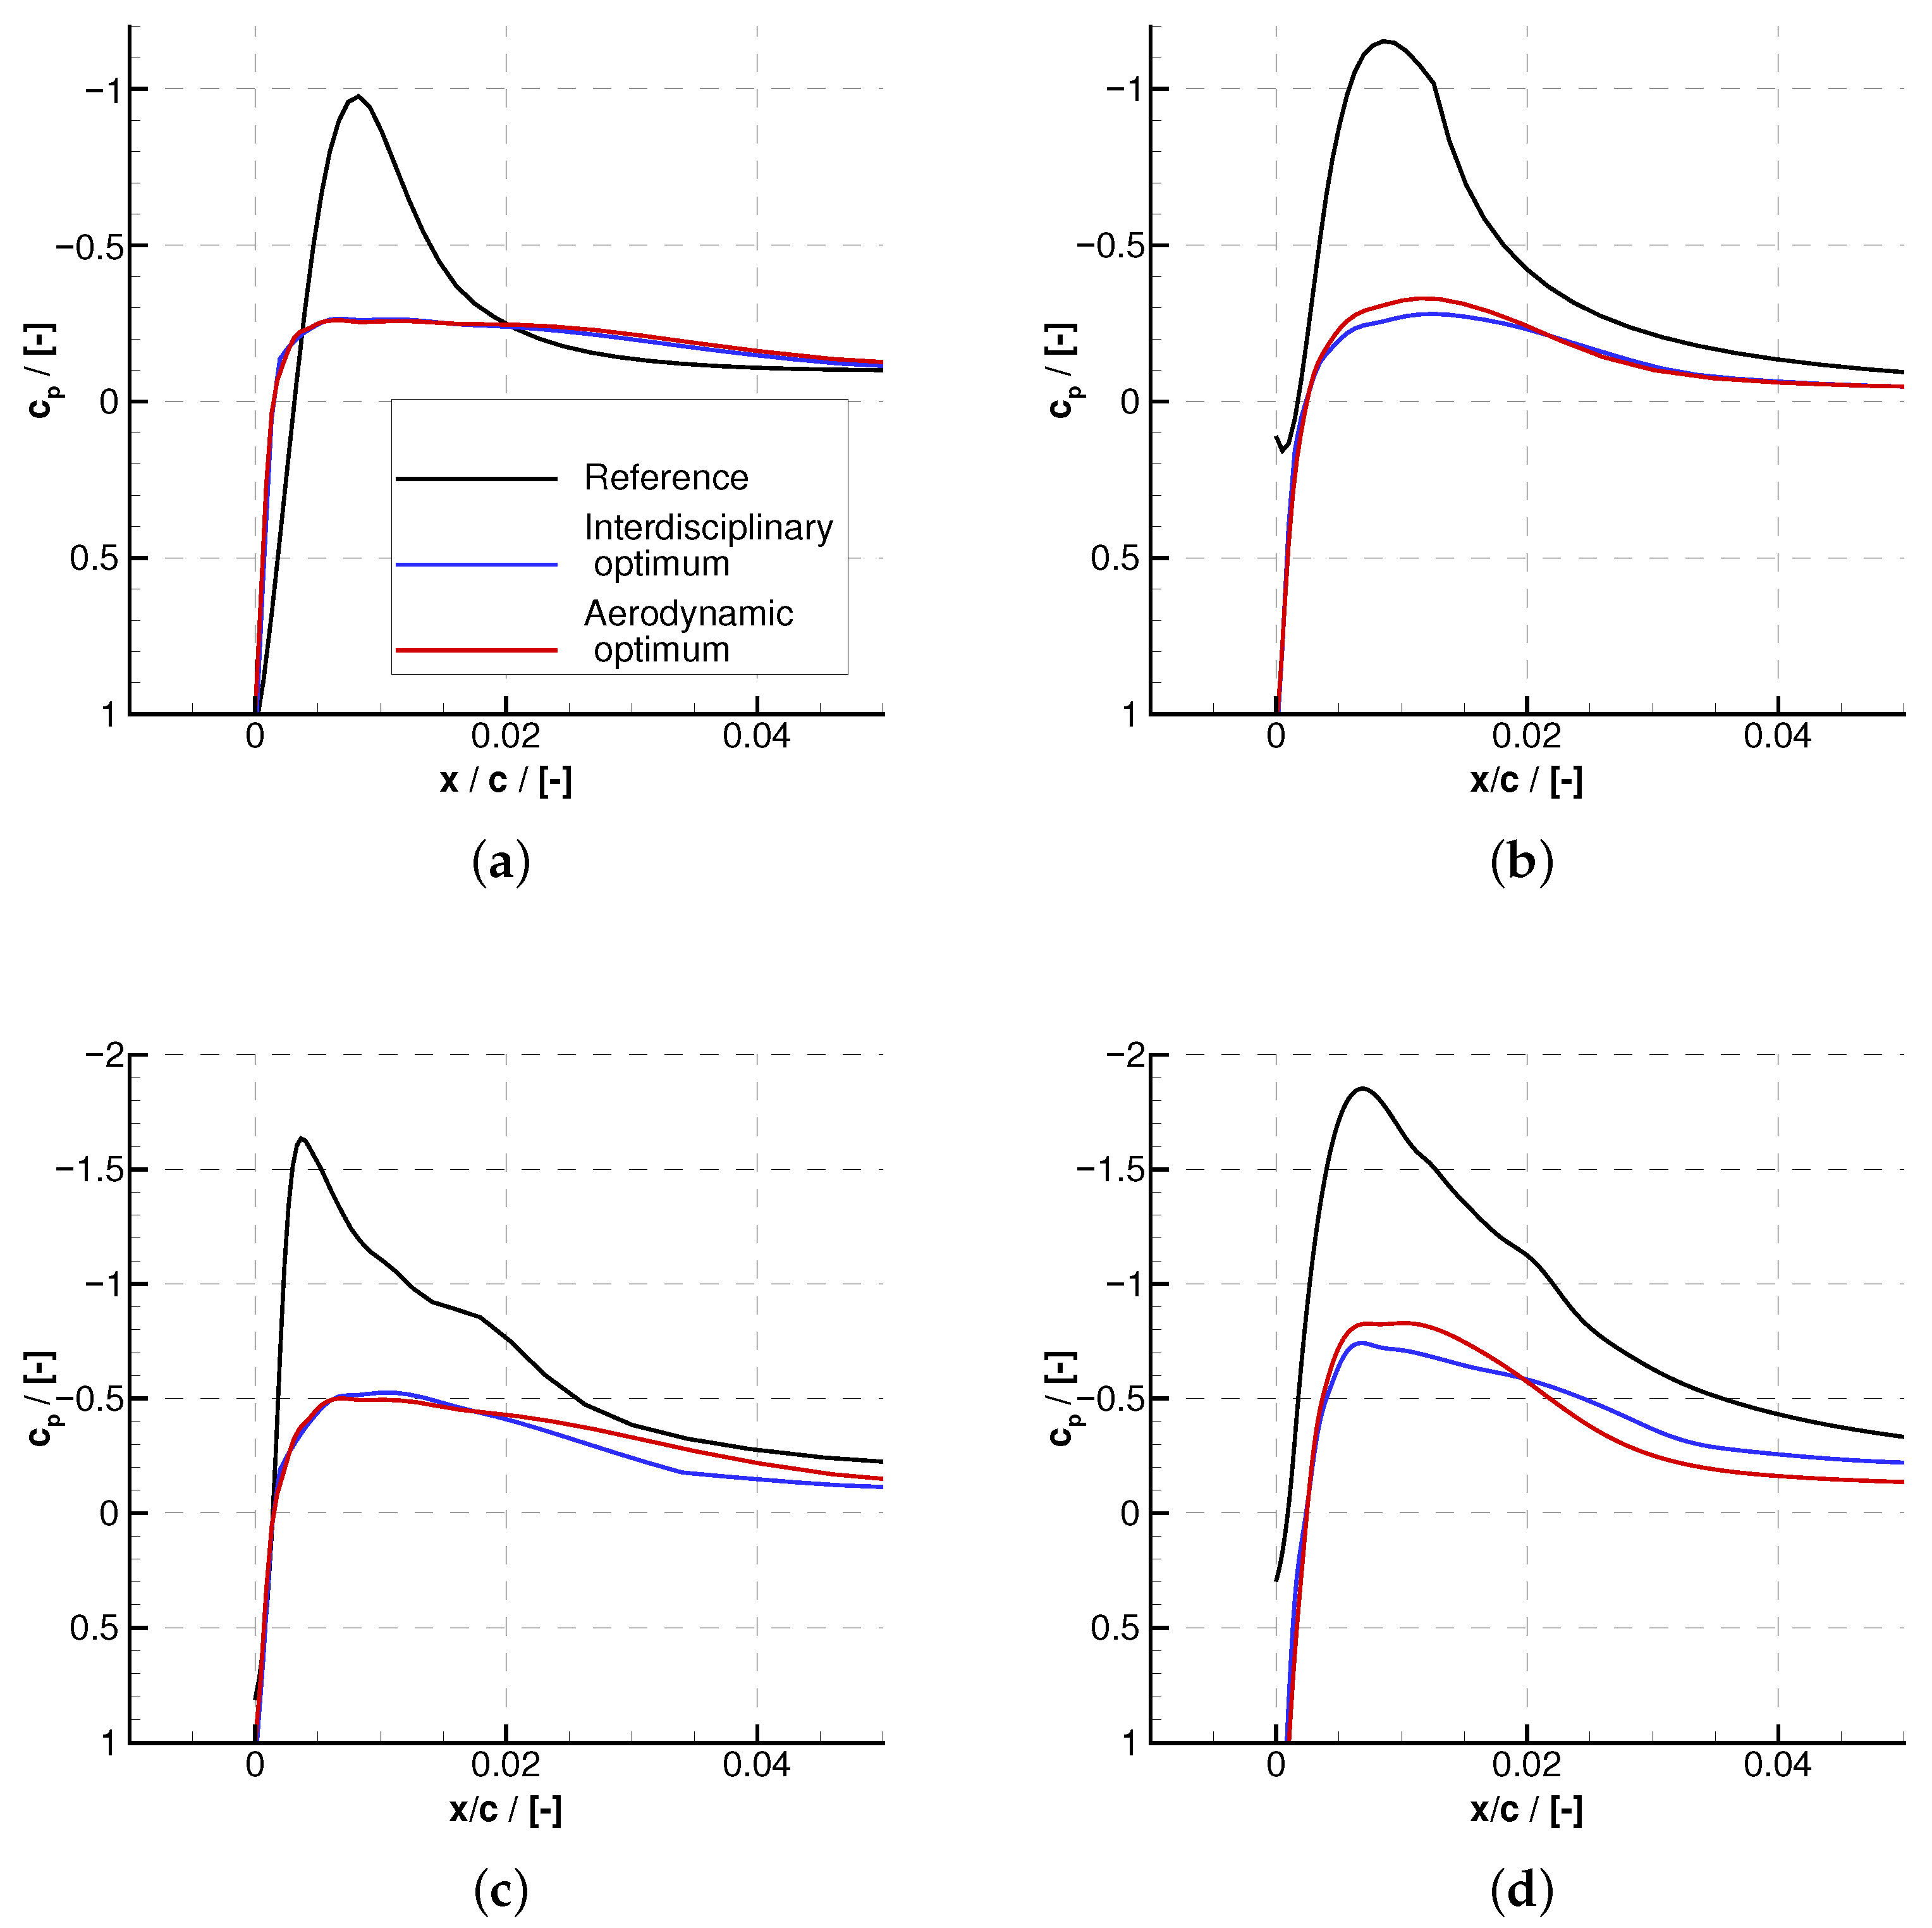
3.2. Evaluation of Aerodynamics

In this section, we assess and compare the aerodynamic performance of the three blade geometries by analyzing blade surface pressure distributions, total pressure loss, and isentropic efficiency obtained from CFD simulations. The evaluation was conducted for both the nominal design geometries and the actual manufactured geometries, as obtained through optical scanning.
The results show that both optimized variants led to improved aerodynamic performance compared to the reference geometry. The aerodynamic optimum achieved a gain of +0.24% in isentropic efficiency, while the interdisciplinary optimum achieved +0.20% (Table 3). Although the difference between the two is small in absolute terms, it is significant in the context of high-pressure compressor design, where even fractional efficiency gains can translate into substantial improvements in engine performance and fuel consumption. In both optimized geometries, the peak curvature at the leading edge was substantially reduced through the use of G3-continuous Bézier curves. As a result, the pressure coefficient distribution along the suction side showed a less pronounced maximum in the stagnation region, leading to reduced total pressure losses and a more uniform flow development downstream. This also contributed to improved boundary layer behavior and potentially enhanced off-design robustness.
A detailed comparison of the suction side pressure distributions at mid span and near the blade tip (Figure 5a,b) reinforces these trends. At mid span, the reference blade shows a sharp suction peak ( c p < 0.6 ) near the leading edge, followed by a smooth pressure recovery. The optimized designs exhibit significantly lower peak suction levels, suggesting moderate acceleration and improved boundary layer stability.
The differences become even more pronounced near the blade tip, where three-dimensional effects such as tip leakage and secondary flows reduce the effective loading. Here, the reference blade reaches a peak suction coefficient close to 1.1 , while both optimized variants remain below 0.6 , indicating a substantial mitigation of adverse pressure gradients and associated losses. Furthermore, the optimized designs show a more favorable and gradual pressure recovery, which helps delay possible flow separation in this critical region.
To assess the impact of manufacturing deviations, the manufactured blades were scanned and analyzed using the same CFD methodology. The predicted aerodynamic improvements for the optimized blades with nominal geometries were significantly greater than those observed for the actual geometries of the manufactured blades. The aerodynamic optimum achieved approximately 80% of the predicted efficiency gain, whereas the interdisciplinary optimum reached only about 50% of the expected improvement (cf. Table 3). This discrepancy is attributed to geometric deviations introduced during the milling process and data reconstruction of the optical scans, particularly curvature discontinuities at the leading edge caused by the segmentation of the surface model.
Figure 5c,d show the suction side pressure coefficient distributions in the mid span and tip regions for the manufactured blisk. In the mid span section (Figure 5c), the reference blade exhibits a sharp suction peak followed by a local pressure plateau and a delayed recovery, suggesting the presence of a small separation bubble near the leading edge. This behavior is typical for over-accelerated flows and is often associated with increased boundary layer instability and higher local loss generation. In contrast, both optimized designs, especially the aerodynamically optimized one, show smoother pressure distributions with significantly reduced peak suction and a more gradual pressure rise, indicating better flow attachment and suppressed separation.
The tip distributions (Figure 5d) show similar trends but with amplified differences. The reference geometry again reaches a high suction peak ( c p 1.7 ) followed by a pronounced pressure plateau, which reinforces the interpretation of a persistent separation bubble or at least a highly decelerated boundary layer. The optimized variants, on the other hand, maintain more moderate suction levels and exhibit smoother and more continuous pressure recovery. This indicates improved boundary layer behavior and highlights the robustness of the optimized leading edge shape even in regions affected by strong three-dimensional flow phenomena like tip leakage and secondary vortices.
Overall, these comparisons demonstrate that the optimized geometries not only provide aerodynamic advantages in the design configuration but also retain favorable flow characteristics under real manufacturing conditions. The mitigation of leading edge separation and the reduction in peak suction gradients contribute directly to lower total pressure losses and improved blade performance across the span.

4. Conclusions

In summary, we developed a methodology that facilitates the optimal aerodynamic design of components with complex functional surfaces while accounting for the manufacturing constraints inherent to a milling process. This methodology was validated through the optimization of the blades of a high-pressure compressor blisk model. We demonstrated that the interdisciplinary optimum, which integrates aerodynamics and manufacturing, facilitates enhanced manufacturability, accompanied by only modest tradeoffs in aerodynamic efficiency.
The methodology can be applied independently of the manufacturing machine used. However, in order to apply this method to other free-form surfaces, it is necessary to extend the tool path approximation of the algorithm used to assess manufacturability.

Author Contributions

Conceptualization, N.G. and C.E.; methodology, B.R. and C.E.; software, B.R. and C.E.; formal analysis, N.G., B.R. and C.E.; investigation, B.R. and C.E.; writing—original draft preparation, N.G., V.R., B.R., S.H. and C.E.; writing—review and editing, P.B.g.W., S.H. and C.E.; supervision, T.B. and P.J.; project administration, N.G. and C.E.; funding acquisition, T.B. and P.J. All authors have read and agreed to the published version of the manuscript.

Funding

This research was funded by the Deutsche Forschungsgemeinschaft (DFG, German Research Foundation)—project number 461918430.

Data Availability Statement

Dataset available on request from the authors.

Conflicts of Interest

The authors declare no conflicts of interest.

Appendix A

Appendix A.1

The predictive algorithm by Damtew et al. [18] requires a few additional input parameters, detailed in Table A1. Even though the parameters differ throughout the different blocks, they were kept constant to determine the worst-case scenario. Hence, the tool radius was set to the smallest one used, since using a tool with a smaller radius, will result in tighter tool paths around the blade, therefore increasing the curvature and thus the chance for feed deviations.
Table A1. Input parameter for the assessment of manufacturability.
Tool Radius
[mm]
Feed Rate
[mm/min]
Side Tilt Angle
[deg]
Translation
[mm]
Orientation
   3 1   1146   5 25 181.3 135 0 1 0 0 0 1 1 0 0
1 Tool radius used to finish the blade’s fillets.

Appendix A.2

During the manufacturing of the three different blade geometries, the actual feed was recorded. Table A2 shows the number of feed deviations, binned according to their relative intensity. The relative intensity is the relative difference between actual and command feed.
Table A2. Number of feed rate deviations along the edges. Deviations of the optima are given relative to the reference.
BlockRelative DropReferenceAer. OptimumInt. Optimum
0–10%4+46+18
110–30%6+51+20
30–60%110+25
0–10%4−4+3
210–30%3−3+6
30–60%00+32
0–10%11−2+5
310–30%35−35−34
30–60%3−3−3
0–10%55−20−8
510–30%71−22−23
30–60%40−33−29
0–10%2936+8
610–30%45−11+25
30–60%124−124−124
0–10%56−490
710–30%55−31−22
30–60%73−32−60

References

  1. DiOrio, A.G. Small Core Axial Compressors for High Efficiency Jet Aircraft. Ph.D. Thesis, Massachusetts Institute of Technology, Cambridge, MA, USA, 2012. [Google Scholar]
  2. Goodhand, M.N.; Miller, R.J. The impact of real geometries on three-dimensional separations in compressors. J. Turbomach. 2012, 134, 021007. [Google Scholar] [CrossRef]
  3. Anderson, D.M. Design for Manufacturability: How to Use Concurrent Engineering to Rapidly Develop Low-Cost, High-Quality Products for Lean Production; Productivity Press: New York, NY, USA, 2020. [Google Scholar] [CrossRef]
  4. Anderson, M.R.; Klein, P.L. Manufacturing Considerations in the Initial Design Process. In Proceedings of the Turbo Expo: Power for Land, Sea, and Air, American Society of Mechanical Engineers, Seoul, Republic of Korea, 13–17 June 2016; Volume 49729, p. V02DT42A033. [Google Scholar] [CrossRef]
  5. Joly, M.M.; Verstraete, T.; Paniagua, G. Multidisciplinary design optimization of a compact highly loaded fan. Struct. Multidiscip. Optim. 2014, 49, 471–483. [Google Scholar] [CrossRef]
  6. Ghisu, T.; Parks, G.; Jarrett, J.; Clarkson, P. Multi-objective optimisation of aero-engine compressors. In Proceedings of the Third International Conference ‘The Future of Gas-Turbine Technology’, Brussels, Belgium, 1–15 October 2006; pp. 1–11. [Google Scholar]
  7. Group, A.M.; Carter, A. Blade profiles for axial-flow fans, pumps, compressors, etc. Proc. Inst. Mech. Eng. 1961, 175, 775–806. [Google Scholar] [CrossRef]
  8. Walraevens, R.; Cumpsty, N. Leading edge separation bubbles on turbomachine blades. J. Turbomach. 1995, 117, 115–125. [Google Scholar] [CrossRef]
  9. Cumpsty, N.A. Compressor Aerodynamics; Krieger Publishing Company: Malabar, FL, USA, 2004. [Google Scholar]
  10. Liu, H.; Liu, B.; Li, L.; Jiang, H. Effect of leading-edge geometry on separation bubble on a compressor blade. In Proceedings of the Turbo Expo: Power for Land, Sea and Air, Atlanta, GA, USA, 16–19 June 2003; Volume 36894, pp. 387–395. [Google Scholar] [CrossRef]
  11. Goodhand, M.N.; Miller, R.J. Compressor leading edge spikes: A new performance criterion. J. Turbomach. 2011, 133, 021006. [Google Scholar] [CrossRef]
  12. Song, Y.; Gu, C.W.; Xiao, Y.B. Numerical and theoretical investigations concerning the continuous-surface-curvature effect in compressor blades. Energies 2014, 7, 8150–8177. [Google Scholar] [CrossRef]
  13. Xu, J.; Sun, Y.; Zhang, X. A mapping-based spiral cutting strategy for pocket machining. Int. J. Adv. Manuf. Technol. 2013, 67, 2489–2500. [Google Scholar] [CrossRef]
  14. Budak, E.; Altintas¸, Y. Analytical Prediction of Chatter Stability in Milling—Part I: General Formulation. J. Dyn. Syst. Meas. Control 1998, 120, 22–30. [Google Scholar] [CrossRef]
  15. Chaves-Jacob, J.; Poulachon, G.; Duc, E.; Geffroy, C. Design for manufacturing applied to turbomachine components. Int. J. Adv. Manuf. Technol. 2011, 57, 453–463. [Google Scholar] [CrossRef]
  16. Vessaz, C.; Tournier, C.; Münch, C.; Avellan, F. Design optimization of a 2D blade by means of milling tool path. CIRP J. Manuf. Sci. Technol. 2013, 6, 157–166. [Google Scholar] [CrossRef]
  17. Zhou, Y.; Xing, T.; Song, Y.; Li, Y.; Zhu, X.; Li, G.; Ding, S. Digital-twin-driven geometric optimization of centrifugal impeller with free-form blades for five-axis flank milling. J. Manuf. Syst. 2021, 58, 22–35. [Google Scholar] [CrossRef]
  18. Damtew, L.; Michel-Angeli, N.; Gerhard, N.; Ganser, P.; Bergs, T. A novel framework for incorporating machine limitations into component design for 5-axis milling. In Proceedings of the 18th CIRP Conference on Intelligent Computation in Manufacturing Engineering, Gulf of Naples, Italy, 10–12 July 2024. [Google Scholar]
  19. Fricke, K.; Gierlings, S.; Ganser, P.; Venek, T.; Bergs, T. Geometry Model and Approach for Future Blisk LCA. IOP Conf. Ser. Mater. Sci. Eng. 2021, 1024, 012067. [Google Scholar] [CrossRef]
  20. Deutsches Zentrum für Luft- und Raumfahrt e., V. (DLR). TRACE User Guide. 2025. Available online: https://www.trace-portal.de/userguide/trace (accessed on 5 May 2025).
  21. Menter, F.R.; Kuntz, M.; Langtry, R. Ten years of industrial experience with the SST turbulence model. Turbul. Heat Mass Transf. 2003, 4, 625–632. [Google Scholar]
  22. Kato, K. The modeling of turbulent flow around stationary and vibrating square cylinders. In Proceedings of the 9th Symposium on Turbulent Shear Flows, Kyoto, Japan, 6–18 August 1993; pp. 1041–1046. [Google Scholar]
  23. Langtry, R.B.; Menter, F.R. Correlation-based transition modeling for unstructured parallelized computational fluid dynamics codes. AIAA J. 2009, 47, 2894–2906. [Google Scholar] [CrossRef]
  24. Scippa, A.; Grossi, N.; Campatelli, G. FEM based cutting velocity selection for thin walled part machining. Procedia Cirp 2014, 14, 287–292. [Google Scholar] [CrossRef]
Figure 1. Graphical representation of the leading edge ratio d / l , indicating where the curvature-continuous optimized contour departs from the reference geometry.
Processes 13 02363 g001
Figure 2. Relative change in isentropic efficiency and mass flow with respect to the baseline mesh (2.5 million cells) for four different grid resolutions between 0.8 and 4.1 million cells, evaluated for the reference geometry.
Processes 13 02363 g002
Figure 3. Difference in the number of feed deviations (dev.) between the reference geometry and the respective optimum. Only feed deviations along the edges of a blade are considered.
Processes 13 02363 g003
Figure 4. Profile deviations of the suction side (left) and the pressure side (right). The geometries are arranged as follows: aerodynamic optimum, reference and interdisciplinary optimum.
Processes 13 02363 g004
Figure 5. Suction side pressure coefficient distributions for the reference, aerodynamically optimized, and interdisciplinary optimized blades. (a): mid span section (nominal); (b): tip section (nominal); (c): mid span section (manufactured); (d): tip section (manufactured).
Processes 13 02363 g005
Table 1. Machine tolerances for each finishing operation.
Block no.123–7
Chord tolerance0.020.020.01
Angular tolerance0.050.010.01
Table 2. Absolute profile deviation of manufactured geometries. Profile deviations of optima are given as the difference between the reference’s deviation and their actual deviations.
GeometryQ99 µ m Median µ m Mean µ m Std µ m
Reference95303525
Aer. optimum−3+13+6−2
Int. optimum−30+6−1−10
Table 3. Effect of manufacturing deviations on stage efficiency: comparison of reference and optimized blade geometries.
Isentropic Efficiency Gain [%]
Geometry Nominal Manufactured
Reference+0.00+0.00
Aerodynamic optimum+0.24+0.19
Interdisciplinary optimum+0.20+0.11
Disclaimer/Publisher’s Note: The statements, opinions and data contained in all publications are solely those of the individual author(s) and contributor(s) and not of MDPI and/or the editor(s). MDPI and/or the editor(s) disclaim responsibility for any injury to people or property resulting from any ideas, methods, instructions or products referred to in the content.

