Abstract
The large-scale integration of volatile and intermittent renewables necessitates greater flexibility in the power system. Improving this flexibility is key to achieving a high proportion of renewable energy consumption. In this context, the scientific selection of energy storage technology is of great significance for the construction of new power systems. From the perspective of life cycle cost analysis, this paper conducts an economic evaluation of four mainstream energy storage technologies: lithium iron phosphate battery, pumped storage, compressed air energy storage, and hydrogen energy storage, and quantifies and compares the life cycle cost of multiple energy storage technologies. On this basis, a three-dimensional multi-energy storage comprehensive evaluation indicator system covering economy, technology, and environment is constructed. The improved grade one method and entropy weight method are used to determine the comprehensive performance, and the fuzzy comprehensive evaluation method is used to carry out multi-attribute decision-making on the multi-energy storage technology in the source, network, and load scenarios. The results show that pumped storage and compressed air energy storage have significant economic advantages in long-term and large-scale application scenarios. With its fast response ability and excellent economic and technical characteristics, the lithium iron phosphate battery has the smallest score change rate (15.2%) in various scenarios, showing high adaptability. However, hydrogen energy storage technology still lacks economic and technological maturity, and breakthrough progress is still needed for its wide application in various application scenarios in the future.
1. Introduction
Amid the accelerating global energy transition and the large-scale integration of renewable energy, modern power systems are increasingly challenged by heightened variability, greater uncertainty, and limited flexibility in regulation [1,2]. Energy storage technologies, as key enablers of system flexibility, play a crucial role across the generation, grid, and load sides of the energy system. They can mitigate renewable energy intermittency, reduce curtailment of wind and solar power, participate in peak shaving and valley filling, and enhance energy utilization efficiency—ultimately contributing to the overall flexibility and stability of the power system [3]. However, the large-scale deployment of energy storage is still constrained by high costs. Over its entire life cycle, an energy storage system incurs various expenses, including capital investment, operation and maintenance (O&M) costs, replacement costs, and electricity-related expenditures, all of which evolve dynamically over time [4]. Therefore, accurately evaluating the economic performance of energy storage systems is crucial for informed technology selection and promoting widespread adoption.
At present, the economic evaluation methods of energy storage mainly include the LCOS and the life cycle cost (LCC). LCOS measures the economy of energy storage by calculating the unit power cost, which is simple to calculate, but it does not fully consider the time value of electricity and the dynamic change in cost, so it is easy to underestimate the long-term operating cost [5]. In contrast, the LCC method can comprehensively consider factors such as equipment depreciation, operating efficiency, cycle life, and discount rate, and can more comprehensively quantify the real cost of the energy storage system, which has become an important tool for energy storage economic evaluation [6].
In the selection of energy storage technology, the traditional method often focuses on a single indicator, which is difficult to fully reflect the comprehensive performance of the energy storage system in economic, technical performance, and environmental attributes [7]. Multi-attribute decision-making (MADM) has been widely used in energy storage evaluation because it can balance multi-dimensional factors [8]. Studies have shown that lithium iron phosphate batteries perform well with high energy density and fast response capabilities in peak shaving and valley filling scenarios. In long-term energy storage scenarios, pumped storage is more competitive due to its low cost and long life [9].
To further contextualize the gaps in current evaluation practices, it is worth noting that several international studies have addressed similar challenges from diverse geographical perspectives. For example, Denholm et al. examined the role of long-duration energy storage technologies in improving grid flexibility under high-renewable penetration, highlighting economic trade-offs between lithium-ion, flow batteries, and pumped storage [10]. Schmidt et al. conducted a comprehensive comparison of LCOS and environmental metrics for various storage technologies in European electricity markets, emphasizing regional cost differentials and policy influences [11]. Hamed et al. analyzed the techno-economic feasibility of battery energy storage systems under high solar irradiation and time-of-use tariffs, proposing a hybrid approach to optimize system cost and performance [12]. While these studies offer valuable insights, most of them still adopt simplified economic assumptions and rarely integrate full life-cycle cost modeling with multi-criteria decision analysis in a unified framework. Our work aims to bridge this gap by combining LCC and MADM methods in a scenario-driven evaluation of storage technologies across the generation, grid, and load sides.
In addition, the role of environmental factors in the selection of energy storage is also increasingly prominent. For example, although the economy of the flow battery is slightly inferior, its environmental performance advantages are more prominent in low-carbon scenarios [13]. However, the existing research often does not fully incorporate the life cycle cost in the selection of energy storage, resulting in a lack of accuracy and comprehensiveness of the evaluation results.
Based on this, this study first uses the life cycle cost method to quantitatively evaluate the economy of the four energy storage systems, and comprehensively considers the impact of factors such as annual cycle times, operating efficiency, and discount rate on the cost of electricity, and conducts a comparative analysis. On this basis, the economic parameters are incorporated into the multi-energy storage selection system, and the improved G1-EWM weight method and fuzzy comprehensive evaluation method are used to systematically analyze the differential performance of energy storage technology on the source, network, and load sides in multi-application scenarios. The research results can provide a theoretical basis for the scientific selection and configuration optimization of energy storage technology.
Given the limitations of current energy storage evaluation approaches and the increasing complexity of modern power systems, there is a pressing need for more comprehensive and dynamic assessment frameworks that can accurately reflect the full life-cycle economic performance and multi-dimensional attributes of energy storage technologies. Existing studies often rely on simplified cost models such as the LCOS, which do not adequately capture the temporal evolution of costs or the broader impacts of energy storage across multiple application scenarios. Additionally, conventional technology selection methods typically emphasize single economic indicators, overlooking important technical and environmental dimensions that influence storage performance across generation, grid, and load domains. To enable informed decision-making and support the large-scale deployment of energy storage under complex and uncertain renewable energy conditions, a more robust evaluation and selection methodology is required—one that integrates life-cycle cost analysis with multi-criteria decision-making techniques across diverse application scenarios. The main contributions include the following:
- (1)
- A life-cycle cost (LCC)-based evaluation framework is established to quantify the economic performance of four representative energy storage technologies. This model comprehensively incorporates factors such as annual cycle frequency, operational efficiency, replacement costs, and discount rates, providing a more accurate and dynamic reflection of storage economics over the system’s operational lifespan.
- (2)
- A multi-attribute decision-making system is constructed that integrates economic indicators derived from LCC analysis with technical and environmental performance metrics. An improved G1-EWM method combined with a fuzzy comprehensive evaluation (FCE) model is employed to ensure balanced consideration of multi-dimensional performance attributes.
- (3)
- A scenario-based comparative analysis is conducted to evaluate the suitability of different energy storage technologies across the source, grid, and load sides in various application contexts. This enables targeted recommendations for energy storage deployment based on system needs and contextual constraints.
The structure of this paper is as follows: Section 2 introduces characteristic parameters of energy storage technology, Section 3 explains the method of life cycle cost, Section 4 presents the multi-energy storage technology selection, Section 5 provides a typical application scenario analysis, and Section 6 provides the main conclusion.
2. Characteristic Parameters of Energy Storage Technology in Power Systems
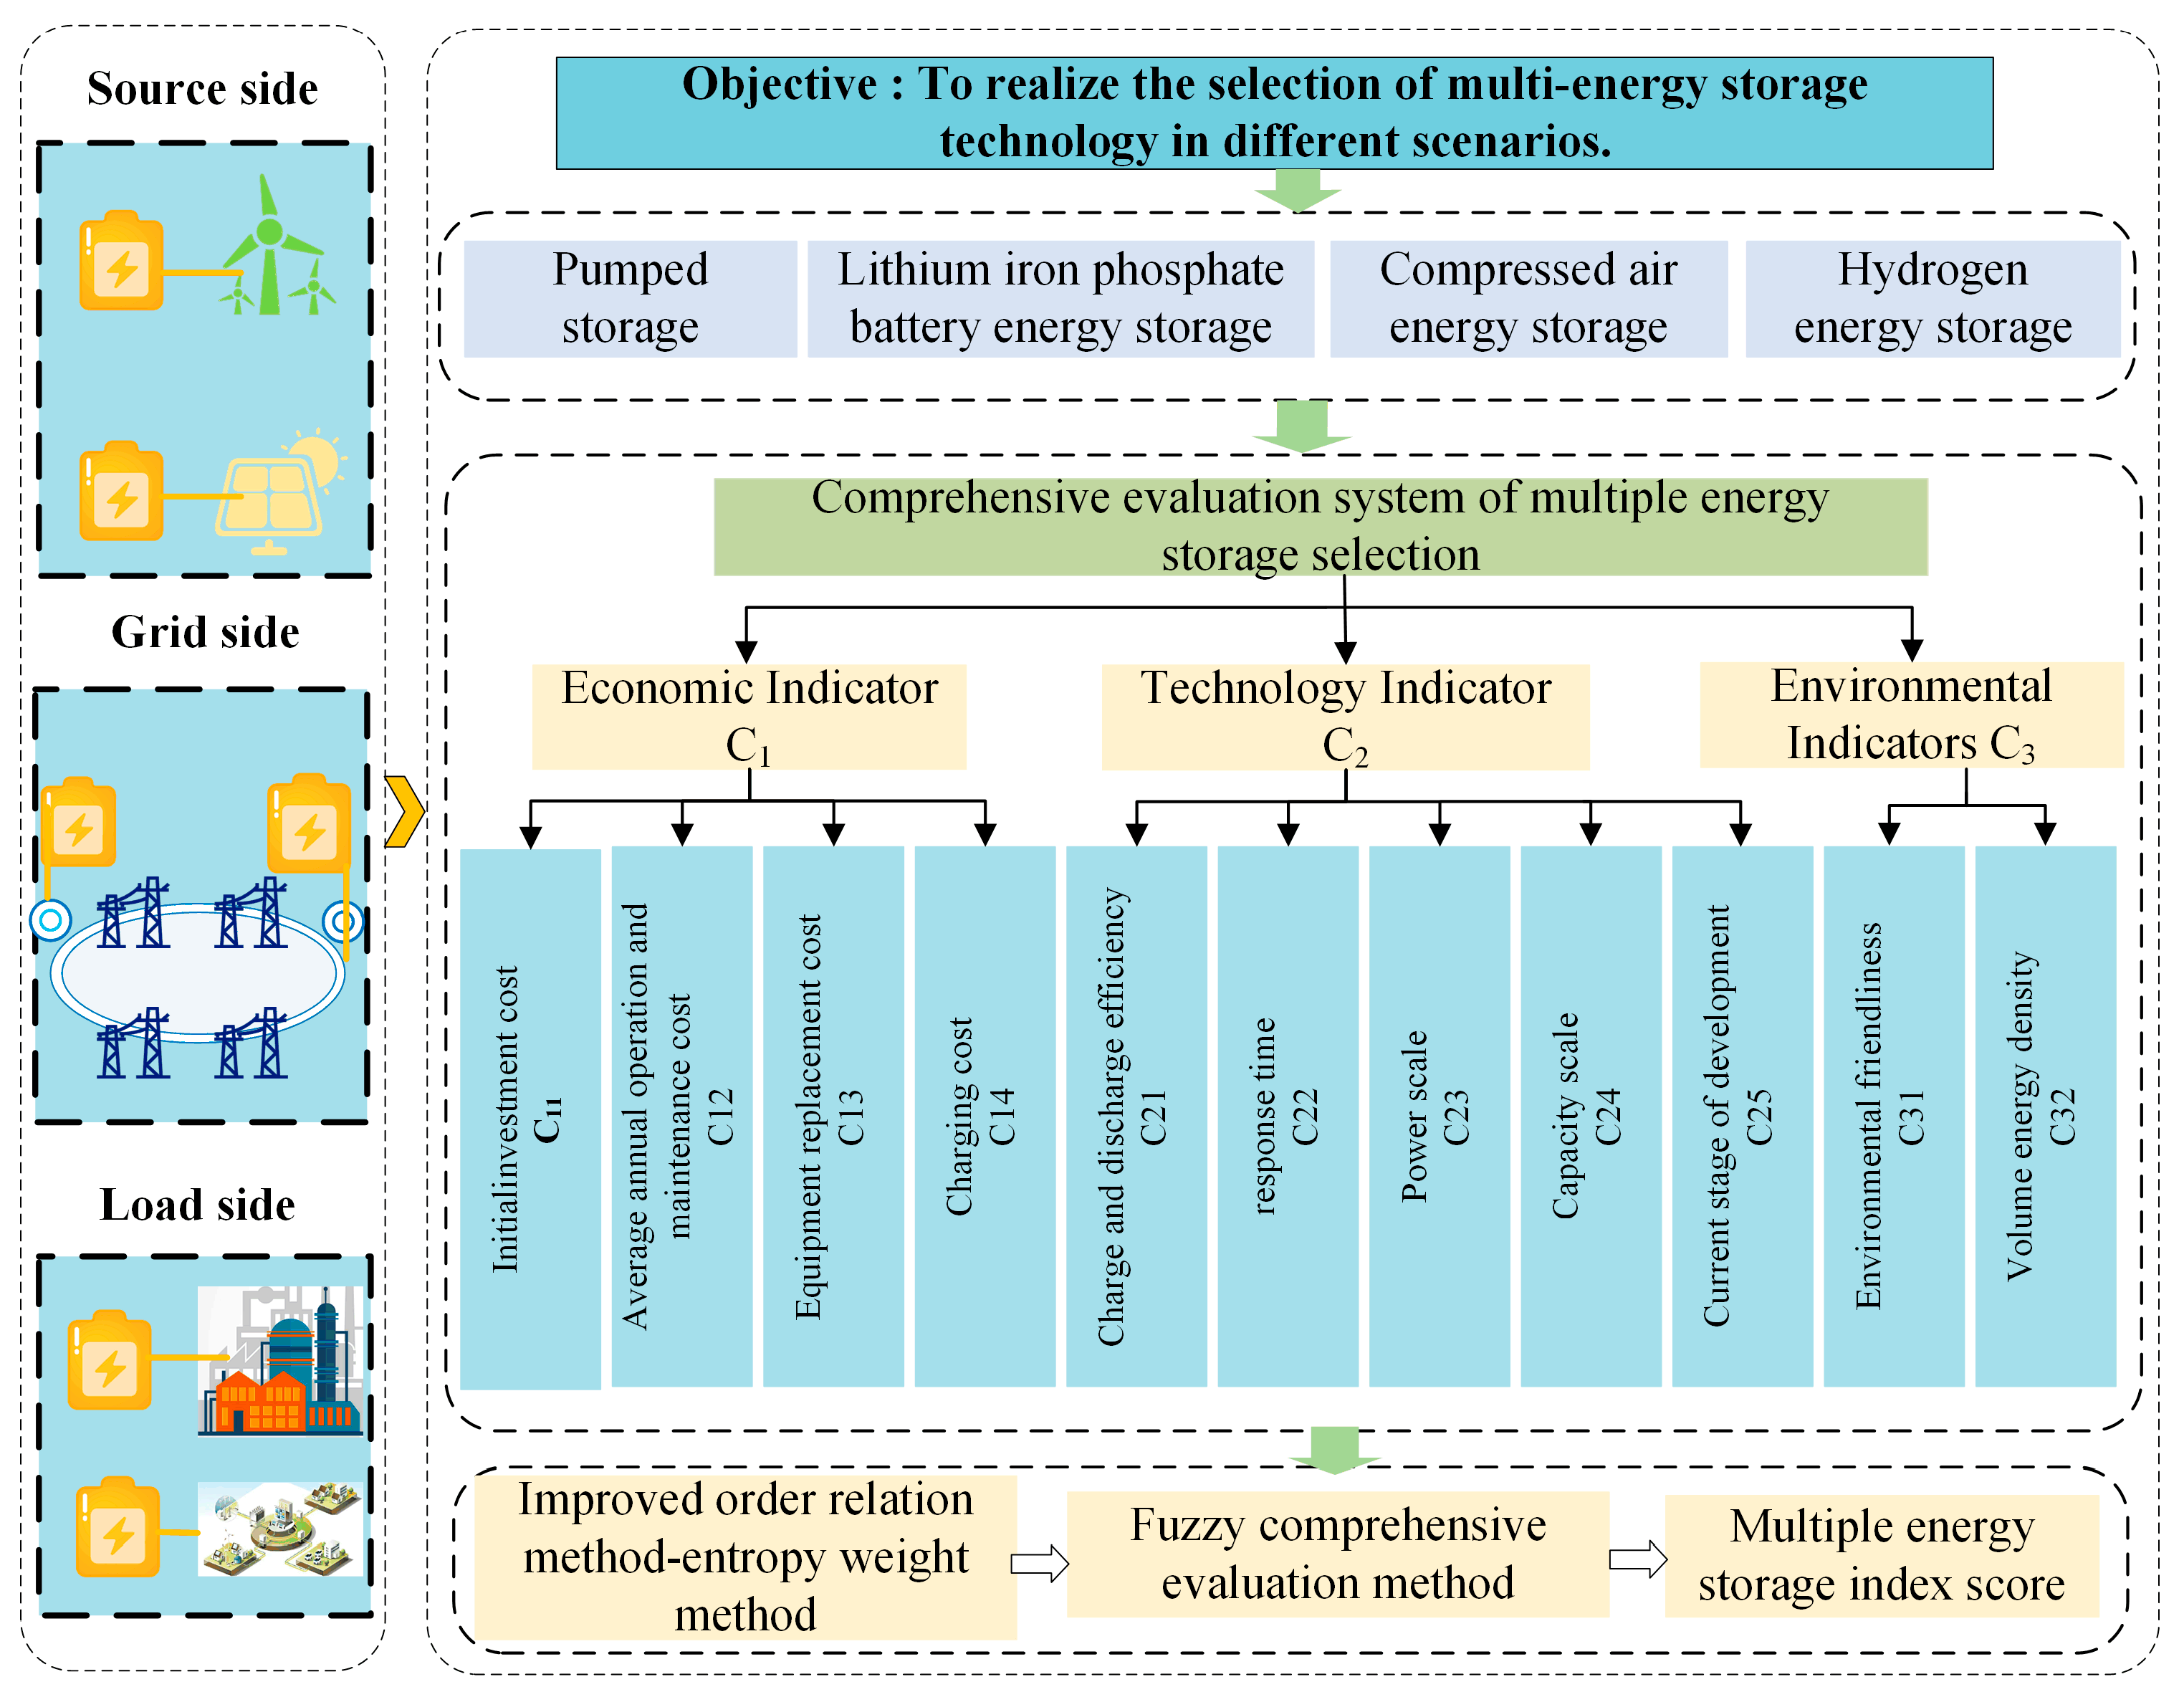
Figure 1 shows the selection and evaluation framework of multi-energy storage technology in typical scenarios such as the source side, grid side, and load side. Focusing on the scientific selection in multiple scenarios, this paper selects four technologies: pumped storage, lithium iron phosphate battery, compressed air energy storage, and hydrogen energy storage; constructs a comprehensive evaluation system based on the three dimensions of economy, technical performance, and environmental impact; and sets up 11 secondary indicators.
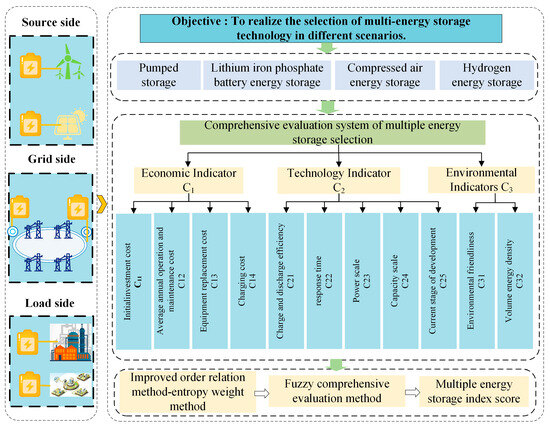
Figure 1.
Multi-energy storage selection framework.
In the evaluation method, the improved G1 (grade one) method and EWM (entropy weight method) are combined to weight the indicators, and the fuzzy comprehensive evaluation method is used to quantify the adaptability scores of different technologies in various scenarios, so as to provide a decision-making basis for energy storage configuration.
The indicators of each dimension are as follows:
- (1)
- Economy (C1): This includes initial investment, operation and maintenance cost, equipment replacement cost, and charging cost, reflecting the capital investment and economic burden of the energy storage system in the whole life cycle.
- (2)
- Technical performance (C2): Covering charge and discharge efficiency, response time, and power and capacity scale, reflecting system operation efficiency, adjustment ability, and scale adaptability.
- (3)
- Environmental impact (C3): Including environmental friendliness and volumetric energy density, reflecting ecological impact and spatial utilization efficiency, respectively, this is an important basis for measuring green and low-carbon attributes. Environmental friendliness is included as a subjective indicator because different types of energy storage technologies have diverse environmental impacts across multiple dimensions, including resource extraction, manufacturing processes, operational emissions, and end-of-life disposal. A subjective indicator that comprehensively reflects environmental impact allows for a more holistic consideration of these factors. In contrast, relying on a single quantifiable metric—such as CO2 emissions per unit of energy or water consumption—may introduce bias due to incomplete data or limited representativeness. This could lead to evaluation bias against certain technologies and compromise the objectivity and fairness of the overall assessment results.
Among the secondary indicators, ‘current development stage’ and ‘environmental friendliness’ are subjective indicators, and their weights are obtained based on expert questionnaire survey statistics and artificial intelligence-assisted analysis. In addition, the improved G1-EWM method is employed to conduct a comprehensive evaluation, allowing for the derivation of corresponding weights in a manner that ensures the assessment is as fair and unbiased as possible. Other indicators are objective indicators, in which economic indicators are quantitatively obtained through life cycle cost analysis; the technical indicators and environmental indicators are mainly determined through extensive literature research and technical parameter data collection to ensure the objectivity and scientificity of the indicator evaluation process.
3. Life Cycle Cost Modeling
3.1. Life Cycle Cost Model of Energy Storage System
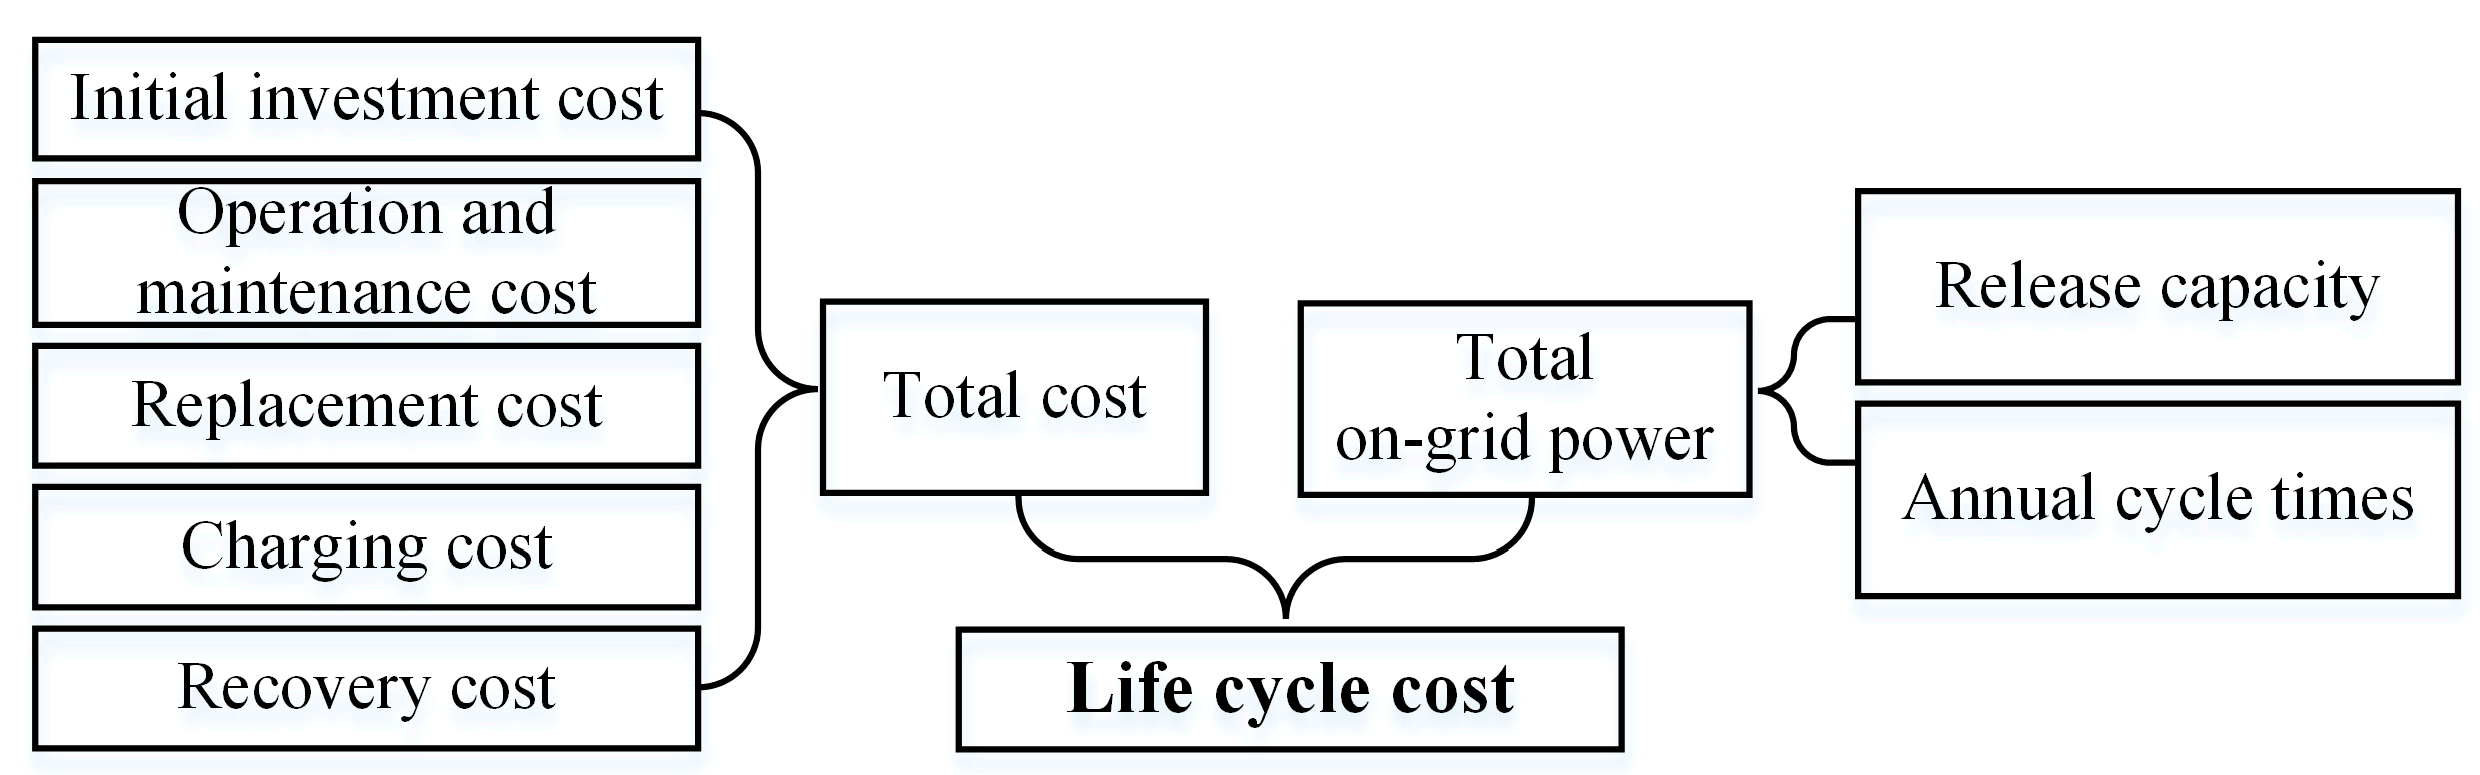
The life cycle cost (LCC) refers to the ratio of the total cost of the energy storage system to the cumulative transmission power throughout the life cycle, and measures the economy of the unit discharge power. The calculation process of the life cycle cost of electricity is shown in Figure 2. The total cost mainly includes initial investment cost , operation and maintenance cost , replacement cost , charging cost , and recovery cost , which are mainly affected by the parameters such as charging and discharging base price and charging and discharging efficiency.
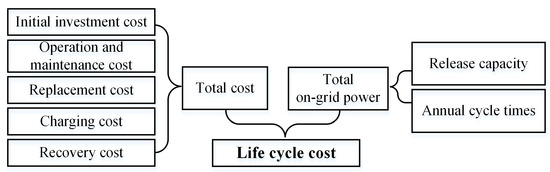
Figure 2.
The calculation process of electricity costs in the whole life cycle.
The cumulative transmission capacity is affected by the release capacity of the energy storage system and the number of cycles. As shown in Figure 2, the whole life cycle cost of electricity can be calculated by the following formula [14]:
where represents the cost of electricity for the whole life cycle, and represents the total on-grid power.
Investment cost refers to the cost incurred in the construction of an energy storage system, including design, equipment, software, engineering, procurement, and construction. The initial investment cost is affected by market and industry changes, which are mainly composed of unit capacity investment cost and unit power investment cost.
where is the unit power investment cost, is the power capacity, is the investment cost per unit capacity, and is the energy storage capacity.
Operation and maintenance costs are the costs of the daily operation of the energy storage system, including operation, maintenance, and labor costs, and it is necessary to consider the discount rate, with the operation time as the conversion benchmark:
where is the annual unit power maintenance cost, is the annual manual operation cost, represents the operation cycle of the energy storage system, and is the discount rate of the energy storage system.
The replacement cost involves the replacement cost after the life of the energy storage component expires. Usually, based on the unit power replacement cost, the cumulative calculation is carried out in combination with the number of replacements in the system operation cycle:
where is the unit power replacement cost, and represents the number of replacements.
Charging cost refers to the cost of the energy storage system to obtain electricity from the power grid or renewable energy, which is affected by electricity price and charging amount. The charging cost will have a great impact on the revenue of the energy storage system. The calculation formula is as follows:
where is the cost of electricity charging, is the charge and discharge depth of the energy storage system, and is the charge and discharge efficiency of the energy storage system.
The recovery cost refers to the expenses incurred at the end of the life cycle of the energy storage system for processes such as dismantling and recycling. It is commonly estimated using a scrap cost rate, which represents the proportion of the recovery cost to the initial construction investment. In this study, the potential salvage value or secondary utilization benefit is not considered.
where is the scrapping cost rate.
Cumulative transmission power refers to the total power transmitted to the outside by the energy storage system during its service life. The effects of annual cycle times, release capacity, self-discharge rate, cycle decay, and other factors should be considered in the calculation.
where is the number of annual cycles of the energy storage system, and is the average annual cycle decay rate of the energy storage system.
3.2. LCC Analysis of Energy Storage System
With the continuous progress of energy storage technology, its application in the power system is becoming more and more extensive. The life cycle cost of energy storage is a key indicator to evaluate the economy of an energy storage system. This indicator is an important basis for judging whether it can be applied on a large scale in the future.
In this study, a fixed discount rate of 8% was selected based on widely used values in energy economic assessments for utility-scale energy storage projects in China. To evaluate the robustness of this assumption, a sensitivity analysis was conducted within the 5–10% range. Results indicate that while the discount rate affects the absolute value of life cycle cost, it has a limited impact on the relative ranking of storage technologies, thus supporting the validity of the comparative findings.
The calculation of the LCC of electricity involves the following factors: initial investment cost, operation and maintenance cost, replacement cost, charging cost, and recovery cost. Technical parameters such as energy storage efficiency and discharge depth also have a significant impact on the cost of electricity. In this paper, the relevant parameters using Table 1.

Table 1.
Calculate the relevant parameters of each energy storage system.
The energy storage technology has its own characteristics in terms of cost composition and economy. For example, Figure 3a shows that in the lithium iron phosphate battery energy storage, the initial investment and charging cost account for about 74%. Limited by the battery life and replacement frequency, the maintenance expenditure is high, and the overall cost of electricity is high. It is more suitable for short-term frequency modulation, peak shaving, valley filling, and other flexible scenarios.
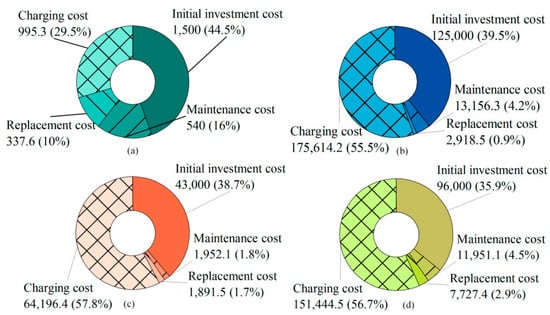
Figure 3.
Total cost distribution of energy storage system: (a) Lithium iron phosphate battery energy storage, (b) pumped storage, (c) compressed air energy storage, and (d) hydrogen energy storage.
As shown in Figure 3b, with a service life of more than 30 years and extremely low operation and maintenance costs, pumped storage has a significant economic advantage under low electricity price charging conditions, which accounts for more than 90% of the electricity cost. It is the first choice for long-period and large-scale energy storage.
Compressed air energy storage is also dominated by charging costs, accounting for nearly 60% as depicted in Figure 3c. It has a long equipment life and low maintenance costs. The cost of electricity is close to pumped storage in situations such as abandoning wind and abandoning light. It has the advantages of a short construction period and small investment intensity, and is suitable for wide deployment.
In contrast, hydrogen energy storage currently has the highest cost per kilowatt hour, and the proportion of charging and initial investment is relatively large. Limited by the maturity of key technologies, the economy is not prominent as demonstrated in Figure 3d. But it has considerable potential in future scenarios such as seasonal and long-term energy storage, and has good development prospects.
3.3. Analysis of the Influence of the LCC Parameters of the Energy Storage System
Taking the lithium iron phosphate battery energy storage system as an example, the changes of the life cycle energy storage cost under different annual cycle times, different operating efficiency, and different charging costs are analyzed in detail [25].
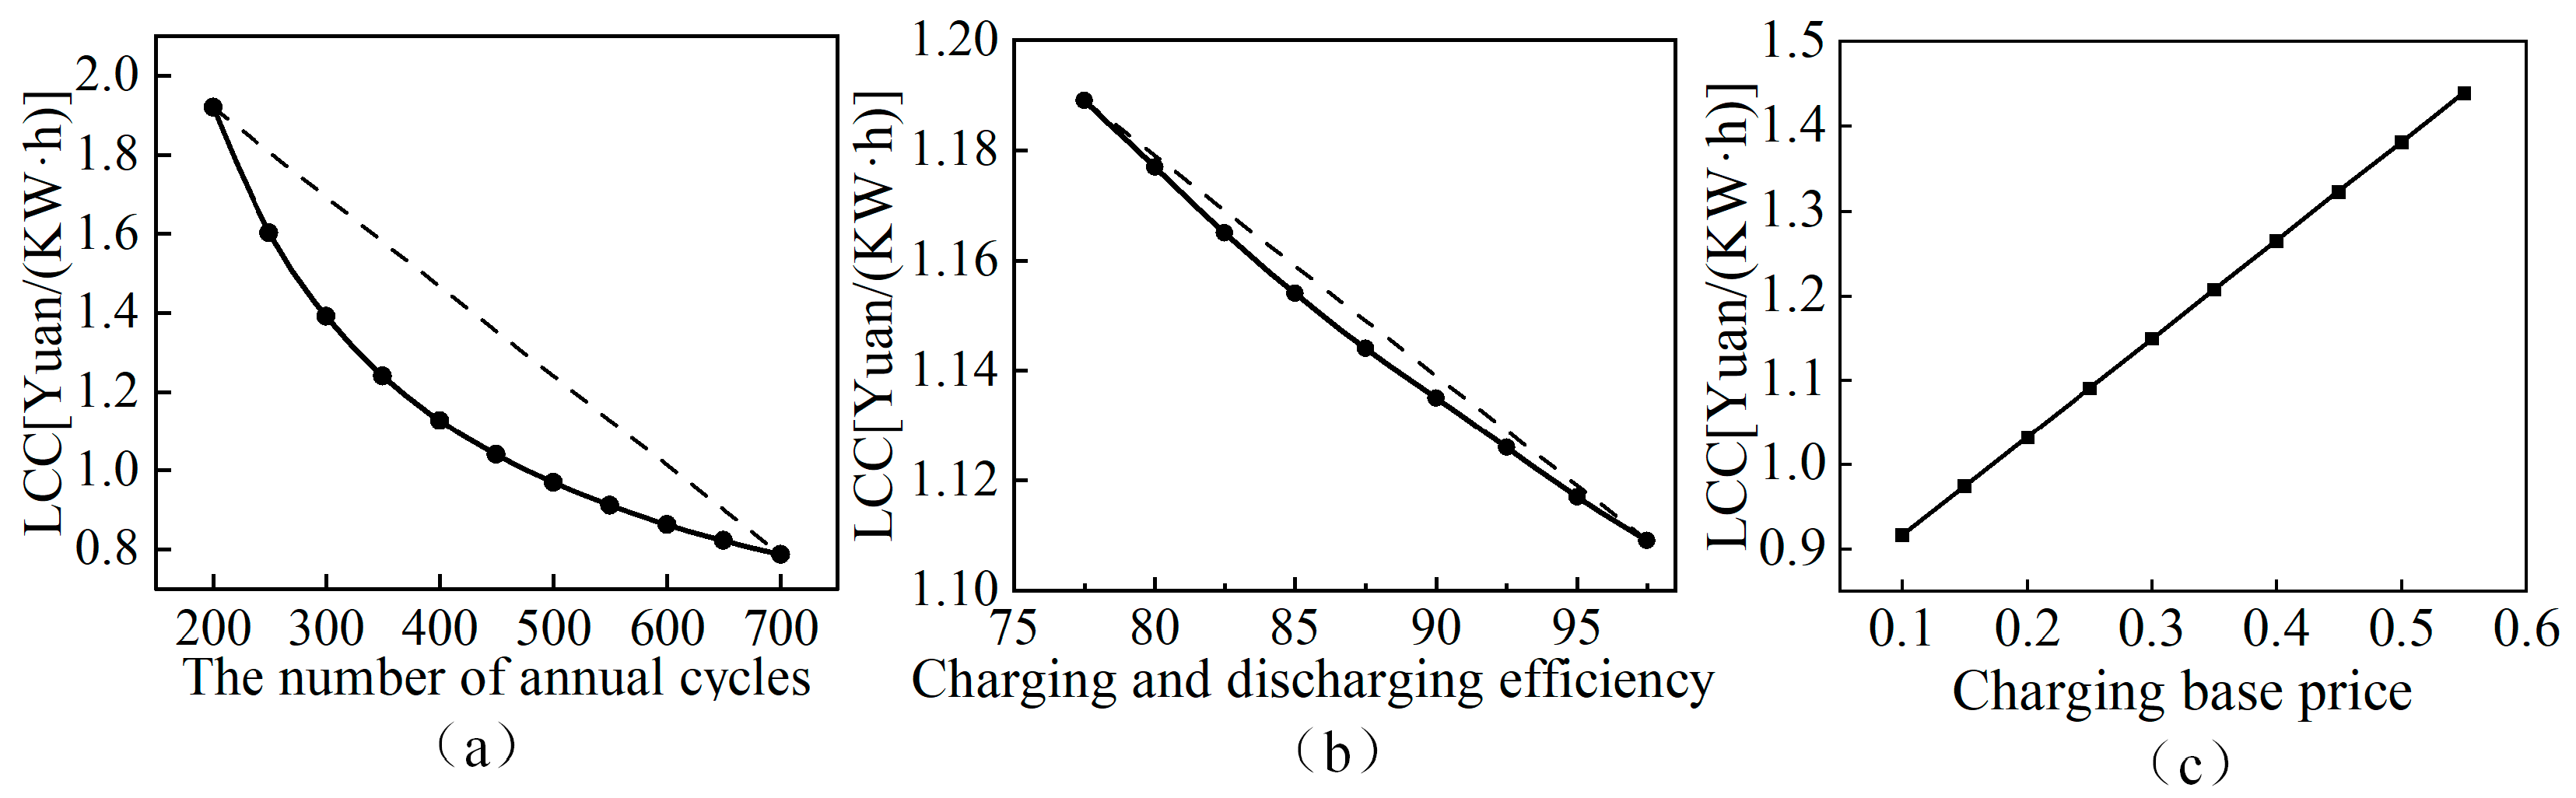
Figure 4a–c show the variation trend of the cost of electricity with the number of annual cycles, charging and discharging efficiency, and charging base price, respectively. Figure 4a shows that the increase in the number of annual cycles can significantly reduce the cost of electricity per degree, but the decline slows down when the number of cycles is high. Figure 4b shows that the improvement of charge and discharge efficiency can slightly reduce the cost of electricity, but the impact is limited. Figure 4c shows that the cost of electricity is linearly positively correlated with the charging base price, and reducing the price can effectively reduce the cost of electricity.
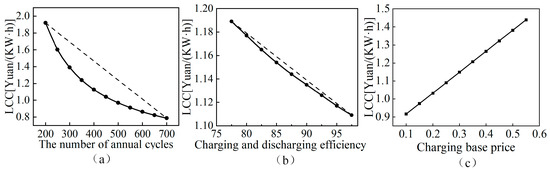
Figure 4.
The trend of life cycle electricity cost changing with single parameter of system.
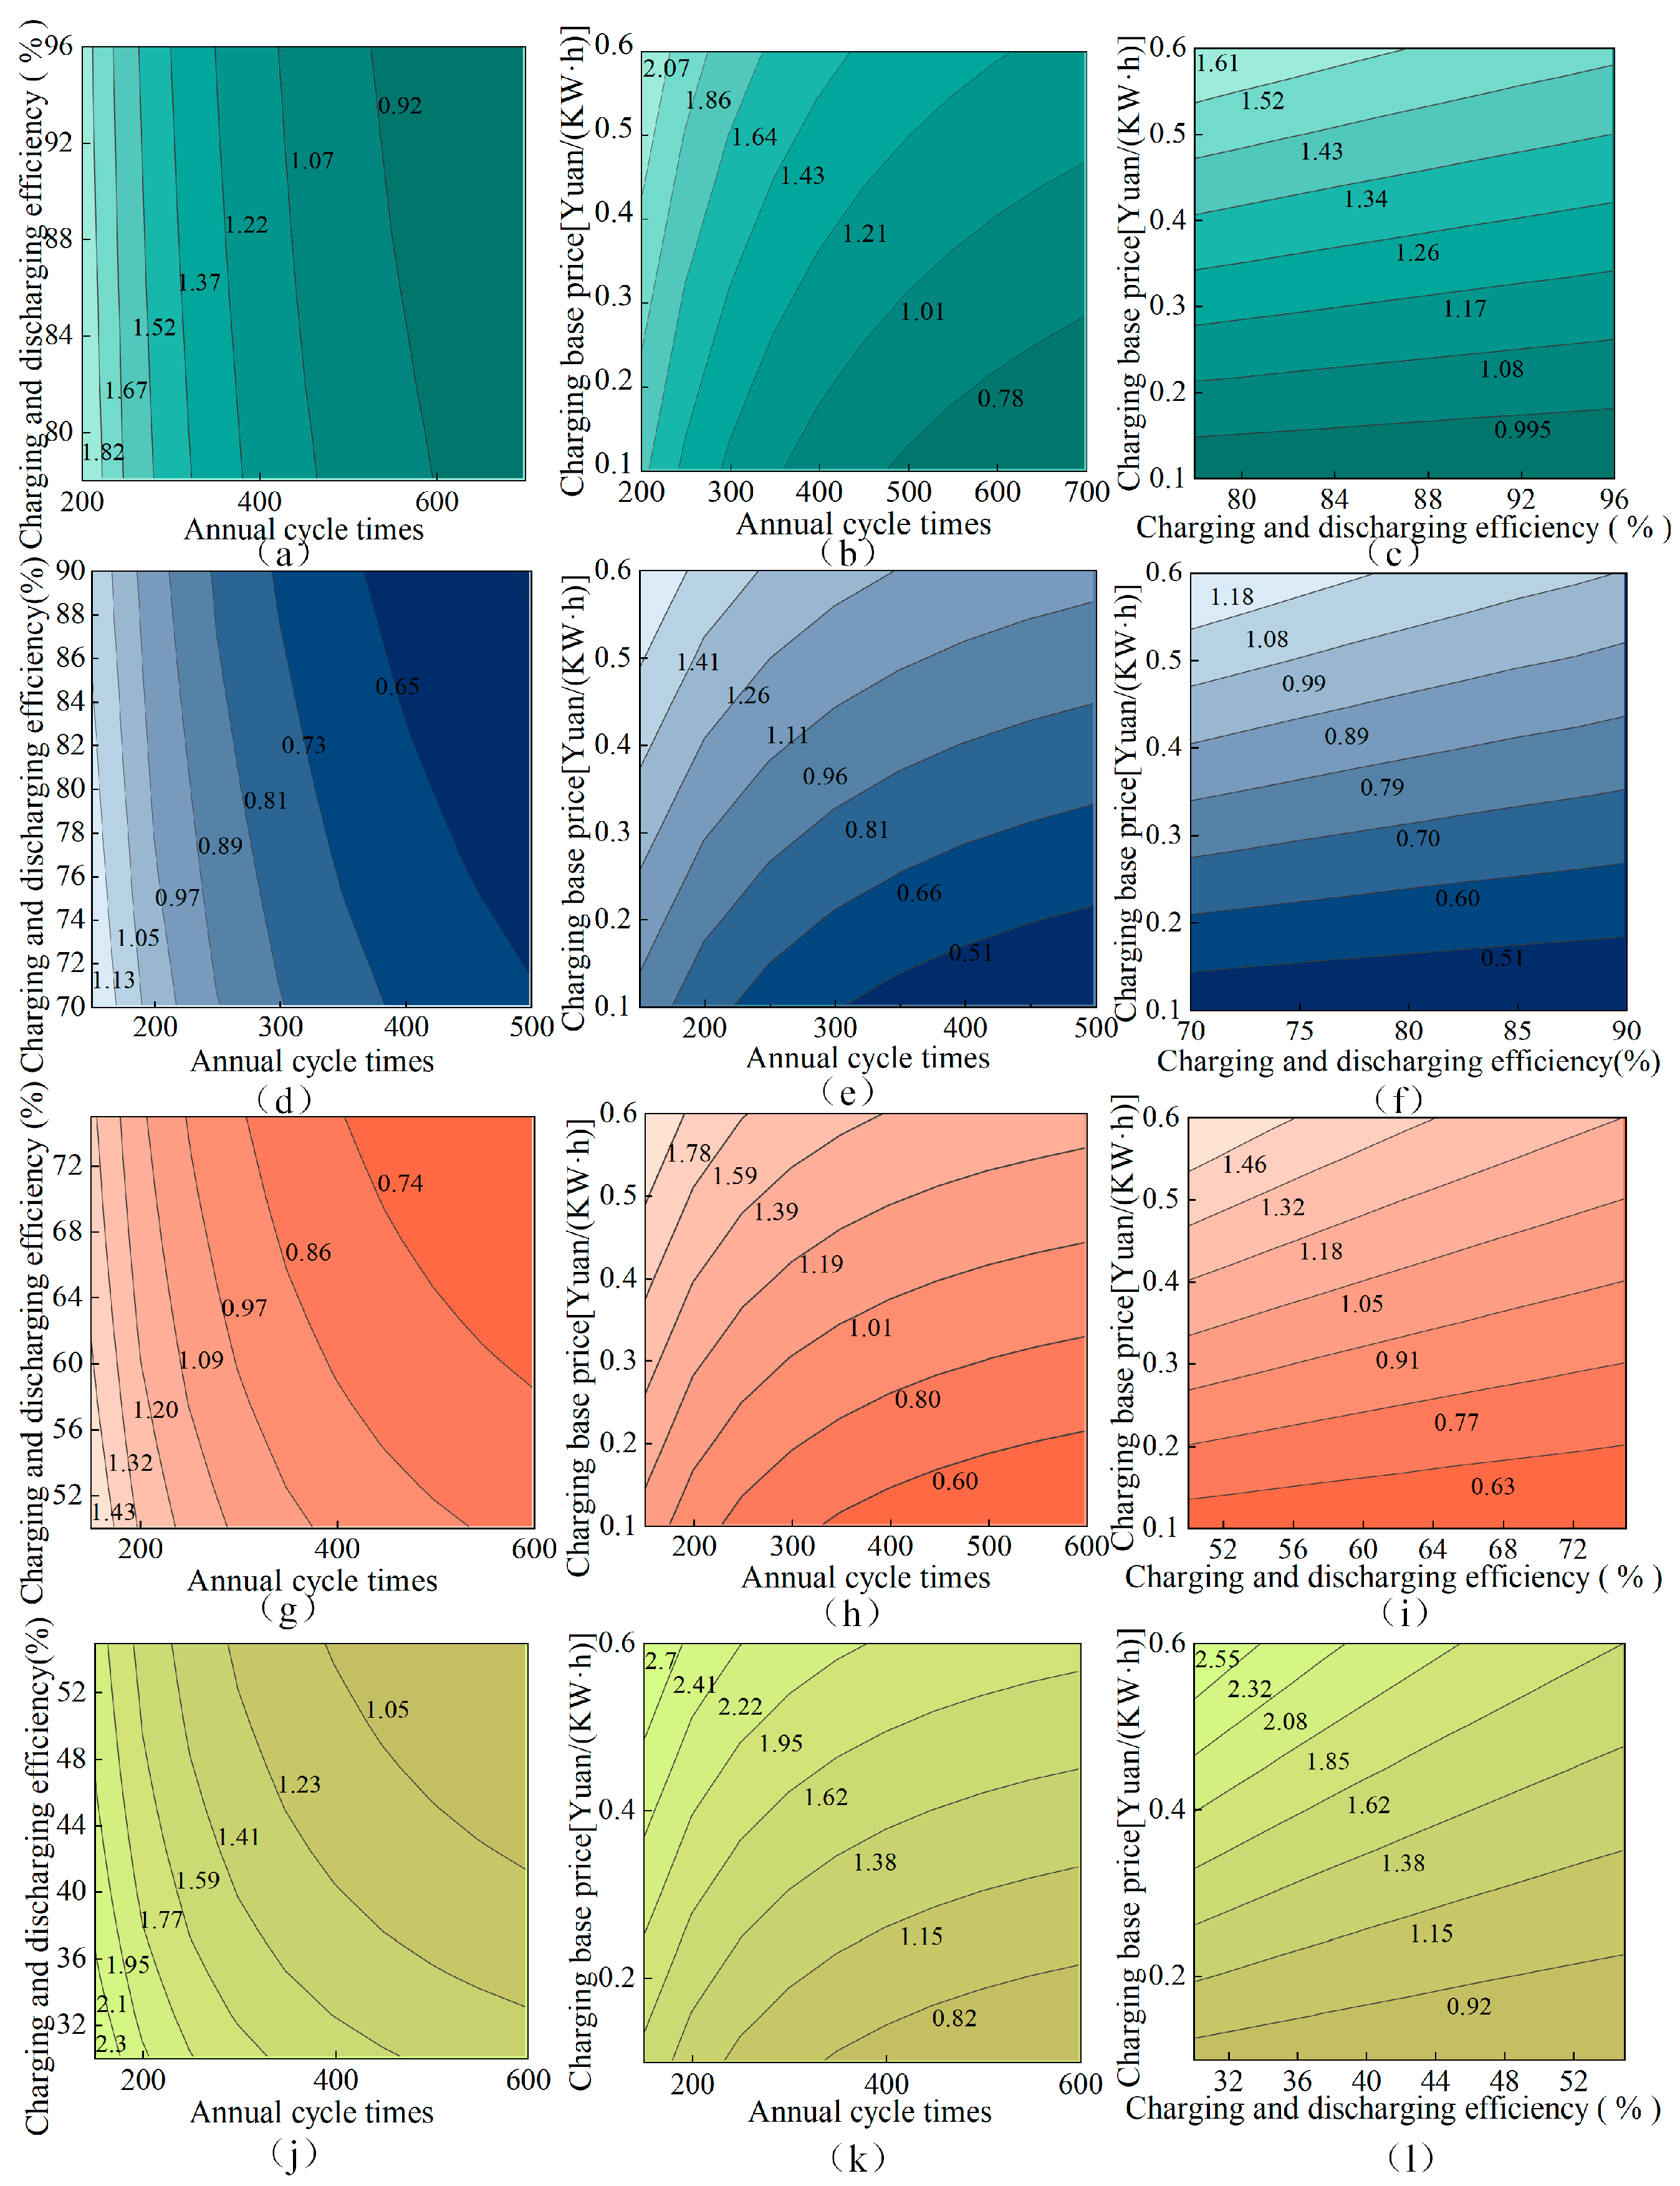
Figure 5 shows the annual cycle number and charge-discharge efficiency, the annual cycle number and charging base price, and the influence of charge-discharge efficiency and charging base price on the cost of electricity. The results show that the sensitivity of electricity cost to each parameter is ranked as follows: annual cycle number > charging base price > charging and discharging efficiency. This shows that optimizing the economy of energy storage should first increase the number of annual cycles, then reduce the charging price, and finally consider improving the charging and discharging efficiency, so as to maximize cost-effectiveness.
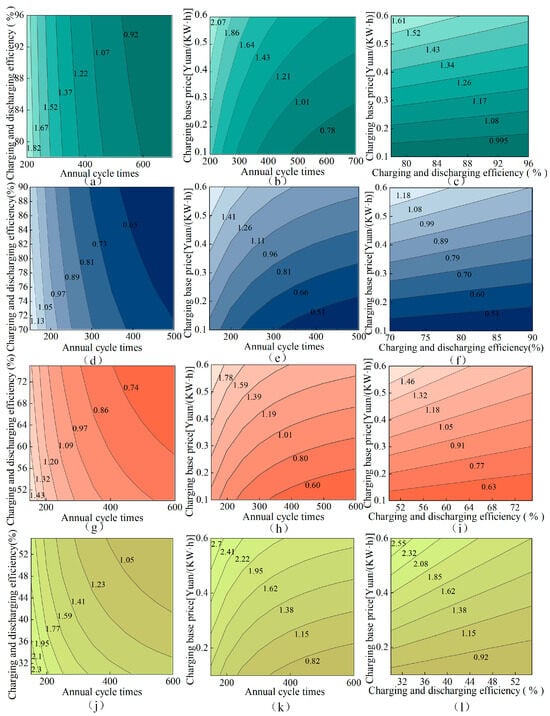
Figure 5.
Sensitivity analysis plots of the life cycle energy storage cost of multi-element energy storage with the change in two parameters of the system: (a–c) lithium iron phosphate battery energy storage, (d–f) pumped storage, (g–i) compressed air energy storage, and (j–l) hydrogen energy storage.
3.4. Comprehensive Comparison and Analysis
The following results are obtained by calculating the basic data of each energy storage in the above content:
As shown in Table 2, in the comparison of the life cycle cost of the energy storage system, different energy storage technologies show significant differences in different situations. When the charging price is included, the cost of lithium iron phosphate battery energy storage and hydrogen energy storage is the highest, which is 1.135 CNY/kWh and 1.157 CNY/kWh, respectively, which is mainly affected by the high initial investment and the rising operation cost of electricity price. In contrast, pumped storage (0.667 CNY/kWh) and compressed air energy storage (0.853 CNY/kWh) have lower costs, show stronger economy with long life and low unit capacity investment, and are suitable for electricity price-sensitive large-scale energy storage scenarios.
Table 2.
Electricity cost of each energy storage in different scenarios.
When charging with zero-cost electricity (such as abandoning wind and solar), the cost per kWh decreases significantly. Pumped storage and compressed air energy storage are reduced to 0.297 CNY/kWh and 0.360 CNY/kWh, respectively, which are much lower than lithium iron phosphate battery energy storage (0.80 CNY/kWh) and hydrogen energy storage (0.501 CNY/kWh). It has more cost advantages in new energy consumption and grid peak shaving scenarios.
When the charging price is included but the discount rate is zero, the cost of electricity consumption decreases as a whole, reflecting the significant impact of financing cost on the economy of energy storage. At this time, pumped storage (0.471 CNY/kWh) and compressed air energy storage (0.655 CNY/kWh) still have obvious advantages, while lithium iron phosphate battery energy storage (0.910 CNY/kWh) and hydrogen energy storage (0.909 CNY/kWh) cost close to, but still significantly more than, the former two. Large-scale energy storage is more economically competitive in a low financing cost environment and is suitable for long-term operation projects.
Under the idealized situation (zero electric charging price + zero discount rate), the cost of electricity is reduced to the lowest, and the pumped storage and compressed air energy storage are only 0.098 CNY/kWh and 0.158 CNY/kWh, respectively, far lower than the lithium iron phosphate battery energy storage (0.573 CNY/kWh) and hydrogen energy storage (0.248 CNY/kWh), further highlighting the significant advantages of large-scale energy storage under the conditions of long life and low financing cost.
On the whole, pumped storage and compressed air energy storage have the lowest cost and the strongest economy, which are suitable for long-period and large-scale energy storage, especially in the scenario of abandoning wind and light. Lithium iron phosphate battery has a high energy storage cost, but its response speed is fast, which is suitable for short-period frequency modulation and peak shaving. Hydrogen energy storage has the highest cost, but it has certain potential competitiveness in the field of long-term energy storage.
The assumption of zero charging cost in the ‘abandoned wind and solar’ scenario is based on the fact that curtailed renewable energy typically has no market value and can be accessed at no marginal cost. This setting is widely adopted to assess the upper bound of economic benefit for storage systems under high-renewable curtailment conditions. However, as illustrated in Figure 4c, introducing partial charging costs due to grid mix or access fees will linearly increase the LCC. Despite this, the relative performance ranking and trends across storage technologies remain stable.
4. Multi-Energy Storage Technology Selection
4.1. Improved G1–EWM Comprehensive Weighting Method
The methods for determining the indicator weight are usually divided into subjective, objective, and comprehensive weighting methods [26]. The subjective weighting method relies on expert experience for weight distribution, and the common methods are the G1 method and the analytic hierarchy process. The objective weighting method is based on the method of data statistics to calculate the weight. The common methods are the entropy weight method and the coefficient of variation method. The comprehensive weighting method combines the subjective and objective weighting methods and uses the results to correct each other.
Multi-energy storage technology has multi-dimensional attribute characteristics, and its performance varies greatly in different application scenarios. Relying solely on subjective empowerment will have subjective preferences, while purely using objective empowerment may ignore industry experience [27]. The comprehensive weighting method can comprehensively consider expert opinions and data-driven results to achieve a more scientific and reasonable weight distribution.
Therefore, this study chooses the comprehensive weighting method, in which the subjective weighting method chooses the G1 method, which can be improved by using the triangular fuzzy number, and the objective selection method chooses the entropy weight method. Finally, the fuzzy comprehensive evaluation method is used to quantify the factors that are difficult to be quantitatively analyzed in the economic and technical characteristics of energy storage, so as to obtain comprehensive evaluation results.
4.1.1. Improved G1 Method
The G1 method is a method to determine the weight by the importance ratio of adjacent indicators [28]. However, this method requires specific values for the weight ratio of adjacent indicators, and expert experience judgment often has certain ambiguity. If the experts’ evaluations of the importance of adjacent indicators are not uniform, it is difficult to obtain consistent results. Therefore, this study adopts the G1 method improved by the fuzzy Delphi method [29]. The conservative and optimistic evaluation parameter bounds provided by both experts and the Deepseek model are presented in Appendix B. Based on these bounds, the following procedure is applied: First, the maximum and minimum values of the conservative estimates, as well as those of the optimistic estimates, are compared, and the geometric mean values for both conservative and optimistic intervals are calculated. Second, the maximum value of the conservative estimate is compared with the minimum value of the optimistic estimate. If there is no numerical overlap between the two intervals and the expert evaluations are deemed sufficiently consistent, a consistency importance coefficient can be calculated, which is then used to derive the indicator weight. In addition, the maximum values of both the conservative and optimistic estimates are compared. If there is an overlap, the consistency importance coefficient can be computed; otherwise, it is necessary to re-consult the experts to revise the evaluation parameter bounds for the given indicator. Once the consistency importance coefficient is determined, the final indicator weight can be calculated using the improved G1 method. The detailed calculation steps are as follows:
- (1)
- Determine the ranking of the indicators.
It is assumed that there are n evaluation indicators at a certain level in a comprehensive indicator evaluation system, respectively. The priority between different evaluation indicators is judged by experts. If the importance degree is greater than usual, the order relationship is .
- (2)
- Constructing triangular fuzzy numbers.
Experts need to give a conservative value and an optimistic value , for the weight ratio of adjacent indicators; that is, experts believe that the weight ratio of one indicator to another indicator fluctuates between . Thus, the triangular number ambiguity of the weight coefficient can be constructed:
where k is the number of experts participating in the evaluation, and are the conservative and optimistic estimates of the ratio of adjacent weights by the kth expert,
and are the minimum and maximum values of conservative estimates, and are the minimum and maximum values of the optimistic estimation, and are the geometric means of the conservative and optimistic estimates.
- (3)
- Fuzzy judgment of the weight ratio of adjacent indicators.
Since the weight ratio of adjacent indicators is no longer a single determined value, but an interval or relative range, it is necessary to make a fuzzy comprehensive judgment on the obtained triangular fuzzy numbers to further obtain a more robust weight ratio. The judgment method is as follows:
(1) When , it means that the judgment interval does not overlap numerically and the expert evaluation results are consistent; then the consistency importance coefficient is as follows:
(2) When , there may be overlap or conflict between the conservative interval and the optimistic interval. Therefore, it is necessary to calculate the gray range value and the intermediate range value to determine whether the expert evaluation is effective:
If , there is an overlapping interval between the judgments of the experts, and the consistency importance coefficient can be calculated:
If , the judgment differences between experts are too large, and it is necessary to re-consult expert opinions for renegotiation or eliminate abnormal results.
- (4)
- Calculating Indicator Weight :
4.1.2. Comprehensive Empowerment Method
According to the entropy weight method, the objective indicator weight can be determined, and the specific steps of the entropy weight method are referred to [30]. Based on the indicator weight obtained by the G1 method and the EWM, the comprehensive weight can be calculated:
where is the weight obtained by the objective weighting method, is the weight obtained by the subjective weighting method, and is the weight obtained by the comprehensive weighting method.
The net weight value of the secondary indicator is as follows:
where is the net weight of the secondary indicator, is the weight of the first-level indicator, and is the weight of the secondary indicator.
4.2. Fuzzy Comprehensive Evaluation Method
The fuzzy comprehensive evaluation method is based on fuzzy mathematics, applying the principle of fuzzy relation synthesis, quantifying some factors with unclear boundaries and difficulty in quantification, and starting from the membership levels of multiple factors to comprehensively evaluate the evaluated objects. This method constructs an evaluation matrix based on a factor set and a judgment set, which is then combined with indicator weights to calculate the final indicator scores. The factor set is established according to the indicators defined within the comprehensive evaluation framework. The judgment set is derived from the Comprehensive Value and Policy Study of Energy Storage under China’s Dual-Carbon Goals, which summarizes generalized evaluation criteria based on a comparative analysis of the current development status of various energy storage technologies. The specific judgment standards can be found in Appendix A [31]. The main process is as follows:
(1) It is assumed that there are n factors in the evaluation object, which are expressed as . Experts need to grade the performance of the evaluation object according to various factors, so it is necessary to construct a factor set and a judgment set as the basis of fuzzy comprehensive evaluation:
where U is the factor set, V is the judgment set, which can be obtained from Schedule 1, and v is the comment level.
(2) The evaluation indicator of each factor will be evaluated according to V, and the membership degree will be obtained. The evaluation matrix R can be obtained by judging all factors:
where is the membership vector of one of the factors.
(3) According to the weight coefficient obtained by the comprehensive weighting method and the evaluation matrix of the fuzzy rating, the evaluation results can be obtained:
where is a composition operator, which can be replaced according to the information of R, and B is the evaluation result.
5. Typical Application Scenario Analysis
In this study, the performance of multi-energy storage is analyzed in three typical scenarios of source, network, and load, which are the EES for renewables scenario, the power frequency regulation scenario, and the price arbitrage scenario. The source side is represented by the EES for the renewables scenario, the grid side takes the frequency regulation scenario as a typical application scenario, and the load side takes the price arbitrage scenario as a typical application scenario. The economic parameters of multi-energy storage can be obtained from Section 3.4 and the technical parameters and environmental parameters refer to the current development status [32,33]. Table 3 presents the basic parameters of objective indicators in the characteristics of multi-energy storage technology. Table 4 presents the basic parameters of subjective indicators.
Table 3.
Objective indicators.
Table 4.
Subjective indicators.
5.1. Indicator Weight of Different Application Scenarios
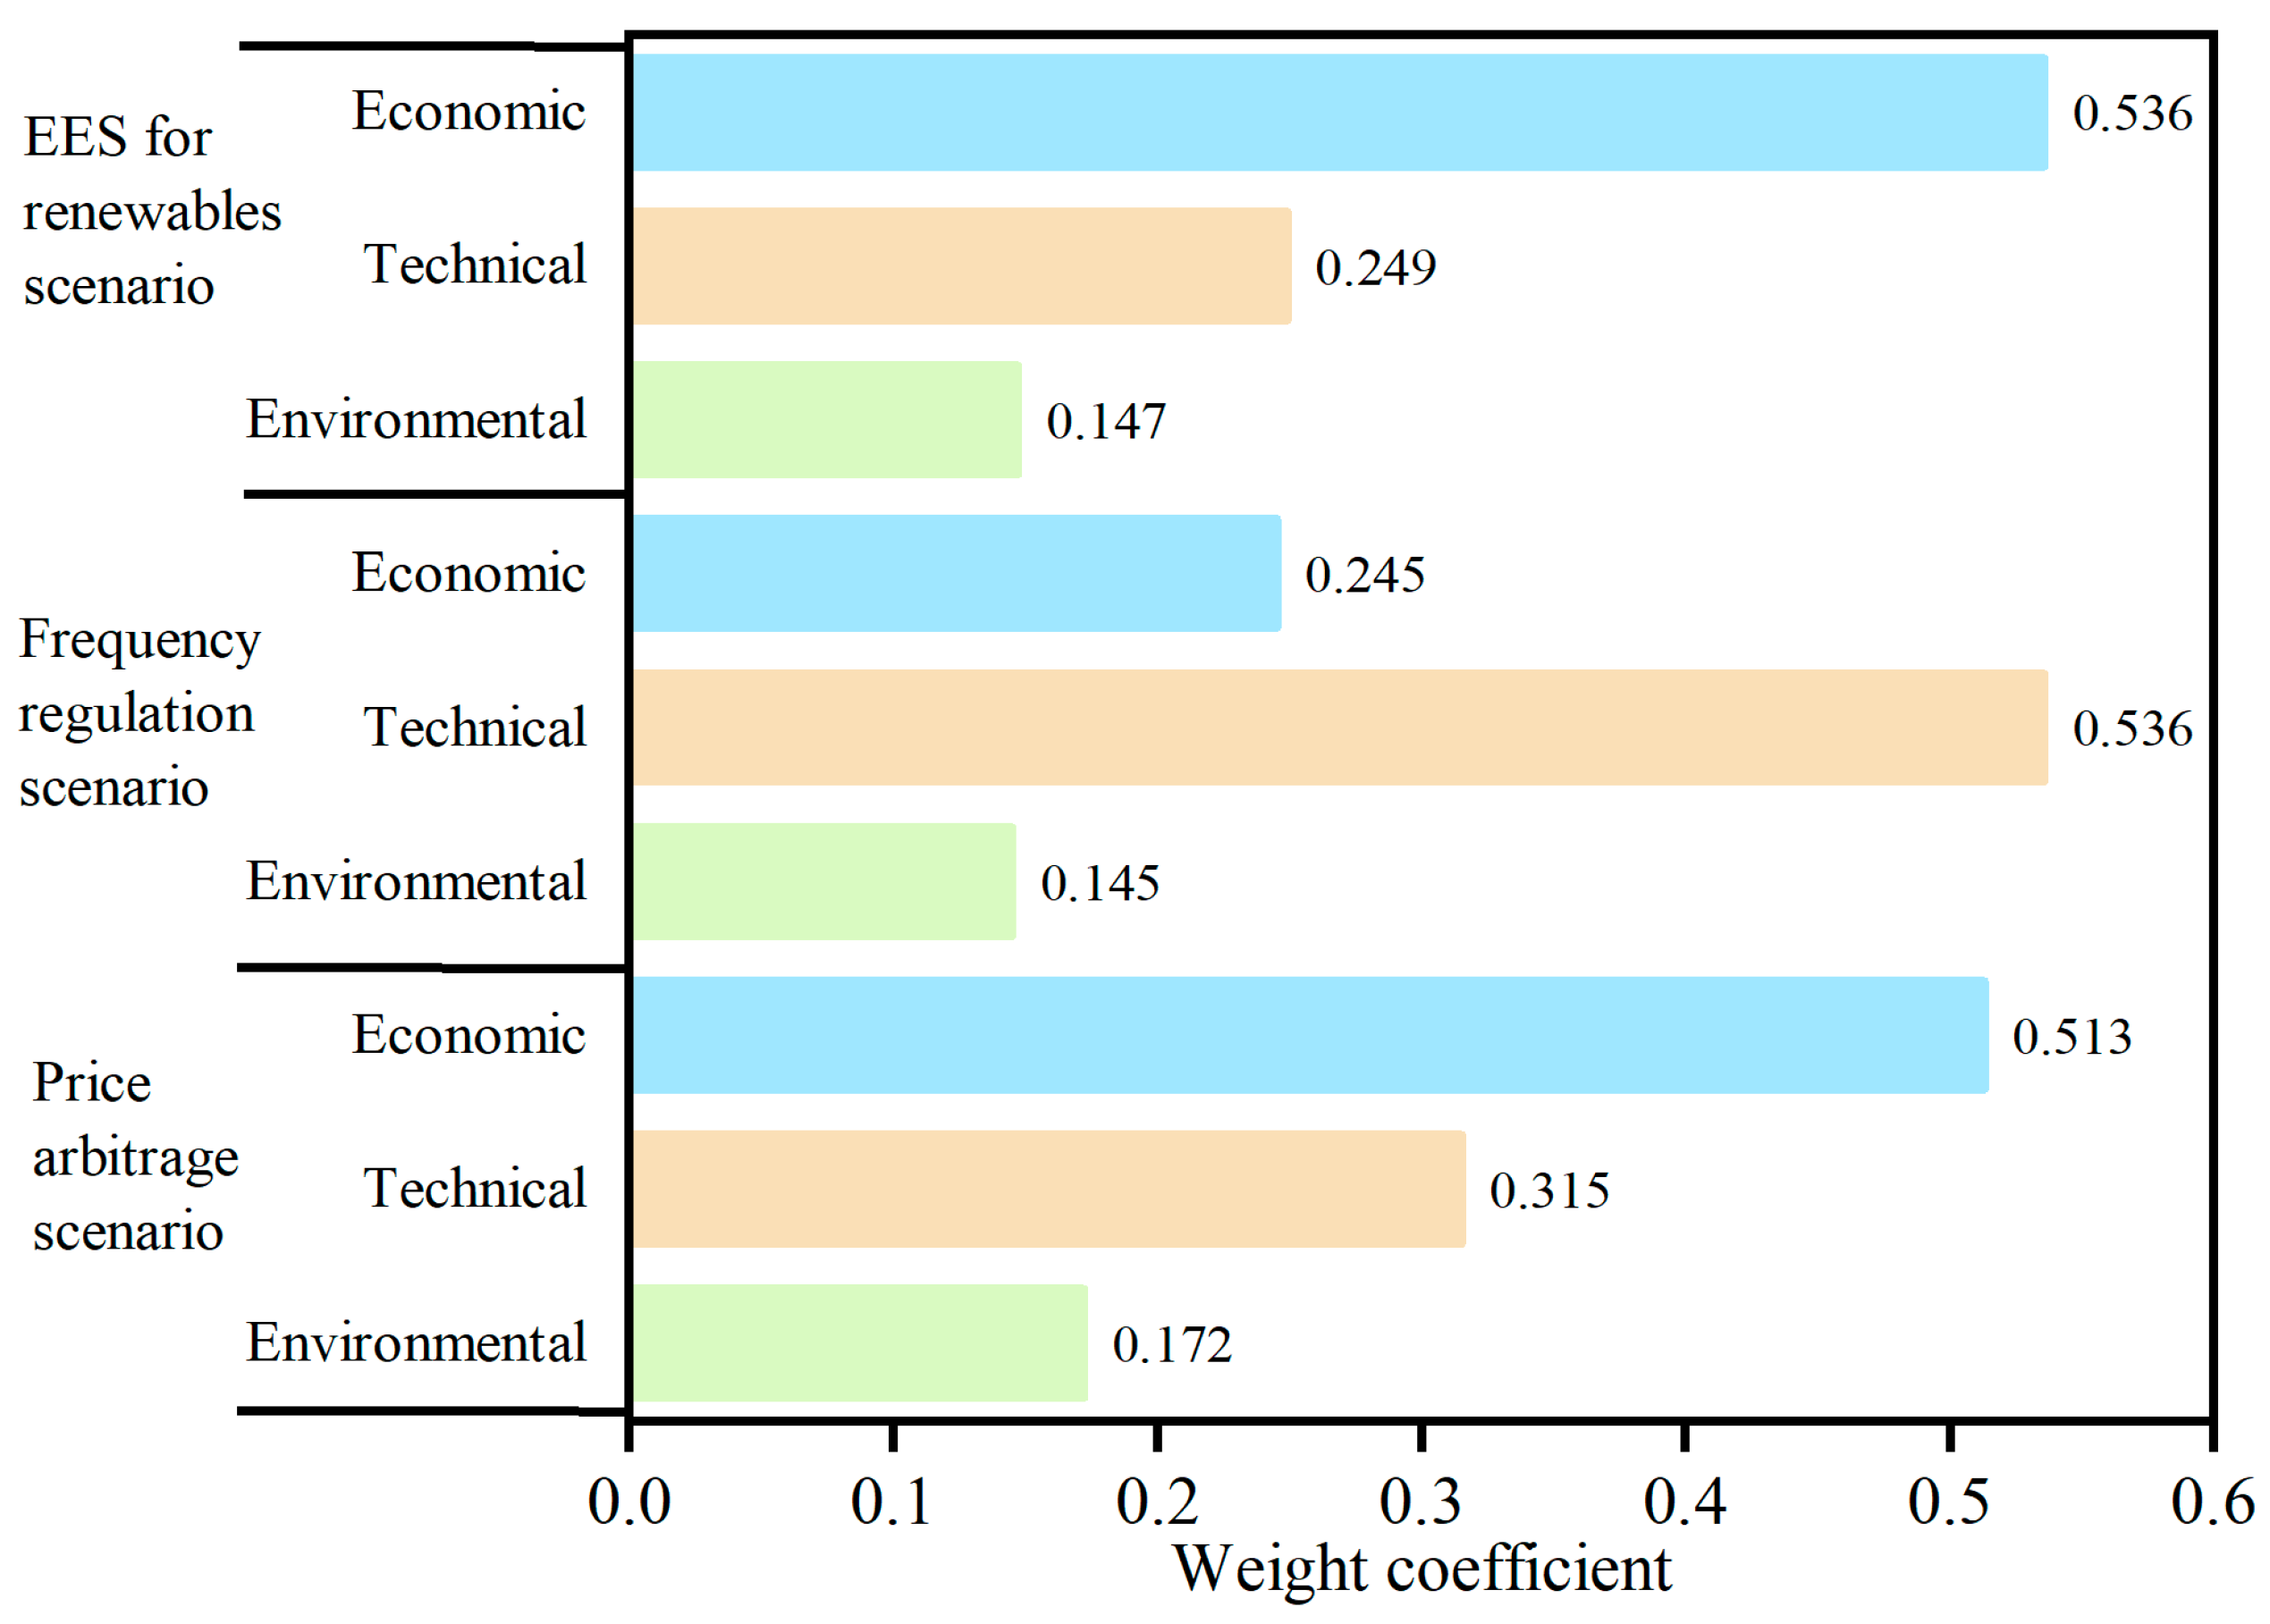
Figure 6 is the first-level indicator weight determined in different application scenarios. The weights of the primary indicators were jointly determined through expert judgment and artificial intelligence-assisted evaluation. Specifically, both experts and the Deepseek system independently provided a plausible fluctuation range for each indicator’s weight, based on which corresponding triangular fuzzy numbers were constructed. These fuzzy numbers were then compared, and a unified triangular fuzzy number was derived that encompassed both expert opinions and AI-derived assessments, thereby integrating human expertise with machine intelligence. Based on this fusion approach, scenario-specific triangular fuzzy numbers for each indicator were established (as detailed in Appendix B). Finally, the subjective weighting method was applied to compute the final weights of the indicators.
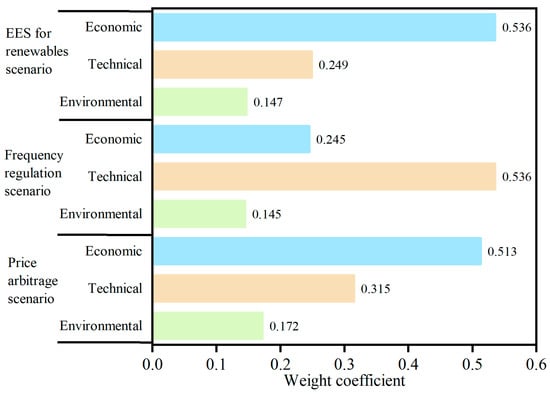
Figure 6.
Comparison of first-level indicator weights in different scenarios.
It can be seen that due to the different demand for energy storage in different scenarios, there is a big difference in the weight between the indicators. In the scenario of EES for the renewables scenario and price arbitrage scenario, the weight of the economic indicator (C1) is far more than that of other indicators, because the two application scenarios are sensitive to return on investment and cost control. In the power frequency regulation scenario, the technical indicator weight (C2) is the highest (0.536), which is due to the high requirements of the energy storage technology performance in this scenario. The environmental indicator (C3) has a low weight in all three scenarios, indicating that environmental factors are still not the dominant factor in decision-making in current practical applications.
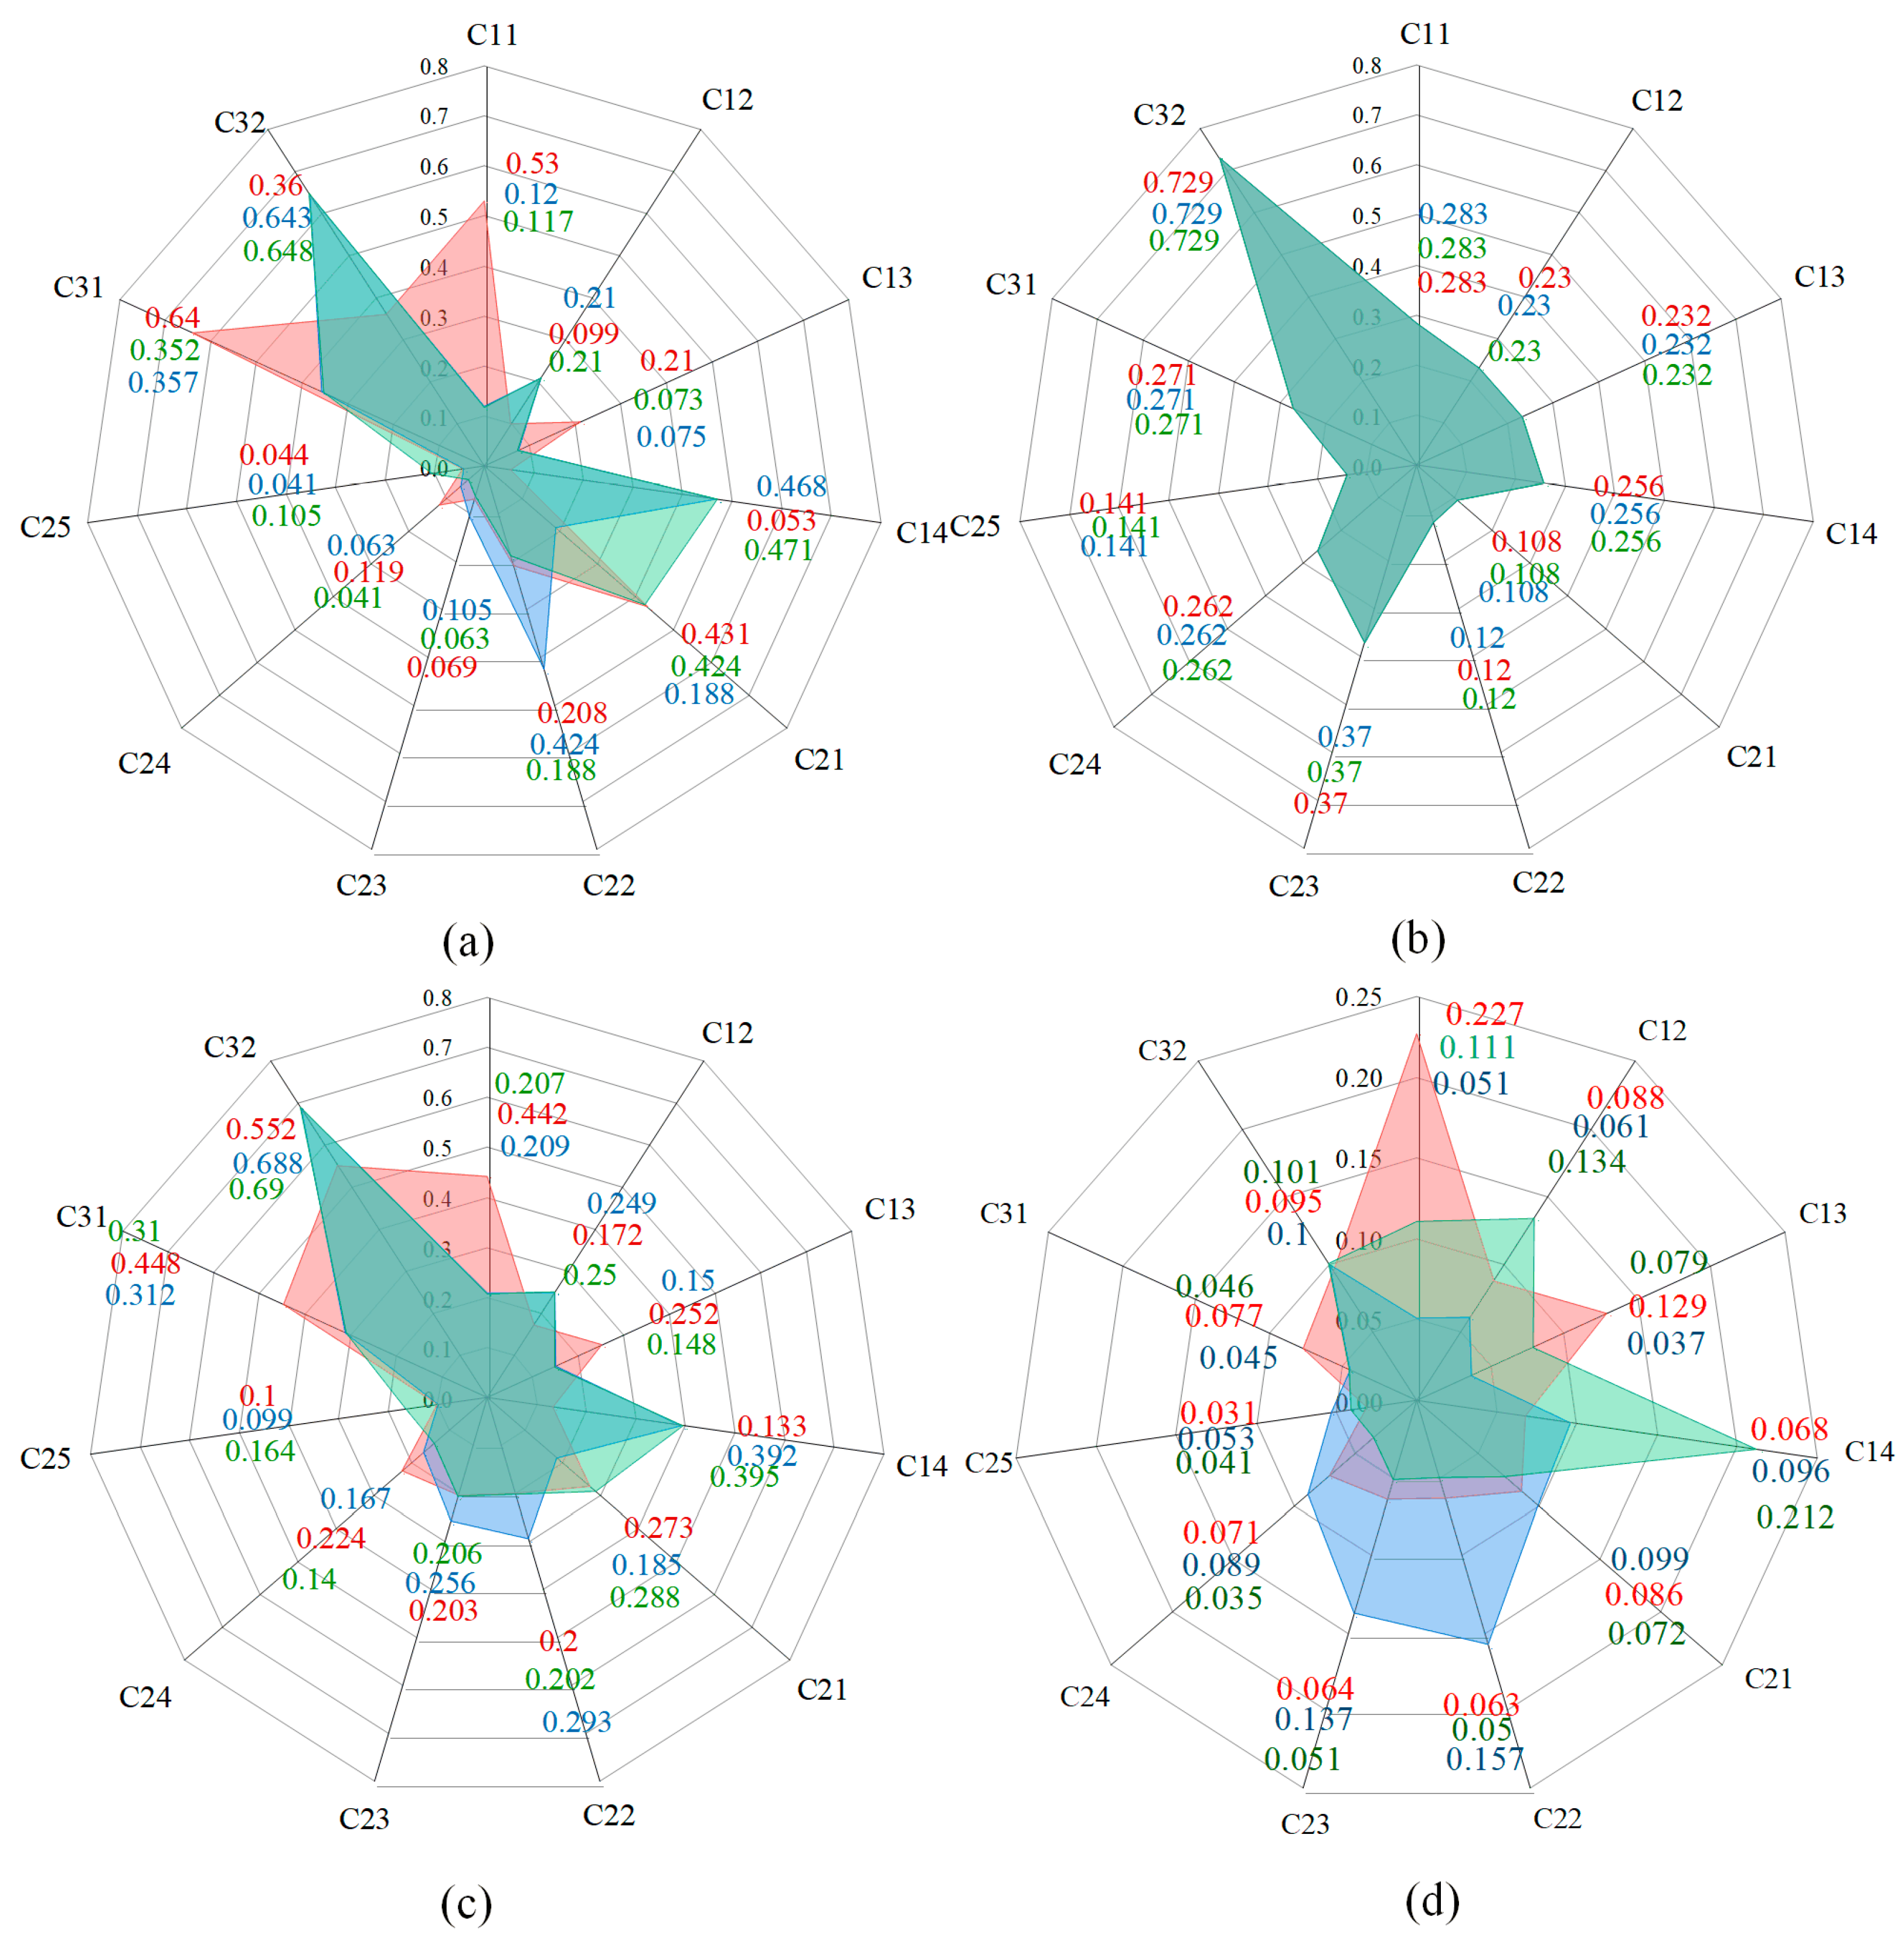
Figure 7 shows the secondary indicator weights determined by the subjective weighting method, the objective weighting method, and the comprehensive weighting method under different application scenarios of multi-energy storage technology.
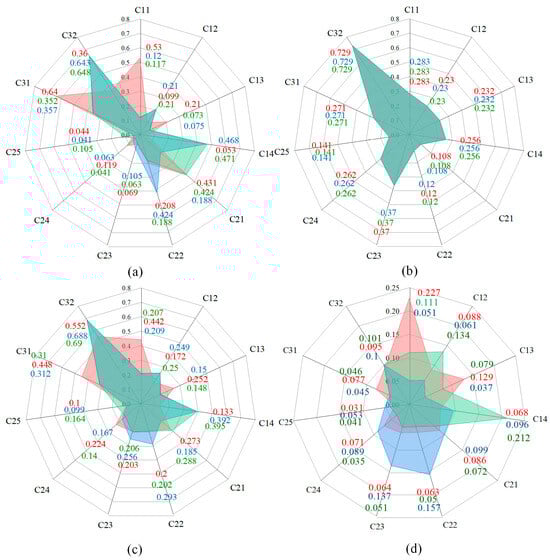
Figure 7.
Comparison of indicator weights of subjective, objective, and comprehensive weighting methods in different application scenarios: (a) subjective weight weighting method determines the weight of the secondary indicators, (b) objective weighting method to determine the weight of secondary indicators, (c) comprehensive weighting method determines the weight of the secondary indicators, and (d) comprehensive weighting method determines the net weight of the secondary indicators.
Figure 7a shows the results obtained by the subjective weighting method. It can be seen that the weights of individual indicators are significantly higher in each scenario. For example, in the EES for the renewables scenario, the initial investment cost weight under the economic indicator is as high as 0.53, which is much higher than the other three indicators (0.053, 0.099, and 0.021, respectively); in the power frequency regulation scenario of the power system, the weight of the charging response time under the technical indicator is 0.424, and the weight of the other indicators is less than 0.2. The environmental indicators also show great differences in the three scenarios, reflecting that the subjective weighting method may be affected by expert judgment preferences, resulting in excessive weight differences.
Figure 7b is the result of the objective weighting method. The indicator weights in each scenario are consistent and are calculated based on the economic and technical data of energy storage technology. However, this method fails to reflect the differences in industry experience and actual demand.
The comprehensive weighting method combines two methods to correct the indicator weight. For example, in the two scenarios of EES for the renewables scenario and price arbitrage scenario, the charge-discharge efficiency (C21) weights determined by the subjective weighting method are 0.431 and 0.188, respectively. The weights determined by the objective weighting method are 0.108, but the comprehensive weights are 0.273 and 0.288; in the power frequency regulation scenario, the charge and discharge response time (C22) weight determined by the subjective weight method is 0.424, the objective weight is 0.12, and the comprehensive weight is 0.293.
Based on the weight of each indicator obtained by the comprehensive weight method, the net weight of the secondary indicator can be obtained as shown in Figure 7d. The initial investment cost (C11) has the largest net weight in EES for the renewables scenario (0.227). In the power frequency regulation scenario, the net weights of charge-discharge efficiency (C21) and response speed (C22) account for a large proportion, which are 0.219 and 0.157, respectively. In the price arbitrage scenario, the charging cost (C14) ranks first with a weight of 0.227.
5.2. Comprehensive Evaluation of Multi-Energy Storage in Different Application Scenarios
According to the weight and the membership degree of multiple energy storage technologies, the comprehensive score of each energy storage technology can be determined. Figure 8 shows the performance of multi-energy storage in different application scenarios.
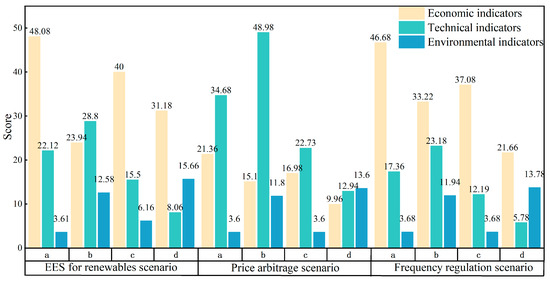
Figure 8.
Multi-energy storage performance under different scenarios: (a) Lithium iron phosphate battery energy storage, (b) pumped storage, (c) compressed air energy storage, and (d) hydrogen energy storage.
The EES for the renewables scenario focuses on the economic indicators of energy storage. Pumped storage benefits from lower initial investment costs and has the highest score. The technical indicator score of the lithium iron phosphate battery (28.8) is the highest. However, its economic indicator is 50.2% lower than that of pumped storage. The economic indicator of compressed air energy storage is 40.11% higher than that of the lithium iron phosphate battery, but its technical indicator score is 46.1% lower than that of the lithium iron phosphate battery.
In the power frequency regulation scenario, the lithium iron phosphate battery benefits from the highest technical performance score (75.88). The fast response time makes its technical indicator score 48.98, accounting for 64.55% of its total score. The high-volume energy density of lithium iron phosphate batteries makes their environmental indicator much higher than that of pumped storage and compressed air storage. The difference between the environmental indicators and economic indicators of pumped storage and compressed air energy storage is small, and the technical indicators of compressed air energy storage are 34.45% higher than those of pumped storage.
In the price arbitrage scenario, the lithium iron phosphate battery has the highest score (68.34), followed by pumped storage. The performance of pumped storage is excellent in cost comparison, but the technical indicators and environmental indicators are relatively poor.
The lower efficiency and response time of hydrogen energy storage in the three scenarios lead to the lowest technical indicator scores. The lithium iron phosphate battery has a high total score and a small fluctuation range in the three scenarios (the maximum change rate is 15.2%), reflecting good multi-scenario applicability and broad application prospects. The total score of pumped storage is the highest (79.36) under the new energy-independent energy storage, which is suitable for large-scale long-term energy storage, but the adaptability is slightly lower in the frequency modulation and price arbitrage scenarios, and the score decreases significantly (the change rate reaches 21.9%). The maximum fractional change rate of compressed air energy storage is 29.7%, which is also suitable for long-term and stable output scenarios. However, it performs poorly in scenarios with high flexibility requirements, and can be used as a substitute energy storage technology after pumped storage. The promotion of hydrogen energy storage requires technological and economic breakthroughs.
The multiple energy storage ranking of the new energy distribution energy storage scenario is (1) pumped storage, (2) lithium iron phosphate battery, (3) compressed air energy storage, and (4) hydrogen energy storage. The power system frequency modulation scene multiple energy storage ranking is (1) lithium iron phosphate battery, (2) pumped storage, (3) compressed air energy storage, and (4) hydrogen energy storage. The price arbitrage scenario multiple energy storage ranking is (1) lithium iron phosphate battery, (2) pumped storage, (3) compressed air energy storage, and (4) hydrogen energy storage.
6. Conclusions
This study analyzes the economic and technical performance of the four energy storage technologies in the whole life cycle, and makes a comprehensive evaluation based on the obtained economic parameters. The main conclusions are as follows:
The full life cycle costs of lithium iron phosphate battery energy storage, pumped storage, compressed air energy storage, and hydrogen energy storage are 1.135 CNY/(kW·h), 0.667 CNY/(kW·h), 0.853 CNY/(kW·h), and 1.157 CNY/(kW·h), respectively. The sensitivity of the cost of each energy storage degree to the number of annual cycles, the base price of charging, and the efficiency of charging and discharging is as follows: the number of annual cycles > the base price of charging > the efficiency of charging and discharging.
In the scenario of new energy sources independently equipped with energy storage systems, pumped storage exhibits the most outstanding overall performance. Lithium iron phosphate batteries and compressed air energy storage are expected to serve as alternative storage options following pumped storage in this context. In contrast, in the scenarios of power system frequency regulation and price arbitrage scenarios, lithium iron phosphate batteries emerge as the optimal choice due to their excellent technical characteristics. In the power frequency regulation scenario and price arbitrage scenario, the lithium iron phosphate battery becomes the best choice because of its excellent technical performance.
The lithium iron phosphate battery has the strongest adaptability to multiple scenarios and has broad application prospects. The adaptability of pumped storage and compressed air energy storage to different application scenarios is similar, but pumped storage performs better. The application of hydrogen energy storage still needs to achieve breakthroughs in economy and technology. Despite the current high costs and infrastructure challenges associated with hydrogen energy storage technologies, they hold significant long-term potential for deep decarbonization in hard-to-electrify sectors. On the technological front, it is essential to improve the efficiency and reduce the cost of electrolyzers, as well as to develop efficient, safe, and scalable hydrogen storage and transportation technologies. On the policy side, implementing carbon pricing mechanisms to internalize environmental externalities and providing subsidies or financial incentives to support hydrogen projects are crucial measures to accelerate deployment.
The results of this study are based on the proposed evaluation framework, methodology, and specific application scenarios. The relatively limited score variation observed for lithium iron phosphate (LFP) batteries across different scenarios may be attributed to the structural characteristics of the evaluation framework and the selected focus on specific attributes of storage technologies. Furthermore, as the study employs representative storage technologies and typical scenarios, differences in their applicability and technical characteristics may introduce certain limitations to the generalizability of the results. If the evaluation framework or indicator system is modified in future research, the improved G1-EWM method proposed in this study can still be effectively applied to derive comprehensive scores for various storage technologies across different scenarios, thereby maintaining the method’s generalizability and extensibility.
Author Contributions
Conceptualization, Y.L.; Methodology, Y.W. and T.C.; Formal analysis, C.X.; Resources, P.L.; Data curation, Y.Z. and W.L.; Writing—original draft, H.H.; Supervision, J.W. All authors have read and agreed to the published version of the manuscript.
Funding
This research is funded by the Research on Game Theory of Multi-energy Storage Projects from the Perspective of the Whole Life Cycle (grant number ZZKJ-2024-18), and by the National Natural Science Foundation of China (grant number 52276007).
Data Availability Statement
The original contributions presented in this study are included in the article. Further inquiries can be directed to the corresponding author.
Conflicts of Interest
Authors Huijuan Huo, Peidong Li, Cheng Xin, Yudong Wang, Weiwei Li, Yanchao Lu and Tianqiong Chen were employed by the company State Grid Economic and Technological Research Institute Co., Ltd. The remaining authors declare that the research was conducted in the absence of any commercial or financial relationships that could be construed as a potential conflict of interest.
Nomenclature
| Symbols | |||
| C | Cost | E | Scrapping cost rate |
| F | On-grid electricity | G | Gray range value |
| k | The number of experts participating in the evaluation | L | Conservative estimates of the ratio |
| M | Intermediate range value | N | Operation cycle |
| Q | Energy storage capacity | U | Factor set |
| V | Judgment set | W | Installed capacity |
| r | Discount rate | Weight | |
| Energy storage equipment parameters | Charge and discharge efficiency | ||
| Composition operator | |||
| Subscripts and superscripts | |||
| o | Objective weighting method | s | subjective weighting method |
| DOD | Charge and discharge depth | Deg | Annual cycle decay rate |
| E | Unit capacity | el | Electric charging price |
| ge | Geometric mean | Inv | Initial investment |
| j | Comprehensive weighting method | O&M | Operation and maintenance |
| P | Unit power | P-r | Unit power replacement |
| Pay | Annual cycle times | Repl | Replacement |
| pel | Charging | Eol | Recovery |
| Abbreviations | |||
| FCE | Fuzzy comprehensive evaluation | LCC | Life cycle cost |
| MADM | Multi-attribute decision-making | O&M | Operation and maintenance |
| G1-EWM | Ordinal relation-entropy weight method | G1 | Grade one |
| EWM | Entropy weight method | ||
Appendix A
| Membership Score | Very Good (100) | Better (80) | General (60) | Poor (40) | Very Poor (0) | |
| Indicators | ||||||
| Economic indicators | Initial investment cost | ≤0.3 | 0.3–0.45 | 0.45–0.55 | 0.55–0.65 | ≥0.65 |
| Average annual operation and maintenance cost | ≤0.02 | 0.02–0.05 | 0.05–0.12 | 0.12–0.18 | ≥0.2 | |
| Equipment replacement cost | ≤0.01 | 0.01–0.02 | 0.02–0.05 | 0.05–0.1 | ≥0.1 | |
| Charging cost | ≤0.35 | 0.35–0.45 | 0.45–0.55 | 0.55–0.65 | ≥0.65 | |
| Technical indicators | Charge and discharge efficiency | ≥90% | 80–90% | 60–80% | 40–60% | ≤ 40% |
| Charge and discharge response time | ms | 1 s | 5 s | 60 s | ≥60 s | |
| Power scale/MW | >100 | 50–100 | 10–50 | 1–10 | <1 | |
| Capacity scale/MWh | >500 | 100–500 | 10–100 | 1–10 | <1 | |
| Current stage of development | Large-scale development | Early commercialization | Demonstration application | technology research and development | Early stage of technology R & D | |
| Environmental indicators | Environmental friendliness | Excellent | Good | Medium | difference | Very poor |
| Volume energy density | ≥500 Wh/L | 350 Wh/L | 200 Wh/L | 50 Wh/L | ≦10 Wh/L |
Appendix B
| Scenarios | (Optimistic Value, Conservative Value) | |
| Frequency regulation scenario | Expert evaluation | |
| Deepseek evaluation | ||
| Price arbitrage scenario | Expert evaluation | |
| Deepseek evaluation | ||
| EES for renewables scenario | Expert evaluation | |
| Deepseek evaluation | ||
References
- Mentens, L.; Peremans, H.; Springael, J.; Nimmegeers, P. Flexibility in short-term electricity markets for renewable integration and uncertainty mitigation: A comprehensive review. Smart Energy 2025, 18, 100183. [Google Scholar] [CrossRef]
- Rahman, T.; Lipu, M.H.; Shovon, M.M.A.; Alsaduni, I.; Karim, T.F.; Ansari, S. Unveiling the impacts of climate change on the resilience of renewable energy and power systems: Factors, technological advancements, policies, challenges, and solutions. J. Clean. Prod. 2025, 493, 144933. [Google Scholar] [CrossRef]
- Suraparaju, S.K.; Samykano, M.; Vennapusa, J.R.; Rajamony, R.K.; Balasubramanian, D.; Said, Z.; Pandey, A.K. Challenges and prospectives of energy storage integration in renewable energy systems for net zero transition. J. Energy Storage 2025, 125, 116923. [Google Scholar] [CrossRef]
- Vilaplana, J.A.L.; Yang, G.; Ackom, E. From investment to net benefits: A review of guidelines and methodologies for cost–benefit analysis in the electricity sector. Energy Res. Soc. Sci. 2025, 124, 104052. [Google Scholar] [CrossRef]
- Weldu, Y.W.; Assefa, G. The search for most cost-effective way of achieving environmental sustainability status in electricity generation: Environmental life cycle cost analysis of energy scenarios. J. Clean. Prod. 2017, 142, 2296–2304. [Google Scholar] [CrossRef]
- Sadiq, M.; Mayyas, A.; Wei, M. A standardized parametric framework for techno-economic analysis of renewable and clean energy systems. Renew. Energy 2025, 243, 122493. [Google Scholar] [CrossRef]
- Yang, K.; Zou, R.; Zhang, W.; Zeng, X.; Li, Z.; Guo, J. Comprehensive review of Positive Energy Districts: Multidimensional analysis of energy, economic, social, and environmental aspects. Renew. Sustain. Energy Rev. 2025, 217, 115740. [Google Scholar] [CrossRef]
- Hottenroth, H.; Sutardhio, C.; Weidlich, A.; Tietze, I.; Simon, S.; Hauser, W.; Naegler, T.; Becker, L.; Buchgeister, J.; Junne, T.; et al. Beyond climate change. Multi-attribute decision making for a sustainability assessment of energy system transformation pathways. Renew. Sustain. Energy Rev. 2022, 156, 111996. [Google Scholar] [CrossRef]
- Chen, N.; Han, X.; Nie, L.; Li, Y.; Huang, X.; Yan, J. Assessment of energy storage technologies on life cycle sustainability for peak shaving scenario. Sol. Energy Mater. Sol. Cells 2025, 286, 113576. [Google Scholar] [CrossRef]
- Denholm, P.; Hand, M. Grid flexibility and storage required to achieve very high penetration of variable renewable electricity. Energy Policy 2011, 39, 1817–1830. [Google Scholar] [CrossRef]
- Schmidt, O.; Melchior, S.; Hawkes, A.; Staffell, I. Projecting the Future Levelized Cost of Electricity Storage Technologies. Joule 2019, 3, 81–100. [Google Scholar] [CrossRef]
- Hamed, H.; AlEssa, A.; AlKhorafi, M.; AlDakheel, A.; AlDei, S.; Aleisa, E. Integrating renewable energy in Sabah Al-Ahmad City: A techno-economic and environmental analysis. J. Eng. Res. 2025, in press. [Google Scholar] [CrossRef]
- Mu, T.; Wang, Z.; Yao, N.; Zhang, M.; Bai, M.; Wang, Z.; Wang, X.; Cai, X.; Ma, Y. Technological penetration and carbon-neutral evaluation of rechargeable battery systems for large-scale energy storage. J. Energy Storage 2023, 69, 107917. [Google Scholar] [CrossRef]
- Zhou, Q.; He, Q.; Lu, C.; Du, D. Techno-economic analysis of advanced adiabatic compressed air energy storage system based on life cycle cost. J. Clean. Prod. 2020, 265, 121768. [Google Scholar] [CrossRef]
- Yao, X.; Ge, S.; Guo, Z.; Li, J.; Han, Y.; Liu, X.; Ahmed, D.; Tachega, M.A. Life cycle cost study of abandoned coal mine shaft-based pumped storage. China Min. Mag. 2020, 29, 50–56+65. [Google Scholar]
- Fu, X.; Li, F.; Yang, X.; Yang, P. Energy storage cost analysis based on life cycle cost. Distrib. Energy 2020, 5, 34–38. [Google Scholar]
- He, Y.; Chen, Y.; Liu, Y.; Liu, H.; Liu, D.; Sun, C. Analysis of levelized cost of electricity and mileage cost of energy storage. Adv. Technol. Electr. Eng. Energy 2019, 38, 1–10. [Google Scholar]
- Yang, H.; Zhou, M.; Zhang, M.; Wu, Z.; Du, J. Operation strategy and benefit analysis of pumped-storage power stations under electricity market environment. J. North China Electr. Power Univ. (Nat. Sci. Ed.) 2021, 48, 71–80. [Google Scholar]
- Meng, X.; Pang, X.; Chong, F.; Hou, S.; Qi, B. Application analysis and prospect of electrochemical energy storage in power grid. Energy Storage Sci. Technol. 2019, 8, 38–42. [Google Scholar]
- Zhang, W.; Qiu, M.; Lai, X. Application of energy storage technology in power system. Power Syst. Technol. 2008, 7, 1–9. [Google Scholar]
- Feng, J.; Zeng, P.; Li, Y.; Dai, Q.; Zhu, L. Optimal configuration of novel distributed energy storage considering impact of charge/discharge strategies on lifespan. Electr. Meas. Instrum. 2024, 61, 26–32. [Google Scholar]
- Bai, X. Application of lithium iron phosphate battery energy storage systems. Hi-Tech Ind. 2016, 4, 71–73. [Google Scholar]
- Cao, F.; Jin, Y.; Xu, D.; Li, B.; Liu, Q. Brief analysis of the impact of alternative and energy storage technologies on the development of pumped storage. China Foreign Energy 2021, 26, 89–95. [Google Scholar]
- Chai, M.; Gao, C.; Chen, T.; Hu, N.; Guan, Y. Economic analysis of energy storage configuration for industrial users in Jiangsu Province. Demand Side Manag. Electr. Power 2021, 23, 47–51. [Google Scholar]
- Paul, D.; Pechancová, V.; Saha, N.; Pavelková, D.; Saha, N.; Motiei, M.; Jamatia, T.; Chaudhuri, M.; Ivanichenko, A.; Venher, M.; et al. Life cycle assessment of lithium-based batteries: Review of sustainability dimensions. Renew. Sustain. Energy Rev. 2024, 206, 114860. [Google Scholar] [CrossRef]
- Tang, F.; Qin, Y.; Guo, M.; Wang, P.; Zhang, F.; Hou, H. Thermal risk assessment in the mine of TOPSIS based on game theory subjective and objective comprehensive weighting. Therm. Sci. Eng. Prog. 2025, 59, 103367. [Google Scholar] [CrossRef]
- Qian, Y.; Xu, Z.; Qin, Y.; Gou, X. A critical review on the multidimensional complexity of sustainable energy development. Appl. Energy 2025, 394, 126194. [Google Scholar] [CrossRef]
- Lei, S.; Ma, X.; Qin, H.; Ren, D.; Niu, X. A new three-way multi-attribute decision-making with objective risk avoidance coefficients based on q-rung orthopair fuzzy pre-order relations. Expert Syst. Appl. 2025, 268, 126252. [Google Scholar] [CrossRef]
- Si, T.; Wang, C.; Liu, R.; Guo, Y.; Yue, S.; Ren, Y. Multi-criteria comprehensive energy efficiency assessment based on fuzzy-AHP method: A case study of post-treatment technologies for coal-fired units. Energy 2020, 200, 117533. [Google Scholar] [CrossRef]
- Xu, C.; Xu, C.; Zhan, L.; Li, G. Establishment and validation of a novel composite index for energy efficiency evaluation of data center chilled water systems based on AHP and Entropy Weight Method. Energy Build. 2025, 337, 115677. [Google Scholar] [CrossRef]
- Wu, Y.; Jia, W.; Li, L.; Song, Z.; Xu, C.; Liu, F. Risk assessment of electric vehicle supply chain based on fuzzy synthetic evaluation. Energy 2019, 182, 397–411. [Google Scholar] [CrossRef]
- Zhang, T.; Ma, Y.; Wu, Y.; Yi, L. Optimization configuration and application value assessment modeling of hybrid energy storage in the new power system with multi-flexible resources coupling. J. Energy Storage 2023, 62, 106876. [Google Scholar] [CrossRef]
- Zhang, Y.; Li, H.; Yan, Z.; Cao, H.; Shi, H.; Jia, Y. Optimization of energy output in multimodal and multi-load CCHP systems with integrated electric energy storage. Energy Rep. 2025, 13, 4734–4748. [Google Scholar] [CrossRef]


Disclaimer/Publisher’s Note: The statements, opinions and data contained in all publications are solely those of the individual author(s) and contributor(s) and not of MDPI and/or the editor(s). MDPI and/or the editor(s) disclaim responsibility for any injury to people or property resulting from any ideas, methods, instructions or products referred to in the content. |
© 2025 by the authors. Licensee MDPI, Basel, Switzerland. This article is an open access article distributed under the terms and conditions of the Creative Commons Attribution (CC BY) license (https://creativecommons.org/licenses/by/4.0/).