
Impact of Aquifer Heterogeneity on the Migration and Natural Attenuation of Multicomponent Heavy Dense Nonaqueous Phase Liquids (DNAPLs) in a Retired Chemically Polluted Site

 and
and
Abstract
1. Introduction
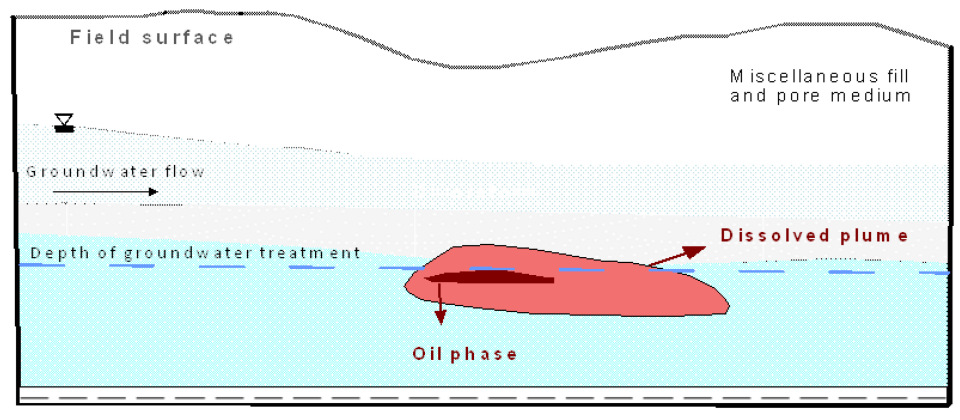
2. Study Area
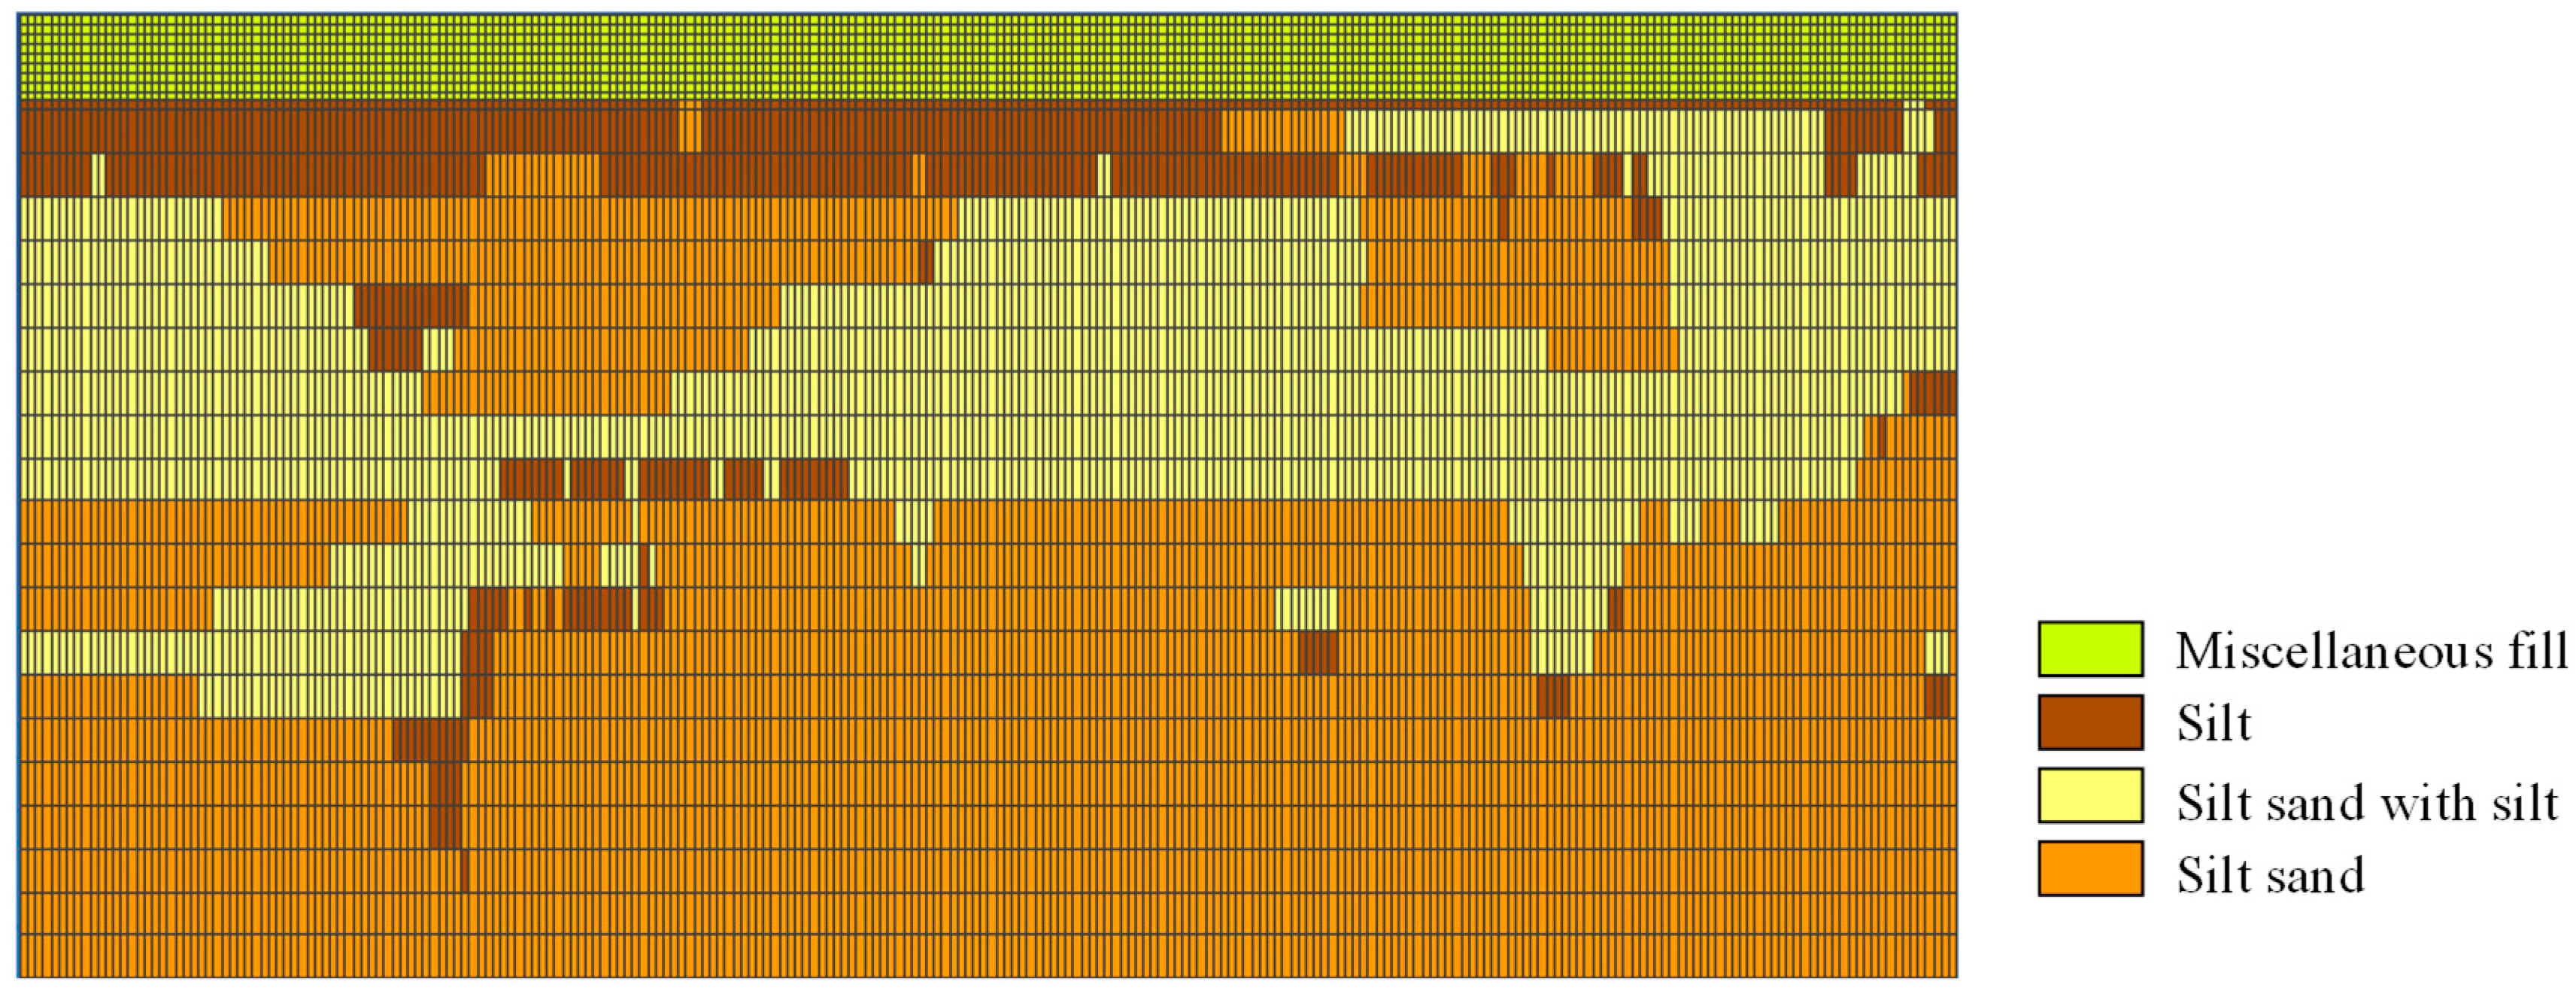
2.1. Hydrogeological Setting and Heterogeneity Characteristics
2.2. Selection of Target DNAPLs
- Historical relevance: They were primary raw materials and solvents used in the former pesticide production, leading to long-term accumulation in the subsurface.
- High concentrations: Their maximum detected concentrations were 21.40 mg/L (DCE) and 2.20 mg/L (CTC), exceeding the risk control values for construction land (0.81 mg/L and 0.23 mg/L, respectively; Table 2).
- 3.
- Distinct transport and attenuation behaviors:
- (a)
- Transport: DCE has higher solubility (8600 mg/L) and lower density (1250 kg/m3) than CTC (solubility: 793 mg/L; density: 1548 kg/m3), leading to more extensive horizontal diffusion. In contrast, CTC’s higher density drives stronger vertical gravity migration, often accumulating at the interface of low-permeability layers (Section 4.1).
- (b)
- Attenuation: DCE exhibits a higher degradation rate constant (2.67 × 10⁻⁷ s−1) than CTC (1.6 × 10⁻⁷ s−1; Table 2), but its attenuation depends more on microbial co-metabolism under specific redox conditions. CTC, however, undergoes reductive dechlorination more readily in anaerobic environments, a process less sensitive to substrate availability [27].
3. Methods and Data
3.1. Hydrogeological Conceptual Model
3.2. Pollutant Transport Situations
3.3. TMVOC Model
3.4. T-PROGS Model
3.5. Model Spatiotemporal Discretization
4. Results and Discussion
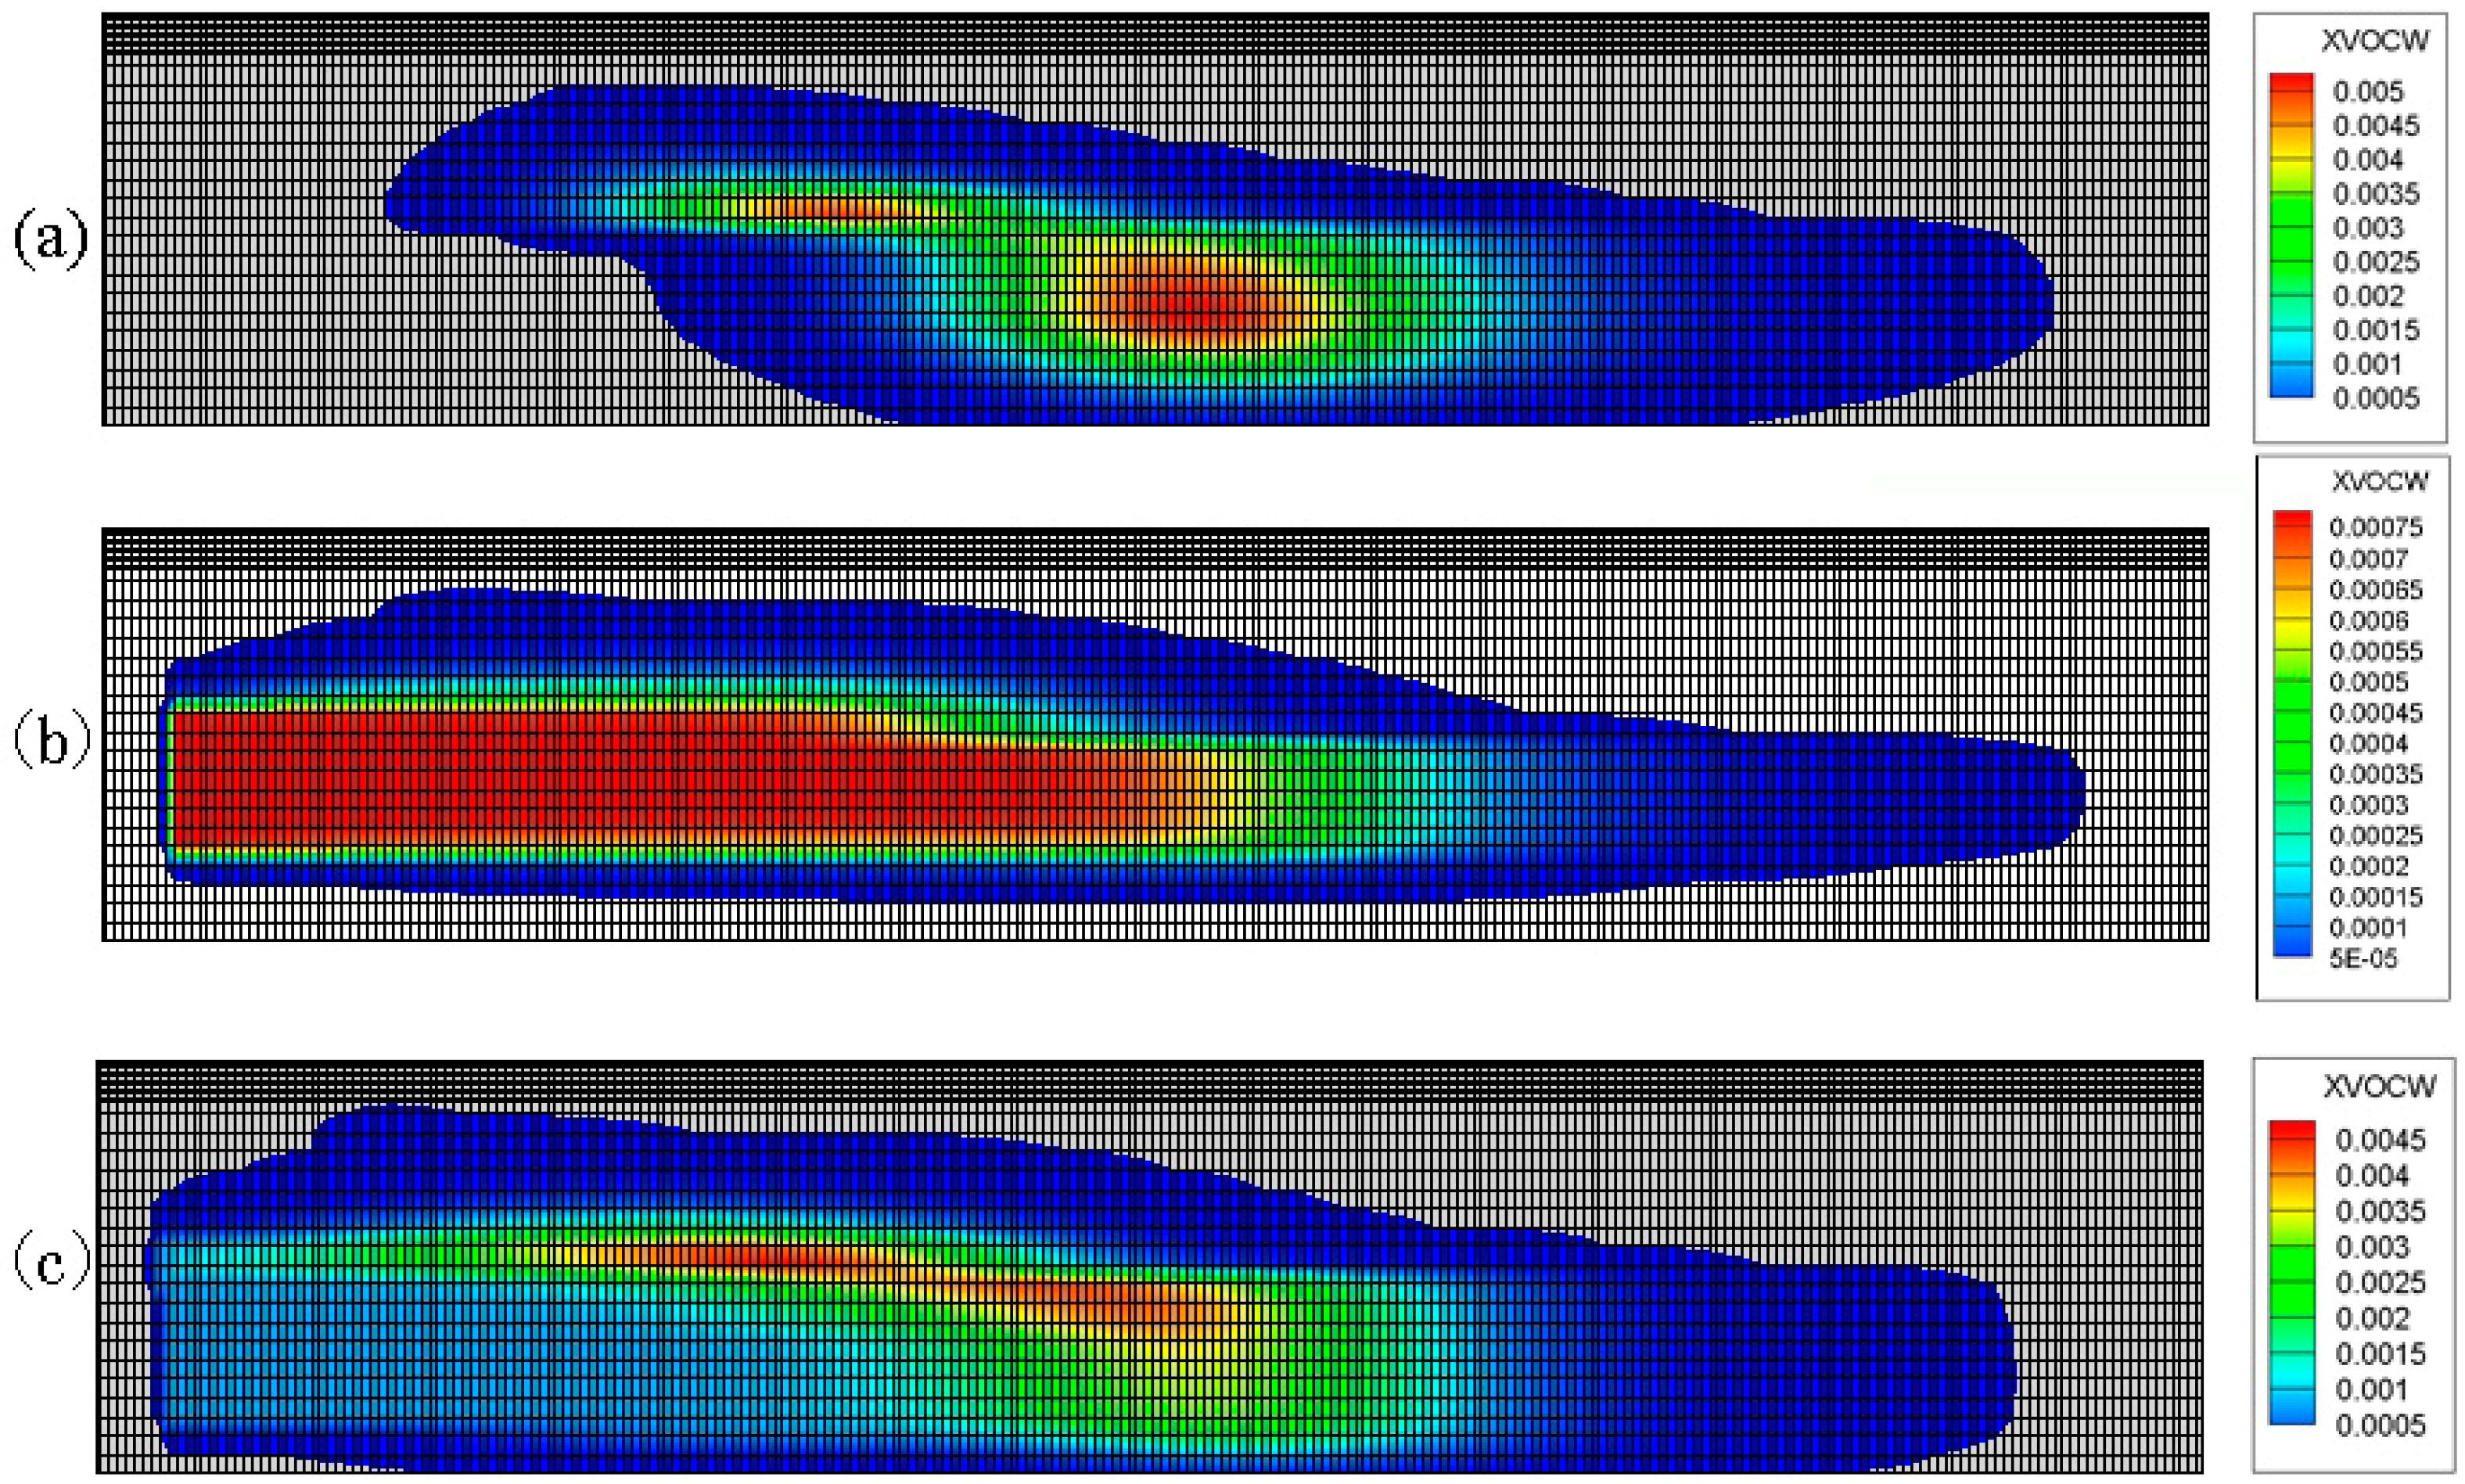
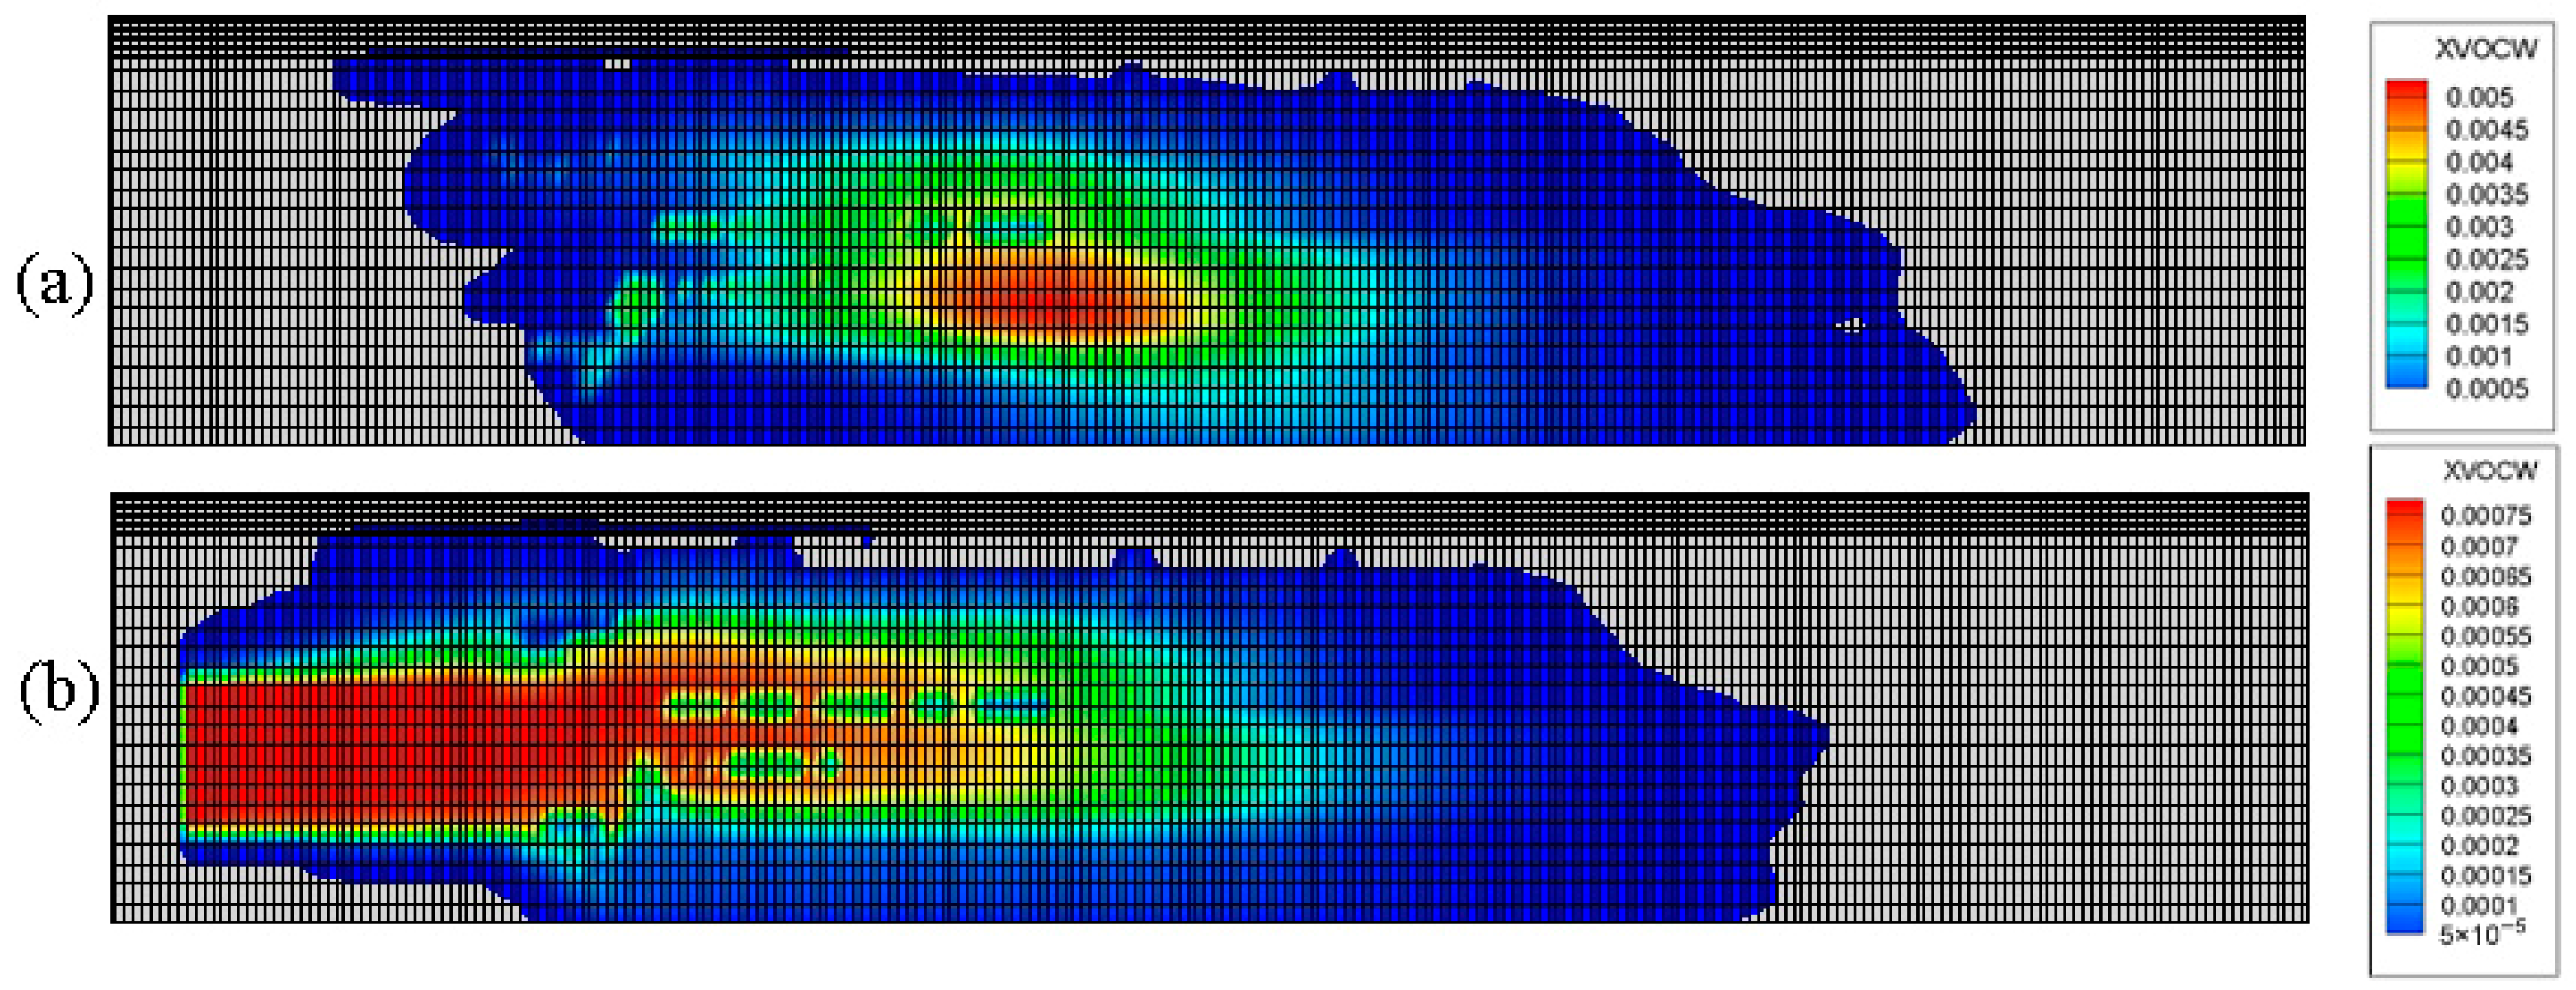
4.1. The Transport Process of DNAPL Under Multi-Component Conditions
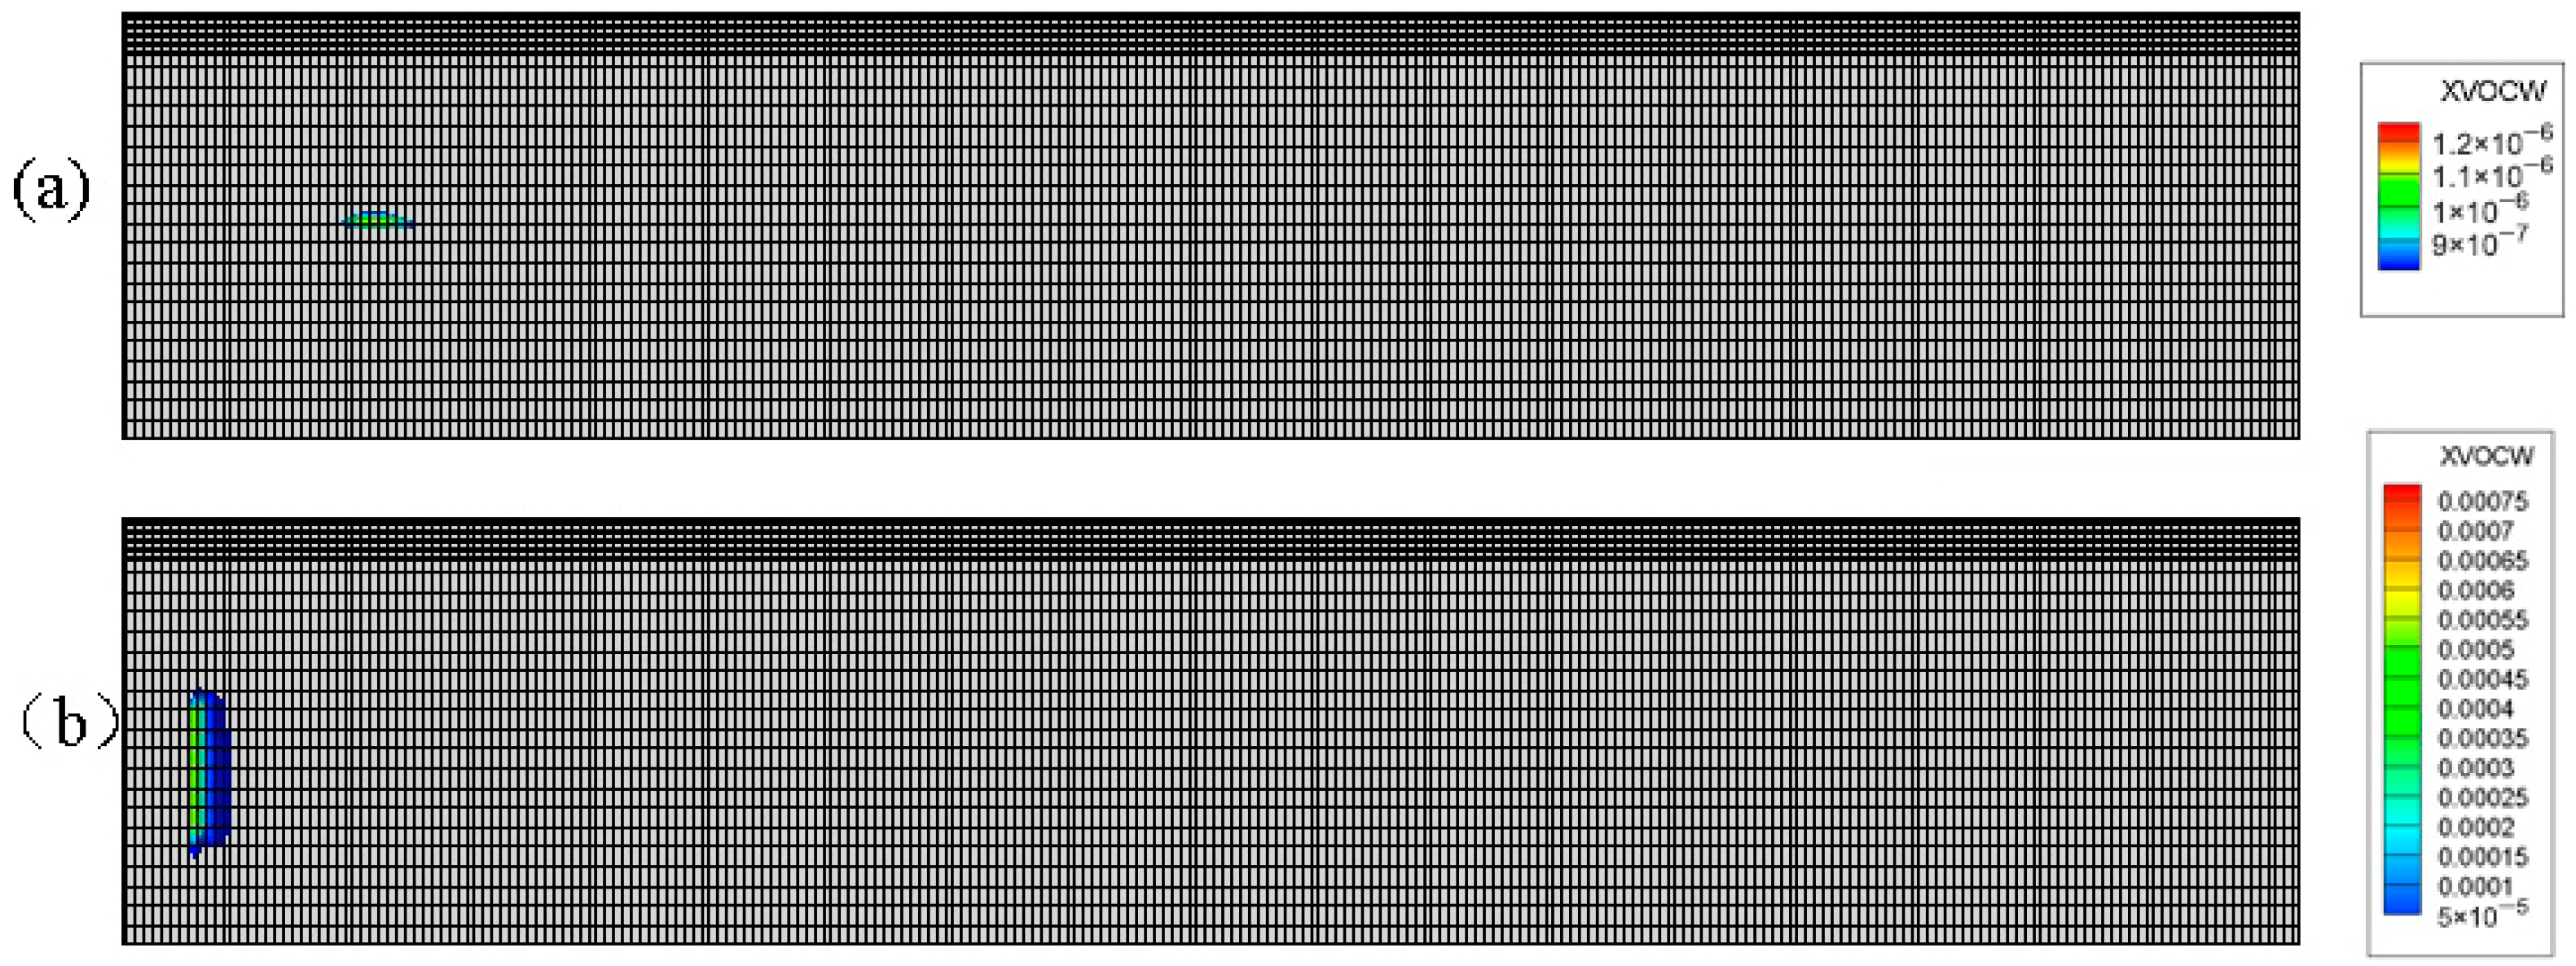
4.2. Considering the Transport Process of DNAPL Under Natural Decay and Other Processes
4.3. Considering the Transport Process of DNAPL Under Heterogeneous Conditions
4.4. Broader Implications for DNAPL Risk Management
4.5. Model Limitations and Future Work
5. Conclusions
Author Contributions
Funding
Data Availability Statement
Conflicts of Interest
References
- Fleming, P.M.; Palm-Forster, L.H.; Kelley, L.E. The effect of legacy pollution information on landowner investments in water quality: Lessons from economic experiments in the field and the lab. Environ. Res. Lett. 2021, 16, 045006. [Google Scholar] [CrossRef]
- Siena, M.; Riva, M. Impact of geostatistical reconstruction approaches on model calibration for flow in highly heterogeneous aquifers. Stoch. Environ. Res. Risk Assess. 2020, 34, 1591–1606. [Google Scholar] [CrossRef]
- Rivett, M.O.; Feenstra, S.; Cherry, J.A. A controlled field experiment on groundwater contamination by a multicomponent DNAPL: Creation of the emplaced-source and overview of dissolved plume development. J. Contam. Hydrol. 2001, 49, 111–149. [Google Scholar] [CrossRef] [PubMed]
- Hou, D.; Al-Tabbaa, A.; O’Connor, D.; Hu, Q.; Zhu, Y.-G.; Wang, L.; Kirkwood, N.; Ok, Y.S.; Tsang, D.C.; Bolan, N.S. Sustainable remediation and redevelopment of brownfield sites. Nat. Rev. Earth Environ. 2023, 4, 271–286. [Google Scholar] [CrossRef]
- Ericson, B.; Caravanos, J.; Chatham-Stephens, K.; Landrigan, P.; Fuller, R. Approaches to systematic assessment of environmental exposures posed at hazardous waste sites in the developing world: The Toxic Sites Identification Program. Environ. Monit. Assess. 2013, 185, 1755–1766. [Google Scholar] [CrossRef] [PubMed]
- Brand, J.H.; Spencer, K.L.; O’shea, F.T.; Lindsay, J.E. Potential pollution risks of historic landfills on low-lying coasts and estuaries. WIREs Water 2018, 5, e1264. [Google Scholar] [CrossRef]
- Xie, W.; Jiang, D.; Li, X.; Kong, L.; Cao, S.; Chen, Q.; Zhang, S.; Deng, S. Transport Simulation of Typical DNAPLs in Deep Aquifer and Safe Utilization Depth Evaluation of Polluted Plot. Chin. J. Environ. Eng. 2022, 16, 2287–2295. [Google Scholar]
- Battistelli, A. Modeling Multiphase Organic Spills in Coastal Sites with TMVOC V.2.0. Vadose Zone J. 2008, 7, 316–324. [Google Scholar] [CrossRef]
- Heron, G.; Bierschenk, J.; Swift, R.; Watson, R.; Kominek, M. Thermal DNAPL Source Zone Treatment Impact on a CVOC Plume. Ground Water Monit. Remediat. 2016, 36, 26–37. [Google Scholar] [CrossRef]
- Marruffo, A.G. Modeling the Impact of Petroleum Mixtures Released From Railroad Tank Car Accidents on Groundwater Contamination and Cleanup Times. Doctoral Dissertation, University of Illinois at Urbana-Champaign, Champaign, IL, USA, 2011. [Google Scholar]
- Shi, Y.F.; Gao, B.; Sun, Y.Y.; Sun, K.X.; Xu, H.X.; Wu, J.C. Effect of Residual NAPLs on the Transport of Bisphenol A and Bisphenol S in Saturated Porous Media. Water Air Soil. Pollut. 2019, 230, 185. [Google Scholar] [CrossRef]
- Guo, Y.; Wen, Z.; Zhang, C.; Jakada, H. Contamination characteristics of chlorinated hydrocarbons in a fractured karst aquifer using TMVOC and hydro-chemical techniques. Sci. Total Environ. 2021, 794, 148717. [Google Scholar] [CrossRef] [PubMed]
- Zheng, F.; Gao, Y.W.; Sun, Y.Y.; Shi, X.Q.; Xu, H.X.; Wu, J.C. Influence of flow velocity and spatial heterogeneity on DNAPL migration in porous media: Insights from laboratory experiments and numerical modelling. Hydrogeol. J. 2015, 23, 1703–1718. [Google Scholar] [CrossRef]
- Pu, Y.; Jiang, S.; Li, X. Study on migration and distribution of DNAPLs affected by layers with low permeability. Geotech. Investig. Surv. 2015, 43, 43–47. [Google Scholar]
- HJ 25.2-2019; Technical Guidelines for Monitoring During Risk Control and Remediation of Soil Contamination of Land for Construction. Ministry of Ecological Environment of the People’s Republic of China: Beijing, China, 2019.
- Fan, T.; Yang, M.; Li, Q.; Zhou, Y.; Xia, F.; Chen, Y.; Yang, L.; Ding, D.; Zhang, S.; Zhang, X.; et al. A new insight into the influencing factors of natural attenuation of chlorinated hydrocarbons contaminated groundwater: A long-term field study of a retired pesticide site. J. Hazard. Mater. 2022, 439, 129595. [Google Scholar] [CrossRef] [PubMed]
- Declercq, I.; Cappuyns, V.; Duclos, Y. Monitored natural attenuation (MNA) of contaminated soils: State of the art in Europe—A critical evaluation. Sci. Total Environ. 2012, 426, 393–405. [Google Scholar] [CrossRef] [PubMed]
- McGuire, T.M.; Newell, C.J.; Looney, B.B.; Vangelas, K.M.; Sink, C.H. Historical analysis of monitored natural attenuation: A survey of 191 chlorinated solvent sites and 45 solvent plumes. Remediat. J. Environ. Cleanup Costs Technol. Tech. 2004, 15, 99–112. [Google Scholar] [CrossRef]
- Newell, C.J.; Adamson, D.T.; Kulkarni, P.R.; Nzeribe, B.N.; Connor, J.A.; Popovic, J.; Stroo, H.F. Monitored natural attenuation to manage PFAS impacts to groundwater: Potential guidelines. Remediat. J. 2021, 31, 7–17. [Google Scholar] [CrossRef]
- Antelmi, M.; Mazzon, P.; Höhener, P.; Marchesi, M.; Alberti, L. Evaluation of mna in a chlorinated solvents-contaminated aquifer using reactive transport modeling coupled with isotopic fractionation analysis. Water 2021, 13, 2945. [Google Scholar] [CrossRef]
- Zhang, B.; Zhou, X.; Liu, R.; Hu, X. Risk assessment and natural attenuation study of groundwater contamination in an oil reservoir in Fuxin. Environ. Earth Sci. 2024, 83, 252. [Google Scholar] [CrossRef]
- Song, Q.; Xue, Z.; Wu, H.; Zhai, Y.; Lu, T.; Du, X.; Zheng, J.; Chen, H.; Zuo, R. The collaborative monitored natural attenuation (CMNA) of soil and groundwater pollution in large petrochemical enterprises: A case study. Environ. Res. 2023, 216, 114816. [Google Scholar] [CrossRef] [PubMed]
- Shi, X.; Guo, X. A review of the effects of typical biogeochemical and hydrogeological features on the natural attenuation of soil petroleum contaminants. Front. Eng. Sci. Res. 2024, 2, 1. [Google Scholar] [CrossRef]
- Pruess, K.; Battistelli, A. TMVOC, A Numerical Simulator for Three-Phase Non-isothermal Flows of Multicomponent Hydrocarbon Mixtures in Variably Saturated Heterogeneous Media. Off. Sci. Tech. Inf. Tech. Rep. 2005. [Google Scholar] [CrossRef]
- Guleria, A.; Gupta, P.K.; Chakma, S.; Yadav, B.K. Unraveling the Fate and Transport of DNAPLs in Heterogeneous Aquifer Systems—A Critical Review and Bibliometric Analysis. Sustainability 2023, 15, 8214. [Google Scholar] [CrossRef]
- Tick, G.; Slavic, D.R.; Akyol, N.H.; Zhang, Y. Enhanced-solubilization and dissolution of multicomponent DNAPL from homogeneous porous media. J. Contam. Hydrol. 2022, 247, 103967. [Google Scholar] [CrossRef] [PubMed]
- Shen, X.; Wan, Y.; Wang, L.; Su, X.; Dong, W. Multiphase flow modeling of natural attenuation of volatile organic compounds (VOCs) in a petroleum contaminated sit. Earth Sci. Front. 2021, 28, 90. [Google Scholar]
- Panday, S.; Huyakorn, P.S. MODFLOW SURFACT: A state-of-the-art use of vadose zone flow and transport equations and numerical techniques for environmental evaluations. Vadose Zone J. 2008, 7, 610–631. [Google Scholar] [CrossRef]
- Christ, J.A.; Lemke, L.D.; Abriola, L.M. Comparison of two-dimensional and three-dimensional simulations of dense nonaqueous phase liquids (DNAPLs): Migration and entrapment in a nonuniform permeability field. Water Resour. Res. 2005, 41, W01007. [Google Scholar] [CrossRef]
- Pruess, K. TOUGH2-A General-Purpose Numerical Simulator for Multiphase Fluid and Heat Flow; Lawrence Berkeley National Laboratory: Berkeley, CA, USA, 1991.
- Doughty, C.; Pruess, K. Modeling supercritical carbon dioxide injection in heterogeneous porous media. Vadose Zone J. 2004, 3, 837–847. [Google Scholar] [CrossRef]
- Cheng, Z.; Lu, G.; Wu, M.; Hao, Y.; Mo, C.; Li, Q.; Wu, J.; Wu, J.; Hu, B.X. The Effects of Spill Pressure on the Migration and Remediation of Dense Non-Aqueous Phase Liquids in Homogeneous and Heterogeneous Aquifers. Sustainability 2023, 15, 13072. [Google Scholar] [CrossRef]
- Feo, A.; Celico, F. Investigating the migration of immiscible contaminant fluid flow in homogeneous and heterogeneous aquifers with high-precision numerical simulations. PLoS ONE 2022, 17, e0266486. [Google Scholar] [CrossRef] [PubMed]
- Wu, Y.; Xie, H.; Wang, J.; Shi, Y.; Zhang, M. Deep learning-enhanced inverse framework for high-fidelity characterization of heterogeneous aquifers and DNAPL contamination zones using sparse geophysical data. J. Hydrol. 2025, 661, 133693. [Google Scholar] [CrossRef]
- Kamon, M.; Endo, K.; Kawabata, J.; Inui, T.; Katsumi, T. Two-dimensional DNAPL migration affected by groundwater flow in unconfined aquifer. J. Hazard. Mater. 2004, 110, 1–12. [Google Scholar] [CrossRef] [PubMed]
- Shi, J.; Chen, X.; Ye, B.; Wang, Z.; Sun, Y.; Wu, J.; Guo, H. A comparative study of DNAPL migration and transformation in confined and unconfined groundwater systems. Water Res. 2023, 245, 120649. [Google Scholar] [CrossRef] [PubMed]
- Shi, X.; Kokkinaki, A.; Kang, X.; Hao, S.; Gong, X.; Zhang, Y.; Wu, J. Comparison of geostatistical and deep-learning inversion methods for DNAPL source zone architecture characterization. Hydrogeol. J. 2023, 31, 1679–1693. [Google Scholar] [CrossRef]
- Li, M.; Chen, Q.; Yang, L.; Zhang, Y.; Jiang, J.; Deng, S.; Wan, J.; Fan, T.; Long, T.; Zhang, S. Contaminant characterization at pesticide production sites in the Yangtze River Delta: Residue, distribution, and environmental risk. Sci. Total Environ. 2023, 860, 160156. [Google Scholar] [CrossRef] [PubMed]
- Hu, H. The Research on Hyperbaric Oxygen Therapy and the Assessment of Neuropsychological in 1,2-Dichloroethane Toxic Encephalopathy. Masters’ Thesis, Guangzhou Medical University, Guangzhou, China, 2014. [Google Scholar]
- HJ 25.3-2019; Technical Guidelines for Risk Assessment of Soil Contamination of Land for Construction. Ministry of Ecological Environment of the People’s Republic of China: Beijing, China, 2019.
- Carle, S.F. T-PROGS: Transition Probability Geostatistical Software, version 2.1; University of California: Oakland, CA, USA, 1999. [Google Scholar]
- Rivett, M.O.; Allen-King, R.M. A controlled field experiment on groundwater contamination by a multicomponent DNAPL: Dissolved-plume retardation. J. Contam. Hydrol. 2003, 66, 117–146. [Google Scholar] [CrossRef] [PubMed]
- van der Ploeg, J.; van Hall, G.; Janssen, D.B. Characterization of the haloacid dehalogenase from Xanthobacter autotrophicus GJ10 and sequencing of the dhlB gene. J. Bacteriol. 1991, 173, 7925–7933. [Google Scholar] [CrossRef] [PubMed]

| Lithology | Horizontal Absolute Permeability (mD) | Vertical Absolute Permeability (mD) | Porosity | Density (kg/m3) | Thickness (m) |
|---|---|---|---|---|---|
| Miscellaneous Fill | 2354 | 1158 | 0.34 | 1876.8 | 4 |
| Silt | 18 | 12 | 0.34 | 1897.2 | 4 |
| Silt Sand Mixed with Silt | 1949 | 1011 | 0.34 | 1897.2 | 19 |
| Silt | 2851 | 1320 | 0.34 | 1846.2 | 23 |
| DNAPL | Indoor Steam Intrusion Risk Control Value (mg/L) | Outdoor Steam Intrusion Risk Control Value (mg/L) |
|---|---|---|
| DCE | 0.81 | 18.77 |
| CTC | 0.23 | 11.07 |
| Physical and Chemical Properties | DCE | CTC |
|---|---|---|
| Critical Temperature (K) | 356.7 | 349.9 |
| Critical Pressure (bar) | 53.7 | 45.6 |
| Critical Compressibility | 0.259 | 0.272 |
| Viscosity (cP) | 0.59 | 0.90 |
| Pitzer Centrifugal Constant | 0.278 | 0.193 |
| Electric Dipole Moment (debyes) | 1.8 | 0.0 |
| Boiling Point (K) | 360.4 | 394.4 |
| Molar Mass (g/mol) | 98.96 | 153.825 |
| Relative Density (kg/m3) | 1250 | 1548 |
| Temperature of Gas Diffusion (K) | 289 | 298 |
| Critical Volume (cm3/mole) | 225 | 275.9 |
| Solubility (mg/L) | 8600 | 793 |
| Partition Coefficient Koc (m3/kg) | 0.014 | 0.439 |
| Degradation Decay Constant (s−1) | 2.67 × 10⁻⁷ | 1.6 × 10⁻⁷ |
| Organic Carbon Fraction in Medium | 0.001 | 0.001 |
| Pollutants | Upward Transport Distance (m) | Downstream Transport Distance (m) | ||||||
|---|---|---|---|---|---|---|---|---|
| 5 a | 15 a | 25 a | 35 a | 5 a | 15 a | 25 a | 35 a | |
| DCE | 6.40 | 9.57 | 12.20 | 14.01 | 81.21 | 187.51 | 297.34 | 459.58 |
| CTC | 4.99 | 8.98 | 11.45 | 13.57 | 78.58 | 180.20 | 286.40 | 453.51 |
| DCE (mixed) | 5.93 | 9.00 | 11.28 | 13.76 | 80.45 | 184.41 | 294.54 | 440.46 |
| CTC (mixed) | 4.49 | 8.41 | 10.56 | 13.23 | 76.66 | 177.02 | 283.25 | 420.32 |
| DNAPL | Upward Transport Distance (m) | Downstream Transport Distance (m) | ||||||
|---|---|---|---|---|---|---|---|---|
| 1 a | 4 a | 6 a | 10 a | 1 a | 4 a | 6 a | 10 a | |
| DCE | 2.61 | 2.89 | 3.26 | 0.64 | 16.11 | 42.97 | 52.14 | 48.65 |
| CTC | 0.5 | 0 | 0 | 0 | 3.32 | 1.68 | 2.05 | 0.95 |
| DNAPL | Upstream Transport Distance (m) | Downstream Transport Distance (m) | ||||||
|---|---|---|---|---|---|---|---|---|
| 5 a | 15 a | 25 a | 35 a | 5 a | 15 a | 25 a | 35 a | |
| DCE | 8.19 | 13.73 | 14.23 | 14.82 | 67.97 | 155.07 | 301.28 | 397.99 |
| CTC | 5.62 | 12.00 | 13.74 | 14.22 | 60.99 | 144.88 | 257.25 | 354.11 |
Disclaimer/Publisher’s Note: The statements, opinions and data contained in all publications are solely those of the individual author(s) and contributor(s) and not of MDPI and/or the editor(s). MDPI and/or the editor(s) disclaim responsibility for any injury to people or property resulting from any ideas, methods, instructions or products referred to in the content. |
© 2025 by the authors. Licensee MDPI, Basel, Switzerland. This article is an open access article distributed under the terms and conditions of the Creative Commons Attribution (CC BY) license (https://creativecommons.org/licenses/by/4.0/).
Share and Cite
Xie, W.; Li, M.; Jiang, D.; Kong, L.; Wang, M.; Deng, S.; Li, X. Impact of Aquifer Heterogeneity on the Migration and Natural Attenuation of Multicomponent Heavy Dense Nonaqueous Phase Liquids (DNAPLs) in a Retired Chemically Polluted Site. Processes 2025, 13, 2338. https://doi.org/10.3390/pr13082338
Xie W, Li M, Jiang D, Kong L, Wang M, Deng S, Li X. Impact of Aquifer Heterogeneity on the Migration and Natural Attenuation of Multicomponent Heavy Dense Nonaqueous Phase Liquids (DNAPLs) in a Retired Chemically Polluted Site. Processes. 2025; 13(8):2338. https://doi.org/10.3390/pr13082338
Chicago/Turabian StyleXie, Wenyi, Mei Li, Dengdeng Jiang, Lingya Kong, Mengjie Wang, Shaopo Deng, and Xuwei Li. 2025. "Impact of Aquifer Heterogeneity on the Migration and Natural Attenuation of Multicomponent Heavy Dense Nonaqueous Phase Liquids (DNAPLs) in a Retired Chemically Polluted Site" Processes 13, no. 8: 2338. https://doi.org/10.3390/pr13082338
APA StyleXie, W., Li, M., Jiang, D., Kong, L., Wang, M., Deng, S., & Li, X. (2025). Impact of Aquifer Heterogeneity on the Migration and Natural Attenuation of Multicomponent Heavy Dense Nonaqueous Phase Liquids (DNAPLs) in a Retired Chemically Polluted Site. Processes, 13(8), 2338. https://doi.org/10.3390/pr13082338