Abstract
In order to meet the needs for the rapid detection of crop growth and support variable management in farmland, an intelligent chlorophyll content in cotton leaves (CCC) detection system based on hyperspectral imaging (HSI) technology was designed and developed. The system includes a near-infrared (NIR) hyperspectral image acquisition module, a spectral extraction module, a main control processor module, a model acceleration module, a display module, and a power module, which are used to achieve rapid and non-destructive detection of chlorophyll content. Firstly, spectral images of cotton canopy leaves during the seedling, budding, and flowering-boll stages were collected, and the dataset was optimized using the first-order differential algorithm (1D) and Savitzky–Golay five-term quadratic smoothing (SG) algorithm. The results showed that SG had better processing performance. Secondly, the sparrow search algorithm optimized backpropagation neural network (SSA-BPNN) and one-dimensional convolutional neural network (1DCNN) algorithms were selected to establish a chlorophyll content detection model. The results showed that the determination coefficients of the chlorophyll SG-1DCNN detection model during the seedling, budding, and flowering-boll stages were 0.92, 0.97, and 0.95, respectively, and the model performance was superior to SG-SSA-BPNN. Therefore, the SG-1DCNN model was embedded into the detection system. Finally, a CCC intelligent detection system was developed using Python 3.12.3, MATLAB 2020b, and ENVI, and the system was subjected to application testing. The results showed that the average detection accuracy of the CCC intelligent detection system in the three stages was 98.522%, 99.132%, and 97.449%, respectively. Meanwhile, the average detection time for the samples is only 20.12 s. The research results can effectively solve the problem of detecting the nutritional status of cotton in the field environment, meet the real-time detection needs of the field environment, and provide solutions and technical support for the intelligent perception of crop production.
1. Introduction
Chlorophyll functions as a fundamental component in plant organs, and its concentrations play a crucial role as a significant physicochemical indicator of crop development. An accurate and efficient quantification of chlorophyll content in cotton leaves (CCC) is of significant importance for predicting crop yield and making well-informed decisions regarding field management [1,2,3]. Conventional methods for quantifying chlorophyll levels usually involve field sampling, followed by laboratory analysis. These methods pose challenges such as time consumption, labor intensiveness, destructiveness, and delays [4]. The adoption of hyperspectral technology for evaluating the physicochemical parameters of plants, such as chlorophyll, has increasingly become a crucial tool for assessing crop characteristics. This technology provides benefits such as efficient resource utilization and quick, non-destructive measurements [5,6,7,8].
Since 2017, neural networks have gained significant attention in the field of spectral qualitative and quantitative prediction due to their inherent capabilities in learning, fault tolerance, real-time processing, and ability to address non-linear challenges [9,10,11,12]. Among various neural networks, the backpropagation neural network (BPNN) emerges as a prominent machine learning algorithm distinguished by its multi-layer forward structure and the utilization of the backpropagation learning algorithm. The performance of BPNN in recognizing and predicting the classification of non-linear patterns has been found to be commendable [13,14,15]. The application of back propagation neural network (BPNN) in forecasting grape ripeness through the integration of color parameters (R, G, B, H, S, and I) extracted from grape skin has proven to be an effective and advanced method [16]. Furthermore, researchers have developed models for retrieving winter wheat chlorophyll levels using BPNN and regression analysis. They have then compared the actual measurements with the estimations derived from the models. Their findings indicated that the BPNN-based inversion model consistently exhibited significantly greater accuracy compared to the regression analysis model [17]. In subsequent studies, researchers have utilized a variety of modeling techniques to develop estimation models for chlorophyll content in corn leaves. Once more, the superior predictive capabilities of the BPNN network model were confirmed [18]. However, it is crucial to recognize that despite the commendable detection performance demonstrated by the BPNN model, it is associated with certain limitations, such as slow convergence, susceptibility to local optima, and the risk of overfitting [19,20]. To address these limitations, Li et al. [20] endeavored to enhance the BPNN model by employing a genetic algorithm. Their efforts resulted in the development of an ecosystem health assessment model tailored to 16 specific regions in the Yunnan Province. Furthermore, the enhanced model, which utilizes a particle swarm optimization (PSO) algorithm in conjunction with a BPNN approach to forecast the gelatinization characteristics of millet flour using hyperspectral data, exhibited superior predictive capabilities [21]. Furthermore, there has been a gradual integration of deep neural networks in the development of analysis and prediction models.
Convolutional neural network (CNN), a significant algorithm within the field of deep learning [22,23,24,25], is distinguished by its utilization of convolutional layers in a deep neural network. Acquarelli et al. [26] proposed a CNN model that included a convolutional layer. They assessed the analytical accuracy of this model on 10 datasets. The model was utilized for both raw and preprocessed spectral data. The results indicated that the CNN model achieved an average accuracy of 96% and exhibited reduced reliance on data preprocessing. Xie et al. [27] conducted a comparative analysis of the benefits and drawbacks associated with building models utilizing support vector machine (SVM) and deep learning techniques for assessing the freshness of spinach based on hyperspectral images. The deep learning model attained an 80% accuracy rate in image recognition using solely three bands of images. In their research, Wu et al. [28] investigated the potential of utilizing hyperspectral imaging (HSI) combined with the CNN algorithm for the identification of chrysanthemum varieties. By leveraging the entire spectrum, CNN attained close to 100% accuracy in both the training and test datasets. This approach establishes a fundamental basis for the creation of an online assessment system for chrysanthemums. Furthermore, a significant amount of research has been conducted on the application of hyperspectral techniques in conjunction with machine learning and deep learning methodologies for the identification of crop nutrients and associated characteristic parameters. The research has predominantly concentrated on rice [29,30], corn [18,31,32], and wheat [5,6,20], with a limited number of published studies investigating cotton as the subject of research [33,34]. The prediction and horizontal comparison of CCC at the three growth stages of Xinjiang cotton, as well as the optimization of the preferred model, represent a seldom-discussed topic in previous studies.
The HSI technology integrates the benefits of spectroscopy principles and image analysis techniques to enable a comprehensive diagnosis of crop growth information [34,35]. Currently, spectral detection and imaging equipment are extensively utilized for assessing crop chlorophyll content. The Green Seeker Handheld sensor is capable of generating normalized difference vegetation index (NDVI) using crop canopy reflectance spectra to develop models for detecting chlorophyll indicators. However, it is unable to provide the real-time measurements of chlorophyll content values [36,37].
In response to the fact that most of the above research is still in the laboratory stage and cannot meet the real-time, rapid, and non-destructive detection of crop growth parameters, this study combines hyperspectral imaging and deep learning technology and designs and develops a CCC intelligent detection system based on Python, MATLAB, and ENVI platforms to achieve real-time, non-destructive, and high-precision detection of cotton leaf chlorophyll content. Through sensor system integration, batch detection of CCC parameters is achieved, providing support for accurate management decisions in the field.
2. Overall System Design
To achieve the efficient detection of chlorophyll content in three stages of cotton, an intelligent cotton leaf chlorophyll detection system is designed and developed based on deep learning and hyperspectral imaging analysis technology, with cotton crops as the object. The overall design process of the system is shown in Figure 1. Firstly, the system collects spectral image information of cotton leaves through a hyperspectral image acquisition system. Secondly, image matching, segmentation, and spectral feature extraction are performed on the identified regions of interest. Once again, a prediction model for the chlorophyll content in cotton leaves was constructed to provide technical and equipment support for high-throughput crop nutrition diagnosis in the field.

Figure 1.
General design drawing.
2.1. Hardware System Composition and Working Principle
2.1.1. Hyperspectral Image Acquisition Module
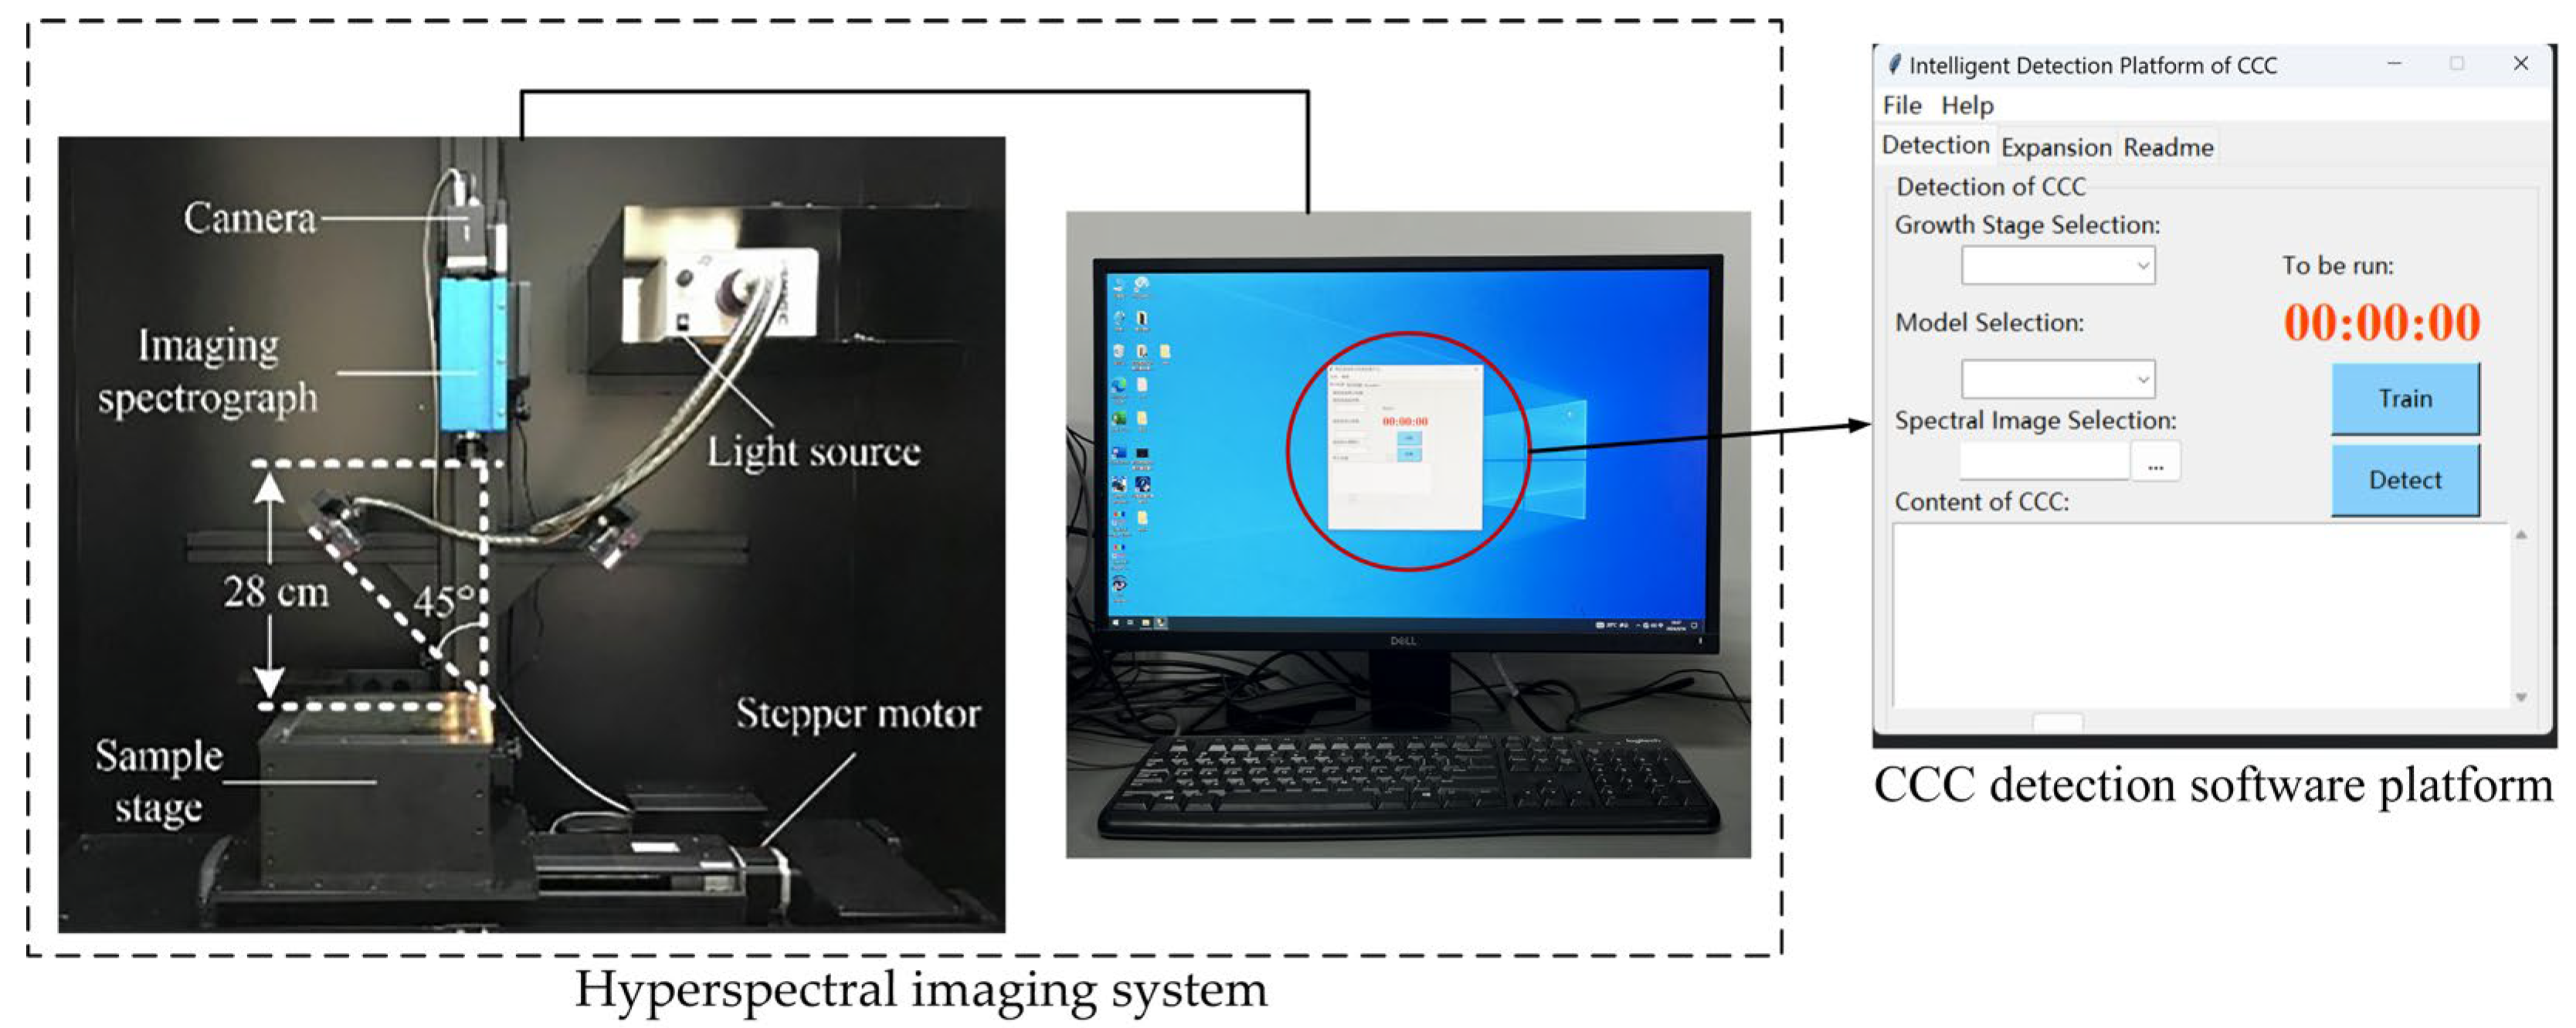
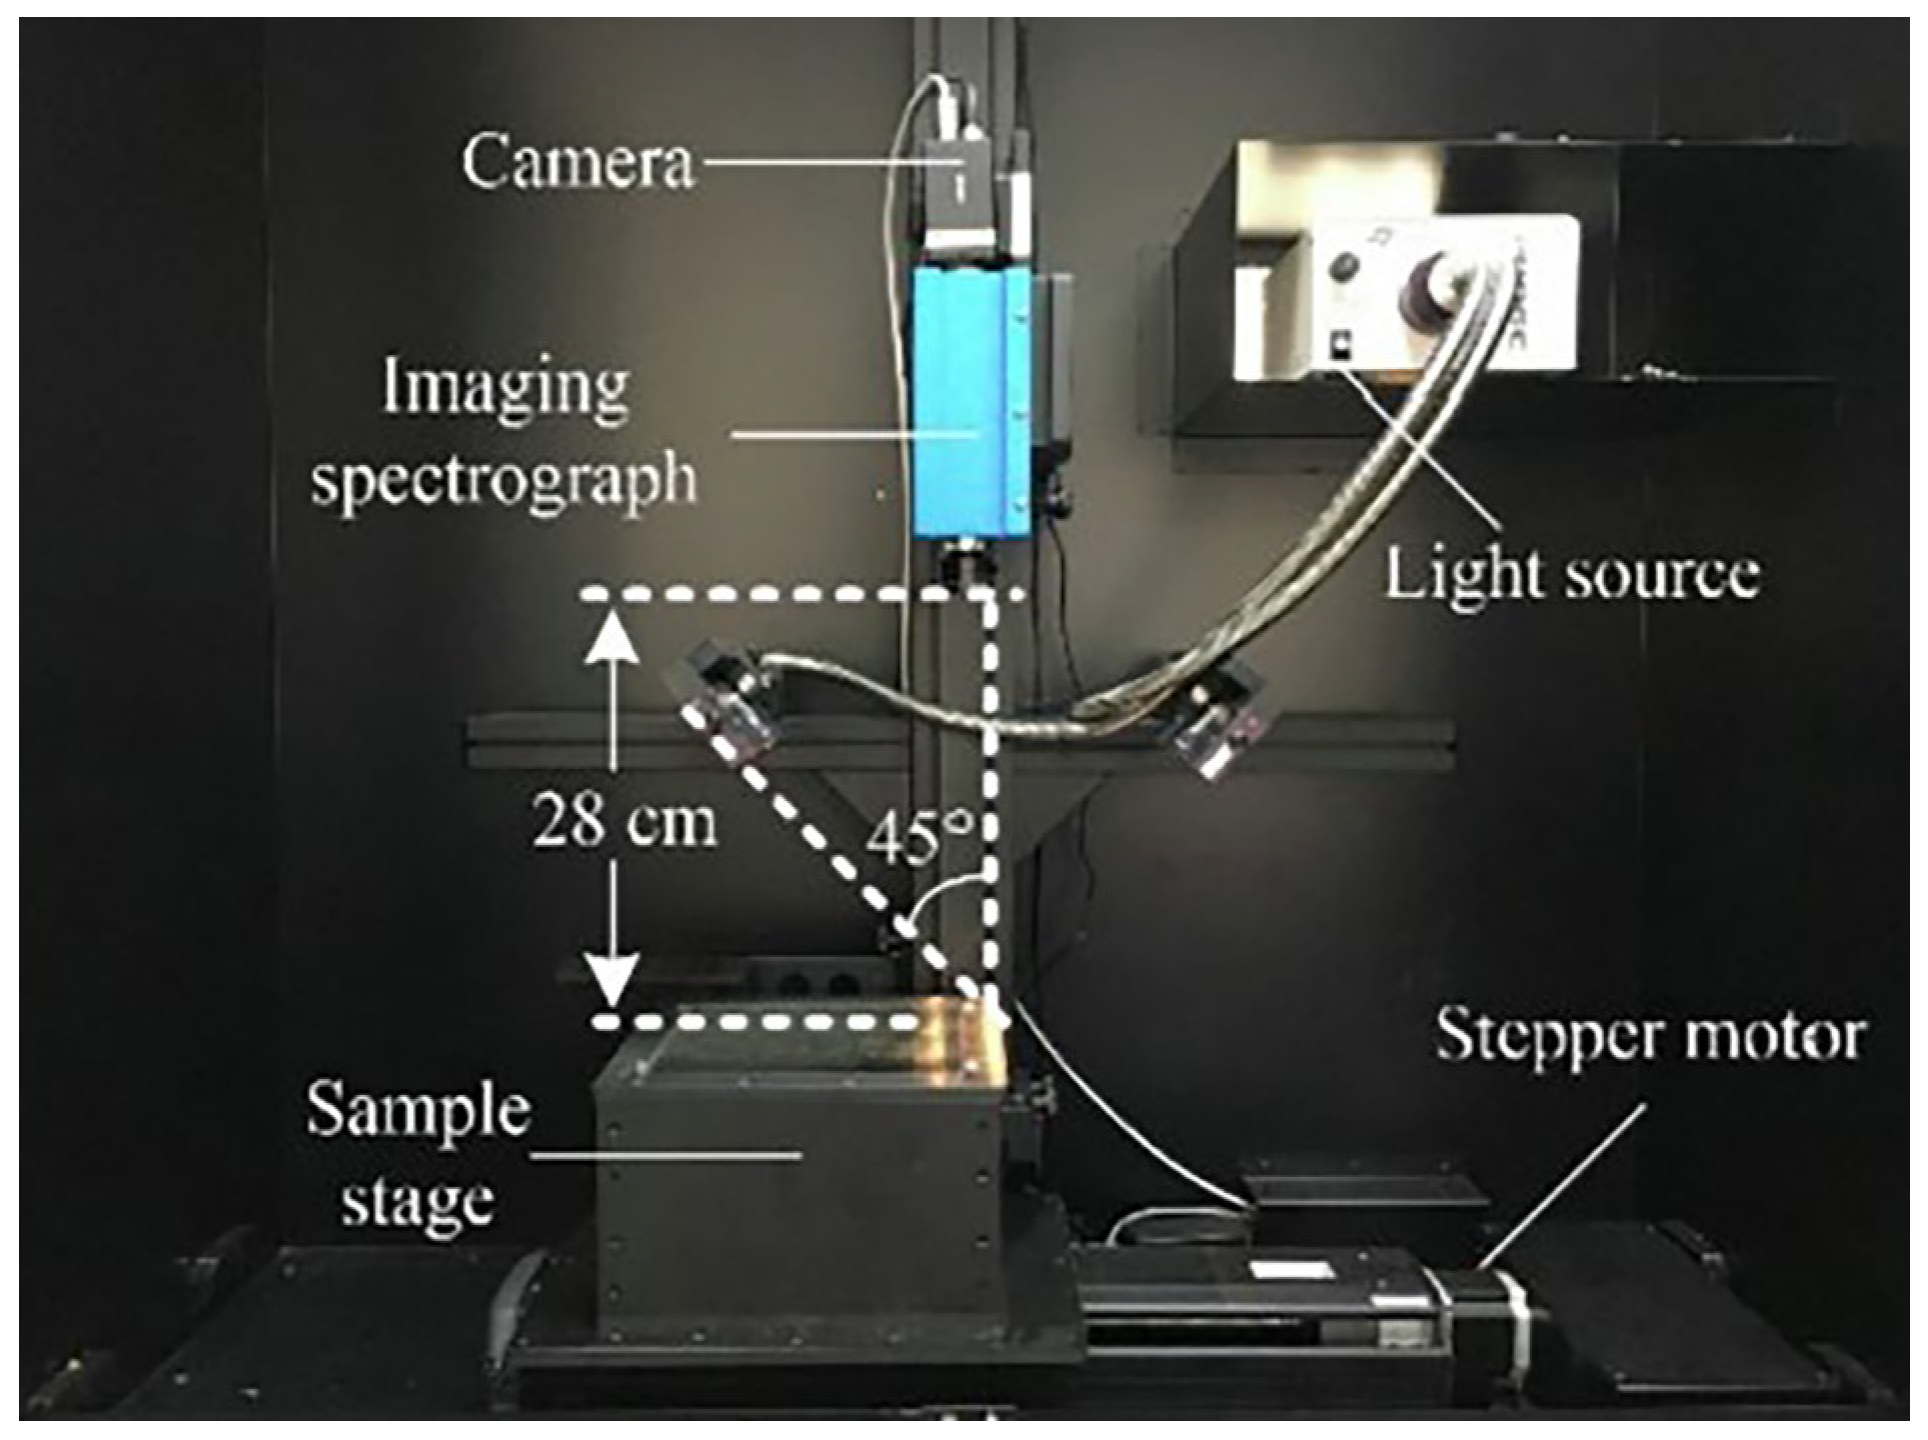
Images depicting cotton leaves were acquired using an HSI system manufactured by ISUZU OPTICS Co., Ltd., Shanghai, China. In Figure 2, the setup primarily consists of an imaging spectrometer, a 150 W light source that provides parallel light, a precision delivery unit set (Zhuo Li Hanguang, SC300-1A, Beijing, China), a 14-bit thermoelectrically cooled electron multiplying charge-coupled device (EMCCD), and a camera (Andor Luca EMCCD DL604M, Andor Technology plc., Belfast, UK). The spectral range spans from 400 to 1000 nm, with a spectral resolution of 2.8 nm. The system functions by utilizing line scan technology to acquire hyperspectral data from samples. To reduce the baseline variation, both the light source and camera are activated and allowed to preheat for 30 min before collecting pertinent data on hyperspectral images. The system was operated under specific setting conditions: a 45° angle was established between the light source and the vertical plane, the exposure time (T) was set at 0.016 s, a 28 cm distance was maintained between the sample and the lens, and the image acquisition speed (V) was fixed at 1.35 mm/s. During the testing process, the blade was positioned centrally on the carrier table.
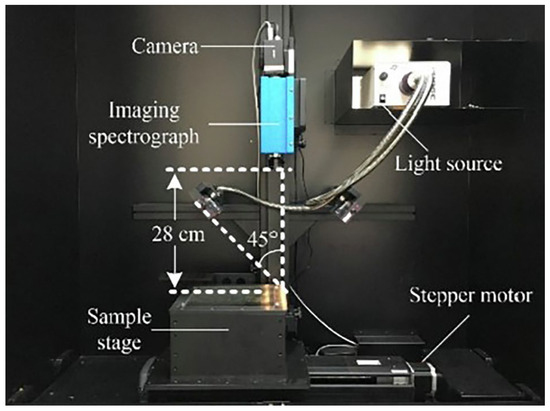
Figure 2.
Schematic of HSI system configuration for data acquisition.
2.1.2. Correction of Hyperspectral Images
To mitigate potential interferences on spectra with low reflectance—caused by spatial light intensity conversion within the halogen lamp and the existence of dark current in charge-coupled device (CCD) camera—it is essential to conduct instrument black–white correction and hyperspectral image black–white calibration before acquiring hyperspectral data [38]. In the identical system conditions used to collect the required samples, a white calibration image W was produced by scanning a white calibration board with a diffuse reflection efficiency of 99%, whereas a black calibration image B was obtained by closing the camera shutter. These steps collectively form the calibration process for hyperspectral images. Subsequently, the absolute image I that has been acquired is transformed into a relative image E:
2.2. Software Design
2.2.1. Software Functional Architecture
In order to achieve the efficient detection of CCC index, a software system was designed that combines MATLAB, ENVI, and Python and imports pandas and openpyxl into Python to process the collected data in real-time and detect chlorophyll content. The system software runs on the Windows system, and the functional architecture of the system software is shown in Figure 3. The software embeds a cotton leaf chlorophyll detection model based on deep learning, with the following specific functions: hyperspectral image processing, hyperspectral image feature extraction, and CCC detection.
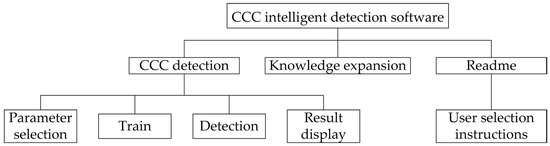
Figure 3.
Functional architecture of system software.
2.2.2. Development Environment for CCC Intelligent Detection Software
The development environment and tools for CCC intelligent detection software in this study, categorized based on their functions, are shown in Table 1.

Table 1.
Development environment and tools for CCC detection software.
2.2.3. Workflow Design of Detection Software
In the current spectral research and analysis—from the initial establishment of the research object to the final practical application—it usually includes processes such as collecting experimental samples, sample preparation, standard measurement of sample indicators, spectral collection, spectral data preprocessing, spectral modeling and analysis, model evaluation, model improvement, and practical application. These processes often have problems such as multiple platforms, difficult platform operation, and misoperation. This CCC intelligent detection system is designed to integrate the ENVI platform for spectral information acquisition and the MATLAB platform for feature data processing and model training detection into the Python central control platform, in response to the problems of complex operation and low efficiency that exist when spectral information acquisition, prediction model training, and nutrient detection are carried out on different platforms, to achieve automated invocation. By constructing a simple and easy-to-operate graphical interface, it is expected to reduce the usage and learning costs for personnel actually operating the CCC intelligent detection system.
During the training process, the central control platform initiates the execution of SVM algorithm in MATLAB for image segmentation. Subsequently, it invokes the ENVI platform to extract the representative ROI spectrum from the sample. Subsequently, MATLAB was employed to enhance the spectral information of the respective bands for various detection objects through the optimal preprocessing algorithm. The spectral information data was stored as a training set categorized by growth stage and prediction model classification list through the utilization of Pandas and Openpyxl libraries in Python. Finally, MATLAB was utilized to train the predefined training set using the optimal model based on the spectral characteristics of cotton leaves at various growth stages. The model parameters were then saved for future detection purposes.
During the detection process, it is necessary to initially choose the cotton spectral image, growth stage, and modeling algorithm to be identified via the central control platform. Secondly, spectral information data should be acquired using the identical preprocessing method employed during the training phase. Subsequently, the spectral information and the associated model parameters, which were preserved during the training process, are utilized as inputs for the detection model in MATLAB. This process results in the generation of CCC data corresponding to the leaf, which is then exhibited on the platform interface. To enhance precision, the software considers the final CCC detection result as the average value of three detections. The schematic representation of the software’s comprehensive workflow is illustrated in Figure 4.
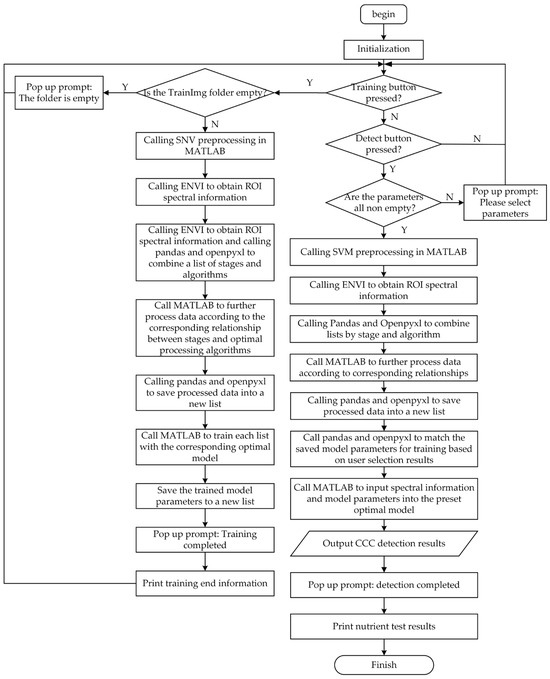
Figure 4.
Flowchart of CCC detection software.
3. Staged Detection Method for Chlorophyll in Cotton Leaves
3.1. Sampling Location
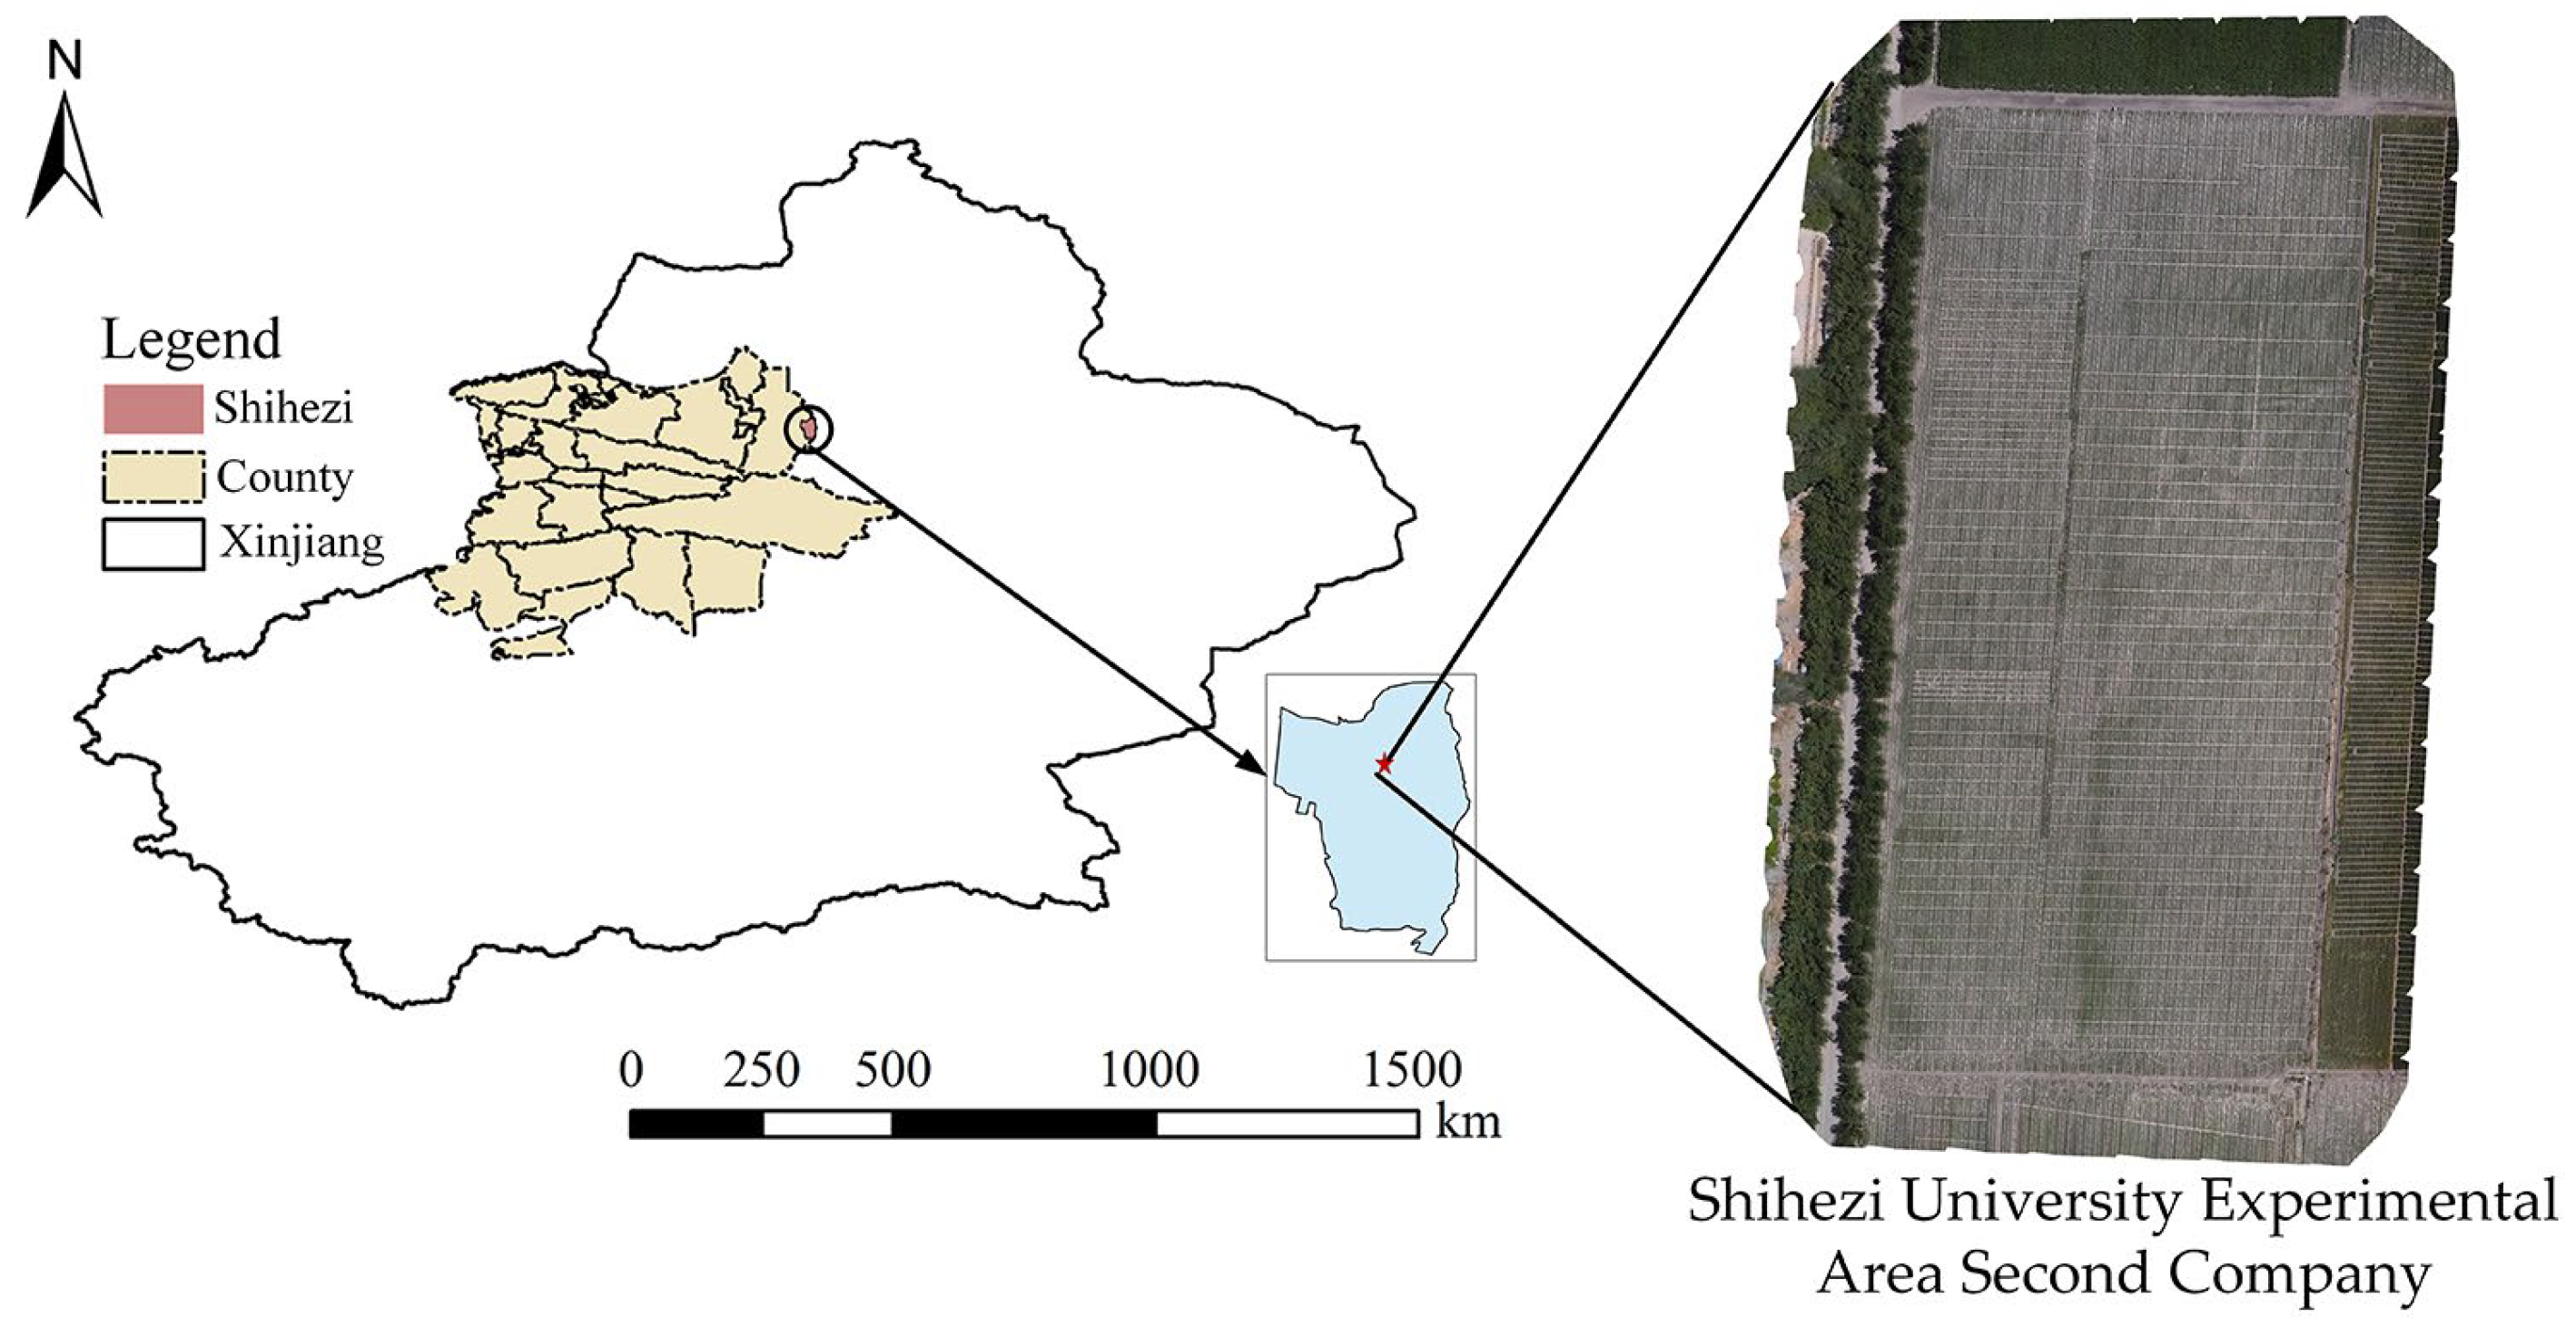
Samples were collected from the experimental grounds of the second company at Shihezi University in Xinjiang Uygur Autonomous Region (86.08° E, 44.31° N). This region is characterized by a temperate continental climate with temperature fluctuations and abundant sunshine, with annual sunshine hours ranging from 2500 h to 3500 h. The precise sampling site is illustrated in Figure 5.
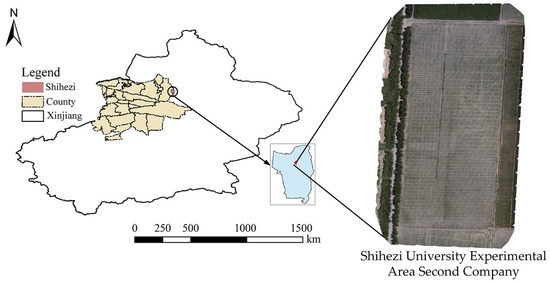
Figure 5.
Geographic schematic of chlorophyll content sampling site.
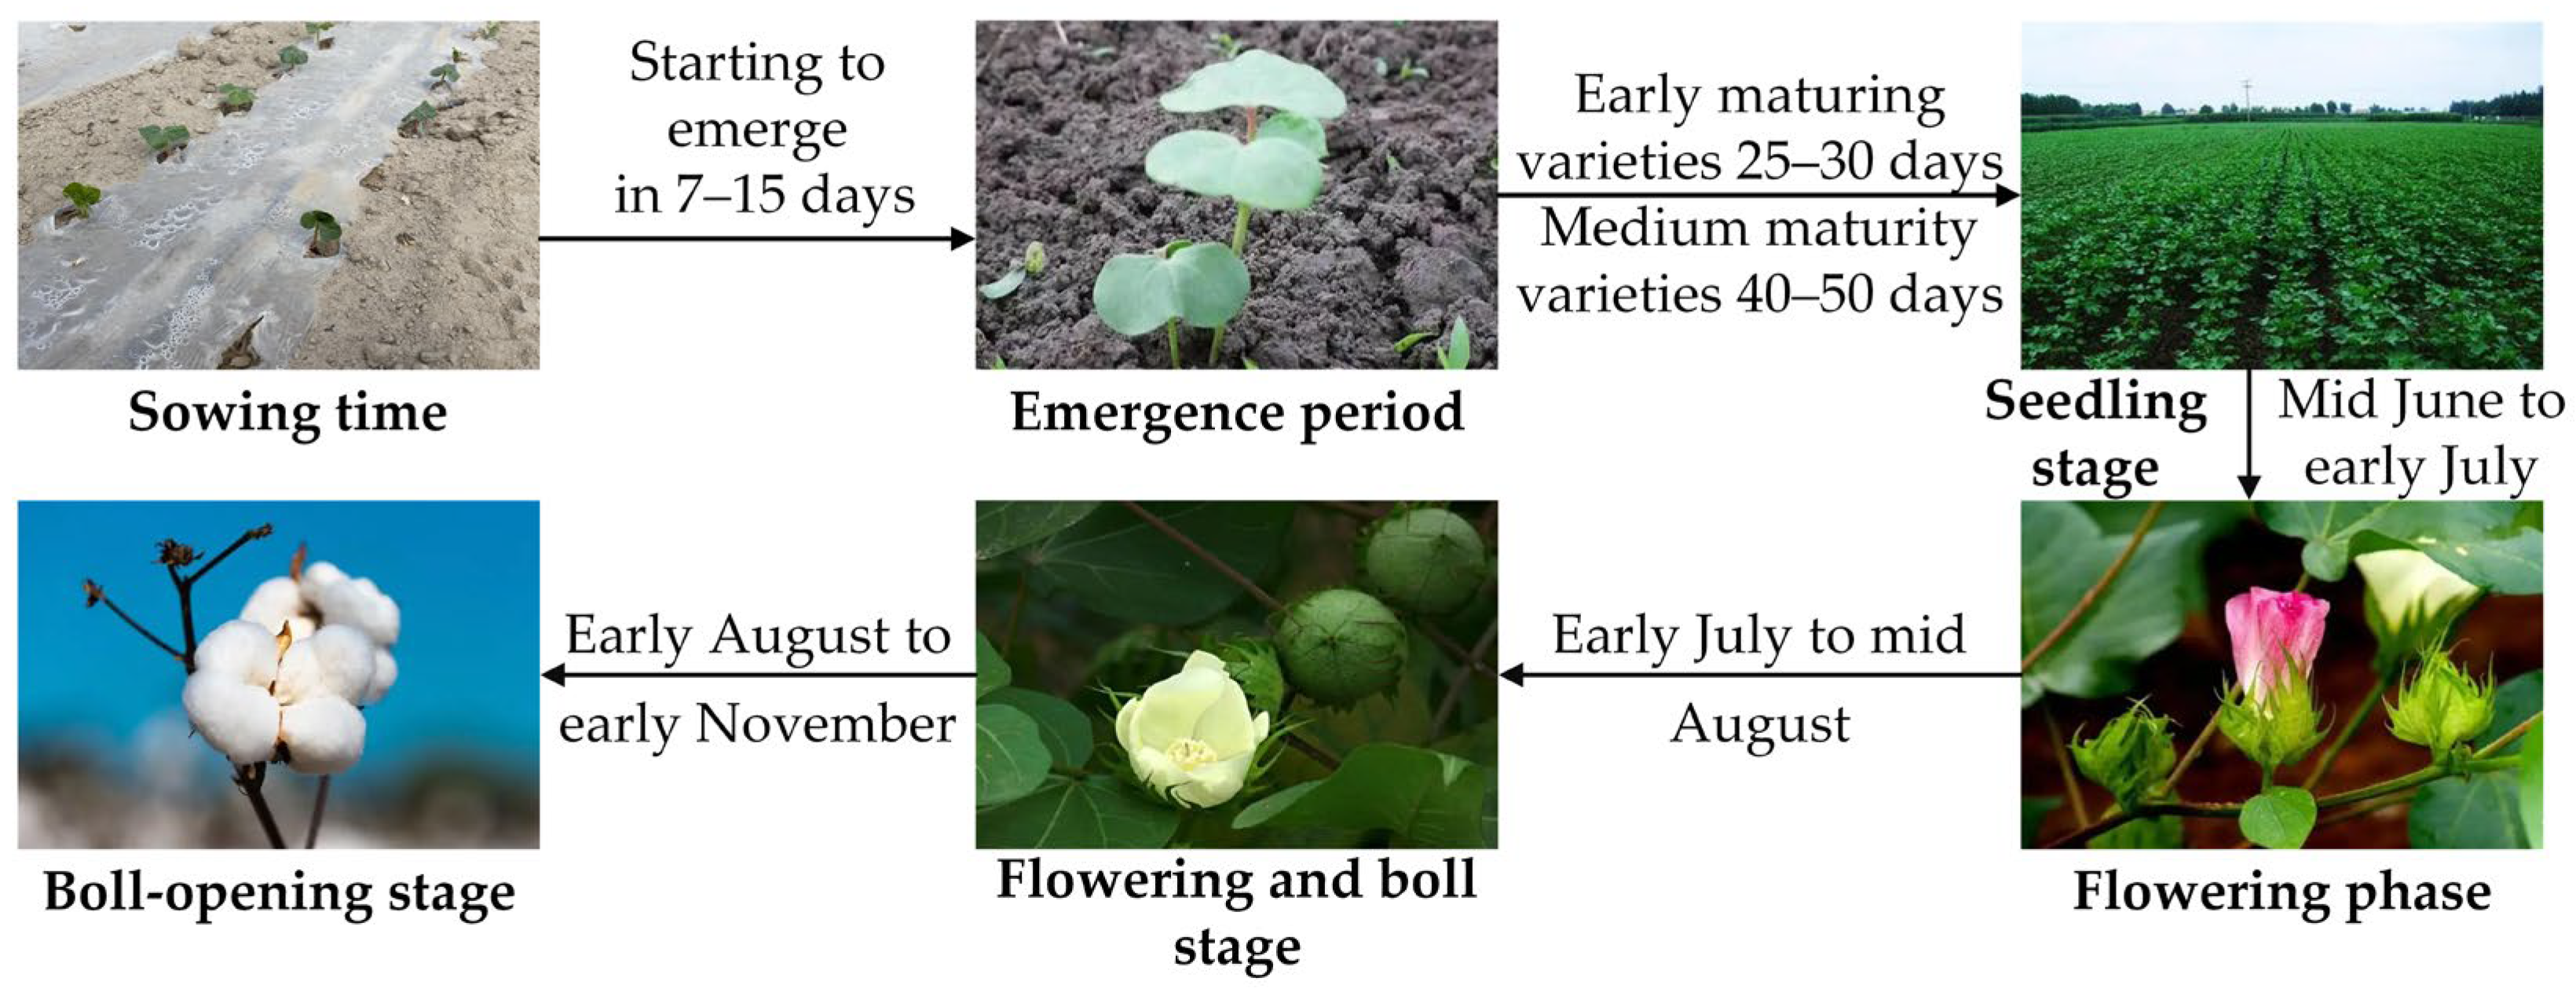
The research object of this article is DH10 cotton, and the samples were collected at three specific time points: 13 June (seedling stage), 10 July (budding stage), and 5 August (flowering-boll stage). The growth cycle characteristics of cotton are shown in Figure 6.
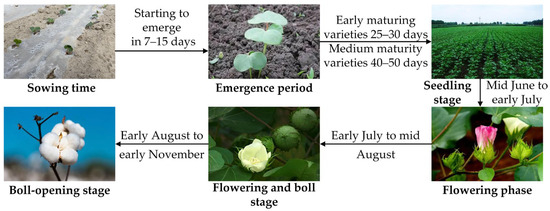
Figure 6.
Overview of cotton growth cycle.
According to the results of field investigation and relevant data access, cotton plants were randomly selected and marked at the sampling point by using a combination of the “five-point sampling method” and the “random sampling method”. The number of leaves per plant from top to bottom was counted, and the main leaves of the third branch were picked. The leaves growing at this position were generally well developed and representative. After the leaves were marked, they were sealed and bagged and placed in a portable fresh-keeping refrigerator to save the samples. Excluding the samples damaged due to improper storage, the number of leaf samples obtained in the three periods was 259, 308, and 315.
3.2. Processing of Hyperspectral Images
3.2.1. Hyperspectral Image Segmentation and the Extraction of Region of Interest Information
The research object of this article is chlorophyll in cotton leaves. The band with better chlorophyll expression is located in the visible light short-wave near-infrared band (400–1000 nm). Therefore, the spectral information of this band is extracted for the subsequent construction of the inversion model. The image segmentation method was utilized to delineate the regions of interest (ROI) for the samples obtained from the corrected images and to extract their respective spectral information [39]. The ROI selection steps in most studies include processing the samples to the same size and then extracting the information within a limited area. However, as the cotton leaves change during the growth process and chlorophyll is distributed throughout the entire leaf, in order to ensure the accuracy of the CCC monitoring system’s detection process, in this study, the ROI area was set to the entire leaf part excluding the stem. The raw images of the representative samples are depicted in Figure 7a. Given the clear color contrast between the leaf and the primary stem, as depicted in the leaf image, this study utilizes SVM for the identification and extraction of RGB values of individual pixels. These values serve as unique features for image segmentation. The sample images obtained are presented in Figure 7b. These images were later identified as the sample ROI, as shown in Figure 7c. Within this ROI, the average spectrum was determined by considering all pixels, which serves as the representative spectral information for the sample (Figure 7d).
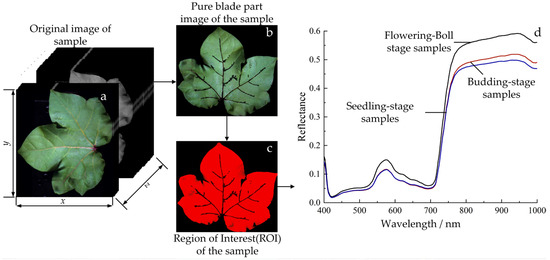
Figure 7.
Image segmentation and extraction of spectral information from ROI. (a) Original image of sample; (b) Pure blade part image of the sample; (c) Region of Interest(ROI) of the sample; (d) Spectral information.
3.2.2. Preprocessing of Hyperspectral Information
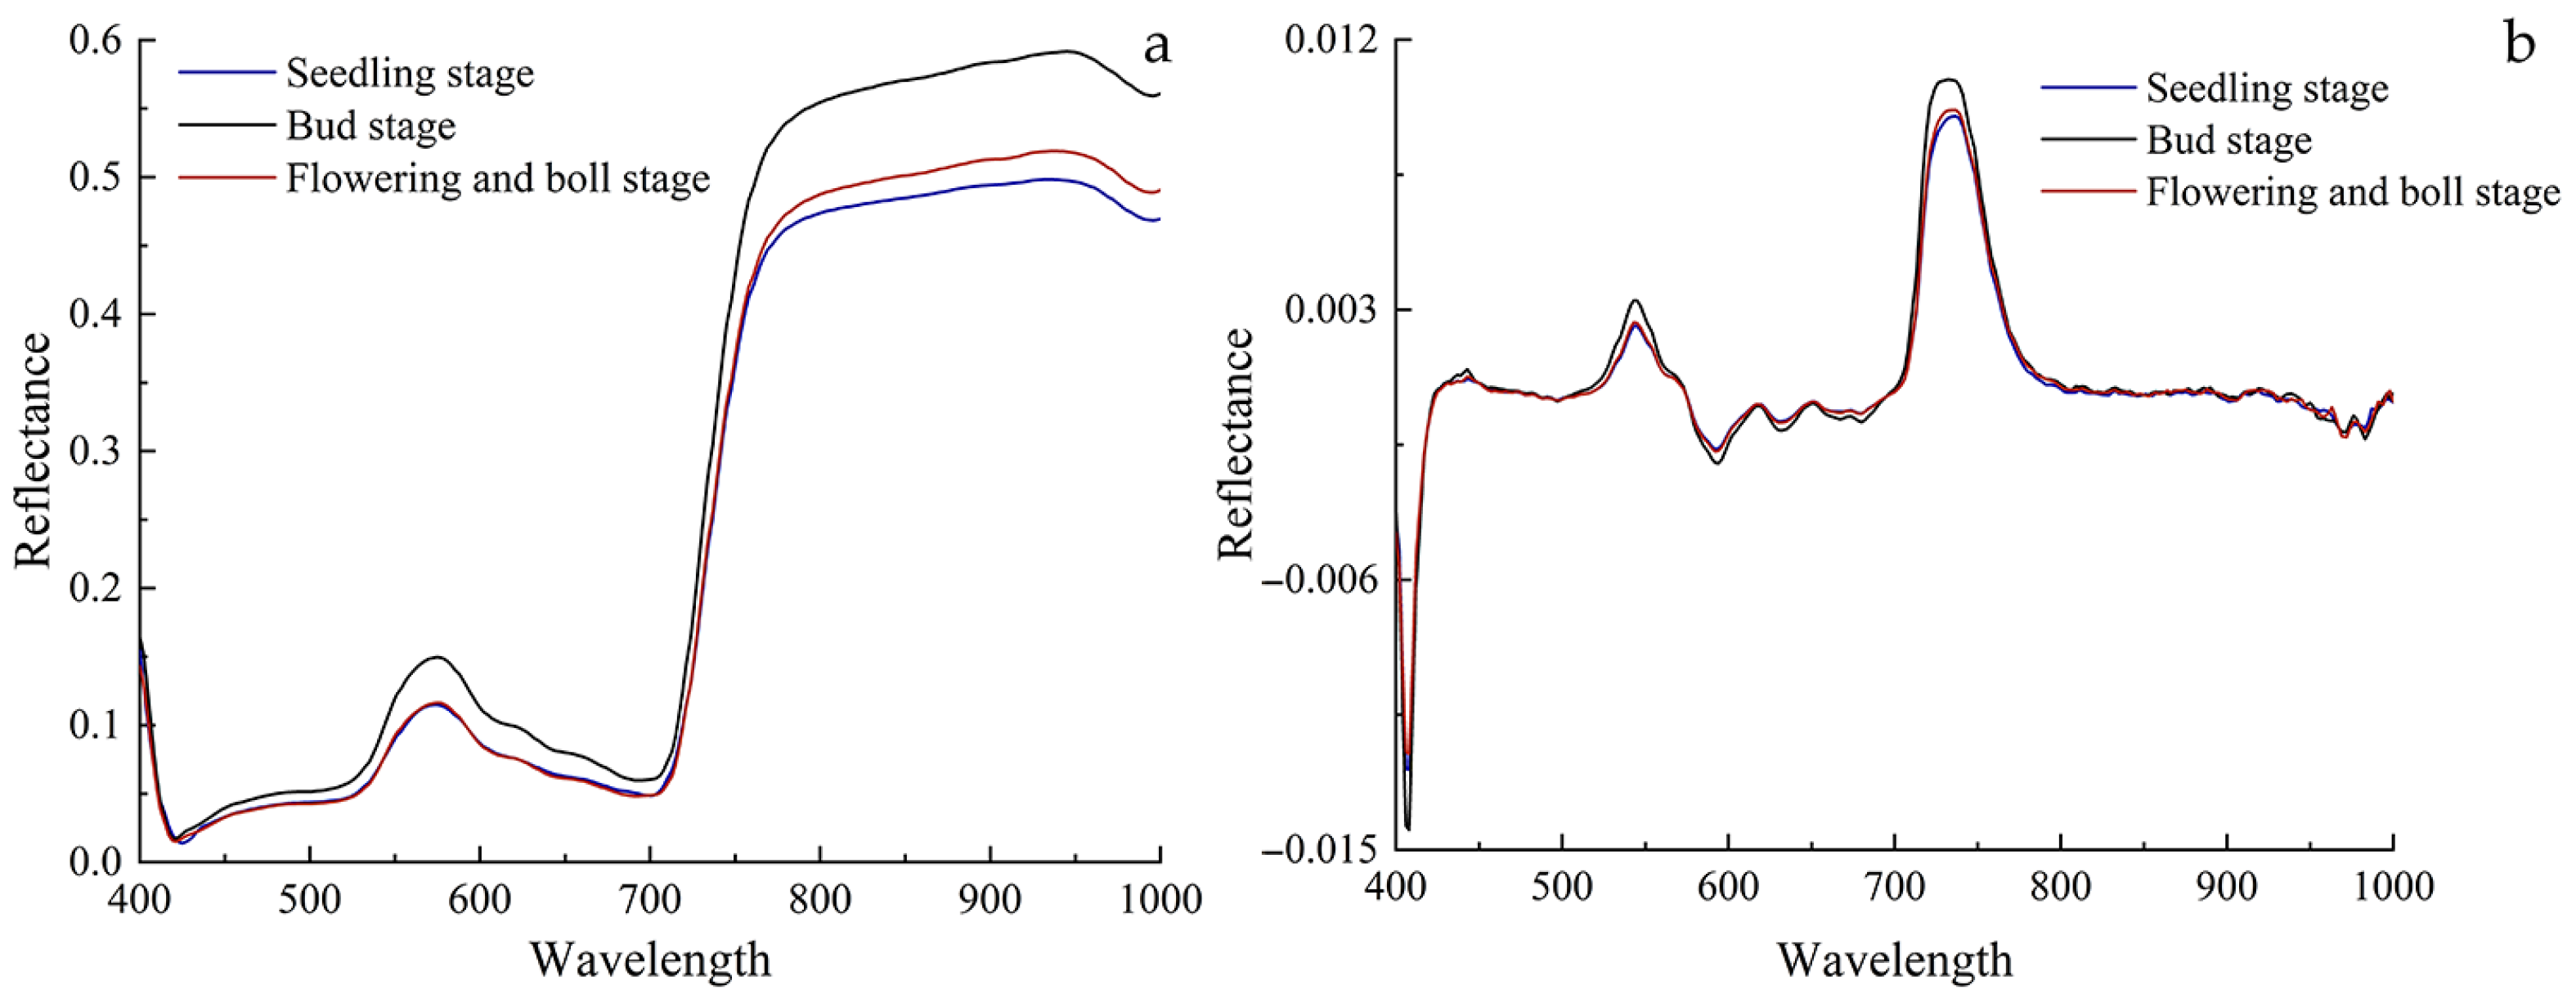
The on-site lighting changes are subject to certain constraints of the instrument itself, which leads to unwanted factors, including noise and dark current. Additionally, it is also, to a certain extent, contaminated with its own non-quality information. For instance, the existence of baseline variation in spectral curves, multicollinearity, and noise-related problems leads to redundancy within this dataset. This redundancy not only affects the response time of the model but also has the potential to affect its overall performance. Consequently, to maintain the integrity of the image and reduce the effects of these adverse factors on the spectral curves of the samples, it is essential to preprocess the original spectral data. In this study, one-dimensional (1D) and Savitzky–Golay (SG) filters were employed for the preprocessing of spectral data. The processed spectral reflectance is illustrated in Figure 8. During the seedling stage, the spectral reflectance of cotton leaves reaches its peak, while it decreases to a minimum during the budding stage. This phenomenon can be explained by the high CCC at the budding stage, which causes darker leaf coloration and increased absorption of spectral wavelengths. As a result, this leads to reduced reflectance.

Figure 8.
Processed spectral reflectance data curve of cotton leaves: (a) Savitzky–Golay five-term quadratic smoothing; (b) first-order differential.
3.3. Establishment and Evaluation of Chlorophyll Content Detection Model for Cotton Leaves
3.3.1. Model Accuracy Evaluation Criteria
In this study, the sparrow algorithm optimized back propagation neural network (SSA-BPNN) and the one-dimensional convolutional neural network (1DCNN) were used to establish the CCC prediction models at the cotton seedling stage, budding stage, and flowering-boll stage, respectively. According to the random principle of sample data, 80% of the samples collected in the three periods were used as modeling samples, and the remaining 20% were used for prediction.
This study established a one-dimensional convolutional neural network model with a 3-layer convolutional structure. It includes three convolutional layers, three max pooling layers, one flatten layer, one fully connected layer, one dropout layer, and one output layer. The convolutional layer is the core structure of CNN, which can locally perceive spectral data and facilitate the extraction of feature spectral information. The max pooling layer can compress and extract the main spectral features. The dropout layer can randomly deactivate some neurons to prevent overfitting of the model. The convolutional neural network model was trained using the training set data, and the hyperparameters of the model were optimized, resulting in a dropout layer coefficient of 0.2, a convolution kernel size of 3 × 1, and 32 neurons.
The evaluation criteria for the predictive models developed in this research encompass relative error (RE), coefficient of determination (), root mean square error of prediction (RMSEP), and relative percent deviation (RPD). RE denotes the degree of relative deviation between a measured value and the actual value. A smaller RE indicates a closer proximity of the measured value to the true value, whereas a larger RE signifies a greater disparity between the measured and true values. is used to denote the prediction set, indicating the degree of correlation between the predicted and measured values of the samples in the prediction set. This value ranges from 0 to 1, with higher values suggesting a higher level of accuracy in the model. RMSEP is employed to evaluate the predictive performance of the developed model on external validation samples. Smaller RMSEP values suggest a higher predictive capability of the model. RPD serves as a comprehensive evaluation index for the prediction model. RPD is determined by dividing the standard deviation by RMSEP. A higher relative predictive deviance (RPD) value signifies superior predictive performance of the model. An RPD value exceeding 2 indicates a high predictive capability of the model for the specific sample, whereas an RPD value below 1.4 suggests that the model is unsuitable for predicting values associated with the sample. The formula for determining RPD is expressed as follows:
where and are the actual and predicted values of the ith sample, respectively; is the averaged actual value; and n is the number of samples. A model is considered proficient in prediction if RPD exceeds 2.0. If RPD is within the range of 1.4 to 2.0, the model is capable of offering a fundamental estimation of CCC. However, improvements are necessary to enhance its predictive accuracy. When RPD is less than or equal to 1.4, it indicates poor model accuracy and insufficient prediction capability.
3.3.2. Screening of Spectral Preprocessing Methods
This study used two methods, 1D and SG, to preprocess the original spectra. Based on the original spectra and spectra processed by different methods, a partial least squares regression (PLSR) model was established for the chlorophyll content of cotton leaves during the seedling, budding, and flowering-boll stages. The evaluation results are shown in Table 2.
Table 2.
Evaluation results of PLSR model for cotton leaf samples under different preprocessing methods.
According to Table 2, when establishing the PLSR models using spectral information processed by different preprocessing methods during the seedling, bud, and boll stages of cotton, the spectral model based on SG preprocessing showed the best performance, with the largest prediction set and the smallest RMSEP, significantly improving the model’s predictive performance compared to no preprocessing. During the seedling stage, the prediction set increased from 0.80 to 0.84, and the RPD increased from 2.37 to 2.43; during the bud stage, the prediction set increased from 0.85 to 0.89, and the RPD increased from 2.46 to 2.79; during the flowering period, the prediction set increased from 0.82 to 0.87, and the RPD increased from 2.36 to 2.62; this indicates that SG preprocessing can effectively achieve baseline correction of spectral data and remove background interference, enhancing the predictive ability of the model.
3.3.3. Quantitative Prediction Model for CCC Based on SSA-BPNN and 1DCNN
This study established the SSA-BPNN and 1DCNN detection models for chlorophyll content in cotton leaves during the seedling, bud, and boll stages using all wavelengths treated with SG. The evaluation results of the models are shown in Table 3. According to Table 3, the SSA-BPNN and 1DCNN models for cotton leaf chlorophyll content based on different periods of full wavelength have RPDs greater than 2, indicating good predictive performance of the models. During the seedling stage, the prediction set and RMSE of the 1DCNN model were 0.92 and 0.035 mg/g, respectively, with an RPD of 3.56, indicating superior model performance. During the budding stage, the prediction set and RMSE of the 1DCNN model were 0.97 and 0.019 mg/g, respectively, with an RPD of 5.54, indicating better model performance than SSA-BPNN. During the flowering-boll stage, the prediction set and RMSE of the 1DCNN model were 0.95 and 0.028 mg/g, respectively, with an RPD of 4.58. The model’s prediction performance was better than that of SSA-BPNN. Through comprehensive comparison, it can be concluded that the performance of the 1DCNN model is superior to that of the SSA-BPNN model in all three stages.
Table 3.
Performance parameters of CCC quantitative prediction models based on SSA-BPNN and 1DCNN.
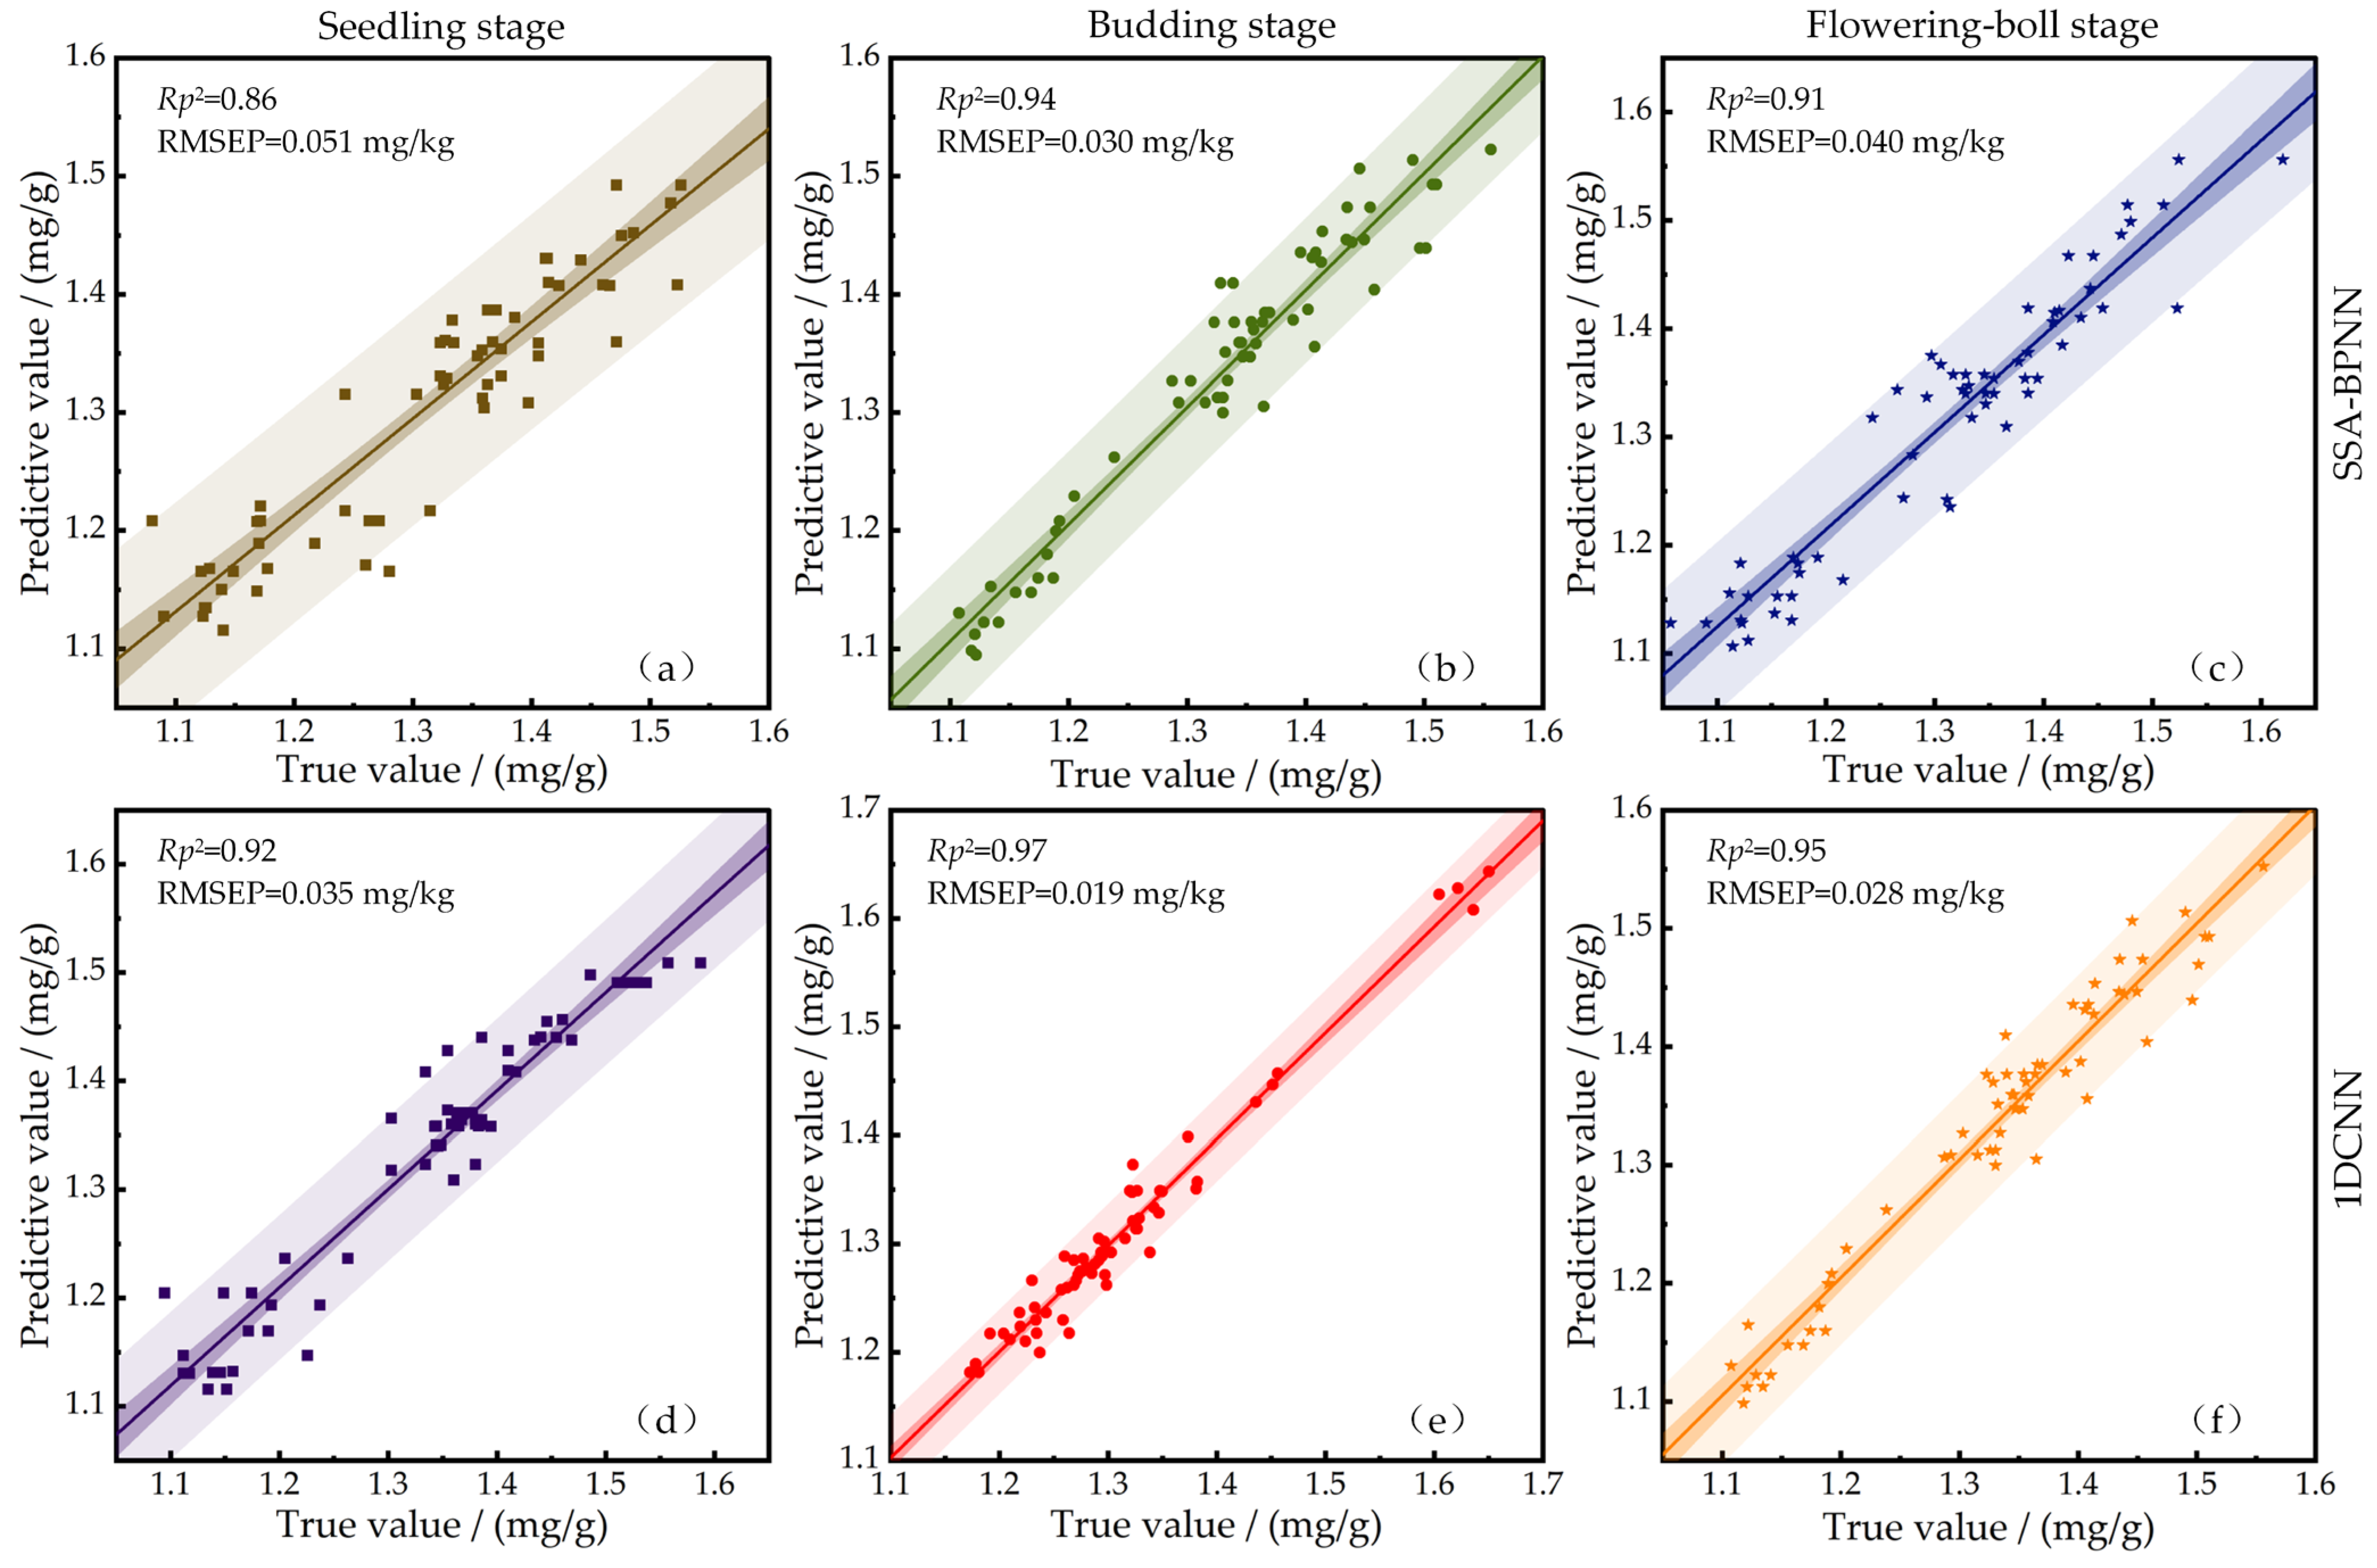
Figure 9 is the schematic diagram of the confidence intervals of the CCC quantitative prediction model based on SSA-BPNN and 1DCNN. Among them, the solid line is the linear fitting curve between the predicted value and the real value, the dark strip area is the 95% confidence interval, and the light strip area is the 95% prediction interval. The narrower the 95% confidence interval width of the model, the stronger the overall data consistency, stability, and sample representativeness of the model; the higher the reliability of sample parameters; and the stronger the fitting effect and prediction ability of the model. It can be seen from the figure that the 95% confidence interval of the CCC prediction model based on the 1DCNN algorithm is the narrowest at the cotton bud stage, and the RMSEP is the smallest, while the of the model is the largest, with values of 0.97 and 0.019 mg/g, respectively. A horizontal comparison of (a) and (d), (b) and (e), and (c) and (f) shows that the confidence interval width of the 1DCNN model in three stages is narrower, is larger, and RMSEP is smaller, indicating that the prediction performance of the model is better than that of the SSA-BPNN model, which is consistent with the results in Table 3. Therefore, 1DCNN is selected as the detection model of CCC and embedded into the intelligent detection system.
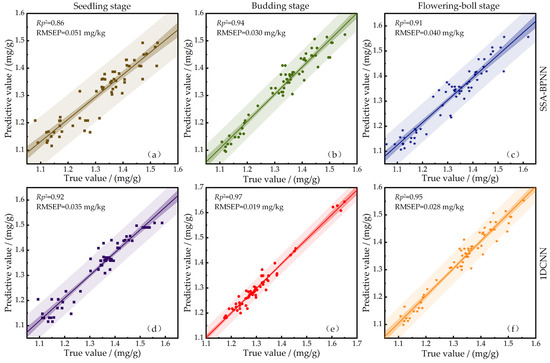
Figure 9.
Schematic diagram of confidence interval of CCC quantitative prediction model based on SSA-BPNN and 1DCNN.
4. Application Testing of Intelligent CCC Testing System
Field application testing was conducted on the intelligent CCC detection system, including equipment detection accuracy testing and equipment detection speed testing. Standard deviation, detection accuracy, coefficient of variation, and detection time were used as performance indicators to evaluate the detection system.
4.1. Accuracy Test for System Detection
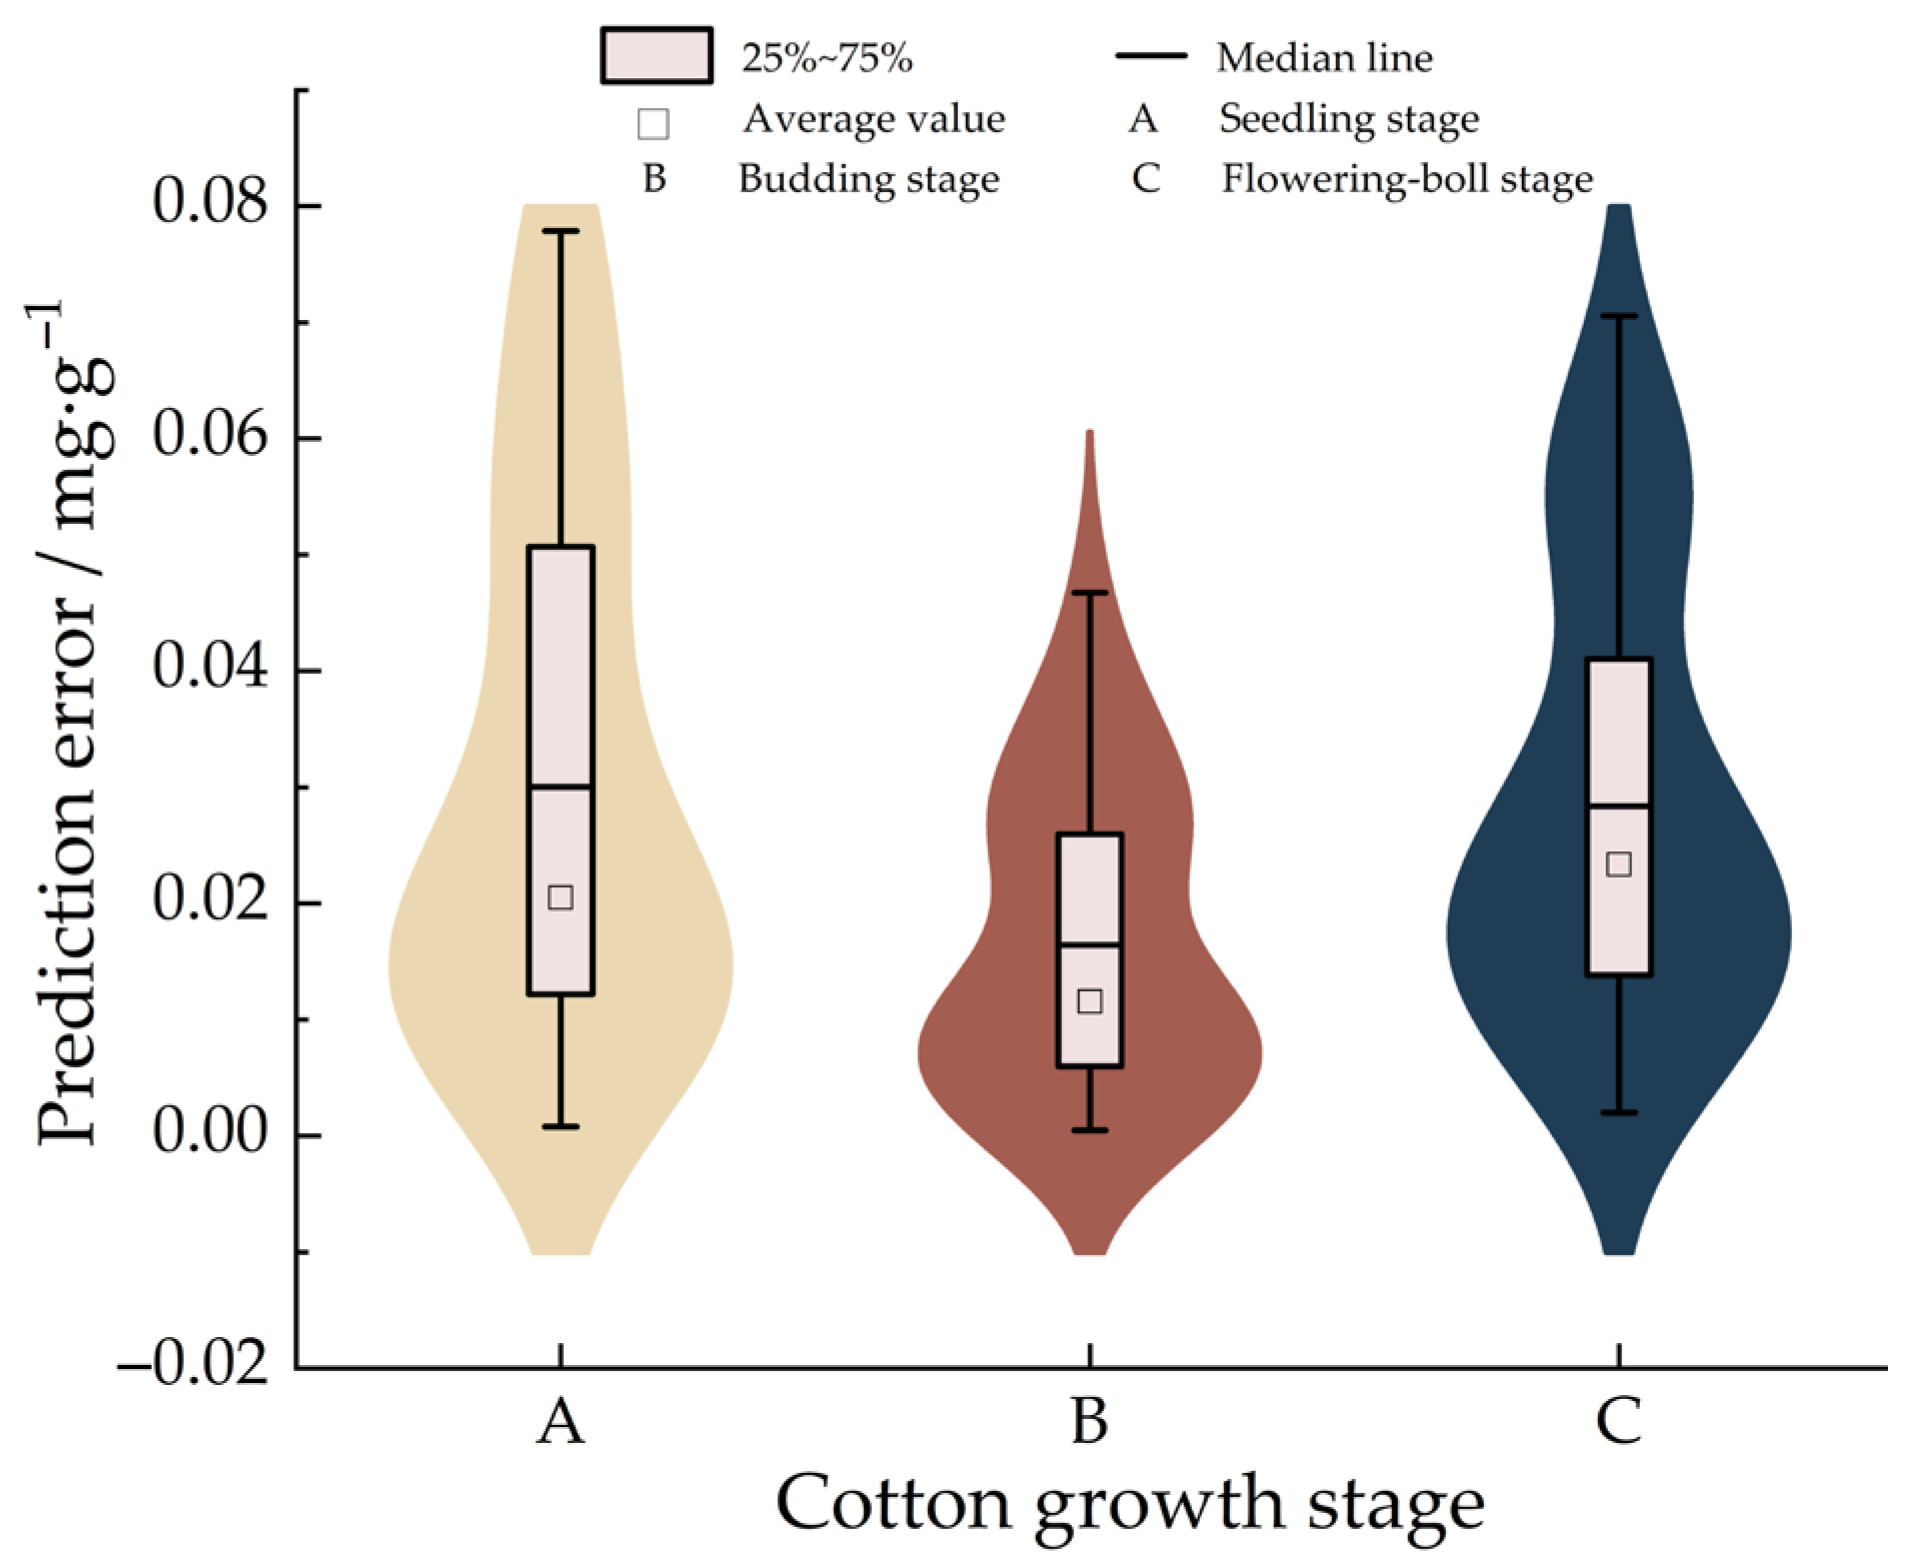
The SG-1DCNN model is embedded in the detection module of the CCC intelligent detection system to detect the chlorophyll content of cotton at three development stages. In each group of experiments, 30 samples were randomly selected; each sample was tested seven times, and the results were taken as the average. The conclusion inspection results are shown in Table 4. The absolute value of the prediction error is shown in the violin box plot in Figure 10.
Table 4.
Detection results of intelligent CCC testing system.
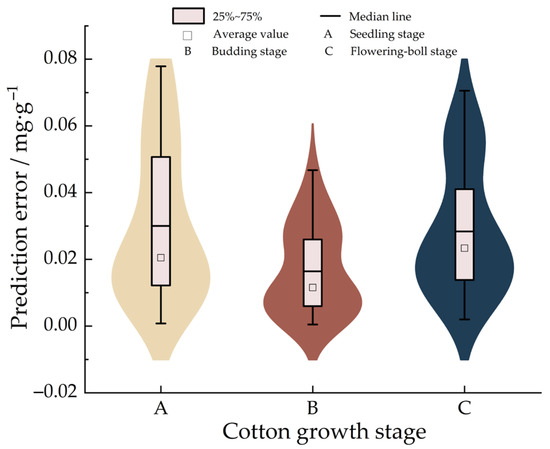
Figure 10.
Distribution chart of the absolute value of prediction error.
The results of the detection indicate that (1) the accuracy of detecting cotton seedlings, budding, and flowering-boll stages surpasses 95%, with accuracies of 96.998%, 98.357%, and 97.164%, respectively. This demonstrates a high level of accuracy in the intelligent CCC testing system. (2) The standard deviation of the detection error of the CCC intelligent detection system is relatively small. Especially in the cotton bud stage, the standard deviation of the intelligent CCC detection system is the smallest, only 0.020 mg/g. The distribution of the detection results is relatively concentrated, indicating that the detection performance of the system is stable. (3) The coefficient of variation is the ratio of the standard deviation to the mean and is an indicator for measuring the relative variability of measurement results. It is usually used to describe the stability of the detection system. The smaller the coefficient of variation, the better the stability of the measurement system. Research shows that a coefficient of variation less than 5% is considered to indicate that the equipment has high precision and reliability [40]. The error range of the coefficient of variation in the CCC test is 1.606% to 2.778%. The consistency within the test results of the same leaf sample is good, indicating that the system has good stability in the detection of CCC values at the three growth stages of cotton.
4.2. Test of System Detection Speed
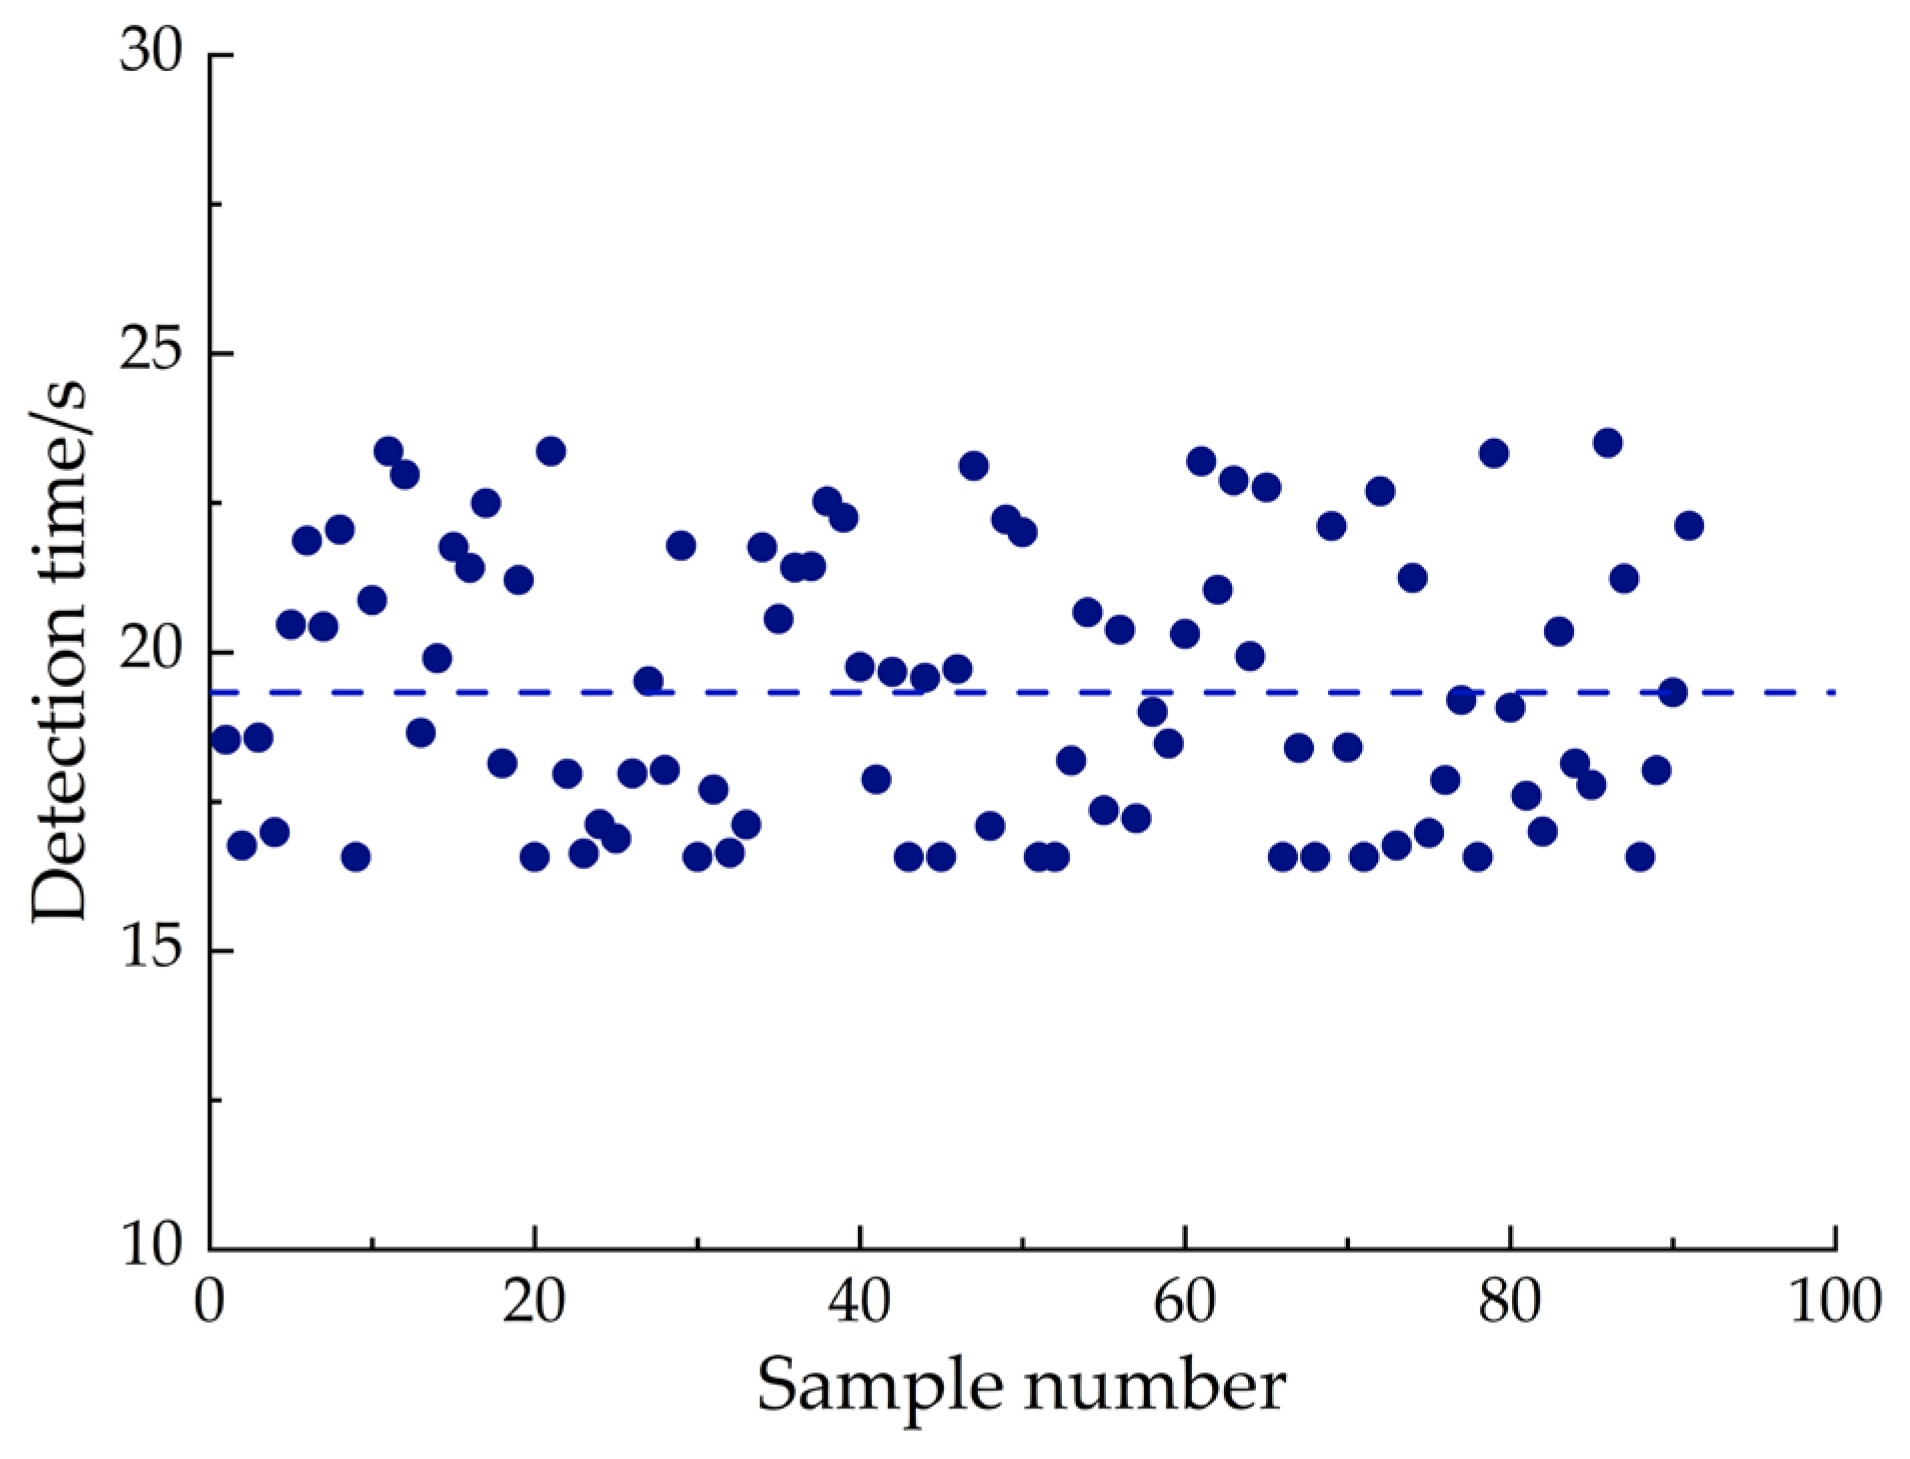
In order to explore the operation speed of the CCC intelligent detection system, 30 samples of cotton leaves at the seedling stage, budding stage, and flowering-boll stage were randomly selected, and the detection time of 90 groups of samples was recorded (Figure 11). As shown in the figure, the blue dots represent the detection time of each sample, and the blue dotted line represents the average detection time of the 90 samples. The fastest detection speed of the system was 16.57 s, and the slowest was 24.68 s. The average processing time of the system was calculated to be 19.33 s. The system was stable and could meet the application requirements for the rapid detection of chlorophyll content in cotton leaves.
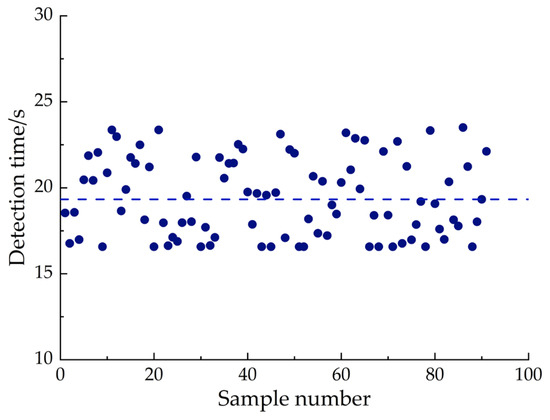
Figure 11.
Detection time of CCC intelligent detection system.
5. Conclusions
Based on hyperspectral imaging technology, machine learning, and deep learning algorithms, combined with Python, MATLAB, ENVI, and other platforms, an intelligent detection system for chlorophyll content in cotton leaves at multiple growth stages was designed and developed. The hyperspectral image acquisition, processing, and CCC quantitative evaluation of cotton leaves at the seedling, budding, and flowering-boll stages were realized. The main conclusions are as follows:
- (1)
- Based on hyperspectral imaging technology, the spectral information of cotton leaf samples at the seedling stage, budding stage, and flowering-boll stage was obtained. The performance of the partial least squares regression model established by the original spectrum and the spectra pretreated by different methods was compared, and SG was determined as the optimal spectral pretreatment method.
- (2)
- Based on the spectral information processed by SG, the chlorophyll detection models of cotton leaves at different growth stages (seedling stage, budding stage, flowering-boll stage) using SSA-BPNN and 1DCNN were established. The results showed that the of the CCC detection model established by the 1DCNN algorithm at the seedling stage, germination stage, and flowering stage were 0.92, 0.97, and 0.95; RMSEP were 0.035 mg/g, 0.019 mg/g, and 0.028 mg/g; and RPD were 3.56, 5.54, and 4.58, respectively. In the early stage, the team mixed the spectral data of the leaves of cotton at three stages. After preprocessing and band screening, they established the CCC prediction models based on SSA-BPNN, GA-BPNN, and PSO-BPNN, respectively [41]. The performance of these models was significantly inferior to that of the SSA-BPNN established based on the full band of the three stages and also had a considerable gap compared with 1DCNN. It indicates that staged detection is more accurate, and this study can become the preferred solution for the embedded model of the intelligent detection system.
- (3)
- In this study, the detection accuracy and detection time of the system are used as performance evaluation indexes to test the application of the CCC intelligent detection system. The results show that the average detection accuracy of CCC by using the intelligent detection system is more than 95%, and the detection accuracy rate of chlorophyll in cotton leaves is superior to that of the chlorophyll detection systems for wheat [42] and corn [43,44] plants developed by relevant scholars. Among them, the detection accuracy rate is the highest in the germination stage, reaching 99.133%, which has a relatively high detection accuracy rate. The coefficient of variation of the detection error is 1.606% to 2.778%, and the detection performance of the system is stable. At the same time, the average detection time of each sample detected by the system is only 19.33 s, and the detection efficiency is high. Based on the above evaluation, the CCC intelligent detection system can meet the requirements of CCC detection.
Author Contributions
This research involved multiple contributors, whose roles are defined as follows: Conceptualization and methodology, W.W. and S.Y.; software and validation, X.H.; formal analysis, S.Y. and W.W.; investigation and resources, X.H.; data curation and writing—original draft preparation, W.W.; writing—review and editing, S.Y. and L.Z.; visualization, X.H. and W.W.; supervision, project administration, and funding acquisition, L.Z. and S.Y. All authors have read and agreed to the published version of the manuscript.
Funding
This study received financial support from the National Science and Technology Major Project (No. 2022ZD0115804), the Corps Science and Technology Plan Project (No. 2023AB005), the Major Science and Technology Special Project of Xinjiang Uygur Autonomous Region (No. 2022A02012-4), the Corps Science and Technology Plan Project (No. 2022BC004), and the Talent Introduction Project of Guangdong University of Petrochemical Technology (No. 2024rcyj1038).
Data Availability Statement
The data supporting the results of this study are not publicly available due to institutional restrictions but are available from the corresponding authors upon reasonable request.
Acknowledgments
The authors express their gratitude to Xue Hu, Siyao Yu, and Lixin Zhang for their invaluable support during this research. We are also thankful to the key laboratory of Shihezi University for providing the necessary experimental facilities and to Lixin Zhang and Siyao Yu for their insightful feedback on earlier drafts of this manuscript.
Conflicts of Interest
The authors declare that there are no conflicts of interest regarding the publication of this paper.
References
- Nijs, I.; Behaeghe, T.; Impens, I. Leaf nitrogen content as a predictor of photosynthetic capacity in ambient and global change conditions. J. Biogeogr. 1995, 22, 177–183. [Google Scholar] [CrossRef]
- Daughtry, C.S.T.; Walthall, C.L.; Kim, M.S.; Colstoun, E.; Iii, M.M. Estimating corn leaf chlorophyll concentration from leaf and canopy reflectance. Remote Sens. Environ. 2000, 74, 229–239. [Google Scholar] [CrossRef]
- Li, S.T.; Liu, X.Y.; He, P. Analyses on nutrient requirements in current agriculture production in China. J. Plant Nutr. Fertil. 2017, 23, 1416–1432. [Google Scholar]
- Wei, Q.; Zhang, B.Z.; Wei, Z. Estimation of canopy chlorophyll contention winter wheat by UAV multispectral remote sensing. J. Triticeae Crop. 2020, 40, 8. [Google Scholar]
- Shah, S.H.; Angel, Y.; Houborg, R.; Ali, S.; Mccabe, M.F. A random forest machine learning approach for the retrieval of leaf chlorophyll content in wheat. Remote Sens. 2019, 11, 920. [Google Scholar] [CrossRef]
- Deng, S.Q.; Zhao, Y.; Bai, X.Y.; Li, X.; Sun, Z.D.; Liang, J.; Cheng, S. Inversion of chlorophyll and leaf area index for winter wheat based on UAV image segmentation. Trans. Chin. Soc. Agric. Eng. 2022, 38, 136–145. [Google Scholar]
- Xiao, Q.L.; Tang, W.T.; Zhang, C.; Zhou, L.; Feng, L.; Shen, J.X.; Yan, T.Y.; Gao, P.G.; He, Y.; Wu, N. Spectral preprocessing combined with deep transfer learning to evaluate chlorophyll content in cotton leaves. Plant Phenomics 2022, 2022, 9813841. [Google Scholar] [CrossRef]
- Yang, P.Q.; van der Tol, C.; Campbell, P.K.E.; Middleton, E.M. Fluorescence correction vegetation index (FCVI): A physically based reflectance index to separate physiological and non-physiological information in far-red sun-induced chlorophyll fluorescence-Science Direct. Remote Sens. Environ. 2020, 240, 111676. [Google Scholar] [CrossRef]
- Li, Y.J.; Ma, B.X.; Li, C.; Yu, G.W. Accurate prediction of soluble solid content in dried Hami jujube using SWIR hyperspectral imaging with comparative analysis of models. Comput. Electron. Agric. 2022, 193, 106655. [Google Scholar] [CrossRef]
- Katja, B.; Jochem, V.; Féret, J.B.; Tobias, H.; Matthias, W.; Wolfram, M.; Gustau, C.V. Retrieval of aboveground crop nitrogen content with a hybrid machine learning method. Int. J. Appl. Earth Obs. Geoinf. 2020, 92, 102174. [Google Scholar]
- Zhou, Y.J.; Zheng, J. Inversion Model Design of Chlorophyll a Based on BP Neural Network and Remote Sensing Image. Innov. Comput. 2020, 675, 531–538. [Google Scholar]
- An, T.; Yu, S.Y.; Huang, W.Q.; Li, G.L.; Tian, X.; Fan, S.X.; Dong, C.W.; Zhao, C.J. Robustness and accuracy evaluation of moisture prediction model for black tea withering process using hyperspectral imaging. Spectrochim. Acta Part A Mol. Biomol. Spectrosc. 2021, 269, 120791. [Google Scholar] [CrossRef] [PubMed]
- Yeh, T.S. Bifurcation curves of positive steady-state solutions for a reaction–diffusion problem of lake eutrophication. J. Math. Anal. Appl. 2016, 449, 1708–1724. [Google Scholar] [CrossRef]
- Zhang, Q.; Smith, D.W.; Baxter, C.W. Artificial neural networks: A tool with significant potential in environmental engineering and science-introduction. J. Environ. Eng. Sci. 2004, 3, III–IV. [Google Scholar]
- Zhang, Z.H. A gentle introduction to artificial neural networks. Ann. Transl. Med. 2016, 4, 370. [Google Scholar] [CrossRef]
- Wei, X.G.; Wu, L.L.; Ge, D.; Yao, M.Z.; Bai, Y.K. Prediction of the maturity of greenhouse grapes based on imaging technology. Plant Phenomics 2022, 2022, 9753427. [Google Scholar] [CrossRef]
- Sun, B.Y.; Chang, Q.R.; Liu, M.Y. Inversion chlorophyll mass fraction in winter wheat canopy by hyperspectral reflectance. Acta Agric. Boreali Occident. Sin. 2017, 26, 552–559. [Google Scholar]
- Li, Y.Y.; Chang, Q.R.; Liu, X.Y. Estimation of maize leaf SPAD value based on hyperspectrum and BP neural network. Trans. Chin. Soc. Agric. Eng. 2016, 32, 135–142. [Google Scholar]
- Zhou, Y.; Lu, A.J.; Liu, X. Prediction of chlorophyll a content in water body based on BP neural network with improved Genetic Algorithm. Electron. Test 2022, 37–42. [Google Scholar] [CrossRef]
- Yang, T.; Lu, J.; Liao, F.; Qi, H.; Tian, Y. Retrieving potassium levels in wheat blades using normalised spectra. Int. J. Appl. Earth Obs. Geoinf. 2021, 102, 102412. [Google Scholar] [CrossRef]
- Wang, G.L.; Wang, W.J.; Cheng, K.; Liu, X.; Zhao, J.G.; Li, H.; Guo, E.H.; Li, Z.W. Hyperspectral imaging combined with back propagation neural network optimized by sparrow search algorithm for predicting gelatinization properties of millet flour. Food Sci. 2022, 43, 65–70. [Google Scholar]
- Bauriegel, E.; Giebel, A.; Geyer, M.; Schmidt, U.; Herppich, W.B. Early detection of fusarium infection in wheat using Hyper-Spectral imaging. Comput. Electron. Agric. 2011, 75, 304–312. [Google Scholar] [CrossRef]
- Yang, L.; Wu, Y.Q.; Wang, J.L. Research on recurrent neural network. J. Comput. Appl. 2018, 38, 1–6+26. [Google Scholar]
- Gao, P. Study on Real-Time Diagnosis of Verticillium Wilt of Cotton Based on Image Recognition; Shihezi University: Shihezi, China, 2019. [Google Scholar]
- De Cesaro Júnior, T.; Rieder, R. Automatic identification of insects from digital images: A Survey. Comput. Electron. Agric. 2020, 178, 105784. [Google Scholar] [CrossRef]
- Acquarelli, J.; Van, L.T.; Gerretzen, J. Convolutional neural networks for vibrational spectroscopic data analysis. Anal. Chim. Acta 2017, 954, 22–31. [Google Scholar] [CrossRef] [PubMed]
- Xie, Z.H.; Xu, H.L.; Huang, G.Q.; Wang, B. Spinach freshness detection based on hyperspectral image and deep learning method. Trans. Chin. Soc. Agric. Eng. 2019, 35, 277–284. [Google Scholar]
- Wu, N.; Zhang, C.; Bai, X.; Du, X.; He, Y. Discrimination of chrysanthemum varieties using hyperspectral imaging combined with a deep convolutional neural network. Molecules 2018, 23, 2831. [Google Scholar] [CrossRef]
- Conrad, A.O.; Li, W.; Lee, D.Y.; Wang, G.L.; Bonello, P. Machine learning-based presymptomatic detection of rice sheath blight using spectral profiles. Plant Phenomics 2020, 2020, 8954085. [Google Scholar] [CrossRef]
- Hctor, P.C.; Karina, J.V.; Mario, G.; Omar, F.U.; Beln, A.L. Determination of moisture in rice grains based on visible spectrum analysis. Agronomy 2022, 12, 3021. [Google Scholar] [CrossRef]
- Colovic, M.; Yu, K.; Todorovic, M.; Cantore, V.; Hamze, M.; Albrizio, R.; Anna, M.S. Hyperspectral vegetation indices to assess water and nitrogen status of sweet maize crop. Agronomy 2022, 12, 2181. [Google Scholar] [CrossRef]
- Milas, A.S.; Romanko, M.; Reil, P.; Abeysinghe, T.; Marambe, A. The importance of leaf area index in mapping chlorophyll content of corn under different agricultural treatments using uav images. Int. J. Remote Sens. 2018, 39, 5415–5431. [Google Scholar] [CrossRef]
- Chen, B.Q.; Zhang, Y.; Wang, K. A dynamic prediction method for cotton growth and yield in Xinjiang based on APSIM. J. Agric. Mach. 2025, 56, 82–90. [Google Scholar]
- Bai, E.L.; Zhang, Z.Q.; Guo, Z.C. Cotton color detection method based on machine vision. J. Text. 2024, 45, 36–43. [Google Scholar]
- Da Rosa, C.N.; Pereira Filho, W.; Bremer, U.F.; Putzke, J.; De Andrade, A.M.; Kramer, G.; Hillebrand, F.L.; De Jesus, J.B. Spectral behavior of vegetation in Harmony Point, Nelson Island, Antarctica. Biodivers. Conserv. 2022, 31, 1867. [Google Scholar] [PubMed]
- Geelen, B.; Blanch, C.; Gonzalez, P.; Tack, N.; Lambrechts, A. A tiny, vis-nir snapshot multispectral camera. In Proceedings of the Advanced Fabrication Technologies for Micro/Nano Optics & Photonics VIII, San Francisco, CA, USA, 7–12 February 2015; Volume 9374. [Google Scholar]
- Ali, A.M.; Thind, H.S.; Sharma, S.; Varinderpal-Singh. Prediction of dry direct-seeded rice yields using chlorophyll meter, leaf color chart and greenseeker optical sensor in northwestern India. Field Crop. Res. 2014, 161, 11–15. [Google Scholar] [CrossRef]
- Cao, Q.; Miao, Y.X.; Li, F.; Gao, X.W.; Liu, B.; Lu, D.J. Developing a new crop circle active canopy sensor-based precision nitrogen management strategy for winter wheat in north China plain. Precis. Agric. 2017, 18, 2–18. [Google Scholar] [CrossRef]
- Siedliska, A.; Baranowski, P.; Zubik, M.; Mazurek, W.; Sosnowska, B. Detection of fungal infections in strawberry fruit by vnir/swir hyperspectral imaging. Postharvest Biol. Technol. 2018, 139, 115–126. [Google Scholar] [CrossRef]
- Zahra, J.; Amirhossein, A.; Philippe, C.; Michael, B.C. Monitoring the coefficient of variation: A literature review. Comput. Ind. Eng. 2021, 162, 107600. [Google Scholar]
- Yu, S.Y.; Bu, H.R.; Hu, X.; Dong, W.C.; Zhang, L.X. Establishment and Accuracy Evaluation of Cotton Leaf Chlorophyll Content Prediction Model Combined with Hyperspectral Image and Feature Variable Selection. Agronomy 2023, 13, 2120. [Google Scholar] [CrossRef]
- Yang, Z.Q.; Li, G.Q.; Zhang, Y.M.; Su, W.B.; Wu, J.Z.; Duan, T.C.; Qi, L. Plant Chlorophyll a and Chlorophyll b Nondestructive Testing System: Research and Development. Chin. Agric. Sci. Bull. 2021, 37, 147–152. [Google Scholar]
- Zhang, C.Q.; Liu, M.S.; Chao, J.Y.; Tang, B.; Li, M.Z.; Sun, H. Contact-based Crop Chlorophyll Detection System Based on Feature Wavelengths. Trans. Chin. Soc. Agric. Mach. 2024, 55, 255–262. [Google Scholar]
- Wang, N.; Li, Z.; Li, J.M.; Zhang, Y.; Sun, H.; Li, M.Z. Design and Development of Intelligent Plant Chlorophyll Index Detection System. Trans. Chin. Soc. Agric. Mach. 2025. Available online: http://kns.cnki.net/kcms/detail/11.1964.S.20230911.2037.048.html (accessed on 21 June 2025).


Disclaimer/Publisher’s Note: The statements, opinions and data contained in all publications are solely those of the individual author(s) and contributor(s) and not of MDPI and/or the editor(s). MDPI and/or the editor(s) disclaim responsibility for any injury to people or property resulting from any ideas, methods, instructions or products referred to in the content. |
© 2025 by the authors. Licensee MDPI, Basel, Switzerland. This article is an open access article distributed under the terms and conditions of the Creative Commons Attribution (CC BY) license (https://creativecommons.org/licenses/by/4.0/).