Abstract
With the large-scale integration of renewable energy sources, traditional distribution networks are gradually evolving into a new form of flexible interconnection distribution networks. To enhance the rapidity and accuracy of power flow control through flexible interconnection devices, there is an increasing demand for precise grid equivalent models. Existing grid equivalent models predominantly adopt single-port configurations for radial networks, while there is limited research on two-port network equivalent models tailored for flexible interconnection distribution networks. Focusing on the scenario of flexible interconnection distribution networks integrated with Rotary Power Flow Controllers (RPFCs), this paper proposes an equivalent modeling method of two-port networks based on the superposition theorem under small disturbance conditions. A flexible interconnection distribution network model incorporating RPFCs and its corresponding two-port equivalent model are developed. The parameters of the two-port equivalent model are derived through superposition theorem calculations, enabling the realization of power decoupling control functionality for RPFCs. The simulation results show that the deviations between the set value of active power and the actual value remains at about 3%, and the deviations between the set value of reactive power and the actual value is between 4% and 7%, thereby verifying the effectiveness of the constructed two-port model in power flow control and further supporting the accuracy of the proposed method.
1. Introduction
Amidst the global push for green and low-carbon energy transition, distribution networks have progressively evolved into key hosting infrastructure for renewable energy sources and new types of power loads [1]. The high penetration of distributed generation leads to bidirectional power flow in distribution networks, resulting in line overloads and node voltage limit violations. Concurrently, the integration of distributed energy storage and widespread adoption of electric vehicles at the consumption end have diversified load characteristics, blurring the traditional boundary between sources and loads. Consequently, conventional distribution network topologies and operational modes struggle to accommodate various flexible load demands [2]. Although advanced deep learning architectures provide the reliability and efficiency necessary for EV charging infrastructure, further actions are required to alleviate overloads and voltage violations in the growing field of sustainable transportation [3].
To address these challenges, several traditional approaches, like a single-degree-of-freedom hybrid modulation technique that synergistically combines phase-shift and pulse-width modulation methods, are proposed. This approach enables the dynamic adjustment of the converter’s operating parameters, resulting in enhanced power transfer efficiency and reduced switching losses [4]. A novel approach to address the flexible interconnection technologies for medium-voltage (MV) distribution networks, focusing on optimizing power supply reliability amid increasing new energy integration and electric vehicle loads, is introduced [5]. It explores advanced power electronics applications, including boosted back-to-back voltage source converters (B2B VSCs), multilevel converters, and series-compensated current controllers (D-UPFCs), to enhance grid efficiency. However, the reliance on dynamic control mechanisms may introduce transient instability under extreme grid disturbances.
A real-world application of Flexible Distribution Networks (FDNs) as core enablers of renewable-dense power systems is envisioned [6]. This comprehensive framework characterizes FDNs as cyber-physical systems with dynamic topology reconfigurability, distributed energy resources (DERs), and soft open points (SOPs) to dynamically control power flows and voltage stability. The proposed solution introduces a novel two-layer configuration taxonomy: (1) a physical layer of modular power electronics (e.g., back-to-back voltage source converters for SOPs) and switchgear and (2) a cyber layer with IoT-capable sensors and centralized-distributed hybrid control. For optimal function, they propose a multi-period mixed-integer second-order cone programming (MISOCP) model coordinating DERs, SOPs, and topology switches to minimize losses, avoid congestion, and facilitate photovoltaic penetration exceeding 30%.
To address challenges posed by high penetration of new energy sources and loads in distribution networks, flexible interconnection devices have undergone rapid development. These devices replace traditional switching equipment in conventional distribution networks, providing flexible interconnection interfaces for diverse power forms. This enables real-time flexible control of power flow, driving the transformation of traditional distribution networks into flexible interconnection distribution networks [7].
Flexible interconnection devices in distribution networks are primarily categorized into two types: one is power electronic flexible interconnection devices, such as soft open point (SOP) [8], Unified Power Flow Controller (UPFC) [9], energy router [10], power electronic transformer [11], and Static Var Compensator (SVC) [12], and the other is electromagnetic flexible interconnection devices represented by Rotary Power Flow Controllers (RPFCs) [13]. Current research on the modeling of both types of flexible interconnection devices predominantly focuses on their internal topological structures, treating the devices as independent entities while neglecting their interactive effects with external distribution networks when functioning as flexible interconnection systems. In traditional distributed generation grid-connection studies, external distribution networks are often simplified as single-port Thévenin equivalent models (comprising a voltage source in series with an impedance).
However, as bidirectional power regulation devices, the simultaneous operation of flexible interconnection devices alters power flow distributions on both interconnected grid segments. This renders single-port models incapable of characterizing bidirectional interactions, thereby necessitating higher-dimensional models to meet the requirements of flexible interconnected distribution networks. Multiport Soft Normally Open Points were also created for adaptable power flow control and interconnection in distribution networks to offer integrated series (power transfer) and shunt (voltage regulation) functions efficiently [14]. Effective communication between utilities and customers is necessary for proper Demand Response (DR) operation in smart grids, but gaps in coverage and signal attenuation create serious concerns [15]. Current resilience approaches for power distribution grids tend to act individually and in a reactive manner, without the coordinated, multi-step methods necessary to adequately reduce damage and restore service throughout integrated energy systems during extreme events [16].
Unlike power electronic devices, the RPFC, as an electromagnetic device, has garnered widespread attention due to its low cost, high reliability, and surge resistance. It enables flexible control of line compensation voltage independently of line current variations, thereby providing a novel approach for economical, flexible, and frequent control in power systems, particularly under varying grid conditions [17]. Reference [18] analyzed RPFC performance from four aspects—steady-state characteristics, transient characteristics, cost, and loss—demonstrating its capabilities in regulating node voltages and controlling power flows, along with the advantages of low construction costs, strong tolerance, and high operational reliability.
These studies confirm RPFC’s superior cost-effectiveness and broader application prospects in power systems. RPFCs have the potential to provide voltage support in power systems to ensure quick and precise control, particularly in dynamic voltage variations. The majority of techniques do not utilize full direct impedance regulation concepts to implement precise and stable voltage control through reactive power compensation [19]. Early research on Rotary Power Flow Controllers (RPFCs) concentrated mostly on theoretical capability and steady-state operation. Nevertheless, dynamic models validated and required to study transient stability, fault behavior, and controller design under actual real-time grid disturbances were scarce before thorough electromechanical modeling studies [20]. A better hybrid Particle Swarm Optimization (PSO) algorithm was utilized on RPFC control strategy optimization to optimize RPFC control parameters efficiently and robustly.
Rotary Power Flow Controllers (RPFCs) for flexible interconnection of distribution networks with Rotary Power Flow Controllers (RPFCs) facilitate the integration of renewables, relief from grid constraints, and congestion [21]. Whereas theoretical models for foundation RPFC were available, initial-stage studies did not have confirmed case studies of their practical application in maximizing power transfer capability, stability, and congestion management through realistic transmission corridors under dynamic scenarios [22]. Multi-zone coordination to allow for the synchronous, coordinated control of multiple network zones had lower potential to synergistically enhance voltage stability and minimize system-wide losses through combined hardware interventions based on a dual RPFC.
Therefore, in the scenario of a flexibly interconnected distribution grid with RPFC integration, targeting the gap in equivalent modeling of its external distribution network and utilizing the characteristic of strong source-load volatility in active distribution networks, a modeling method for the active distribution network equivalent model based on the superposition theorem under small disturbances is proposed in this paper. The approach includes three main steps: First, the topology of RPFC is analyzed to establish a flexible interconnected distribution network model based on RPFC and its two-port equivalent model. Second, a construction method is proposed for the two-port equivalent model of the flexible interconnected distribution network based on the superposition theorem, along with a power decoupling control method using this two-port equivalent model. Finally, comparative simulations under small disturbance conditions and power decoupling control simulations are conducted to analyze the accuracy of the proposed two-port equivalent model construction method. The results demonstrate the feasibility of the proposed method.
2. Construction of Flexible Interconnected Distribution Network Model Based on RPFCs
The interconnected distribution network represented by the petal-shaped network framework is illustrated in Figure 1 [23]. In this configuration, both ends of each petal’s main feeder lines are connected to the same substation busbar, forming a closed-loop structure. Multiple petal-shaped ring networks can be interconnected through a single substation busbar, while different petal-shaped ring networks from distinct substations can be linked via tie-lines or tie-switches. However, due to imbalanced development between network infrastructure construction and distributed source-load integration, petal-shaped distribution networks exhibit uncontrollable power flow magnitudes and directions [24]. Therefore, RPFC devices are employed to effectively regulate power at loop-closing points, ensuring secure loop operation and significantly enhancing the reliability of power supply in distribution networks.
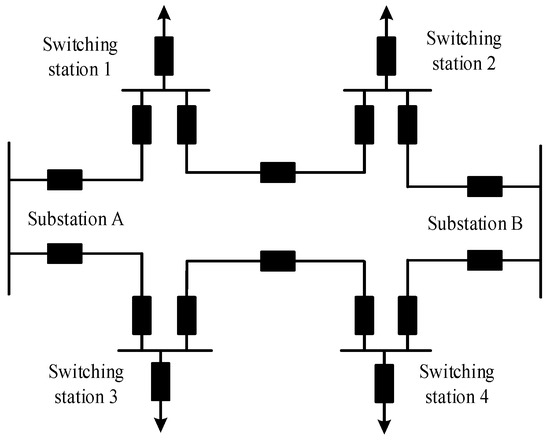
Figure 1.
Structure of petal-type distribution grid.
Figure 2 shows the impedance model of a typical petal-type distribution network during loop closure. Ri + jXi and Pi + jQi are the line impedance and load power of bus i (i = 1,2), P3 + jQ3 is the power flowing through loop point K in line L3, is the power supply voltage of the AC system, and and are the voltages on both sides of loop point K, respectively. is line L3’s current in closed-loop operation. As a direct connection between feeders is physically prohibited, the RPFC is deployed at the loop-closing node to enable flexible interconnection of the distribution network.
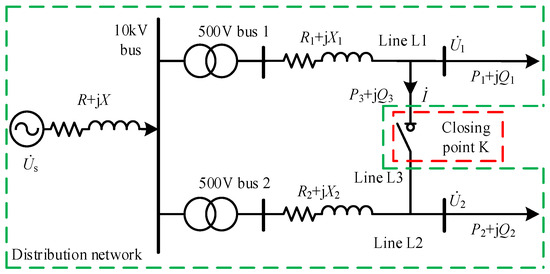
Figure 2.
Impedance model of petal-type distribution network.
The RPFC primarily comprises two Rotary Phase-Shifting Transformers (RPSTs). Its operational principle is as follows: Driven by servo motors, both rotary phase-shifting transformers generate two voltage phasors with constant magnitude and adjustable phase angles. The primary-to-secondary winding ratio determines the phasor magnitude, while the stator–rotor angular displacement of the rotary transformers governs the phase angle. By superimposing the voltage phasors generated from these two transformers, a series voltage with adjustable magnitude and phase angle can be injected into the power line.
The main circuit of the RPFC is shown in Figure 3. In the figure, and are the voltages at both ends of the RPFC, respectively; is the parallel voltage of the rotor winding; are two stator winding voltages; is the series voltage output by the RPFC; is the current of the line where the RPFC is located; and are series and parallel line currents, respectively; Zst is the impedance of two RPST stator windings; Zrt is the winding impedance of the RPST rotor; k is the ratio of two RPST fixed rotor windings; α1 and α2 are the rotation angles between two RPST fixed rotor voltages.
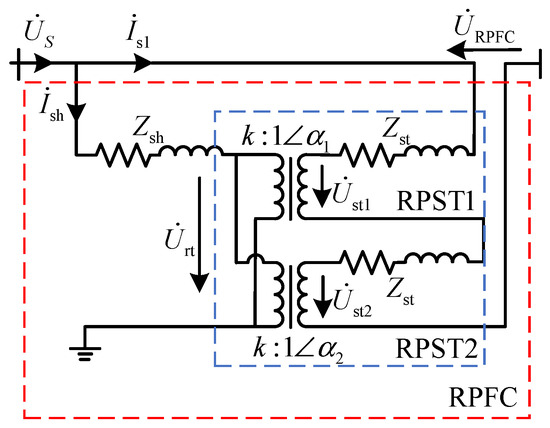
Figure 3.
Main circuit diagram of RPFC.
The fundamental circuit relationships of each winding can be derived from the conventional transformer analysis method, as expressed in Formula (1):
The constant rotor voltage relationship between the two RPSTS is shown in Formula (2):
The sum of the stator winding voltage vectors is as follows:
According to Euler’s formula, the trigonometric function, and the differential product formula:
Among them, the following can be obtained:
Therefore, Formula (4) can be expressed as:
Among them, the following can be obtained:
According to the inverse transformation of Euler’s formula, Formula (6) can be expressed as:
According to Formulas (1), (3), and (8), the expression of voltage vector injected by the RPFC can be obtained, as shown in Formula (9):
The voltage vector part can be obtained from Formula (9):
The impedance part is calculated below. Based on the electromagnetic induction theorem, assuming an ideal RPST, the active and reactive power emitted or absorbed by the parallel side of the RPST is equal to the active and reactive power absorbed or emitted by the series side:
From Formulas (1), (2), and (11), the total rotor current and system line current can be calculated as:
By substituting Formula (12) into Formula (9), the expression of voltage vector and impedance injected by the RPFC can be calculated as follows:
3. Construction Method of the Equivalent Model of the Two-Port Network Based on the Superposition Theorem
Two-port networks are classified based on the presence of independent power sources within the network. A two-port network is defined as passive when it contains no independent power sources and as active when independent power sources are present, where distributed generation can be regarded as independent power sources. In the flexible interconnected distribution network model shown in Figure 2, when the interconnection device employs an RPFC, the external active distribution network observed from the RPFC (comprising distributed generation, transformers, loads, etc.) constitutes an active two-port network. The subsequent analysis will sequentially address the modeling methods for both passive and active two-port networks.
3.1. Passive Two-Port Network Equivalent Model Construction Method
For the passive two-port network without internal independent power sources shown in Figure 4a, its Z-parameter equivalent two-port model is illustrated in Figure 4b. and are the port voltage for ports 1-1′and 2-2′, respectively, and and are the current injected into the network from ports 1-1 ′and 2-2′, respectively. The impedance Z-parameter matrix of the passive two-port network is expressed in Formula (14), where z11, z12, z21, and z22 are the elements of the Z-parameter matrix.
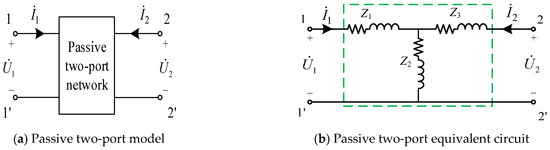
Figure 4.
Passive two-port network and its equivalent circuit.
When disturbances occur in the external system connected to the two-port network, the port voltages and currents will vary accordingly. and are the port voltage after the disturbance of ports 1-1′and 2-2′, respectively, and are the currents injected into the network after the disturbance of ports 1-1′ and 2-2′, respectively, and the expression of the Z parameter is shown in Equation (16):
The following can be obtained by Formulas (15) and (16) simultaneously:
Therefore, the impedance Z-parameter matrix of the passive two-port network is as follows:
3.2. Construction Method of the Active Two-Port Network Equivalent Model
According to Thévenin’s theorem, a one-port network can be equivalently represented by a voltage source in series with an impedance. The voltage source magnitude equals the open-circuit voltage of the original network, while the impedance corresponds to the equivalent impedance with all independent sources deactivated. Extending this principle to the active two-port network containing independent sources, as shown in Figure 5a, its equivalent impedance parameters are determined by the passive two-port network’s Z-parameters when the voltage sources are nullified. The equivalent voltage sources are defined as the open-circuit voltages and at terminals 1-1′ and 2-2′, respectively, as illustrated in Figure 5b.
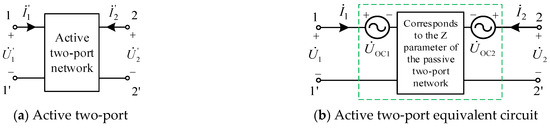
Figure 5.
Active two-port network and its equivalent circuit.
Taking the T-equivalent circuit with impedance parameters Z as a representative case, the impedance models of distribution network components (excluding the RPFC) in the flexible interconnected distribution system shown in Figure 2 can all be represented by T-equivalent circuits. As depicted in Figure 6a, the impedance parameters Z1, Z2, and Z3 collectively constitute the two-port network’s impedance characteristics. The internal power source indicated at position serves to denote the active nature of the two-port network (for illustrative purposes of source inclusion).
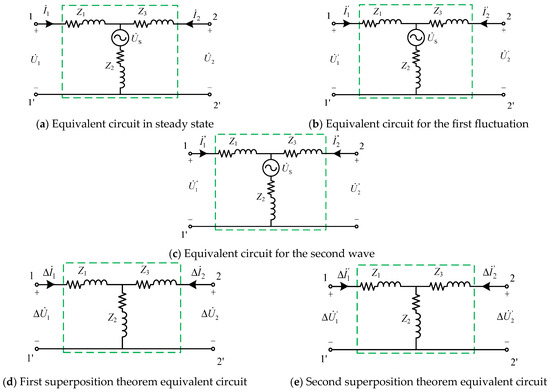
Figure 6.
Schematic diagram of equivalent model construction of two-port network.
When the power flow distribution controlled by the RPFC changes, the port voltage and current of the two-port equivalent model will also change. When the first change occurs, the voltage and current of port 1-1′ are and , and the voltage and current of port 2-2′ are and , respectively, as shown in Figure 6b. When the second change occurs, the voltage and current of the 1-1′ port are and , and the voltage and current of the 2-2′ port are and , respectively, as shown in Figure 6c. According to the superposition theorem, the voltage fluctuations and in the two states shown in Figure 6a and Figure 6b act on the passive two-port network composed of Z1, Z2, and Z3, respectively; that is, the system with the voltage source in the active two-port network is set to zero, and the currents generated are Δ and Δ, respectively, as shown in Figure 6d. At this time, the electrical characteristics of the two-port network shown in Figure 6c can be expressed as Formula (19).
Similarly, the voltage fluctuations and of the two states shown in Figure 6b and Figure 6c, respectively, act on the passive two-port network composed of Z1, Z2, and Z3, and the currents generated are and , as shown in Figure 6e. At this time, the electrical characteristics of the two-port network shown in Figure 6e can be expressed as Formula (20).
Formulas (19) and (20) are combined to obtain the equivalent impedance parameters of the active two-port network, as shown in Formula (21):
The equivalent voltages and of the active two-port network in Figure 5b are shown in Formula (22).
According to the above calculation, the two-port equivalent model of the active distribution network, except for the RPFC, is shown in Figure 7.
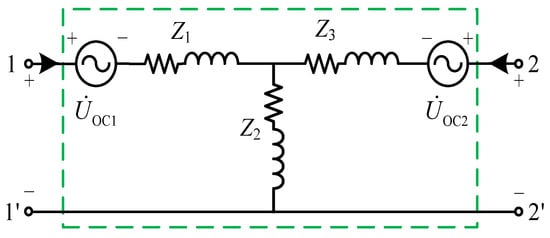
Figure 7.
Two-port equivalent model of the active distribution network, except for the RPFC.
When the power flow through the RPFC changes, the voltage and current at both terminals of the RPFC will vary correspondingly. During actual power flow control operations, the power reference values are adjusted frequently in response to practical requirements to achieve a rational power distribution. By recording the voltage–current data before and after power adjustments, the two-port equivalent model of the active distribution network containing the RPFC can be calculated in real time using Formulas (15), (20), and (22). The calculation process of this method is shown in Figure 8.
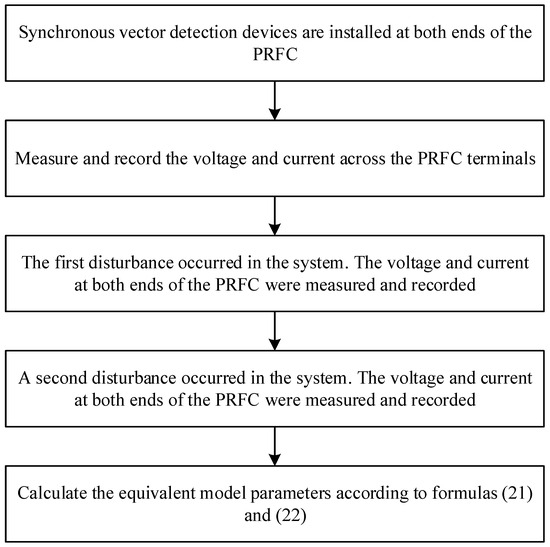
Figure 8.
Equivalent model calculation method.
4. RPFC Power Decoupling Control Based on Two-Port Equivalent Model
Since the RPFC consists of two rotary phase-shifting transformers, its equivalent model is intrinsically based on the transformer’s T-equivalent circuit. As shown in Figure 9, the diagram clearly demonstrates that the RPFC’s equivalent configuration inherently forms a two-port model.
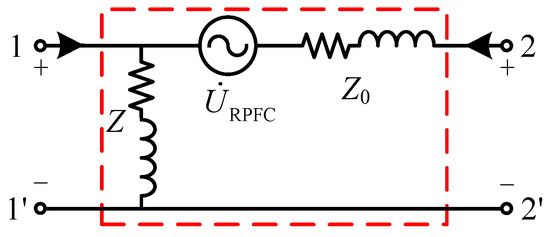
Figure 9.
T-equivalent circuit of RPFC.
By interconnecting corresponding ports in the models illustrated in Figure 7 and Figure 9, the equivalent model of the RPFC-integrated flexible interconnected distribution network is obtained, as shown in Figure 10a. Under normal operating conditions, the high impedance characteristic of the RPFC’s excitation branch allows it to be approximated as an open circuit in the equivalent model. Consequently, the simplified equivalent model of the RPFC-integrated system is depicted in Figure 10b, where the Z2 branch likewise assumes an open-circuit state.
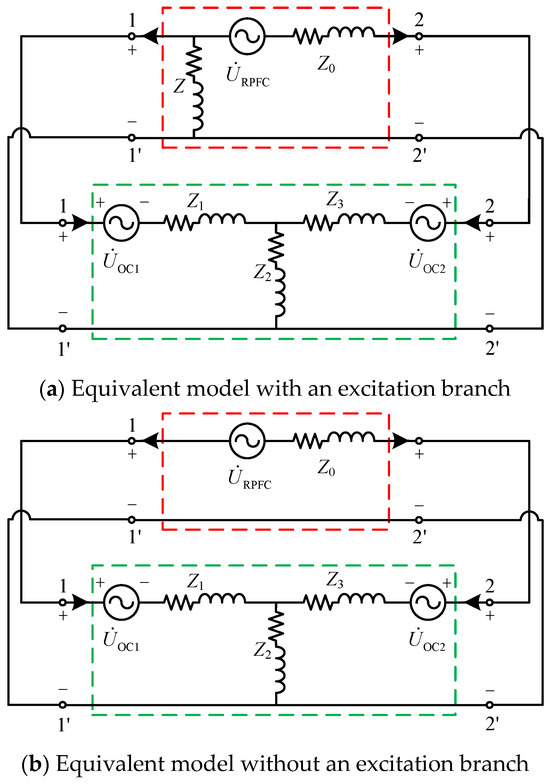
Figure 10.
Two-port equivalent model of a flexible interconnected distribution network based on the RPFC.
The operational principle of the RPFC involves injecting a series voltage phasor into the transmission line to create forced circulating power for active power redistribution. Let denote the power flow regulated by the RPFC, with the RPFC’s internal impedance defined as Z0 = R0 + jX0 and the equivalent distribution network impedances as Z1 = R1 + jX1 and Z3 = R3 + jX3. The mathematical relationship between the regulated power flow and the injected series voltage phasor is established as:
Performing power flow calculation at port 1 yields the following:
Substituting Formula (24) into Formula (23) yields the following:
Solving Formula (25) leads to the determination of the following:
Therefore, the functional relationship between the series-injected voltage phasor and the regulated power flow is mathematically established as shown in Formula (27):
Formula (27) enables rapid determination of the quantitative relationships between the magnitude/phase angle of the series-injected voltage phasor and the regulated power based on equivalent model parameters, thereby facilitating power decoupling control implementation in the RPFC system.
5. Simulation Analysis
5.1. Simulation Analysis Under Small Fluctuations
To validate the accuracy of the proposed model, a PRFC-based flexible interconnected distribution network was established, as depicted in Figure 2. The relevant parameters of the distribution network configuration are specified in Table 1.

Table 1.
Distribution network system parameters.
By modifying the active and reactive power reference values of the RPFC, the terminal voltages and currents in the interconnected distribution network are deliberately perturbed, enabling computational derivation of the equivalent model parameters. Three distinct simulation scenarios with active power fluctuations of 30%, 10%, and 5% magnitudes were implemented to analyze the model’s accuracy under varying disturbance intensities. The computational results are systematically presented in Table 2.
Table 2.
Calculation results of the equivalent model under different fluctuations.
The data in the table show that the obtained two-port equivalent model parameters exhibit minimal differences under varying fluctuation magnitudes, indicating that this method can be applied in scenarios with frequent minor fluctuations.
To further validate the feasibility of the proposed method, two-port equivalent models of the distribution network under different operating conditions were constructed using the data from the table, as illustrated in Figure 7. When the active power setpoints of the RPFC changed according to the aforementioned operating conditions, the power responses of the equivalent models were compared to those of the actual distribution network at the same ports. The comparative analyses of power responses between the equivalent models and the actual distribution network under 30%, 10%, and 5% active power fluctuations are shown in Figure 11, Figure 12, and Figure 13, respectively.
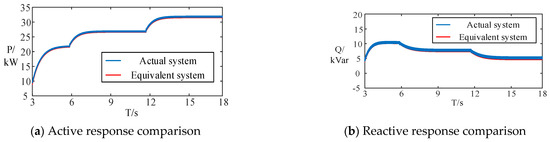
Figure 11.
Power comparison with 30% active power fluctuation.
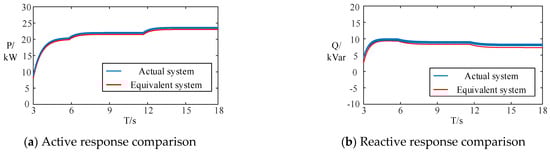
Figure 12.
Power comparison with 10% active power fluctuation.
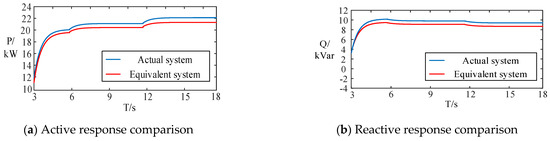
Figure 13.
Power comparison with 5% active power fluctuation.
As demonstrated in the preceding figures, the equivalent model achieves optimal consistency with the actual system’s power response under 30% active power fluctuation magnitude. When the fluctuation magnitude is reduced to 5%, observable deviations emerge between the equivalent model and actual system responses, although these remain within acceptable tolerance ranges. This comparative analysis reveals that the constructed equivalent model provides higher precision under significant power disturbances while maintaining sufficient accuracy for operational requirements during minor fluctuations.
5.2. Comparative Simulation Analysis
According to conventional distribution network modeling methods, constructing an equivalent model for interconnected distribution networks requires establishing separate equivalent models at both ports of the interconnection device, specifically formed by connecting two single-port models in series. To validate the superior capability of the proposed modeling approach in characterizing power interactions within interconnected distribution networks, a comparative analysis of power responses was conducted between equivalent models derived from traditional methods and the proposed method under identical operating conditions. Simulation cases with 10% and 5% reactive power fluctuation magnitudes were implemented, and the comparative results are presented below.
As demonstrated in Figure 14 and Figure 15, under different power fluctuation magnitudes, the power response of the two-port equivalent model constructed in this study exhibits closer alignment with the actual system response compared to that derived from conventional distribution network modeling methods. This comparative analysis confirms that the proposed two-port equivalent model more accurately characterizes the bidirectional power flow characteristics inherent to interconnected distribution networks, thereby demonstrating the validity and necessity of the methodology presented in this work.
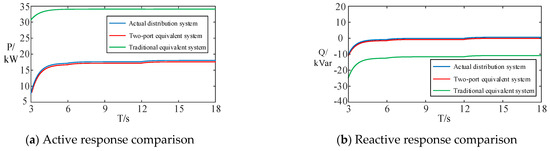
Figure 14.
Power comparison with 10% reactive power fluctuation.
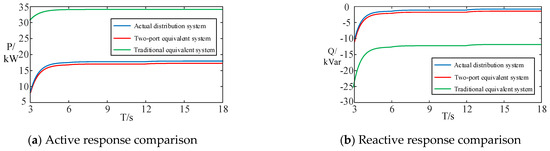
Figure 15.
Power comparison with 5% reactive power fluctuation.
5.3. Simulation Analysis of Power Distribution Based on the Equivalent Model
To validate the correctness of the power decoupling control method derived from the equivalent model and thereby further verify the feasibility of the proposed equivalent modeling approach, different power regulation setpoints were configured based on the equivalent model. The required series voltage phasor to be injected by the RPFC into the power line was calculated using Equation (27). This voltage phasor was then applied to the actual distribution network, enabling the measurement of the resultant actual power regulation quantities. The deviations between the setpoints and measured values were subsequently analyzed. The validation adopted the equivalent model constructed under 10% power fluctuation magnitude, with comparative evaluations conducted under two distinct operational scenarios:
Scenario 1: Active power flow allocation was exclusively adjusted with setpoints of ±10 kW, ±20 kW, ±30 kW, and ±40 kW.
Scenario 2: Reactive power flow allocation was independently regulated with setpoints of ±10 kVar, ±20 kVar, ±30 kVar, and ±40 kVar.
The comparative results under these two operational scenarios are presented in Figure 15 and Figure 16.
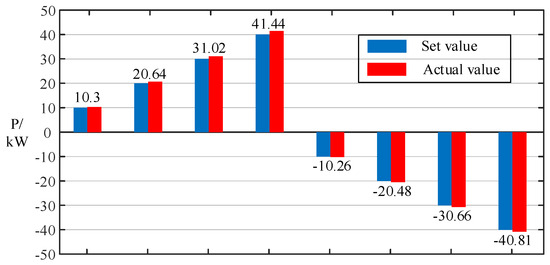
Figure 16.
Comparison of active power allocation.
As observed in Figure 16, the deviation between active power setpoints and actual values remains within approximately 3%, while Figure 17 demonstrates deviations of 4% to 7% for reactive power. These minimal errors substantiate the feasibility of the power decoupling control method based on the equivalent model, thereby further confirming the validity of the proposed equivalent modeling methodology.
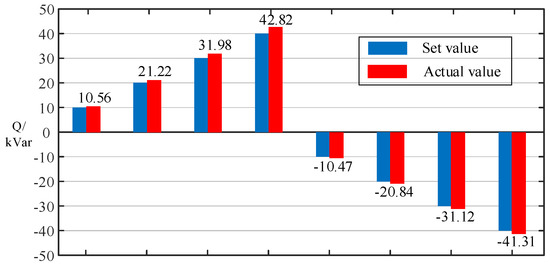
Figure 17.
Comparison of reactive power allocation.
5.4. Real-Time Simulation Analysis Based on the Equivalent Model
To validate the real-time performance of the proposed method, a dynamic simulation analysis was conducted. During system operation, additional loads were introduced to construct an equivalent model and regulate line power flow using this model. At the 6 s mark of system operation, a load with 120 kW active power and 80 kVar reactive power was added. Between 9 and 15 s, the equivalent model was reconstructed based on the modified system parameters, and the voltage phasor required to restore line power flow to pre-load conditions was computed. At 15 s, the control voltage phasor was applied to achieve power flow regulation. The active and reactive power variation profiles during this process are shown in Figure 18a,b, respectively.
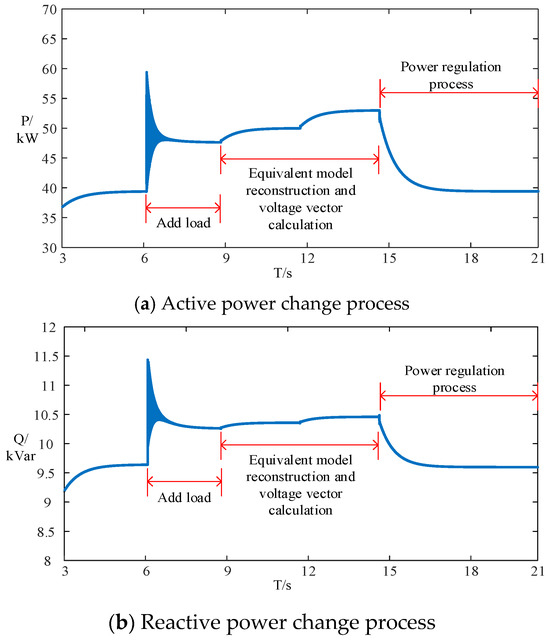
Figure 18.
Dynamic simulation power change.
As demonstrated in Figure 18, when implementing power flow control using the voltage phasor calculated from the reconstructed equivalent model, the power flowing through the RPFC remains consistent before and after load addition. This verifies the real-time capability of the proposed methodology and provides a theoretical reference for refined modeling and stability control research in distribution networks that incorporate flexible power interconnection devices, such as SOPs.
6. Conclusions
Addressing the research gap in construction methodologies for two-port equivalent models of flexible interconnected distribution networks, this paper proposes a two-port equivalent model construction method for interconnected distribution networks under small-signal perturbations based on the superposition theorem and its application in power flow control. Through simulation verification, the following conclusions are drawn:
- (1)
- The proposed superposition theorem-based two-port equivalent model construction method for interconnected distribution networks simplifies complex distribution networks into two-port network models comprising independent voltage sources and impedance components. By analyzing voltage and current variations before and after power regulation, the method calculates model parameters through the dual application of the superposition theorem, thereby establishing a novel methodological framework for equivalent modeling of flexible interconnected distribution networks.
- (2)
- Building upon the aforementioned two-port equivalent model, the power decoupling control functionality of power flow controllers is achieved by aligning with the operational principles of the RPFC.
- (3)
- Simulation verification under small-signal disturbances demonstrates the model’s accuracy across varying power fluctuation magnitudes. Furthermore, the implementation of the proposed power decoupling control method exhibits the precise performance of power flow regulation (deviation <7%), thereby validating the model’s effectiveness. This methodology also provides theoretical foundations for refined modeling and stability control research in the distribution networks incorporating flexible interconnection devices, such as SOPs.
Author Contributions
Conceptualization, Q.Z., J.J., X.Y., and W.A.; Data curation, J.J. and X.Y.; Formal analysis, C.S.; Investigation, J.J. and W.A.; Methodology, Q.Z., C.S., and A.S.; Project administration, W.A.; Resources, W.A.; Software, Q.Z. and A.S.; Validation, X.Y.; Visualization, C.S. and A.S.; and Writing—original draft, Q.Z., J.J., X.Y., W.A., C.S., and A.S. All authors have read and agreed to the published version of the manuscript.
Funding
This work was supported by the National Natural Science Foundation of China (52207102) and Basic Scientific Research Funds of Central Universities and Colleges (2024MS110).
Data Availability Statement
The original contributions presented in this study are included in the article. Further inquiries can be directed to the corresponding author.
Conflicts of Interest
The authors declare no conflicts of interest.
Nomenclature
| RPFC | Rotary Power Flow Controller |
| UPFC | Unified Power Flow Controller |
| SVC | Static Var Compensator |
| parallel voltage of the rotor winding | |
| series voltage output by the RPFC | |
| series line currents | |
| Zst | impedance of two RPST stator windings |
| port voltage for port 1-1′ | |
| current injected into the network from port 1-1′ | |
| port voltage after the disturbance of port 1-1′ | |
| current injected into the network after the disturbance of port 1-1′ | |
| open-circuit voltages at terminals 1-1′ | |
| voltage of the 1-1′ port after the second change | |
| current of the 1-1′ port after the second change | |
| series voltage phasor | |
| Z0 | RPFC’s internal impedance |
| ER | energy router |
| SOP | soft open point |
| power supply voltage of the AC system | |
| stator winding voltages | |
| current of the line where the RPFC is located | |
| parallel line currents | |
| Zrt | winding impedance of the RPST rotor |
| port voltage for port 2-2′ | |
| current injected into the network from port 2-2′ | |
| port voltage after the disturbance of port 2-2′ | |
| current injected into the network after the disturbance of port 2-2′ | |
| open-circuit voltages for port 2-2′ | |
| voltage of the 2-2′ port after the second change | |
| current of the 2-2′ port after the second change | |
| power flow regulated by the RPFC | |
| Z1 | equivalent distribution network impedance |
References
- Wang, J.J.; Sun, K.Q.; Li, K.J. Smooth switching strategy of control mode for converter in flexible interconnected distribution network. Autom. Electr. Power Syst. 2022, 46, 63–72. [Google Scholar]
- Shu, Y.; Zhang, L.; Zhang, Y.; Wang, Y.; Lu, G.; Yuan, B.; Xia, P. Carbon peak and carbon neutrality path for China’s power industry. Strateg. Study CAE 2021, 23, 1–14. [Google Scholar] [CrossRef]
- Ma, T.Y.; Faye, S. Multistep electric vehicle charging station occupancy prediction using hybrid LSTM neural networks. Energy 2022, 244, 123217. [Google Scholar] [CrossRef]
- Li, N.; Zhang, C.; Liu, Y.; Zhuo, C.; Liu, M.; Yang, J.; Zhang, Y. Single-Degree-of-Freedom Hybrid Modulation Strategy and Light-Load Efficiency Optimization for Dual-Active-Bridge Converter. IEEE J. Emerg. Sel. Top. Power Electron. 2024, 12, 3936–3947. [Google Scholar] [CrossRef]
- Su, X.; Xu, Q.; Wei, L.; Xin, S.; Hao, G.; Wang, X. Multivariate model optimisation during the implementation of flexible interconnection projects for MV distribution networks. Appl. Math. Nonlinear Sci. 2025, 10. [Google Scholar] [CrossRef]
- Xiao, J.; Wang, Y.; Luo, F.; Bai, L.; Gang, F.; Huang, R.; Jiang, X.; Zhang, X. Flexible distribution network: Definition, configuration, operation, and pilot project. IET Gener. Transm. Distrib. 2018, 12, 4492–4498. [Google Scholar] [CrossRef]
- Ni, M.; Wang, B.; Zhu, H.; Liu, S. Study of two-layer distributed optimal scheduling strategy for highly elastic multi-resource fusion distribution network in energy interconnection environment. Trans. China Electrotech. Soc. 2022, 37, 208–219. [Google Scholar]
- Wang, C.; Jie, J.; Haoran, J. Technologies and application of soft open points in distribution networks. Autom. Electr. Power Syst. 2022, 46, 1–4. [Google Scholar]
- Chen, G.; Li, P.; Yuan, Y. Application of MMC-UPFC on Nan**g Western Grid and its harmonic analysis. Autom. Electr. Power Syst. 2016, 40, 121–127. [Google Scholar]
- Bu, Z.; Sun, X.; Teng, J.; Zhao, W.; Li, X.; Wang, B. A compact energy router scheme based on MMC. Proc. CSEE 2022, 42, 4536–4546. [Google Scholar]
- Tong, Z.; Kui, W.; Zedong, Z.; Jupeng, P.A.; Yongdong, L.I. Review of power electronic transformers based on modular multilevel converters. Proc. CSEE 2022, 42, 5630–5648. [Google Scholar]
- Ivic, D.R.; Stefanov, P.C. An Extended Control Strategy for Weakly Meshed Distribution Networks With Soft Open Points and Distributed Generation. IEEE Access 2021, 9, 37886–37901. [Google Scholar] [CrossRef]
- Tan, Z.; Zhang, C.; Jiang, Q. Study on steady state characteristics of rotary power flow controller. Power Syst. Technol. 2015, 39, 1921–1926. [Google Scholar]
- Zhang, J.; Feng, X.; Zhou, J.; Zang, J.; Wang, J.; Shi, G.; Li, Y. Series-Shunt Multiport Soft Normally Open Points. IEEE Trans. Ind. Electron. 2023, 70, 10811–10821. [Google Scholar] [CrossRef]
- Ma, K.; Yang, J.; Liu, P. Relaying-Assisted Communications for Demand Response in Smart Grid: Cost Modeling, Game Strategies, and Algorithms. IEEE J. Sel. Areas Commun. 2020, 38, 48–60. [Google Scholar] [CrossRef]
- Wang, K.; Xue, Y.; Guo, Q.; Shahidehpour, M.; Zhou, Q.; Wang, B.; Sun, H. A Coordinated Reconfiguration Strategy for Multi-Stage Resilience Enhancement in Integrated Power Distribution and Heating Networks. IEEE Trans. Smart Grid 2023, 14, 2709–2722. [Google Scholar] [CrossRef]
- Wang, X.; Guo, Q.; Tu, C.; Li, J.; Xiao, F.; Wan, D. A two-stage optimal strategy for flexible interconnection distribution network considering the loss characteristic of key equipment. Int. J. Electr. Power Energy Syst. 2023, 152, 109232. [Google Scholar] [CrossRef]
- Tan, Z.; Zhang, C.; Jiang, Q.; Qin, X.; Yin, Y. Comparative research on rotary power flow controller, unified power flow controller and Sen transformer. Power Syst. Technol. 2016, 40, 868–874. [Google Scholar]
- Nie, Y.; Nasr Esfahani, M.; Hu, Y.; Li, X.; Alkahtani, M. Multi-Port Energy Router in Mobile Energy Storage for Emergency Power Outage in Urban Cities. Energies 2024, 17, 2927. [Google Scholar] [CrossRef]
- Ba, A.O.; Peng, T.; Lefebvre, S. Rotary power-flow controller for dynamic performance evaluation—Part I: RPFC modeling. IEEE Trans. Power Deliv. 2009, 24, 1406–1416. [Google Scholar] [CrossRef]
- Tan, Z.; Zhang, C.; Jiang, Q. Research on characteristics and power flow control strategy of rotary power flow controller. In Proceedings of the 2015 5th International Youth Conference on Energy (IYCE), Pisa, Italy, 27–30 May 2015; pp. 1–8. [Google Scholar] [CrossRef]
- Ba, A.O.; Peng, T.; Lefebvre, S. Rotary power-flow controller for dynamic performance evaluation—Part II: RPFC application in a transmission corridor. IEEE Trans. Power Deliv. 2009, 24, 1417–1425. [Google Scholar] [CrossRef]
- Chen, X.; Yuan, S.; Li, Y.; Li, Z.; Zeng, Z.; Geng, S. Fault location method for petal-shaped distribution network with inverter-interfaced distributed generators. Glob. Energy Interconnect. 2021, 4, 543–553. [Google Scholar] [CrossRef]
- Xie, H.; Wang, W.; Wang, W.; Tian, L. Optimal Dispatching Strategy of Active Distribution Network for Promoting Local Consumption of Renewable Energy. Front. Energy Res. 2022, 10, 826141. [Google Scholar] [CrossRef]
Disclaimer/Publisher’s Note: The statements, opinions and data contained in all publications are solely those of the individual author(s) and contributor(s) and not of MDPI and/or the editor(s). MDPI and/or the editor(s) disclaim responsibility for any injury to people or property resulting from any ideas, methods, instructions or products referred to in the content. |
© 2025 by the authors. Licensee MDPI, Basel, Switzerland. This article is an open access article distributed under the terms and conditions of the Creative Commons Attribution (CC BY) license (https://creativecommons.org/licenses/by/4.0/).