1. Introduction
Developing highly efficient insulating materials constitutes a critical concern within electrical engineering, particularly for applications in high-voltage equipment. Superior insulating materials require high dielectric strength, reliability, and environmental resistance for uninterrupted operation of the electrical power systems [
1,
2]. The material, composition, and design of the insulator influence the energy dissipated because of the leakage current. For ages, inorganic materials like porcelain and glass have remained in use for the manufacturing of insulators. Because of their durability and inertness, these materials can tolerate a large amount of electrical arcing and the applied voltage from the network without experiencing severe surface deterioration [
3]. In the last few years, materials other than glass and porcelain have been utilized for insulation purposes. These days, a wide range of materials with polymer bases are used for outdoor insulation requirements. Polymeric compounds such as epoxy-based composites and silicone rubber find applications in outdoor insulators with innovative properties [
4].
Epoxy-based nanocomposites have gained a lot of interest due to their superior electrical, mechanical, and thermal properties. The incorporation of nanofillers into base epoxy has been found to significantly improve dielectric properties by reducing charge accumulation, enhancing interfacial polarization, and minimizing electrical treeing effects [
5,
6,
7]. The breakdown voltage (BDV), a critical electrical insulation performance measure, has been shown to increase when nanoparticles, like TiO
2, SiO
2, Al
2O
3, Fe
3O
4, GO, carbon nanotubes (CNTs), etc., are added to the epoxy. The dielectric strength of nanocomposites depends on the kind and concentration of nanoparticles as well as processing parameters, including curing temperature and curing time [
8].
Epoxy-based nanocomposites have emerged as promising candidates for high-voltage insulation applications. Previous studies have demonstrated that well-dispersed nanoparticles enhance the electrical performance of epoxy nanocomposites by acting as charge-trapping centers, thereby increasing BDV. Nevertheless, comprehensive studies on the dielectric characteristics of epoxy nanocomposites doped with nanofillers are lacking in the present scientific literature, especially when employing a machine learning methodology specifically designed for this system. Furthermore, the procedure of preparing materials is sometimes drawn out, difficult, and time-consuming [
9,
10,
11,
12].
To produce a composite material with the specified qualities, numerous samples are needed, which raises the constraints of price and time duration. G. Pilania uses strong prediction algorithms and quasi-experimental data to address these problems. This approach attempts to address the disadvantages of traditional experimental methods by creating mathematical models and algorithms that accurately predict hypothetical samples. Because typical trial-and-error methods are time-consuming and resource-intensive, optimizing the composition of nanoparticles in epoxy-based insulators is a challenging task. The need for high-performance insulating materials necessitates investigating accurate and efficient methods for predicting breakdown voltage (BDV) based on compositional and processing properties [
13,
14]. Machine learning (ML) techniques offer a powerful alternative to modeling complex interactions in materials science, particularly for precisely and effectively predicting BDV. Machine learning approaches have quickly gained acceptance in materials research due to their remarkable ability to predict complex data [
15].
Many regression algorithms have been used to predict material properties over the past ten years, including support vector machine (SVM), K-Nearest Neighbor (KNN), Gradient Boosting Machine (GBM), Random Forest (RF), decision tree (DT), Extra Tree (ET), Extreme Gradient Boosting (XGBoost), etc. [
16,
17]. Taser et al. evaluated the impact of varying doping concentrations on the dielectric properties of phthalocyanine (Pc)-doped nematic liquid crystal (NLC) composites using standard regression techniques, such as XGBoost, RF, and DT regression [
18,
19]. Decision nodes in a decision tree split data based on features, while leaf nodes represent the predicted outcome or value. This structure is used in DT regression to forecast numerical results from iterative data.
The Random Forest (RF) method creates a set of decision trees by using the bagging approach. Multiple decision trees that have been trained on various data subsets are combined in RF regression. The results of each regression tree are averaged to obtain the final RF regression prediction. One of the most important parameters for RF analysis is the number of trees in a forest. Extreme Gradient Boosting (XGBoost), an RF method, uses a lot of decision trees. The primary distinction between XGBoost and RF is that the former builds its regression trees in a preset order, whereas RF builds its trees independently. One crucial factor for RF analysis is the measurement of the tree population in a forest. Extreme Gradient Boosting (XGBoost) uses a lot of decision trees as part of its RF technique [
20,
21]. XGBoost builds its regression trees in a preset order, while RF builds its trees in isolation. This is the primary difference between the two algorithms. SVM was notably used by Golin and Stefani to predict material parameters for LCD and organic LED applications. While Inokuchi et al. used a variety of machine learning techniques to predict the phase transition temperature of binary codes, Sigaki et al. used the KNN methodology to estimate critical parameters of LCs from texture images. ML methods like Random Forest and Gaussian process approaches are used to predict the materials’ dielectric qualities and have been investigated, with encouraging outcomes. The additional tree regression method’s prediction power for predicting the absorption of metamaterial absorbers was examined by Jain et al. [
22,
23,
24].
Machine learning (ML) has emerged as a transformative tool in materials science. By creating predictive relationships with a small number of expert-labeled datasets, automated machine learning-based feature extraction from Reflection High-Energy Electron Diffraction (RHEED) data has sped up the synthesis of nanomaterials [
25]. Additionally, ML techniques have improved texture control in metal-forming applications by optimizing manufacturing processes and material structures [
26]. Redox flow battery performance has been enhanced in the energy sector by ML models combined with Bayesian optimization and high-throughput screening [
27]. Using generative models and inverse design techniques, rapid property prediction and material discovery with fewer experiments are made possible [
28]. Time-series algorithms such as Long Short-Term Memory (LSTM) and Gated Recurrent Unit (GRU) greatly enhance material quantity forecasting and minimize operational downtime in cement production [
29]. ML has also improved thermal management by creating effective phase change material (PCM) placement close to silicon chips [
30]. Regression models and ML-guided classification have improved material outcomes and decreased failed trials for inorganic synthesis [
31].
The evaluation of different well-established machine learning models for accurately and effectively predicting the breakdown voltage in epoxy nanocomposites at different weight percentages (wt%) is the main goal of this research work. The goal is to draw out the necessity for costly and time-consuming experimental synthesis and characterization techniques. This is achieved by training machine learning models over a wide range of breakdown voltages (BDVs) and weight percentages (wt%) of nanoparticles, enabling machine learning models to produce precise forecasts of epoxy-based nanocomposites having high BDV strength with the exact ratio of nanoparticles required to achieve that dielectric strength. This study compares seven advanced ML regression models, i.e., Random Forest Regression (RFR), Extra Trees Regression (ETR), Support Vector Regression (SVR), Gradient Boosting Regression (GBR), Extreme Gradient Boosting (XGBoost) Regression, Adaptive Boosting (AdaBoost) Regression, and Light Gradient Boosting Machine (LightGBM) Regression. The best-performing model is subsequently employed for the forecast of the optimal concentration of NPs to obtain high BDV in the epoxy nanocomposite. A prototype of the predicted nanocomposite insulator is prepared. To validate the accuracy and outcomes of machine learning, the prototype insulator undergoes breakdown voltage (BDV) testing. Thus, this study explicates the capability of machine learning approaches for selecting materials in composite materials, focusing on epoxy-based nanocomposite insulators.
4. Machine Learning Model Implementation
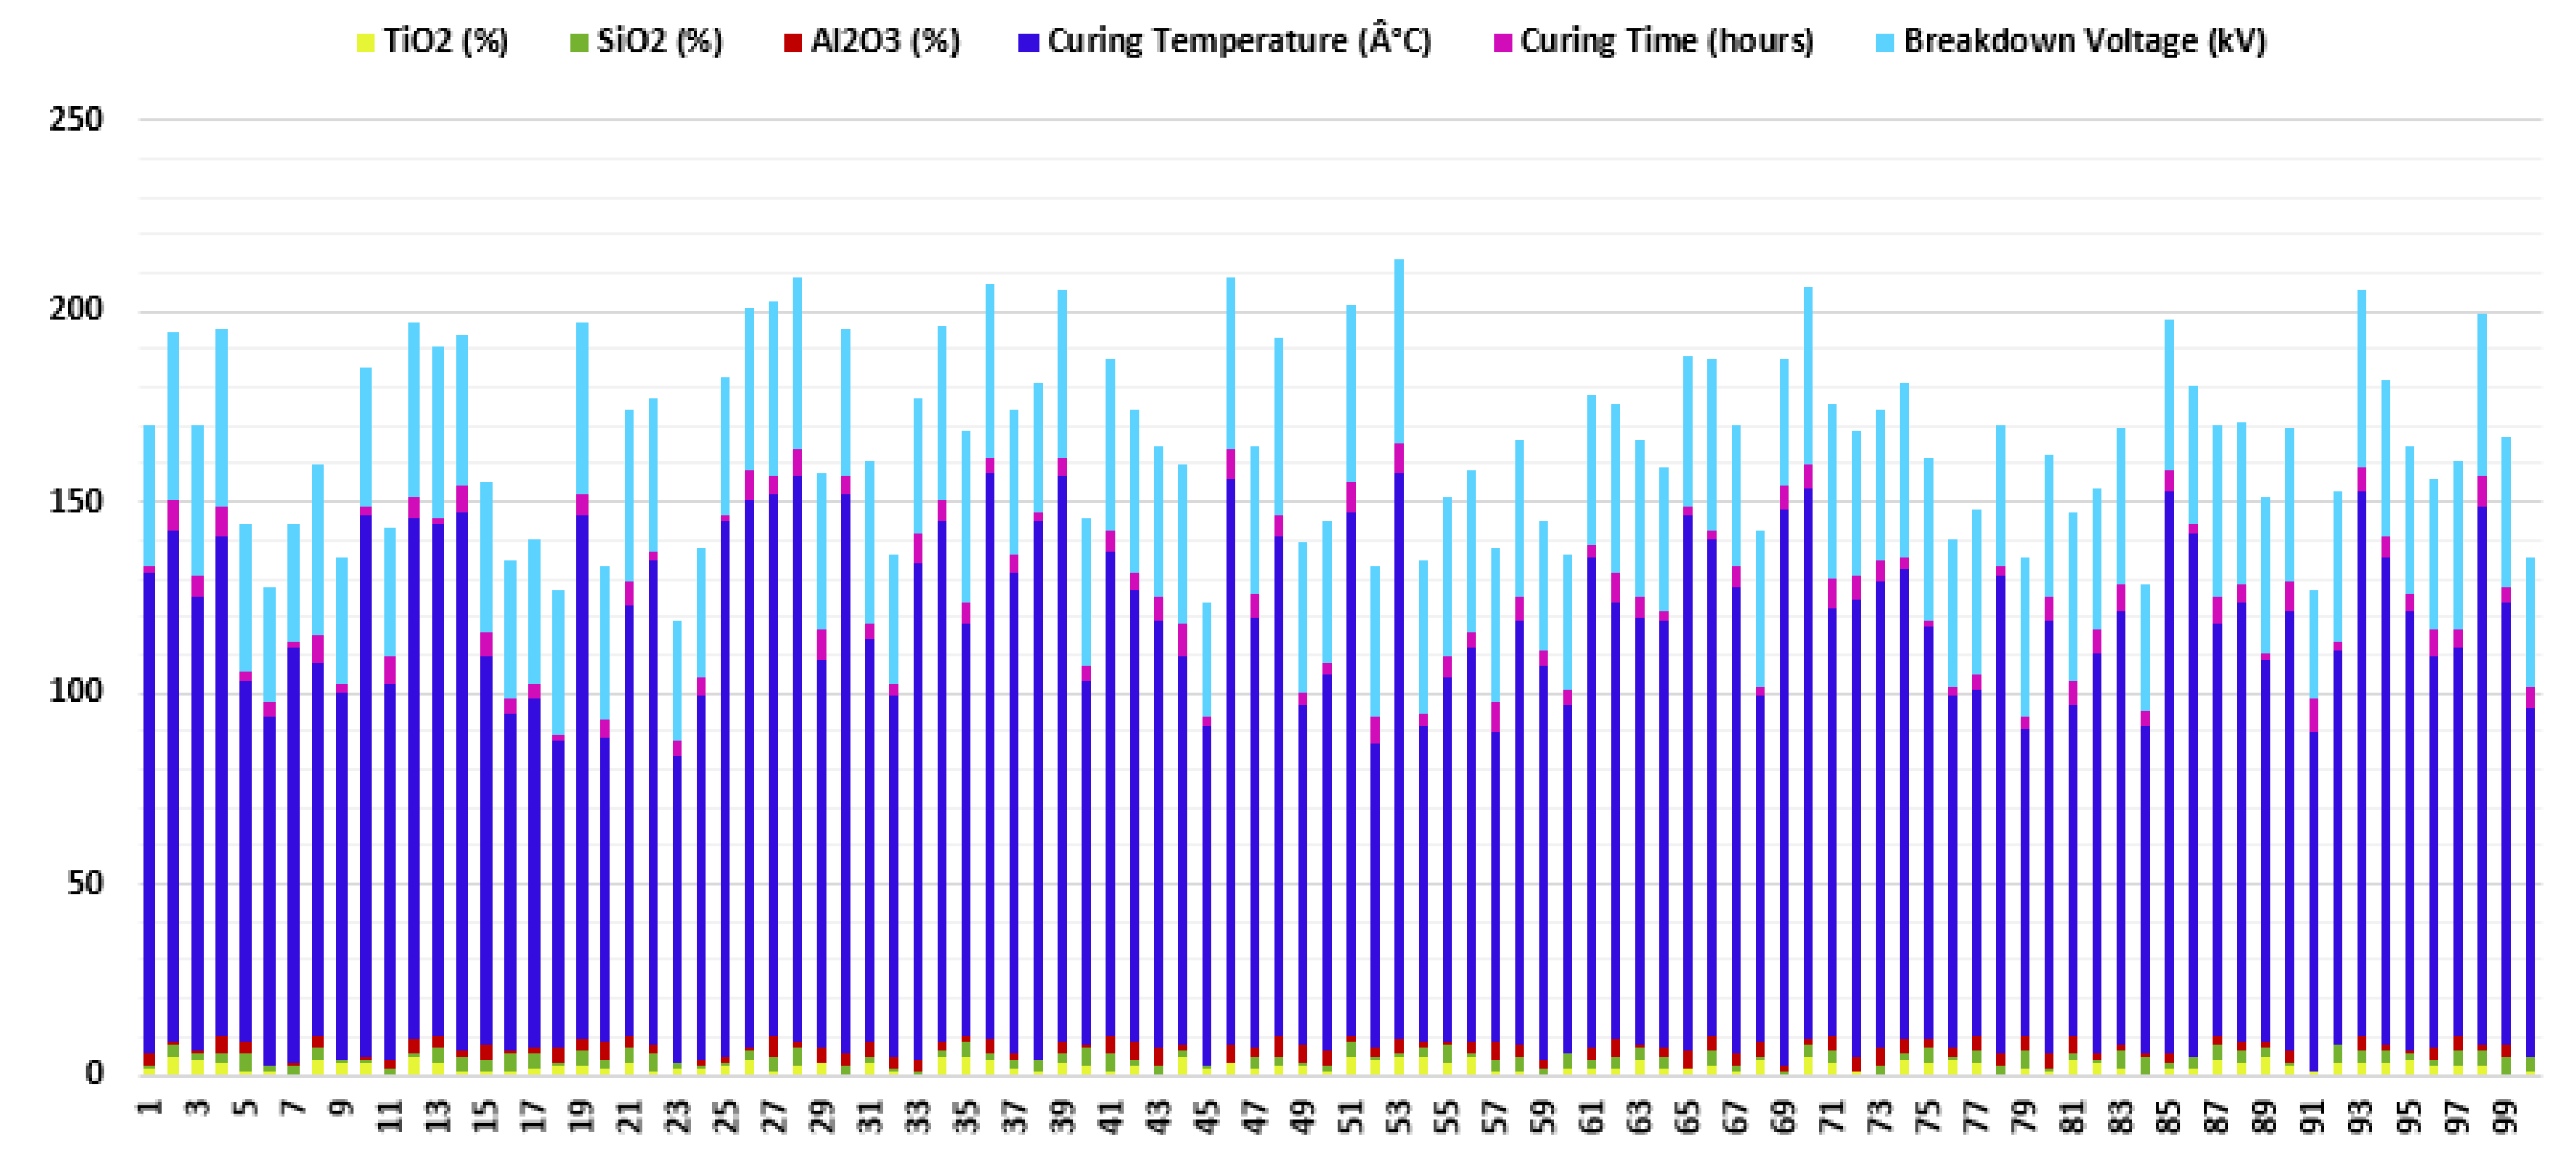
The next phase of this research includes the implementation of machine learning models on a real-time, experimentally generated dataset. Machine learning has been employed to take advantage of its predictive capabilities for material selection. This approach will facilitate the selection of optimal materials tailored to specific performance requirements. The current study focuses on the selection of the optimal ratio of nanoparticles for achieving the highest breakdown voltage strength in epoxy-based nanocomposite insulators. For this purpose, a total of 100 prototype epoxy-based nanocomposite insulators were prepared with varying ratios of TiO2, SiO2, and Al2O3, with relevant curing temperature and time. The association of the input parameters, wt% of TiO2, SiO2, and Al2O3, curing temperature (°C), curing time (hours), and the output variable, breakdown voltage (BDV) in kV, is explored through various regression techniques. The optimum concentration of NPs in epoxy-based insulators was determined using seven state-of-the-art machine learning regression models: RFR, GBR, ETR, SVR, AdaBoost, XGBoost, and LightGBM.
4.1. Performance Metrics of ML Models
Mean Absolute Error (MAE) and R-Squared Score (R2 Score) are famous performance metrics for evaluating the precision and accuracy of regression techniques. These metrics are responsible for evaluating innovation ability, the model’s goodness of fit, and reliability in predicting the optimum wt% concentration of nanoparticles.
Mean Absolute Error (MAE) and R-Squared Score (R2 Score)
MAE quantifies the average magnitude of prediction errors, calculated as the average absolute difference between actual and predicted values. A lower MAE indicates higher accuracy. R
2 Score measures the proportion of variance in the dependent variable explained by the model, ranging from 0 to 1. A higher R
2 signifies a better model fit. Together, MAE and R
2 Score, shown in Equations (1) and (2), are key metrics for evaluating regression model performance [
34,
35].
4.2. ML Model Implementation Schematic
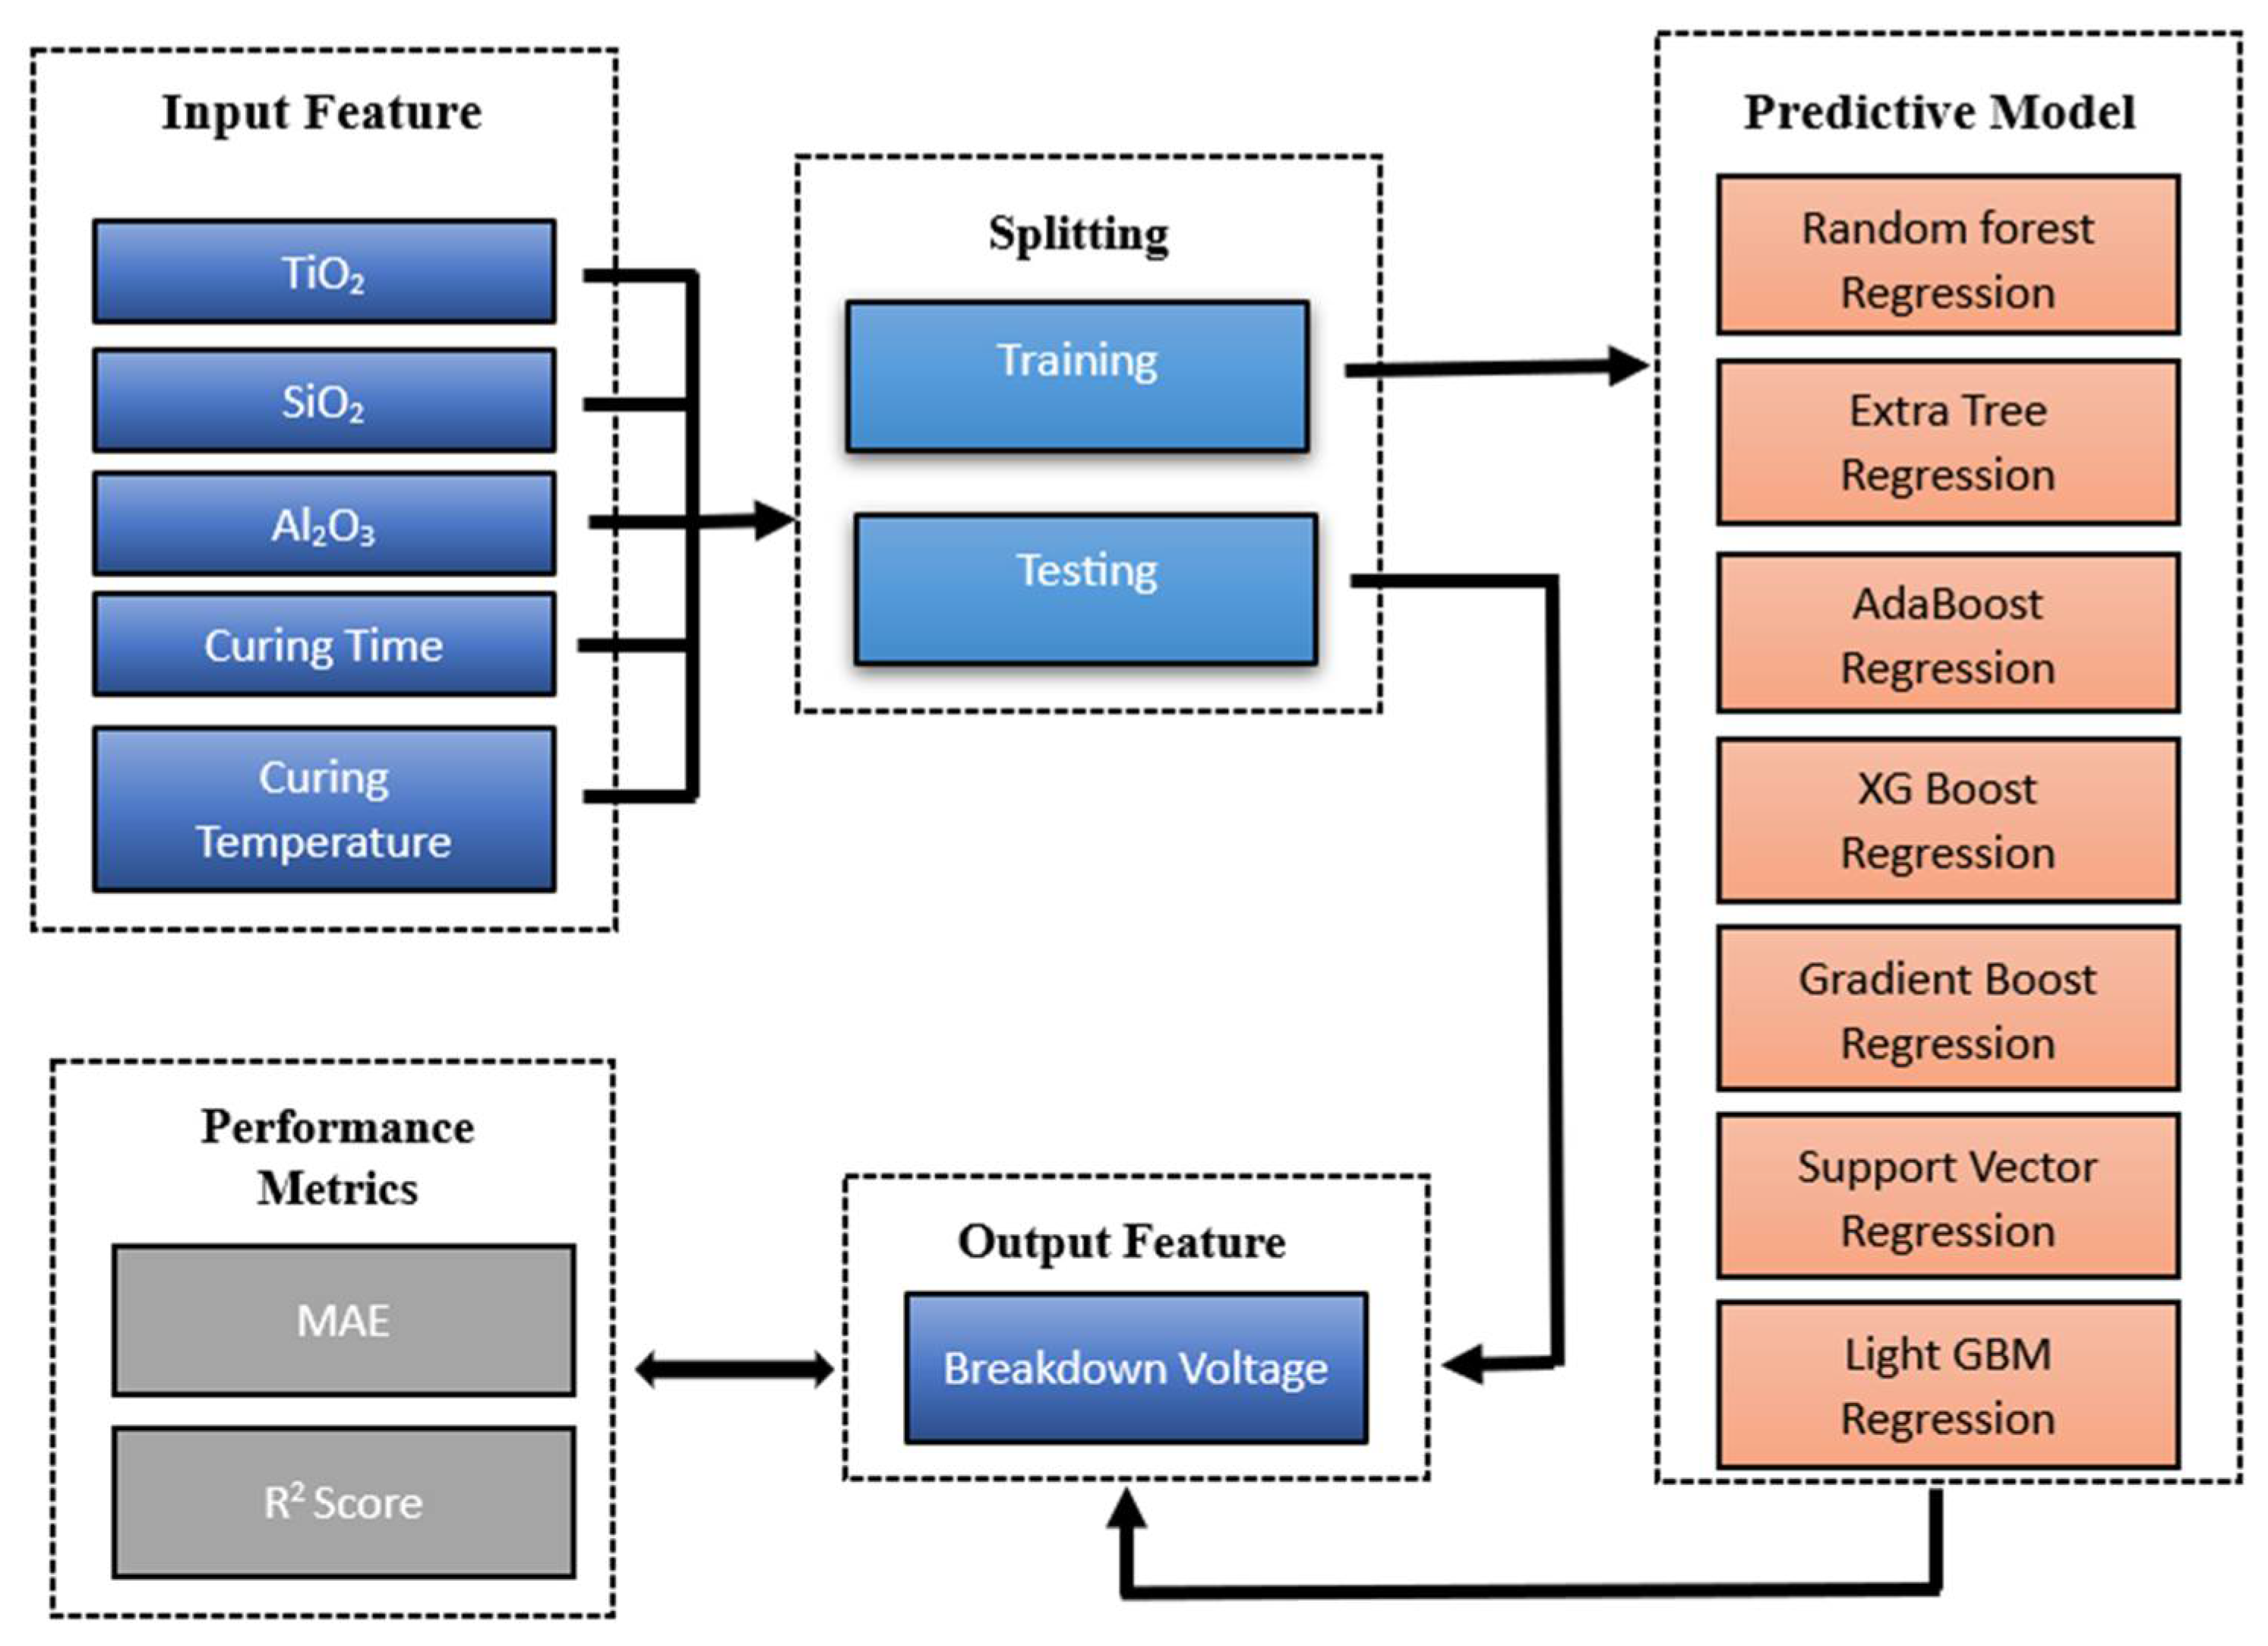
Figure 5 illustrates the schematic framework employed for the prediction of breakdown voltage. The input features, comprising the concentrations of TiO
2, SiO
2, and Al
2O
3 nanoparticles, along with curing time and temperature, were utilized to train and evaluate various regression algorithms within the predictive model block. The dataset was partitioned into training and testing sets to assess the generalization capability of the models. Thus, 80% of the data was used for training and 20% of the data was used for testing. The targeted output variable for prediction is breakdown voltage (BDV). The quantitative accomplishment of regression models was assessed using Mean Absolute Error (MAE) and R-Squared Score (R
2 Score), which are the core measures. This structured way is aimed at building a sturdy predictive correlation between input parameters and the dielectric properties of the formulated nanocomposite insulators.
4.3. Results of ML Models
Based on five input parameters, i.e., curing temperature (°C), curing time (hours), wt% of TiO2, SiO2, and Al2O3, and one output parameter, breakdown voltage (BDV), the dielectric strength of epoxy-based nanocomposite insulators was predicted. Support Vector Regression (SVR), Extreme Gradient Boosting (XGBoost) Regression, Random Forest Regression (RFR), Gradient Boosting Regression (GBR), Extra Trees Regression (ETR), Adaptive Boosting (AdaBoost) Regression, and Light Gradient Boosting Machine (LightGBM) Regression are among the models that were assessed. The coefficient of determination (R2 score) was used to evaluate their performance. Higher performance metric values indicated the superior predictive accuracy of the model. Out of the seven predictive models evaluated, three demonstrated a prediction accuracy exceeding 90%. For clarity and conciseness, this study will elaborate on these three high-performing machine learning models, followed by a comparative analysis encompassing all seven models.
4.3.1. Results
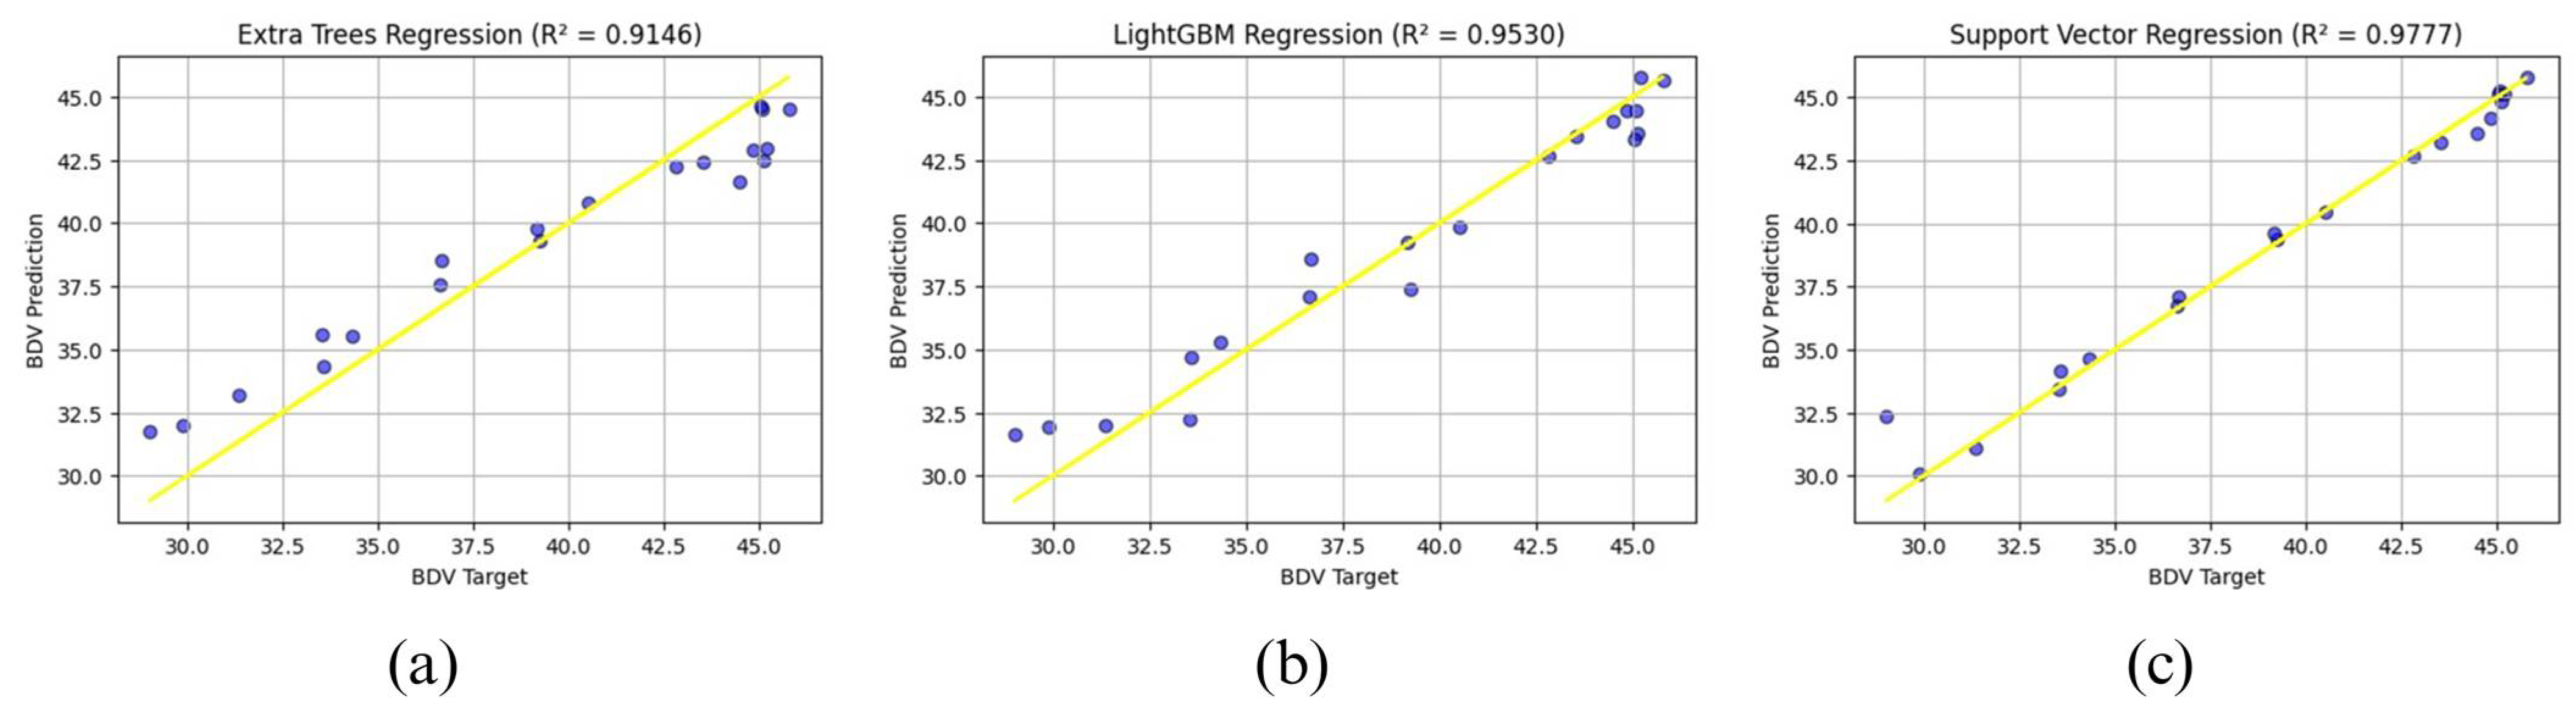
Each model showed meaningful proficiency in capturing the complex relationship between input parameters (such as nanoparticle composition, curing temperature, and time) and the output parameter (BDV). ETR achieved an R2 score of 0.9146, explaining a considerable section of the BDV variance and showing a strong correlation between the actual and predicted values. While slight deviations were noted, this model remains valid for initial approximations in material design. LightGBM Regression gives a higher predictive accuracy with an R2 score of 0.9530. Its efficient handling of complex data relationships was observable from the tight clustering of data points along the ideal prediction line, making it a dominant and computationally optimized option for BDV prediction. The SVR model became the top performer, which demonstrated an accuracy of 97.77%. Its superior potential to manage high-dimensional data and model nonlinear relationships resulted in the most accurate BDV predictions. The minimal dispersion and strong linear correlation noticed in its scatter plot underscore SVR’s effectiveness in capturing subtle interactions within the material system.
While ETR offers a solid foundation, LightGBM presents increased accuracy and efficiency. SVR, however, stands out as the most reliable and accurate model for this application, particularly due to its robust handling of nonlinearity and error minimization capabilities, making it highly appropriate for accurate material selection and optimization tasks. Future work across all models could explore hyperparameter tuning, expanded datasets, and hybrid modeling techniques to further refine their predictive accuracy and robustness.
Figure 6 presents a comparison of scatter plots of these three high-performing models.
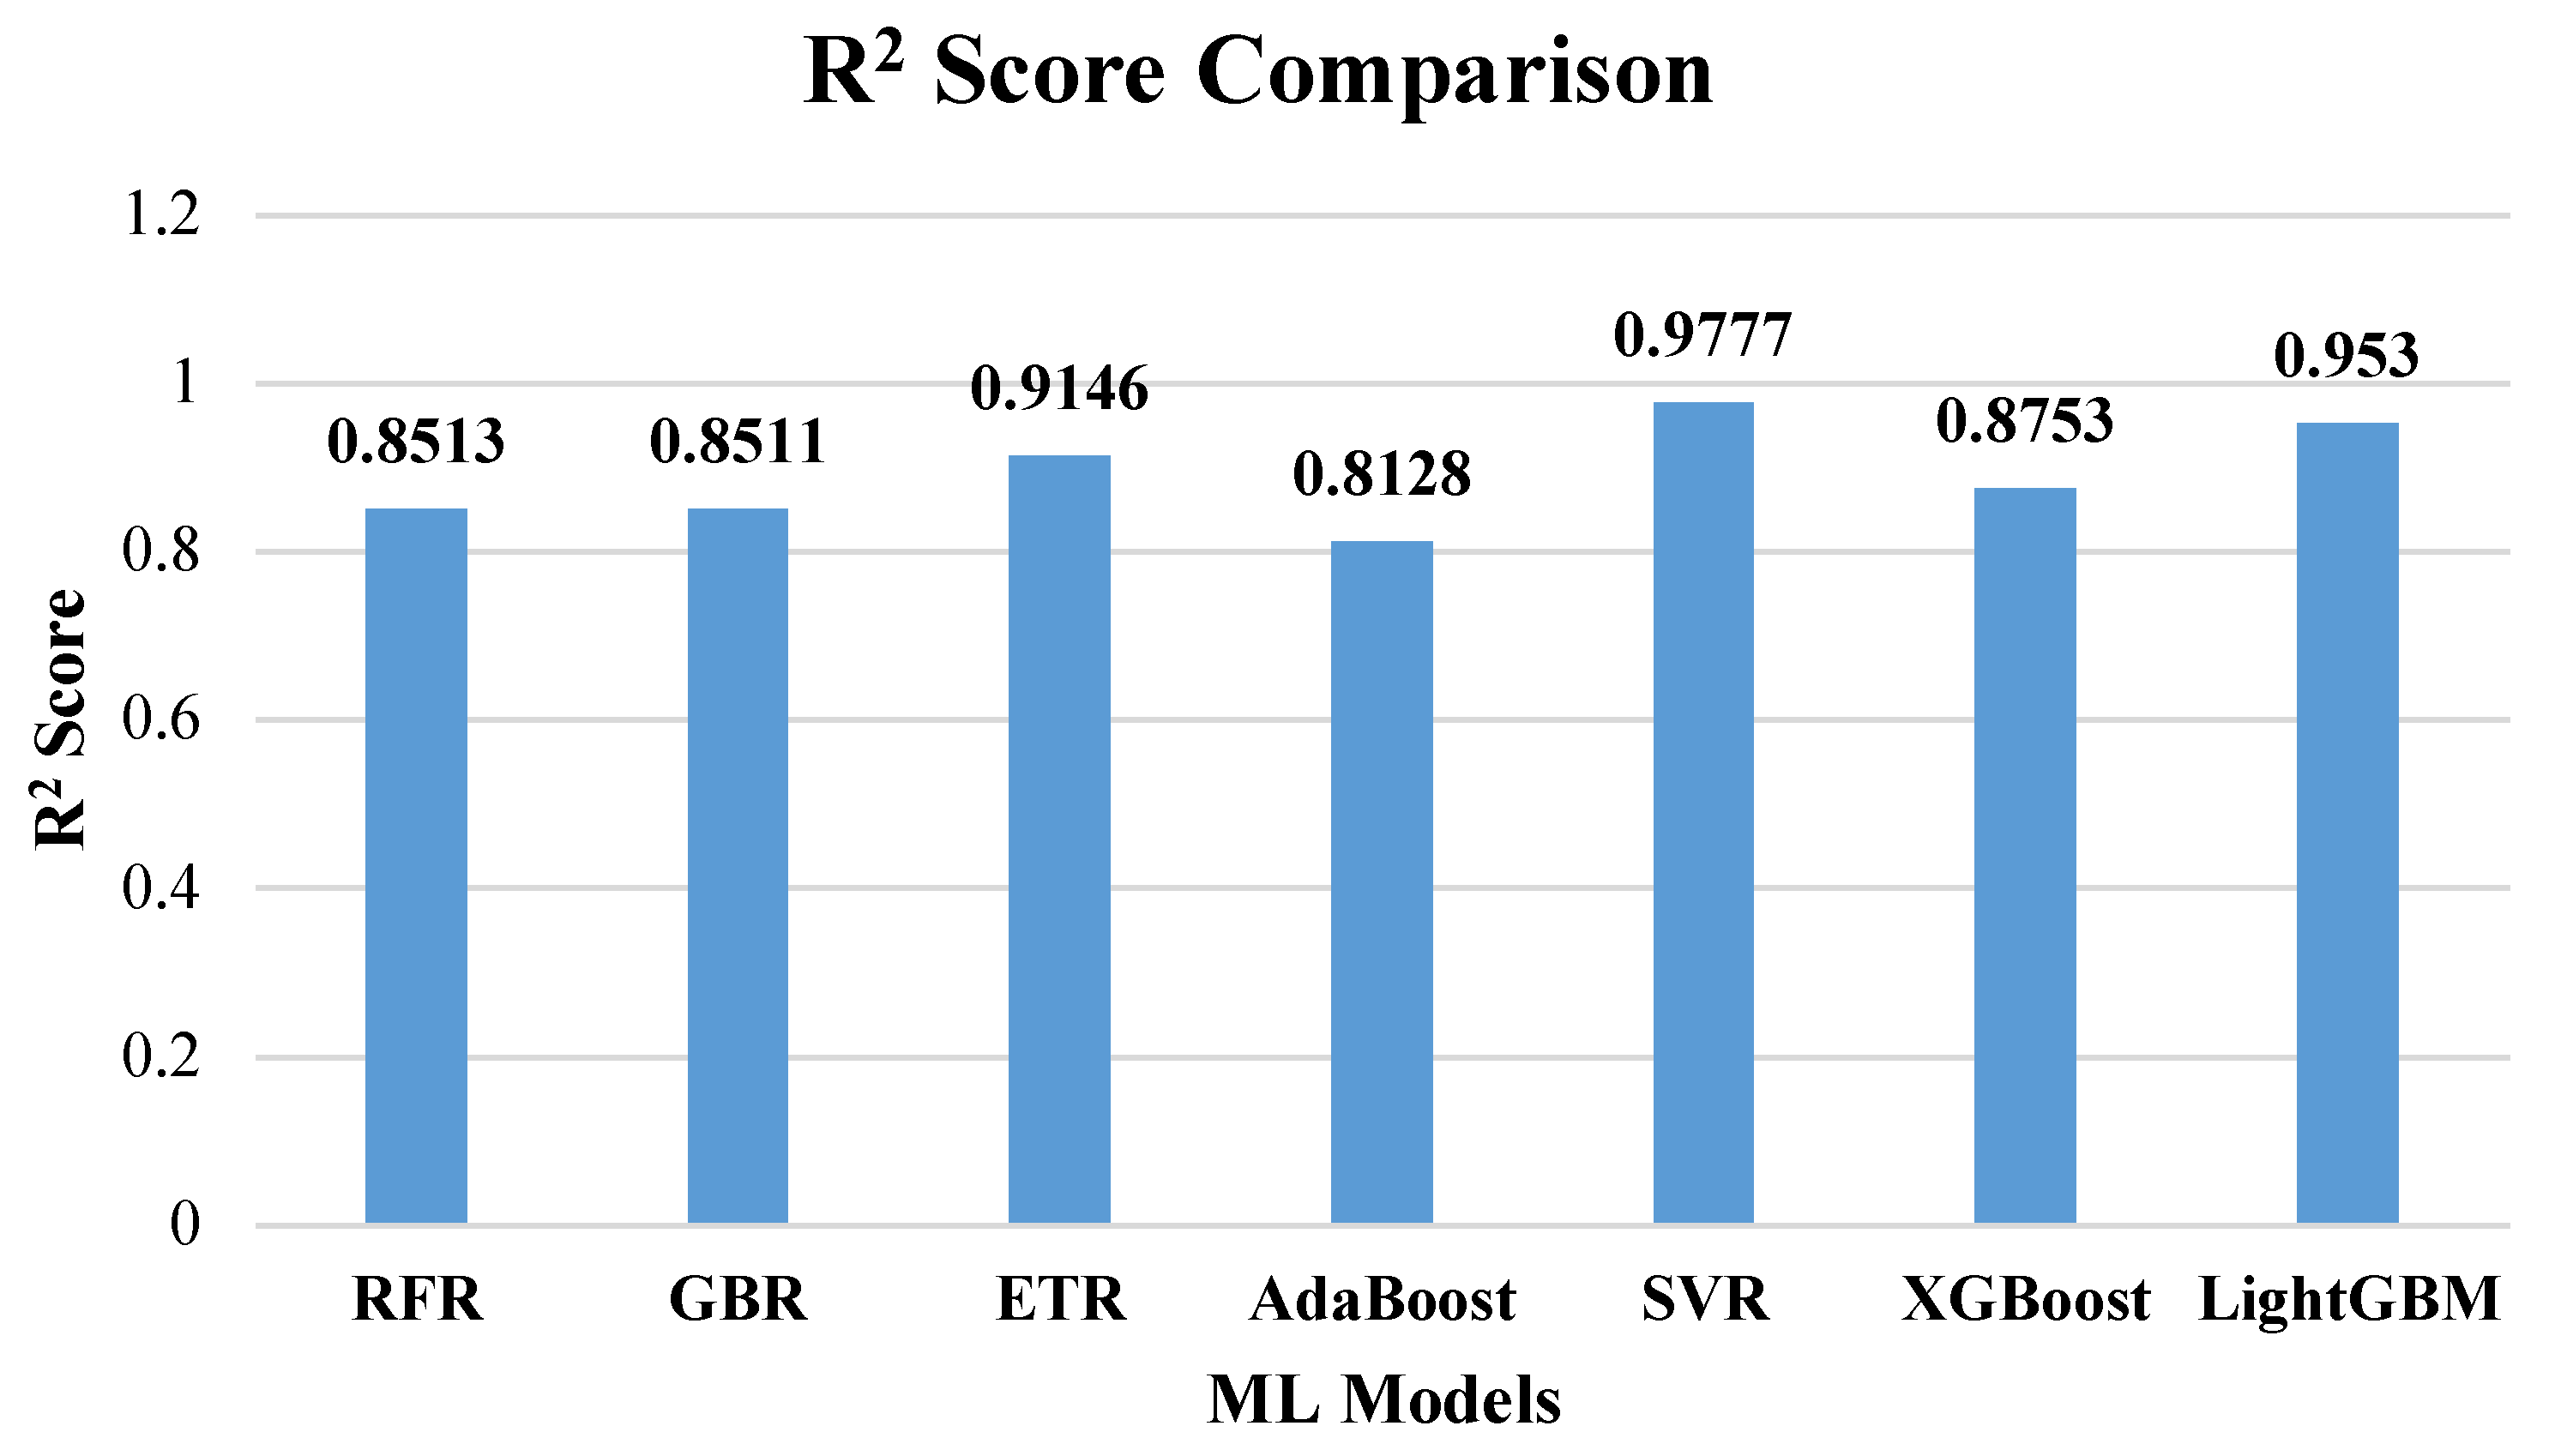
4.3.2. R2 Score Comparison
Figure 7 shows a detailed comparison of the R
2 score of all seven regression models of machine learning.
The prediction accuracy can be seen for each model independently regarding the estimation of the breakdown voltage of epoxy-based nanocomposite insulators. Support Vector Regression (SVR) has the highest R2 score (0.9777) among the models being investigated, indicating that it has more capability in identifying the intricate nonlinear relationships between BDV, processing conditions, and wt% concentration of NPs (i.e., TiO2, SiO2, and Al2O3). LightGBM regression comes in second place, with an R2 of 0.9530, and ETR comes in third place, with an R2 of 0.9146. The remaining models failed to predict the NP ratio by having 0.8753, 0.8511, 0.8513, and 0.8128 for XGBoost, GBR, RFR, and AdaBoost, respectively. SVR was found to be the most accurate and reliable model for predicting BDV.
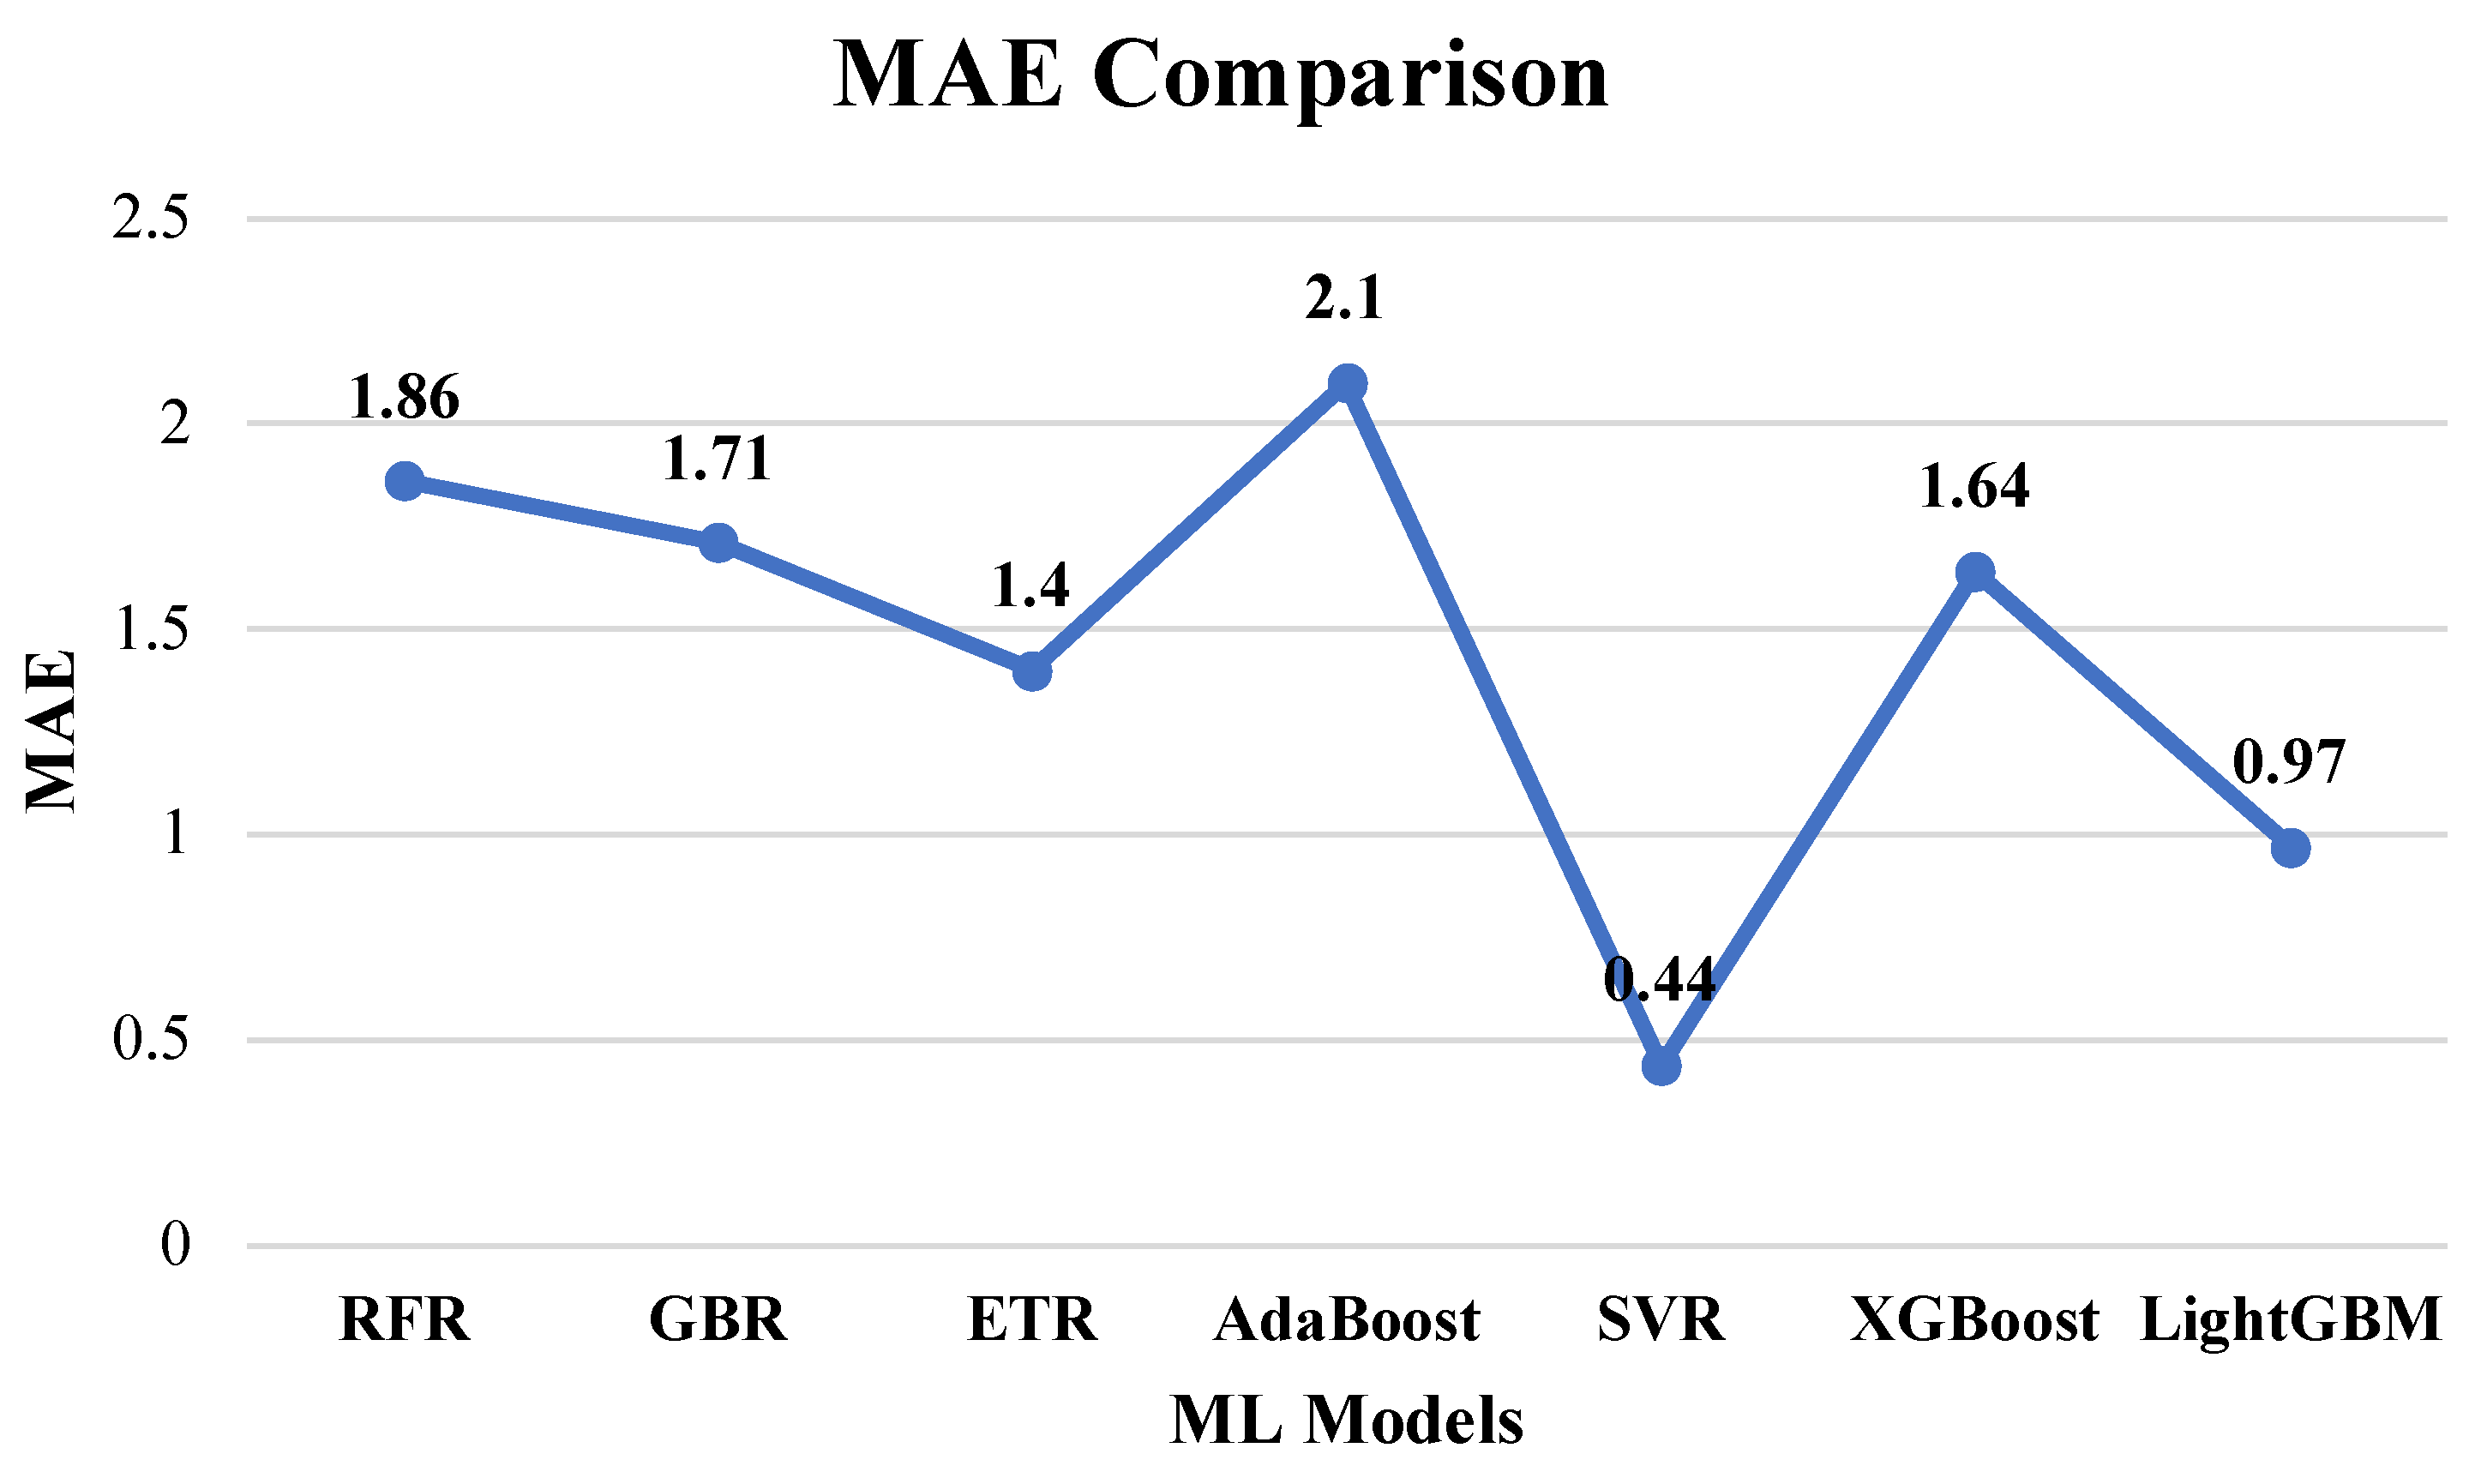
4.3.3. MAE Comparison
By measuring the average absolute differences between the actual and predicted values, MAE provides enlightening perspectives related to prediction accuracy.
Figure 8 compares the MAE values of all seven regression models of machine learning. MAE indicates the prediction error, so a lower value of MAE means a more accurate and reliable model for prediction. SVR was found to have the lowest MAE value of 0.44, as compared to the rest of the models. It is obvious because SVR has the highest R
2 score. This indicates that SVR generates predictions with minimal error. LightGBM regression comes in second place with an MAE value of 0.97, and ETR comes in third place with an MAE value of 1.40. Both LightGBM and ETR have a lower value of MAE, but SVR has the lowest value of MAE, which authenticates its best performance.
XGBoost has an MAE of 1.64, RFR has an MAE of 1.86, and GBR has an MAE of 1.71. All of these models have a significant degree of inaccuracy, as evidenced by their MAE values. AdaBoost has the lowest value of MAE, with 2.10, showing it is not recommended for prediction. All these models, except SVR, LightGBM, and ETR, have trouble predicting the breakdown voltage values of epoxy-based nanocomposite insulators. On the other hand, SVR has the potential to predict the breakdown voltages precisely with minimum error.
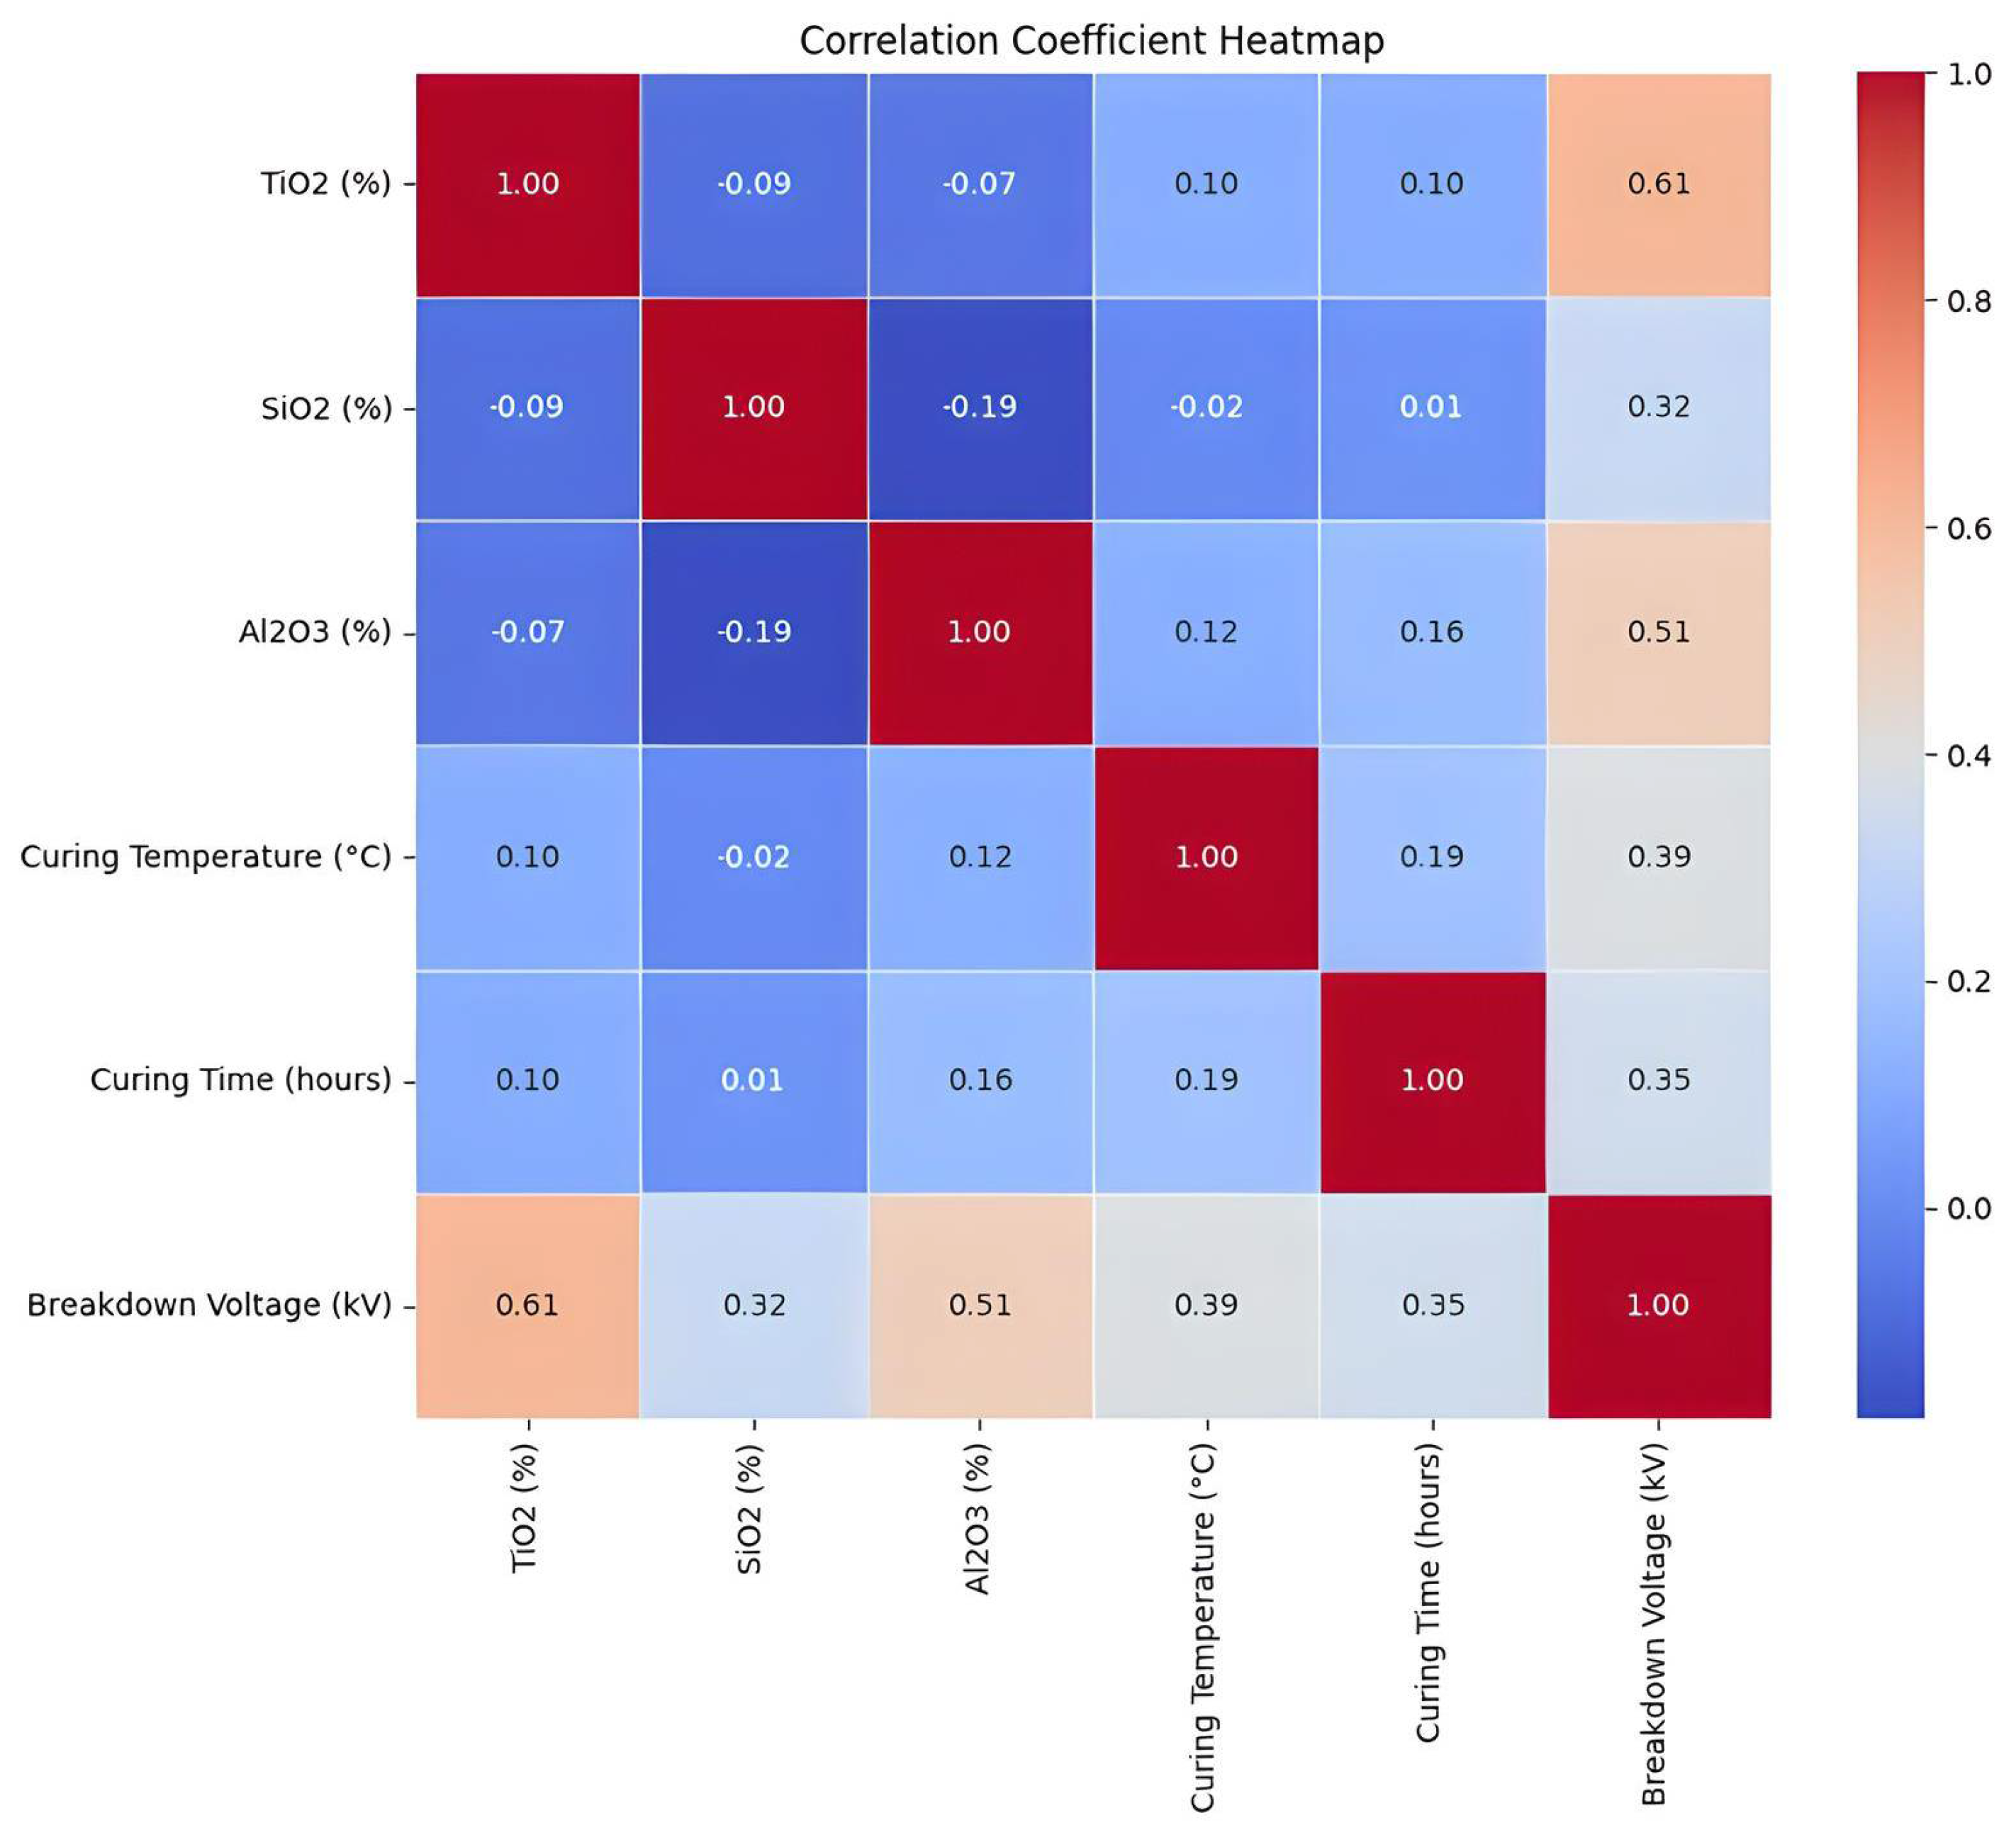
4.3.4. The Correlation Coefficient Heatmap
Figure 9 shows a correlation coefficient heatmap. It describes the connections between the input parameters, i.e., TiO
2, SiO
2, Al
2O
3, curing temperature, and curing time, and their effect on the output parameter of the epoxy-based insulators’ breakdown voltage (BDV). Positive values in the heatmap show a direct association, negative values show an inverse correlation, and values near zero indicate little correlation. The values in the heatmap range from −1 to 1.
As illustrated by the correlation coefficient heatmap, TiO2 (%) and BDV have the largest positive connection (0.61), which indicates that a higher concentration of TiO2 raises BDV significantly. This suggests that TiO2 is essential for improving epoxy-based materials’ dielectric qualities. Additionally, there is a positive connection between AlO3 (%) and BDV (0.51), indicating that raising the concentration of AlO3 enhances BDV, albeit not as much as TiO2. In comparison to TiO2 and Al2O3, SiO2 (%) exhibits a moderate association (0.32) with BDV, suggesting that its influence is less noticeable. Curing temperature (0.39) and curing time (0.35), two processing parameters, exhibit moderate correlations with BDV, indicating that while they both help to increase BDV, their effects are less significant than those of the nanoparticle composition. This suggests that although better BDV requires ideal curing conditions, the composition of the nanoparticles has a greater impact.
Additionally, weak or negative correlations between several factors are shown in the heatmap. SiO2 (%) and Al2O3 (%), for instance, show a modest negative correlation (−0.19), indicating that these nanoparticles may interact competitively when combined in epoxy compositions. Furthermore, there are negligible interaction effects as TiO2 (%) exhibits weak negative correlations with SiO2 (%) (−0.09) and Al2O3 (%) (−0.07). Overall, the correlation study demonstrates that SiO2 has a very minor effect on BDV, while TiO2 and Al2O3 are the most important elements influencing BDV, followed by curing conditions. For epoxy-based insulators to have the highest dielectric performance, the nanoparticle compositions must be optimized.
4.4. ML-Based Prediction (Optimum Ratio of NPs)
Following the successful implementation of machine learning models on the experimentally prepared dataset, the subsequent phase involved leveraging the top-performing model for predictive purposes. Based on the evaluation metrics, the Support Vector Regression (SVR) model exhibited the highest accuracy, registering 97.77%. Consequently, the authors employed the SVR model to generate predictions for achieving the highest BDV of epoxy-based nanocomposite insulators. The experimentally generated dataset contains important input features like the wt% ratio of TiO2, SiO2, and Al2O3, in addition to curing parameters like temperature (°C) and duration (hours). The desired output parameter (label) is the breakdown voltage (BDV), with units in kV. The authors were able to predict the breakdown voltage based on various wt% of nanoparticle combinations by training the machine learning algorithm to recognize patterns and correlations between these variables. The ideal nanoparticle ratio required to achieve the highest breakdown voltages (BDVs) in epoxy nanocomposites was the main goal of this research.
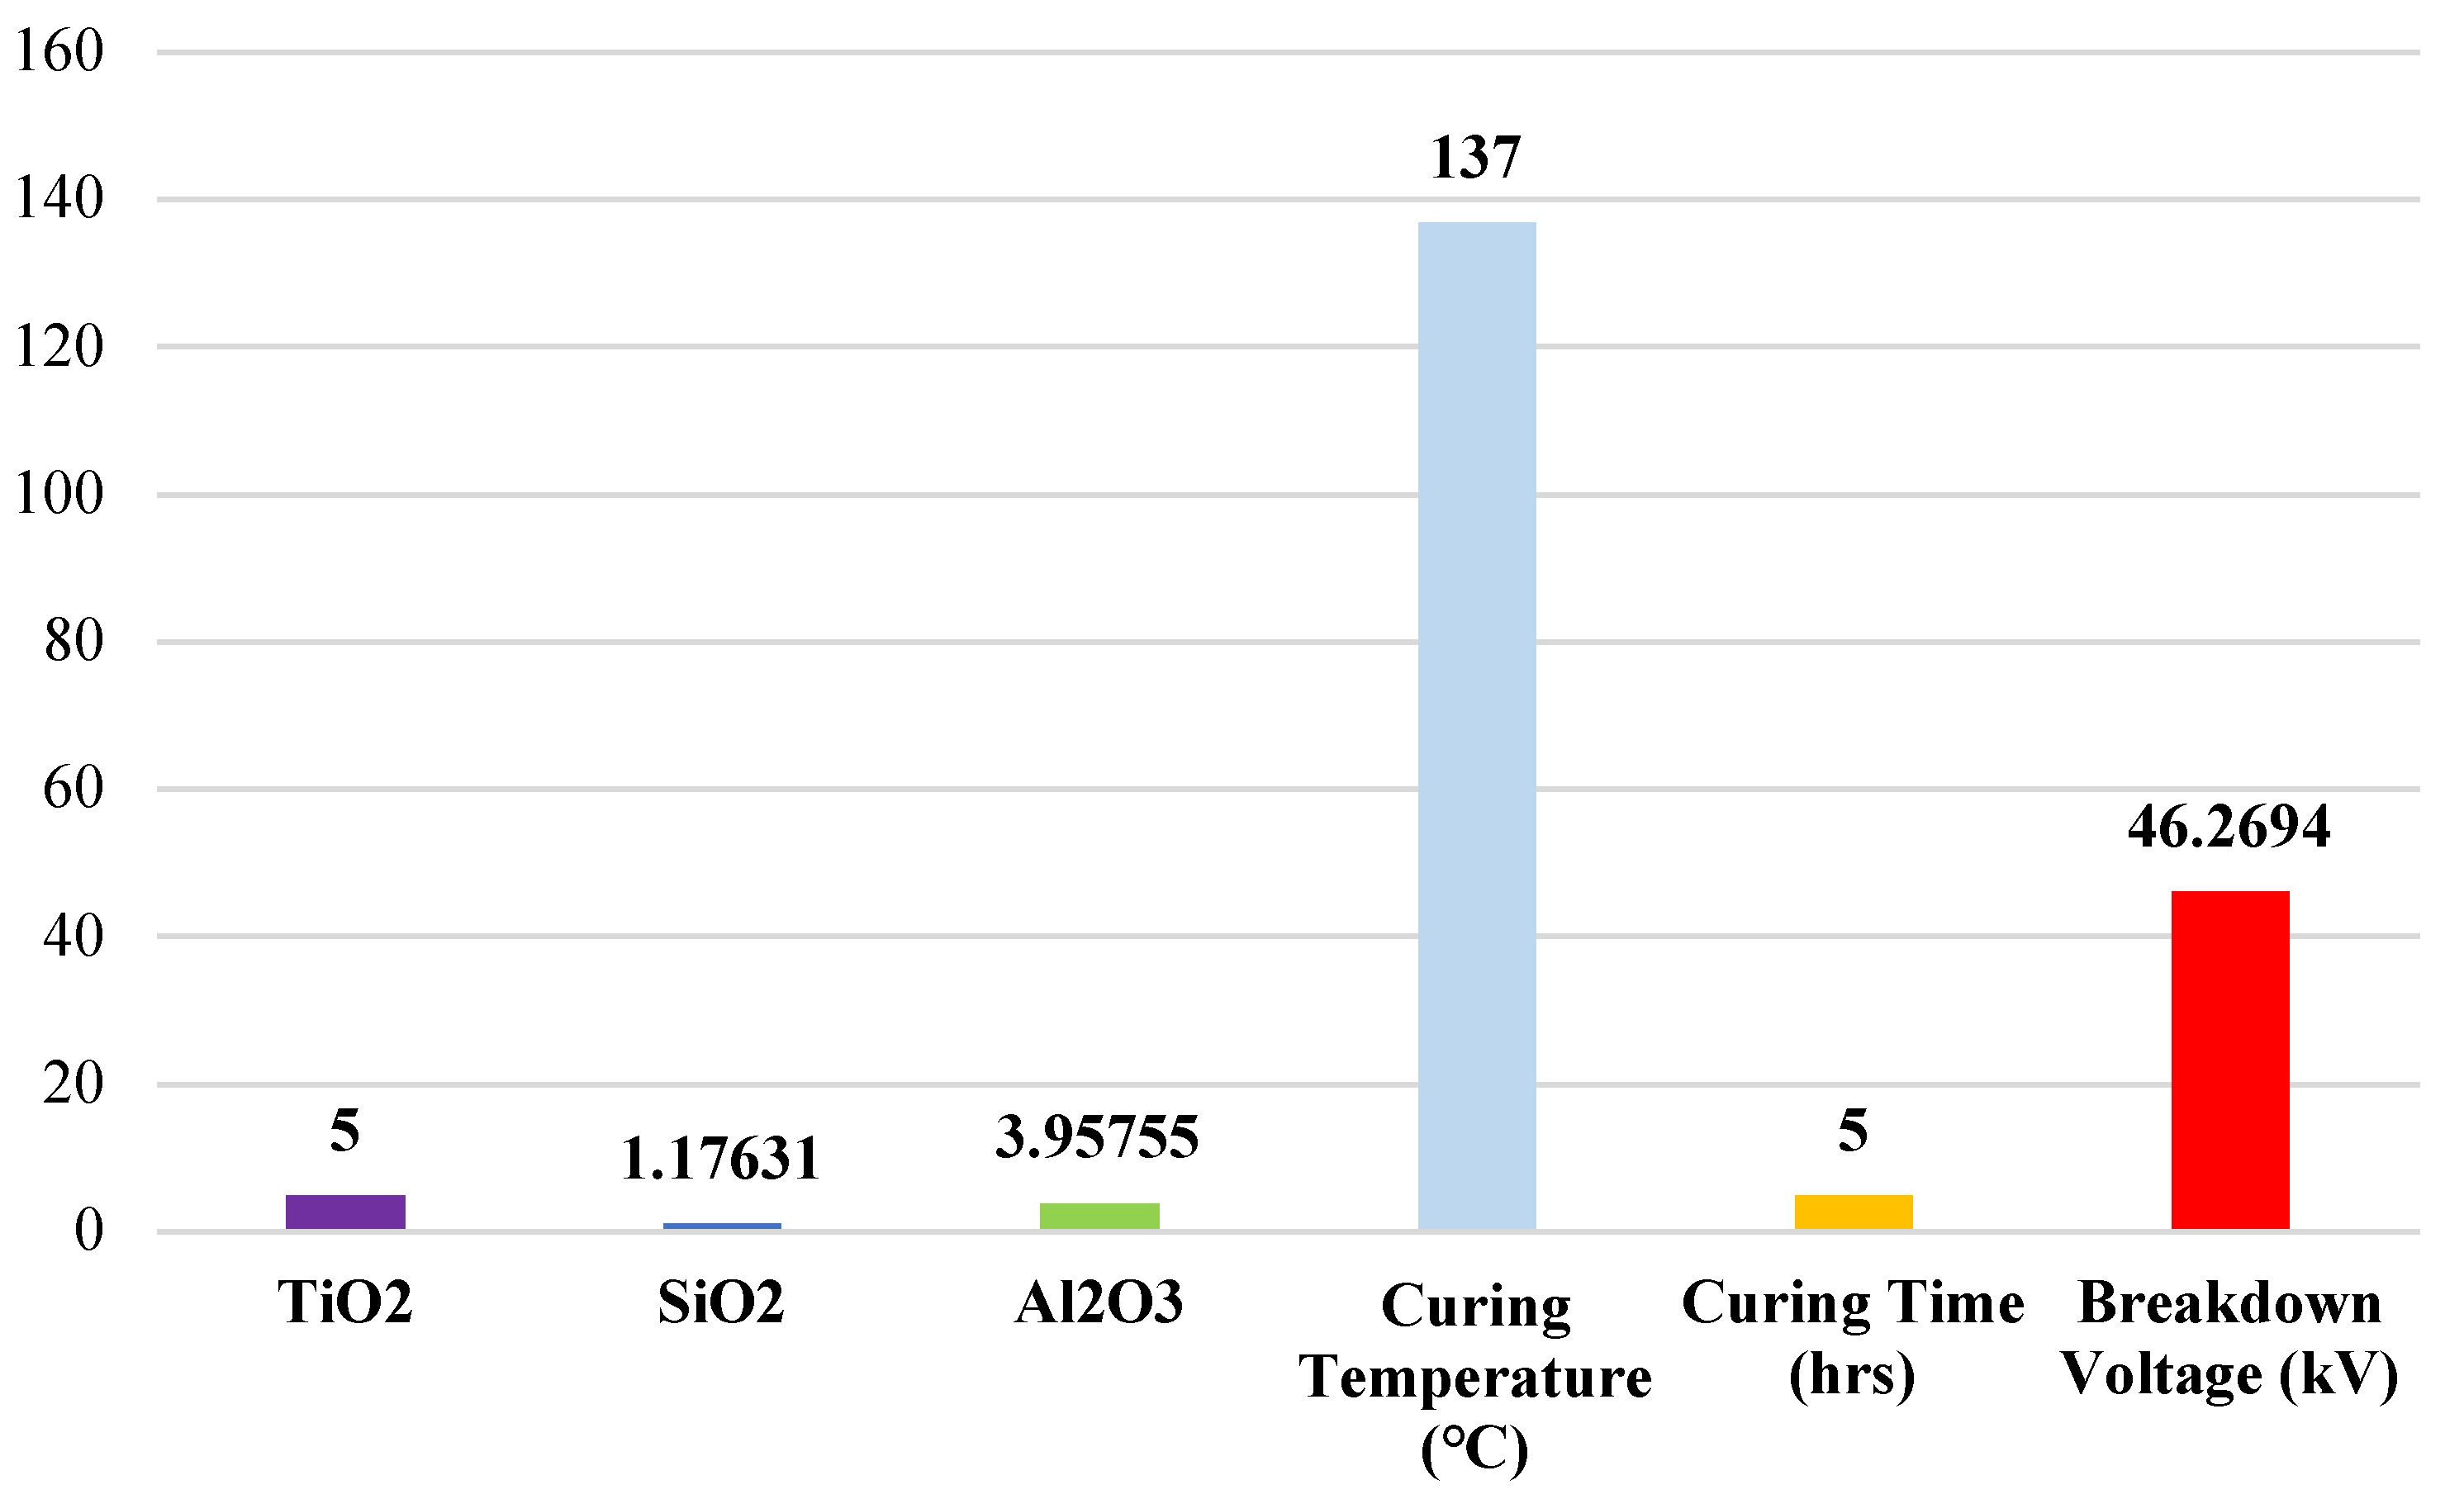
Compositional Detail of Epoxy-Based Nanocomposite Insulator Predicted via SVR
The SVR plays a critical role in this research. As established in our comparative analysis, SVR demonstrated the highest predictive accuracy among the models evaluated. The SVR was trained using a dataset that included various input features. SVR is particularly adept at handling complex, nonlinear relationships within high-dimensional data. SVR implicitly maps the input data into a higher-dimensional feature space where linear separation or regression can be performed. The model then identifies support vectors to make robust predictions and minimize generalization errors. Through this rigorous methodology, the SVR model was able to predict that a BDV of 46.2694 kV can be achieved with a composition of 5% TiO
2, 1.17631% of SiO
2, and 3.95755% of Al
2O
3, as detailed in
Figure 10. This prediction presents a crucial outcome of our work, providing concrete guidance for the development of advanced insulating materials.
5. Experimental Validation of Predicted Nanocomposite
Experimental validation of the predicted nanocomposite material is the final step in this research, by preparing a prototype of the predicted nanocomposite. The aim of this step is to establish the accuracy and reliability of the Support Vector Regression (SVR) technique of machine learning. An epoxy-based nanocomposite insulator will be formulated based on the optimum input features predicted by the SVR model. The prepared prototype of the insulator will then be subjected to breakdown voltage (BDV) testing under controlled laboratory conditions. The experimental value of BDV will be carefully recorded and subsequently compared with the predicted value of BDV by the SVR model. This comparative analysis between the predicted and experimental results will serve as a critical benchmark to evaluate the efficacy and safety of employing machine learning for material selection in enhancing the dielectric characteristics of insulating materials, i.e., epoxy-based nanocomposite insulators.
5.1. Preparation of Predicted Nanocomposite
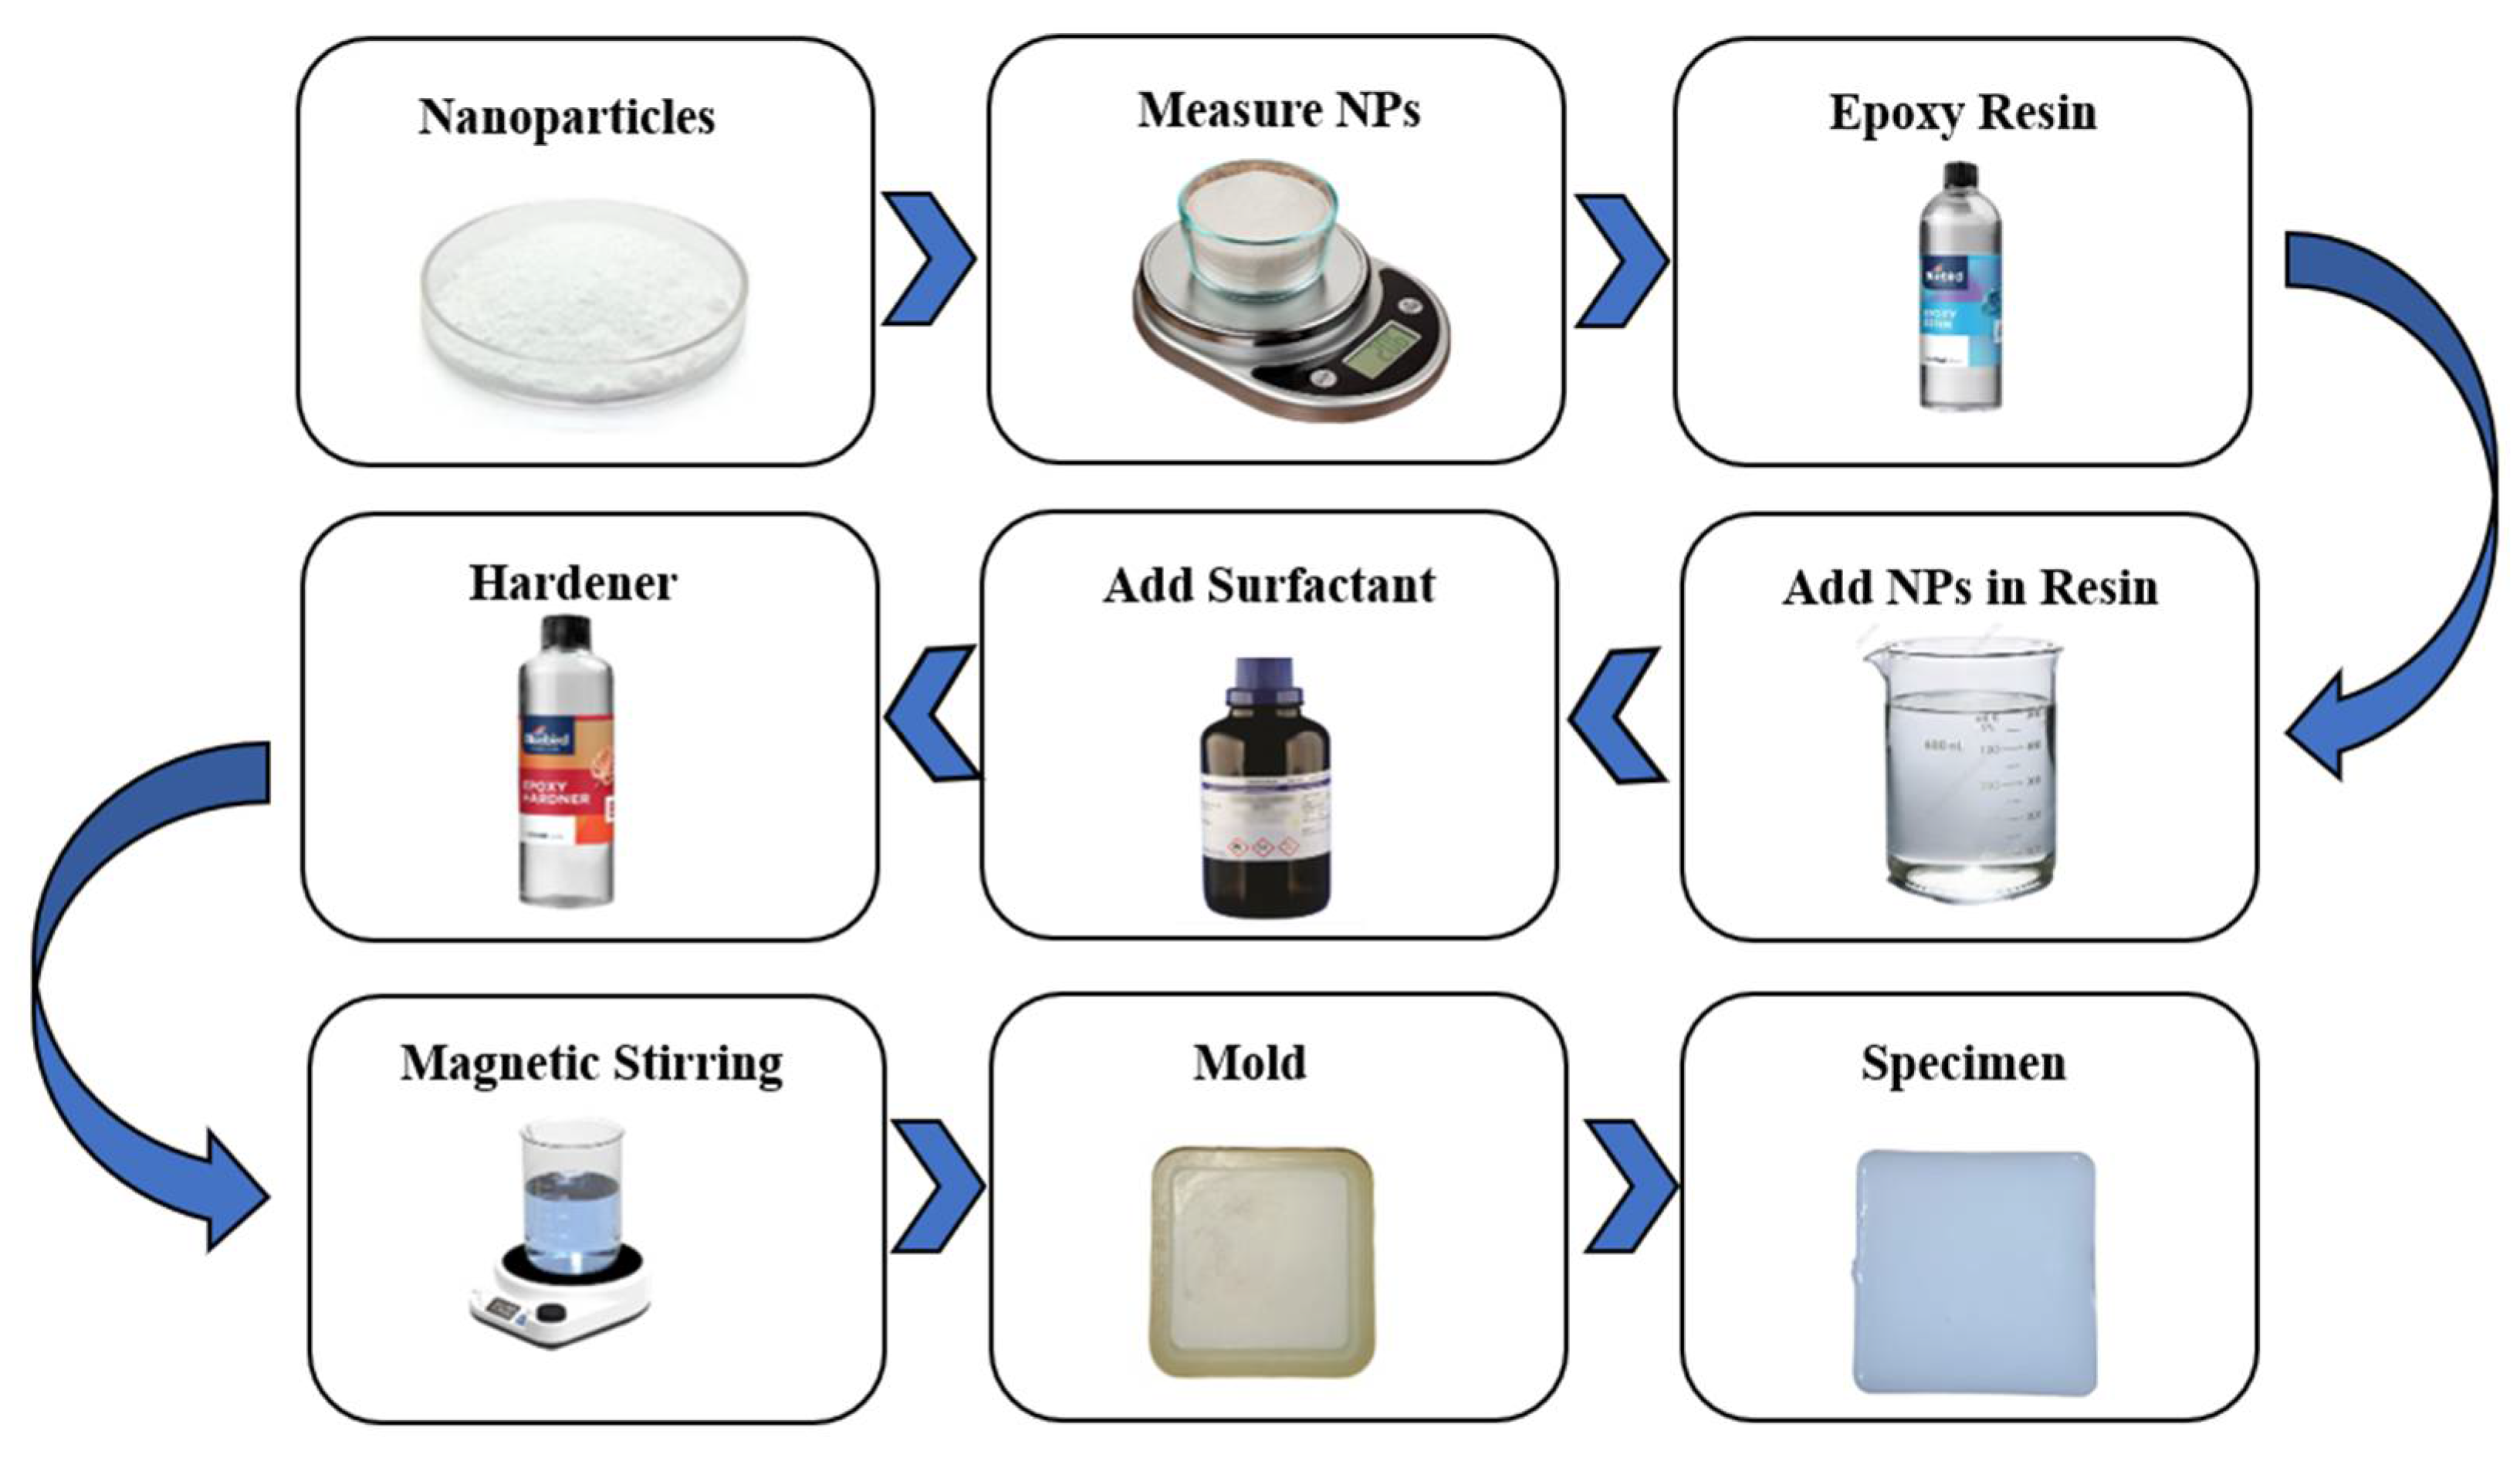
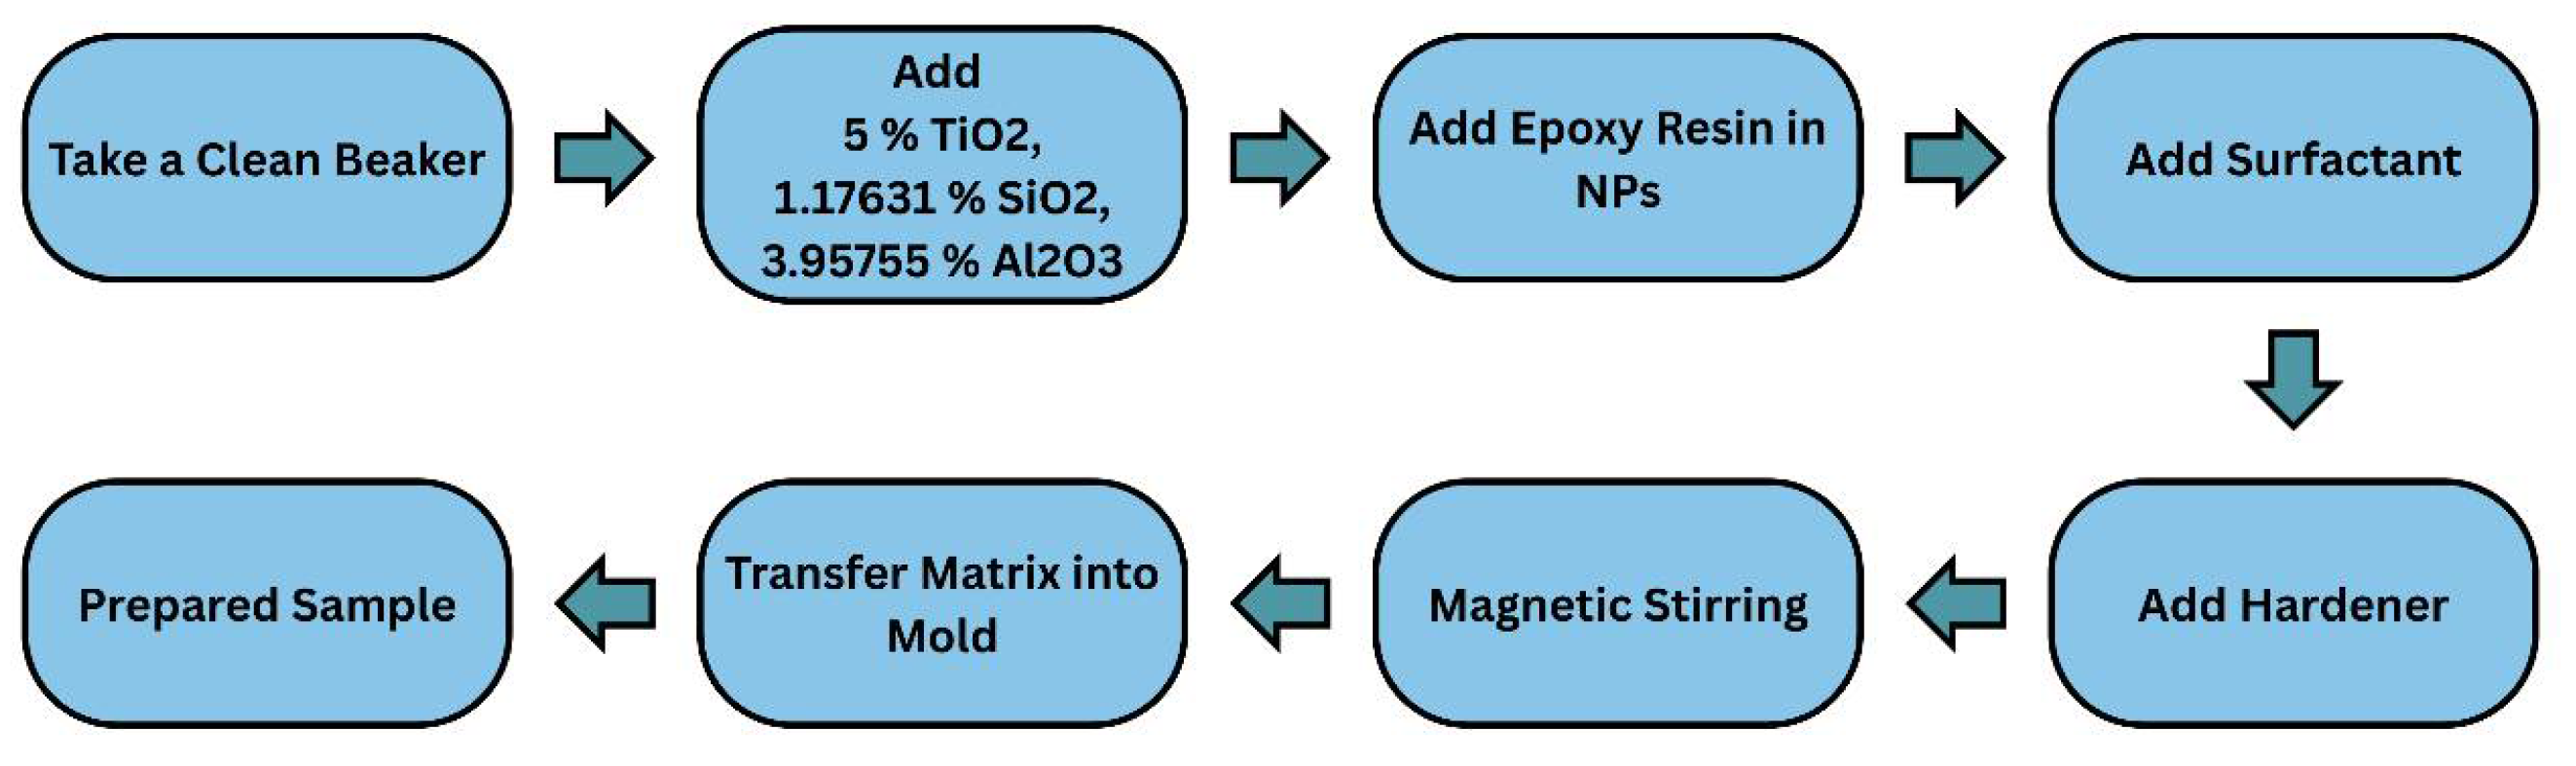
To prepare the predicted specimen of the epoxy-based nanocomposite insulator, the necessary amounts of nanoparticles were measured according to the optimal ratio: TiO
2 (5%), SiO
2 (1.17631%), and Al
2O
3 (3.95755%). Predetermined quantities of nanoparticles were introduced into a cleaned beaker containing the base epoxy resin. The resulting mixture was then subjected to mechanical agitation using a heated magnetic stirrer to ensure homogeneity. To facilitate the uniform dispersion of the inorganic nanoparticles within the organic epoxy matrix and reduce interfacial tension, a controlled volume of the surfactant was incorporated. Following thorough mixing, the curing agent (hardener) was added to initiate the polymerization process. Concurrently, the mold was prepared, and the homogeneous mixture was subsequently cast into it. Finally, the mold containing the mixture was placed in an oven and maintained at a temperature of 137 °C for 5 h to ensure complete cross-linking and solidification of the nanocomposite material.
Figure 11 contains a schematic of the preparation of the predicted nanocomposite.
5.2. Testing of Predicted Nanocomposite
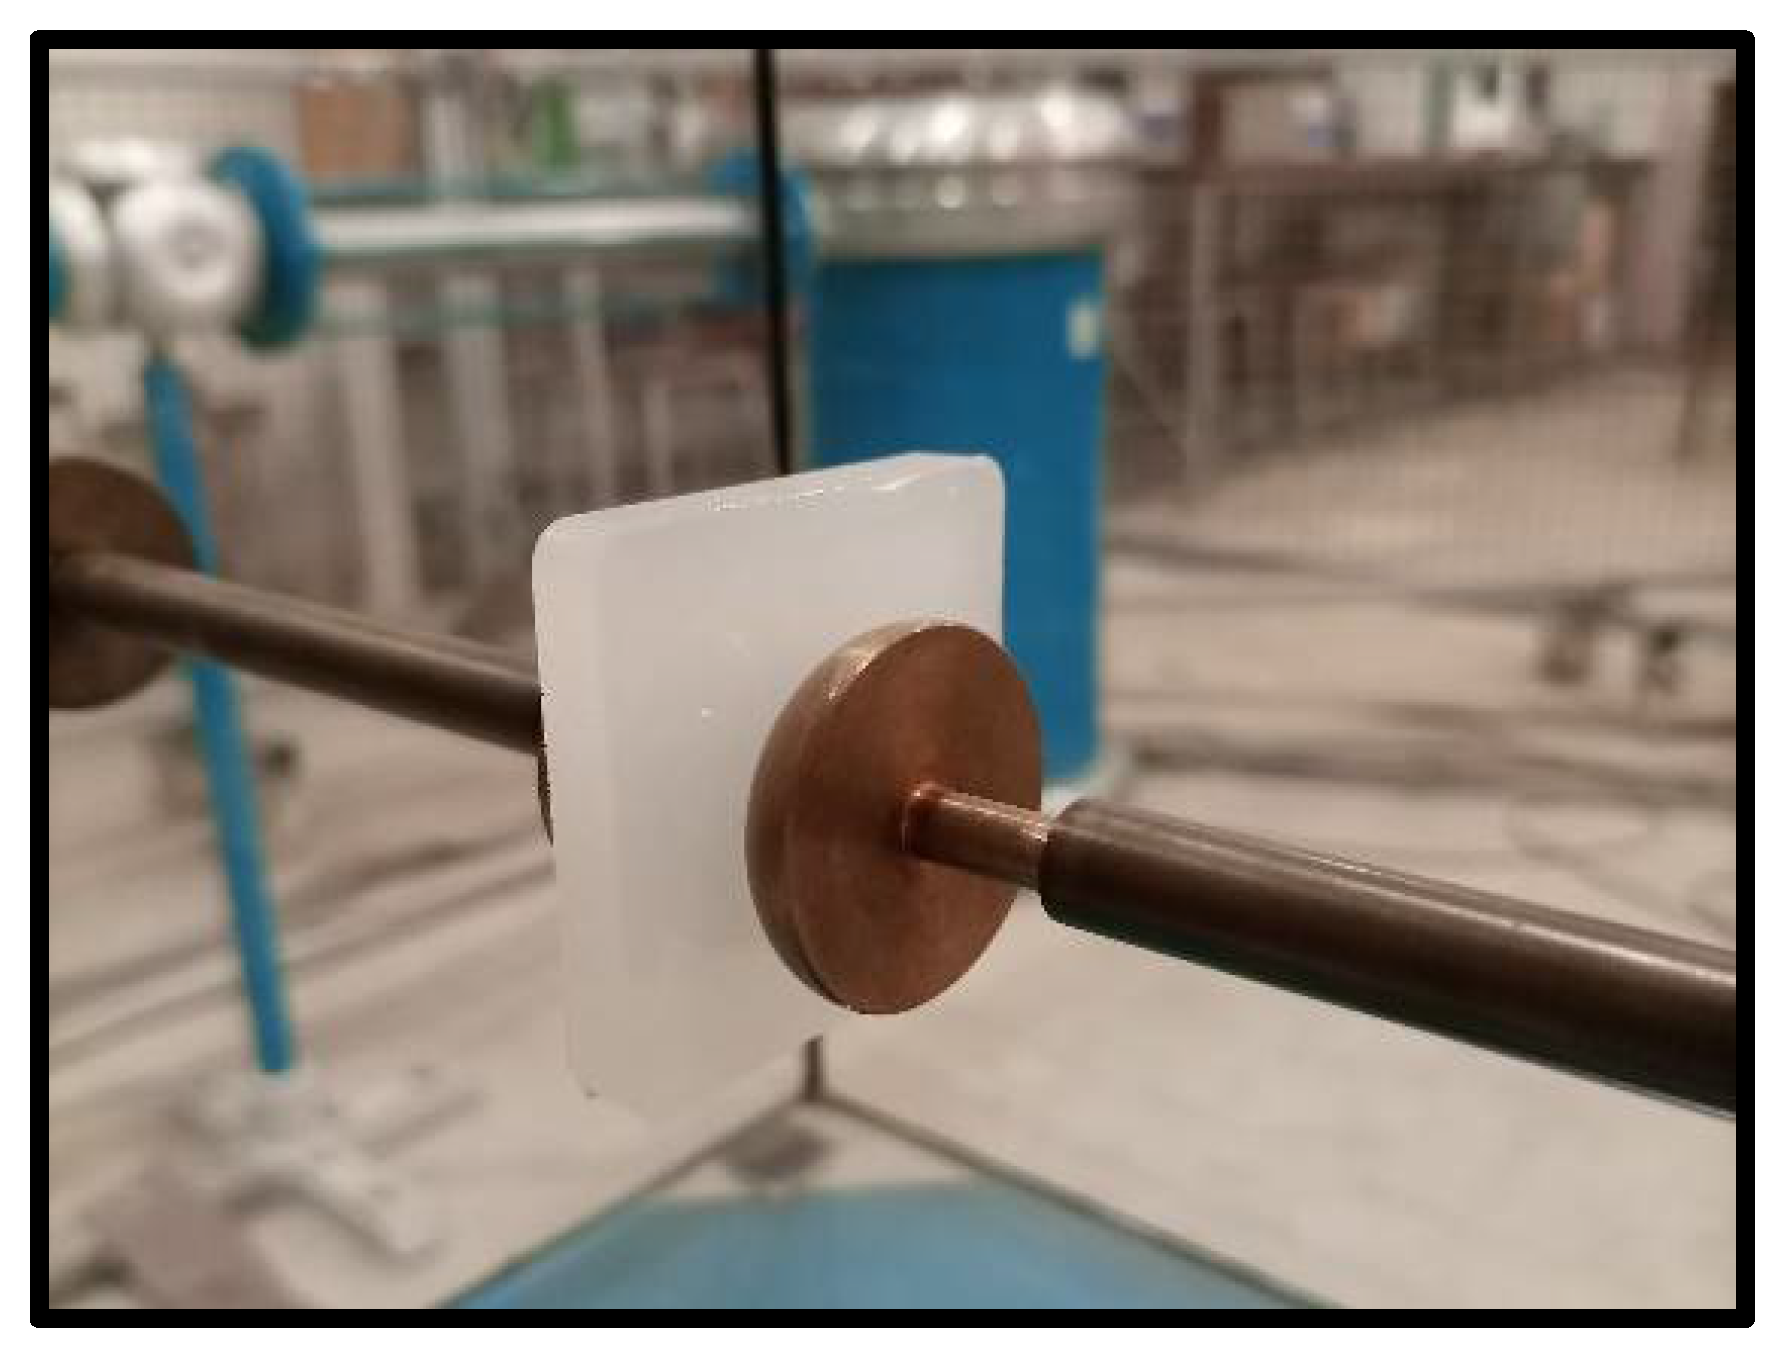
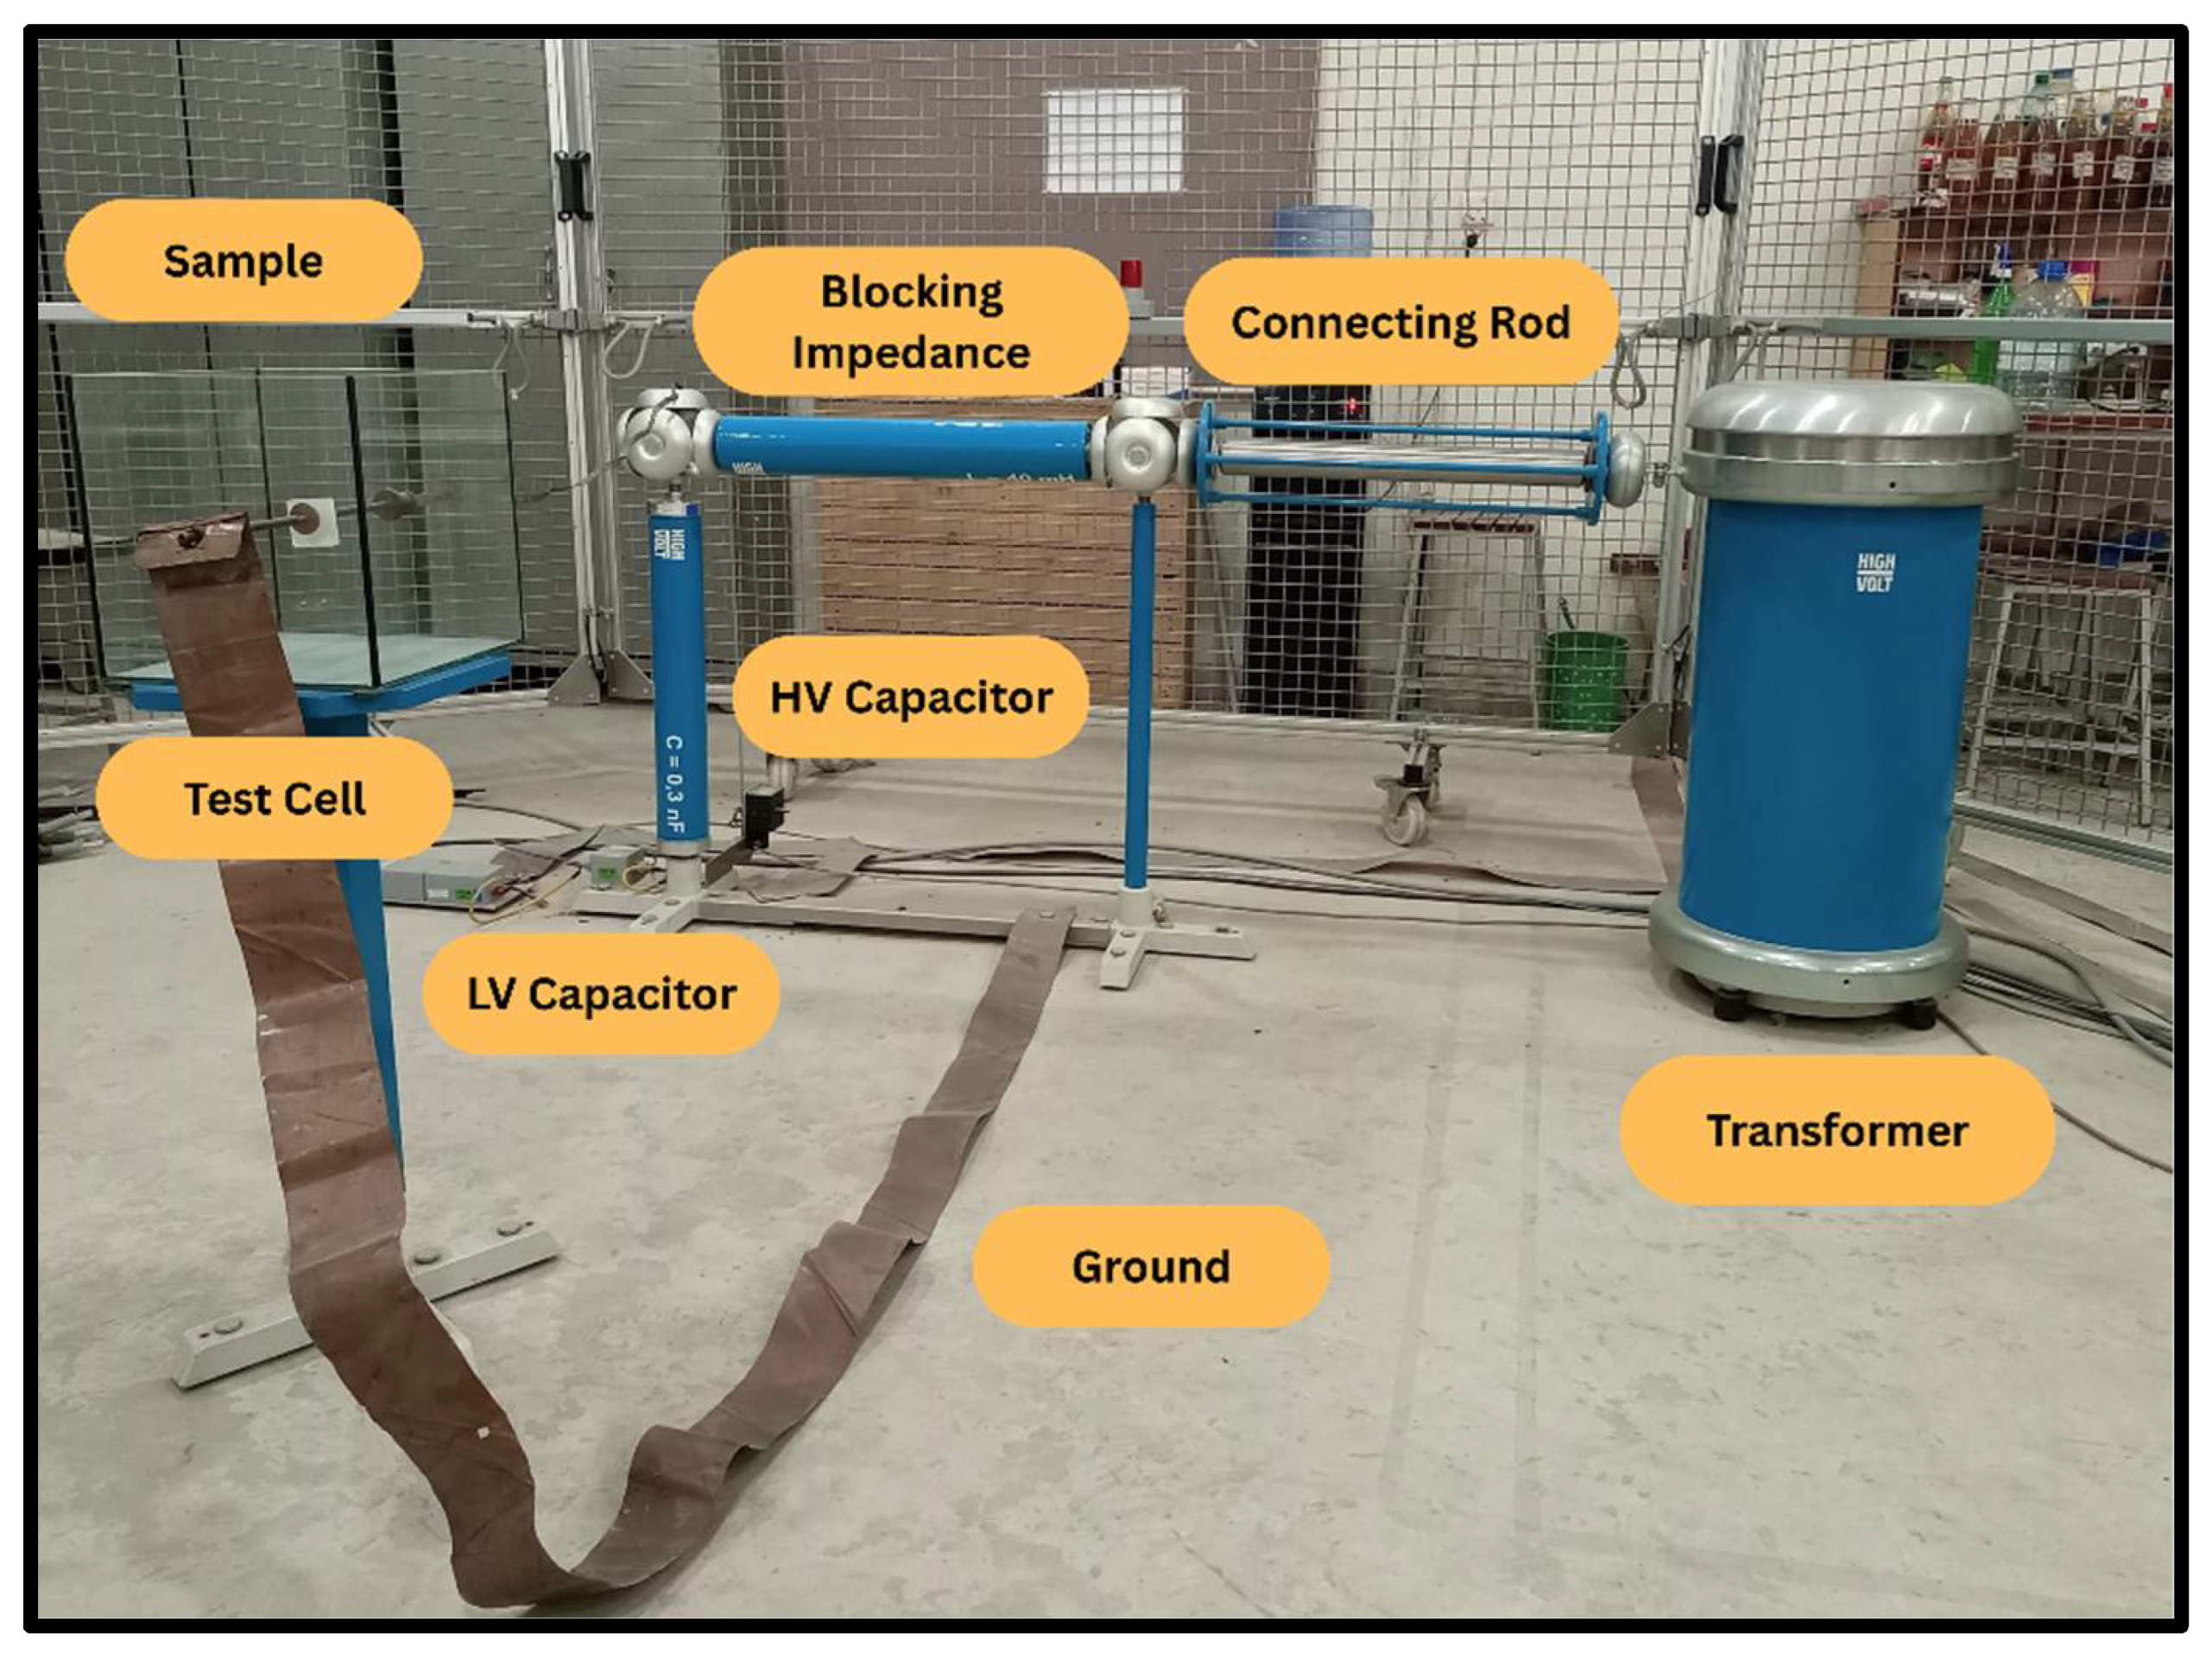
The predicted nanocomposite material was subjected to breakdown voltage (BDV) testing at the High Voltage Laboratory, KFUEIT, Rahim Yar Khan, Punjab, Pakistan. Visual documentation of the insulator during testing is presented in
Figure 12, while the corresponding BDV test setup is depicted in
Figure 13.
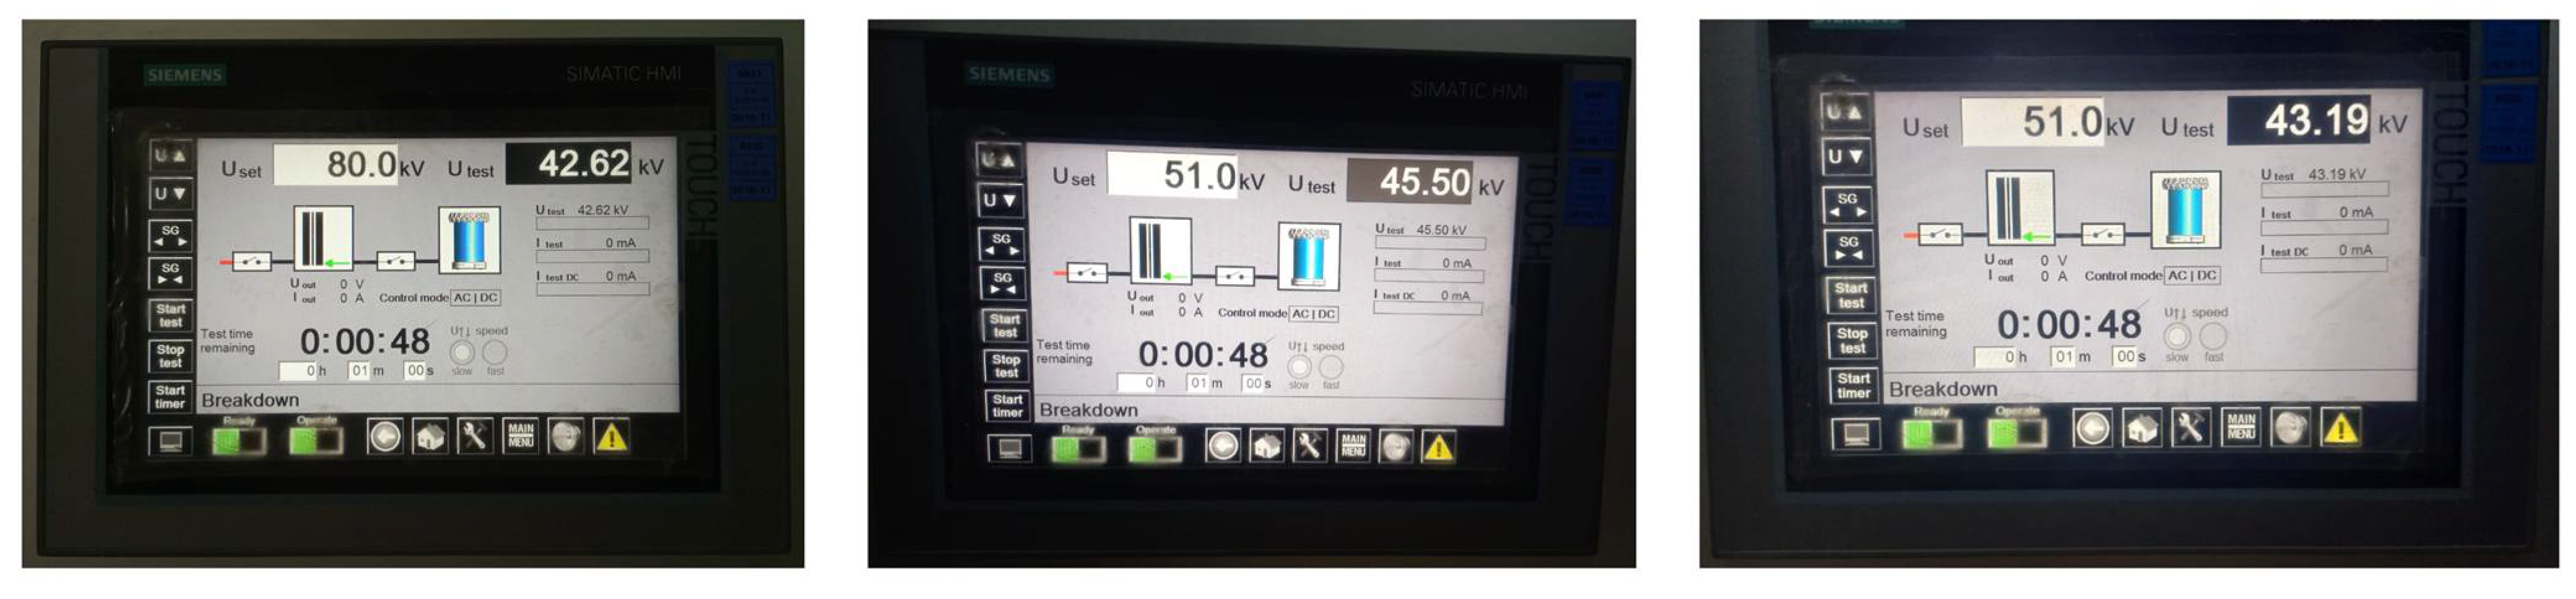
5.3. Results of Predicted Nanocomposite
International Electrotechnical Commission (IEC) standards and recommendations were followed in the experimental procedures used to determine the dielectric strength. Machine learning’s best-performing model (SVR) predicted a breakdown voltage (BDV) of 46.26 kV according to the optimal ratio of NPs (wt%): TiO
2 (5%), SiO
2 (1.17631%), and Al
2O
3 (3.95755%). A total of six experimental measurements were taken according to IEC, the details of which are given in
Table 2, and
Figure 14 shows pictorial evidence of the experimental measurements. As the experimental environmental conditions did not conform to the IEC specifications, a correction factor, detailed below, was applied to mitigate their influence.
In Equations (3) and (4), Vd represents the breakdown voltage (BDV), Vdo represents the breakdown voltage in standard conditions, p represents the air pressure, po represents the air pressure in standard conditions, t represents the surrounding temperature, and to represents the surrounding temperature in standard conditions.
Nevertheless, the average measured BDV was 41.94 kV, as shown in
Table 2. After applying the correction factor to mitigate the effect of environmental conditions, BDV became 44.72. This shows that the expected and measured values deviate by 1.14 kV. The deviation, expressed as a percentage, is roughly 3.32%, as calculated below using Equation (5).
This difference is, though, acceptable as variations in material dispersion, processing conditions, and intrinsic constraints in the experimental setup may be responsible for this disparity, in contrast to the idealized conditions specified in the model. In addition to this, humidity, contamination, and surface roughness may all have a part in the reported decrease in BDV. The experimental findings demonstrate the potential of machine learning methodologies for predictive material selection, particularly in identifying the optimal nanoparticle ratios necessary to achieve maximized dielectric strength in high-voltage epoxy-based nanocomposite insulators.
6. Conclusions
In conclusion, this research successfully demonstrated the efficacy of machine learning, specifically the Support Vector Regression (SVR) model, as a powerful technique for predicting and optimizing nanoparticle concentrations (wt%) to enhance the dielectric properties of epoxy-based nanocomposites for high-voltage insulation. The SVR model, trained on a real-time experimental generated dataset, and with a prediction accuracy of 97.77%, accurately predicted a high breakdown voltage, achievable with a specific nanoparticle composition. SVR predicted a breakdown voltage of 46.26 kV by using 5%, 1.17631%, and 3.95755% of TiO2, SiO2, and Al2O3, respectively. The experimental validation of this prediction, through the fabrication and testing of a prototype insulator with the above-predicted wt% of NPs, corroborated the model’s accuracy and achieved 44.72 kV BDV, highlighting machine learning as a significantly more efficient and less resource-intensive alternative to traditional iterative experimental approaches. The difference of 1.54 kV is reasonable, as the predicted prototype sample may not have the ideal conditions as specified in the ML model. These findings underscore the potential of machine learning to accelerate the development and optimization of advanced insulating materials with tailored dielectric characteristics for high-voltage applications.


 ,
, 

