Article

Optimization of Saponin Extract from Red Sage (Salvia miltiorrhiza) Roots Using Response Surface Methods and Its Antioxidant and Anticancer Activities

1
Faculty of Applied Sciences, Ton Duc Thang University, Ho Chi Minh City 700000, Vietnam
2
Department of Agricultural Chemistry, College of Agriculture and Life Sciences, Institute of Environmentally Friendly Agriculture, Chonnam National University, Gwangju 61186, Republic of Korea
*
Author to whom correspondence should be addressed.
These authors contributed equally to this work.
Processes 2025, 13(7), 2225; https://doi.org/10.3390/pr13072225
Submission received: 7 June 2025 / Revised: 5 July 2025 / Accepted: 10 July 2025 / Published: 11 July 2025
(This article belongs to the Section Separation Processes)

Abstract

Red sage (Salvia miltiorrhiza Bunge) is a perennial herb containing various bioactive compounds that promote human health. In this study, single-factor experiments were first conducted, followed by the optimization of extraction conditions to maximize the saponin content from red sage root extracts. In the single-factor experiments, the highest saponin content (47.5 ± 0.88 mg/g) was obtained using 80% ethanol, a solvent-to-material ratio of 40:1 (mL/g), an extraction period of 3 h, and an extraction temperature of 60 °C. Response Surface Methodology (RSM) was performed to optimize the extraction parameters with a material-to-solvent ratio of 41.31:1 (mL/g), an extraction temperature of 58.08 °C, and an extraction time of 3.16 h. Under these optimized conditions, the experimental saponin content reached 47.71 ± 0.15 mg/g. Additionally, crude extract of red sage exhibited antioxidant activity against 2,2-diphenyl-1-picrylhydrazyl (DPPH) radicals with an IC50 value of 16.24 µg/mL. This extract also demonstrated anticancer against 61.79 ± 3.57% HepG2 cancer cells at a concentration of 100 µg/mL.

1. Introduction

Oxidative stress is a common pathological mechanism underlying various chronic diseases, including cancer and cardiovascular disorders, and has drawn increasing interest in natural antioxidant strategies such as the use of plant-based compounds [1]. In spite of the wide use of synthetic antioxidants such as butylated hydroxyanisole and butylated hydroxytoluene, there are concerns about their long-term safety and carcinogenicity. In response to this, natural alternatives have gained interest [2,3].
Plant-derived saponins present a promising avenue for both research and commercial applications due to their exceptional physicochemical and biological properties. Their natural origin makes them eco-friendly, biodegradable, and non-toxic, which is of paramount importance from environmental and health perspectives [4]. In recent years, the extraction of saponins from medicinal plants has gained increasing attention as a promising approach to obtaining bioactive compounds for pharmaceutical applications [5]. In particular, extracts enriched in saponins from medicinal plants are being explored as multifunctional agents with antioxidant, anti-inflammatory, hepatoprotective, antimicrobial, and immunomodulatory properties [6,7]. They have also been proposed as promising lead compounds for the development of functional foods or botanical-based pharmaceuticals. They are particularly effective in liver cancer models like the HepG2 cell line, where they induce apoptosis and reduce oxidative stress. The HepG2 cell line is frequently used in anticancer and hepatotoxicity screening due to its well-characterized genomic profile and stable phenotype, making it a reliable in vitro model for evaluating the bioactivity of natural compounds [8].
Salvia miltiorrhiza (red sage or Dan Sam) is a traditional Chinese medicinal plant commonly used for cardiovascular treatment [9]. S. miltiorrhiza contains several natural metabolites, which have been systematically characterized. These include phenolic acids (salvianic acid, rosmarinic acid, salvianolic acid A, salvianolic acid B), lipophilic diterpenes (tanshinone I, tanshinone IIA, tanshinone IIB, tanshinone VI, dihydrotanshinone I, cryptotanshinone, tetrahydrotanshinone), and triterpenoid saponins (ursolic acid) [10]. These compounds have demonstrated significant pharmacological effects relevant to human health [11]. For instance, ursolic acid saponins have been specifically identified for their antioxidant, anti-inflammatory, and anticancer properties [12,13]. Similarly, tanshinone IIA, a major lipophilic compound, promotes cell death by thiol depletion, mitochondrial disruption, and ROS generation [14]. Ethanol and acetone extracts of S. miltiorrhiza roots further confirm time- and dose-dependent cytotoxicity and apoptotic effects in HepG2 cells, as shown by increased LDH leakage and reduced ATP levels [15].
However, the efficient extraction of saponins remains challenging, as yield and reproducibility depend on multiple interacting variables including solvent polarity, extraction temperature, solid–liquid ratio, and duration. Response Surface Methodology (RSM) is a useful multivariate statistical method that has been proven to work well for studying complex extraction processes. RSM enhances the precision of predictions and facilitates the identification of optimal conditions. This is achieved by systematically examining the individual and interactive effects of multiple factors, thereby significantly reducing the number of experiments required [16].
Previous studies have successfully applied RSM to optimize the extraction of saponins from other medicinal plants such as Panax notoginseng [17] and Camellia sinensis [18], demonstrating its suitability for saponin-rich systems. However, to the best of our knowledge, no prior study has optimized the extraction of saponins from S. miltiorrhiza using RSM. This represents a novel and practical research direction that can contribute to significantly advancing the recovery methods for saponin extraction.
Therefore, this study was carried out with three main goals: (i) to first explore the effects of different extraction factors on the total saponin content of Salvia miltiorrhiza roots using single-factor experiments; (ii) to optimize the extraction process by applying the Box–Behnken Design (BBD) through RSM; and (iii) to test the biological activities of the optimized extract, including its antioxidant ability using the 2,2-diphenyl-1-picrylhydrazyl (DPPH) radical scavenging test and its cytotoxic effects on HepG2 liver cancer cells.

2. Materials and Methods

2.1. Chemicals

Methanol (MeOH, 99.5%), acetone (99.5%), ethanol (EtOH, 99.5%), Ethyl acetate (EtOAc, 99.5%), oleanolic acid (97%), and 2,2-Diphenyl-1-picrylhydrazyl (DPPH) were obtained from Sigma-Aldrich (Singapore). Acetic acid (96%), vanillin, and perchloric acid (70%) were purchased from Merck (Darmstadt, Germany).

2.2. Plant Samples

Red sage (Salvia miltiorrhiza) root powder was acquired from Thanh Binh Herb Co., Ltd. Company (Ho Chi Minh City, Vietnam). The powder was dried to obtain constant weight, with a moisture concentration of 9.28 ± 0.07%, and stored at room temperature for further experiments.

2.3. Effect of Solvent Extraction on Saponin Concentration

To examine the influence of solvents on the saponin extraction from S. miltiorrhiza roots, an aliquot of 50 mL each of five different solvents with different polarity, including 70% MeOH, 70% EtOH, 70% acetone, 70% EtOAc, and distilled water (DW), were mixed with 5 g of plant material at 60 °C for 3 h [19,20]. The extraction layers were collected through filtration and dried by a rotary evaporator (N-1110, EYELA Co., Tokyo, Japan) at 45 °C for TSC determination.

2.4. Single-Factor Effectes on Saponin Concentration

Prior to RSM, preliminary experiments were conducted to establish appropriate ranges for independent variables. Individual effects of the solvent concentrations (50, 60, 70, 80, and 90%), solvent-to-material ratios (10:1, 20:1, 30:1, 40:1, and 50:1 mL/g), extraction temperatures (40, 50, 60, and 70 °C), and extraction times (2, 2.5, 3, 3.5 and 4 h) were systematically evaluated based on total saponin content.

2.5. Experiment Design and Optimization

The extraction of saponins was optimized using the Box–Behnken model—RSM including material-to-solvent ratio (A), temperature (B), and time (C). The variables with actual levels in the Box–Behnken model are shown in Table 1. The extract layers of each run were collected and determined TSC using the following equation:
Y = β0 + β1A + β2B + β3C + β12AB + β13AC + β23BC + β11A2 + β22B2 + β33C2
where Y represents the TSC, material-to-solvent ratio, while A, B and C are ethanol-to-material ratio, temperature, and time, respectively; β0 is a constant. The linear effects of the variables are represented by coefficients β1, β2, and β3. Quadratic effects are accounted for by coefficients β11, β22, and β33, and interaction effects between variables are captured by coefficients β12, β13, and β23. The regression analysis and analysis of variance (ANOVA) were carried out using Design Expert 13 (Stat-Ease, Minneapolis, MN, USA) to determine the model coefficients, establish the empirical model, and subsequently predict the optimal extraction conditions for maximizing TSC.

2.6. Total Saponin Content Determination

The standard curve of saponins was established following previous studies [20,21], with slight modification. Oleanolic acid (97%) was used as standard in the quantitative determination of the content of saponin. Five solutions of oleanolic acid with concentrations of 50, 100, 200, 250, and 300 µg/mL in ethanol were mixed with vanillin–acetic acid solution (5% w/v) and perchloric acid. The mixtures were subsequently incubated for 15 min at 60 °C in a water bath. When the solutions were cooled, a 5 mL aliquot of acetic acid was added. The absorbance of each sample was obtained at 548 nm using a UV-Vis spectrophotometer (Jenway-6705, Staffordshire, UK). The regression equation of the oleanolic acid calibration curve was determined as y = 0.0058x − 0.0602 (R2 = 0.9948). The total saponin content was calculated as milligrams OAE per gram dried leaf sample (mg OAE/g).

2.7. Antioxidant Activity

The DPPH radical scavenging activity of the extracts was assessed using a slightly modified version of a previous method [19]. An aliquot of 2 mL of 0.1 mM DPPH solution was mixed with 2.5 mL of the extract at several concentrations (4–20 µg/mL). The resulting mixtures were then incubated in the dark for 30 min. Absorbance measurements were taken at 517 nm using a UV/VIS spectrophotometer (Jenway-6705, Staffordshire, UK). The percentage inhibition of the DPPH radical was calculated using the following equation:
I % = 1 A 1 A 0 × 100
where A0 represents the absorbance of DPPH and ethanol, and A1 demotes the absorbance of mixture of DPPH and extract. The inhibitory concentration at 50% (IC50) was subsequently determined by plotting the DPPH scavenging activity against the sample concentration.

2.8. Anticancer Activity

The anticancer activity of crude extract from red sage roots was determined by sulforhodamine B assay using HepG2 cells, following a previous study [22]. HepG2 cells (HB-8065) purchased from ATCC (Manassas, Rockville, ML, USA) were treated with the extract at a concentration of 100 µg/mL for 48 h in 96-well plates, and then the growth inhibition was measured with the formula I%  =  (1 − [ODt/ODc] × 100)%, where ODt represents the optical density of the test sample and ODc represents the optical density of the control sample. Camptothecin (Calbiochem) was used as a positive control in this assay.

2.9. Statistical Analysis

Experimental data were expressed as means ± standard error and analyzed using one-way ANOVA followed by Duncan’s test, with statistical significance defined at p ≤ 0.05. The data from the single-factor effect study, DPPH radical scavenging activity assay, and anticancer activity assay were analyzed separately using the statistical software SPSS (version 23.0, SPSS Inc., Chicago, IL, USA). The RSM-BBD model was analyzed by Design-Expert 13 (Stat-Ease, Minneapolis, MN, USA).

3. Results and Discussion

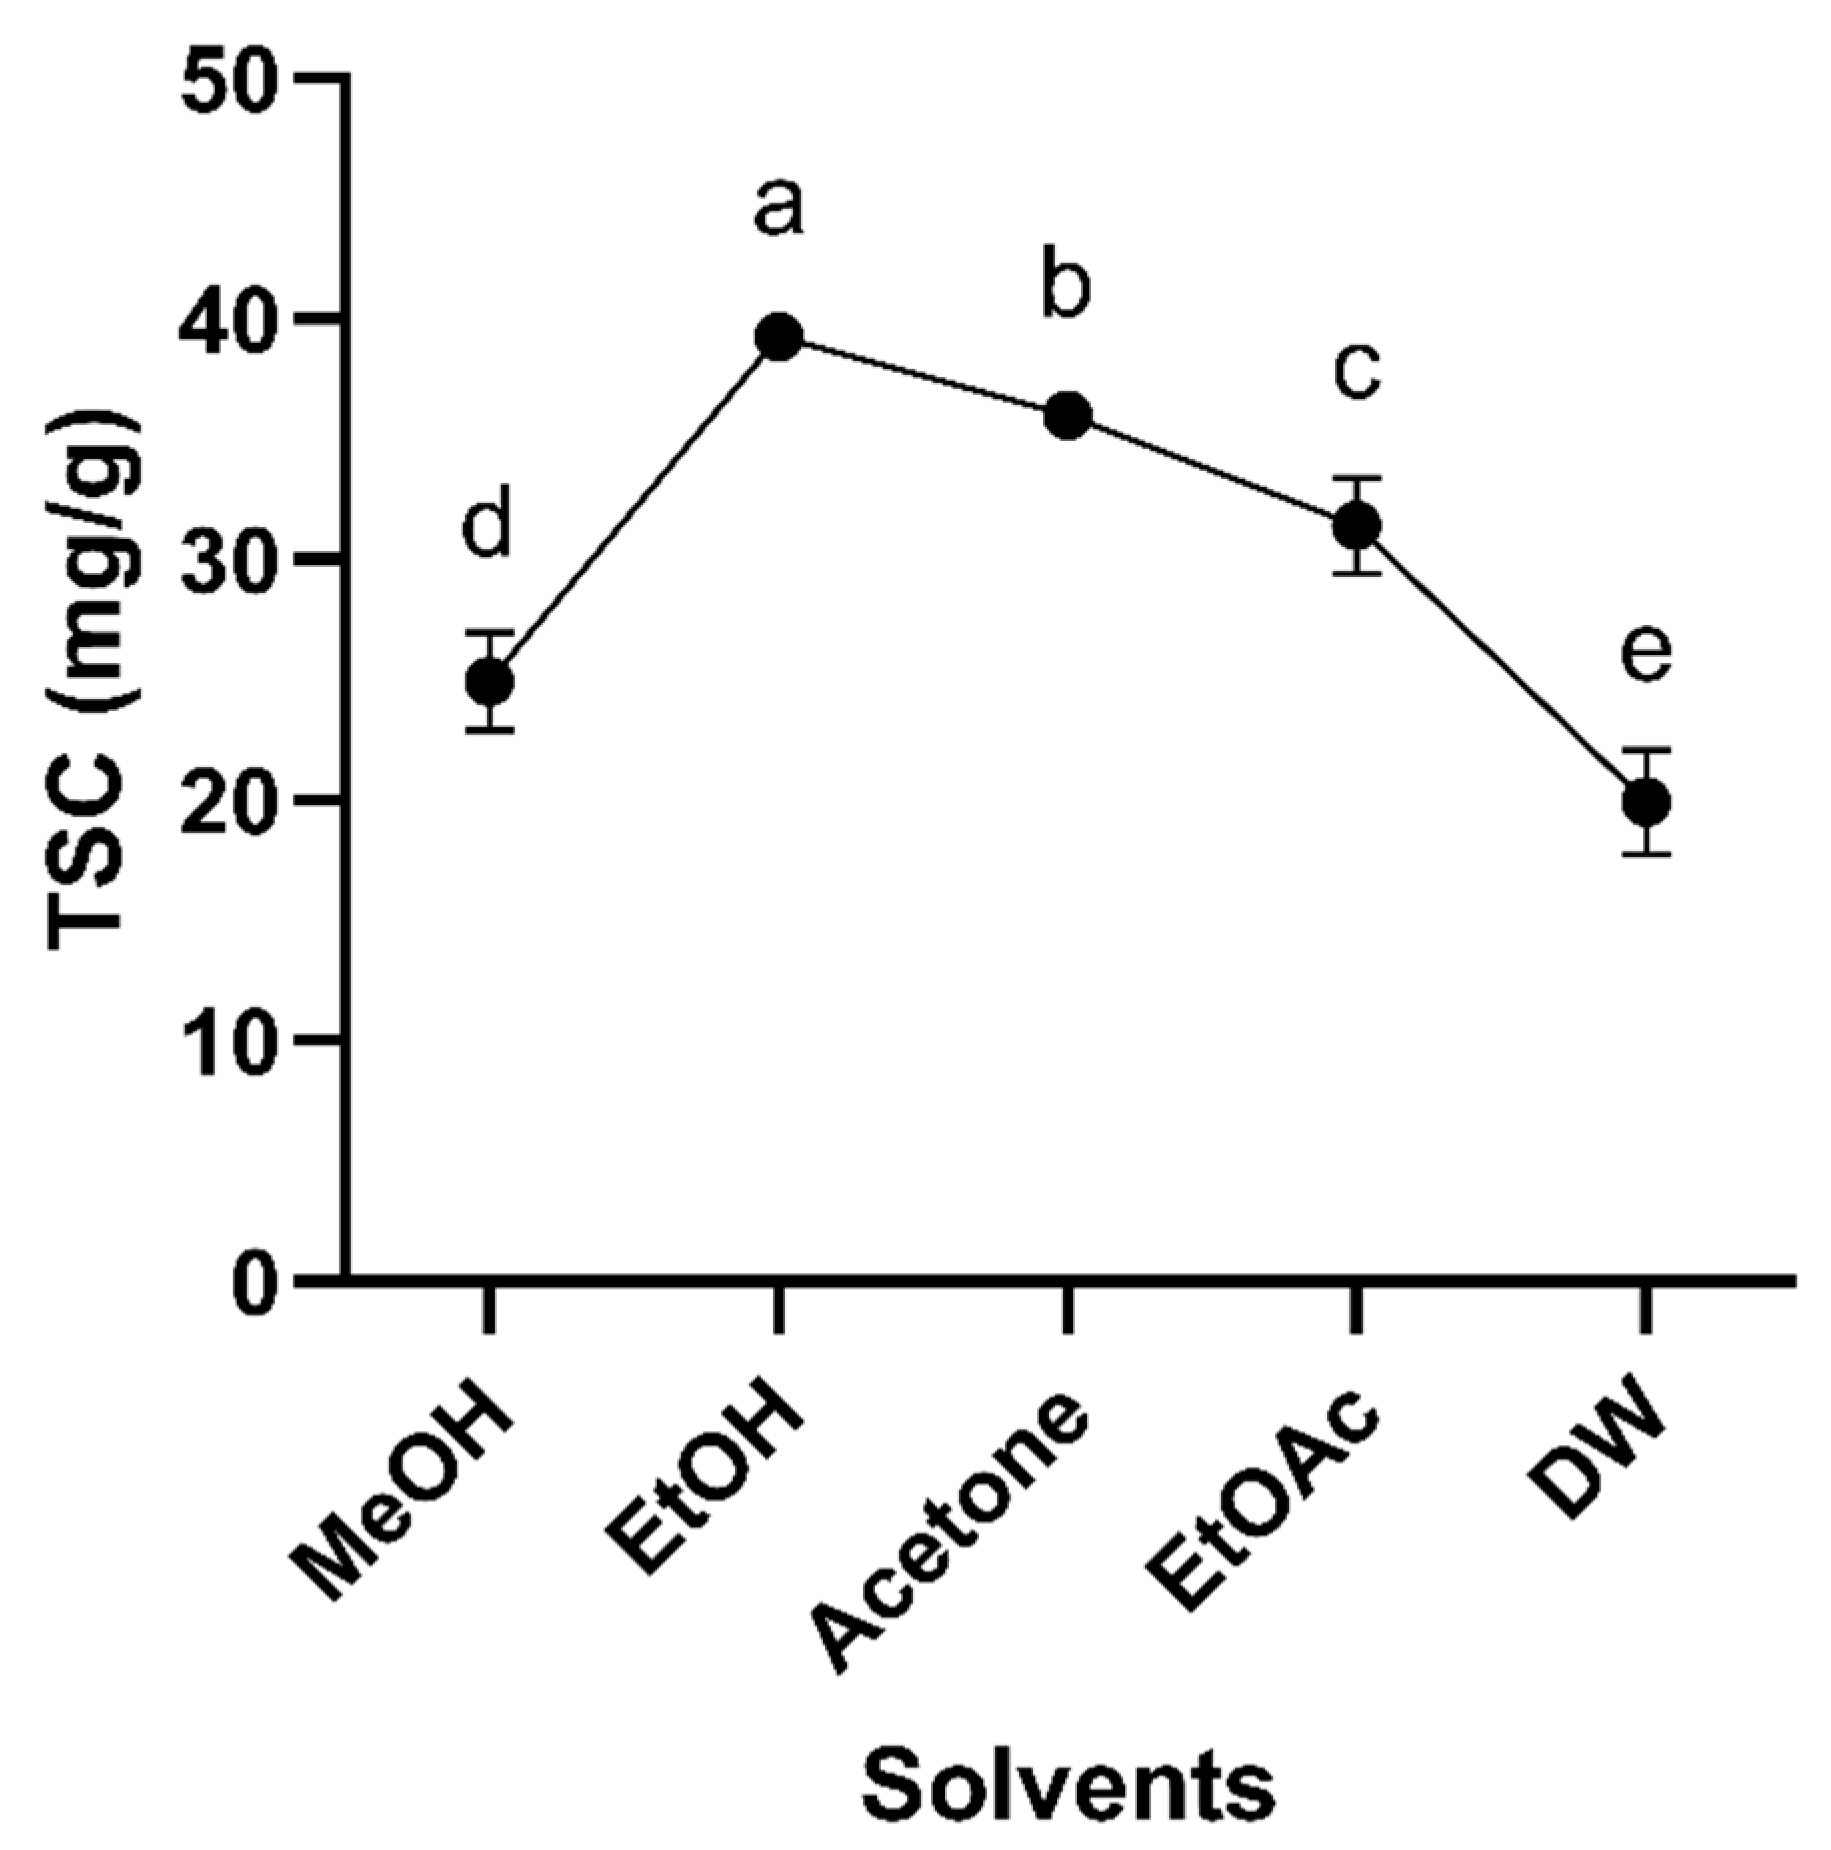
3.1. Solvent Screening

A total of five different solvents, including EtOH 70%, MeOH 70%, acetone 70%, EtOAc 70%, and DW, were investigated for their effect on total saponin concentration extracted from red sage roots (Figure 1). EtOH effectively extracted the highest saponin component from red sage, followed by acetone with TSC, at 39.26 and 35.99 mg/g, respectively. DW exhibited the lowest effect on the extraction of saponins with TSC, at 19.95 mg/g. EtOAc and MeOH moderately extracted saponins with TSC, at levels of 31.43 and 24.92 mg/g, respectively. Also, several previous studies have used EtOH for total saponin extraction optimization due to its environmentally friendly property. Therefore, EtOH was chosen for extracting saponin. These findings align with previous research on Saponaria cypria roots, where acetone extraction resulted in the highest TSC (169.00 mg oleanolic acid equivalents/g crude extract), surpassing ethanol (106.21 mg/g) and methanol (64.33 mg/g) extractions [23].

3.2. Single Factor Experiments

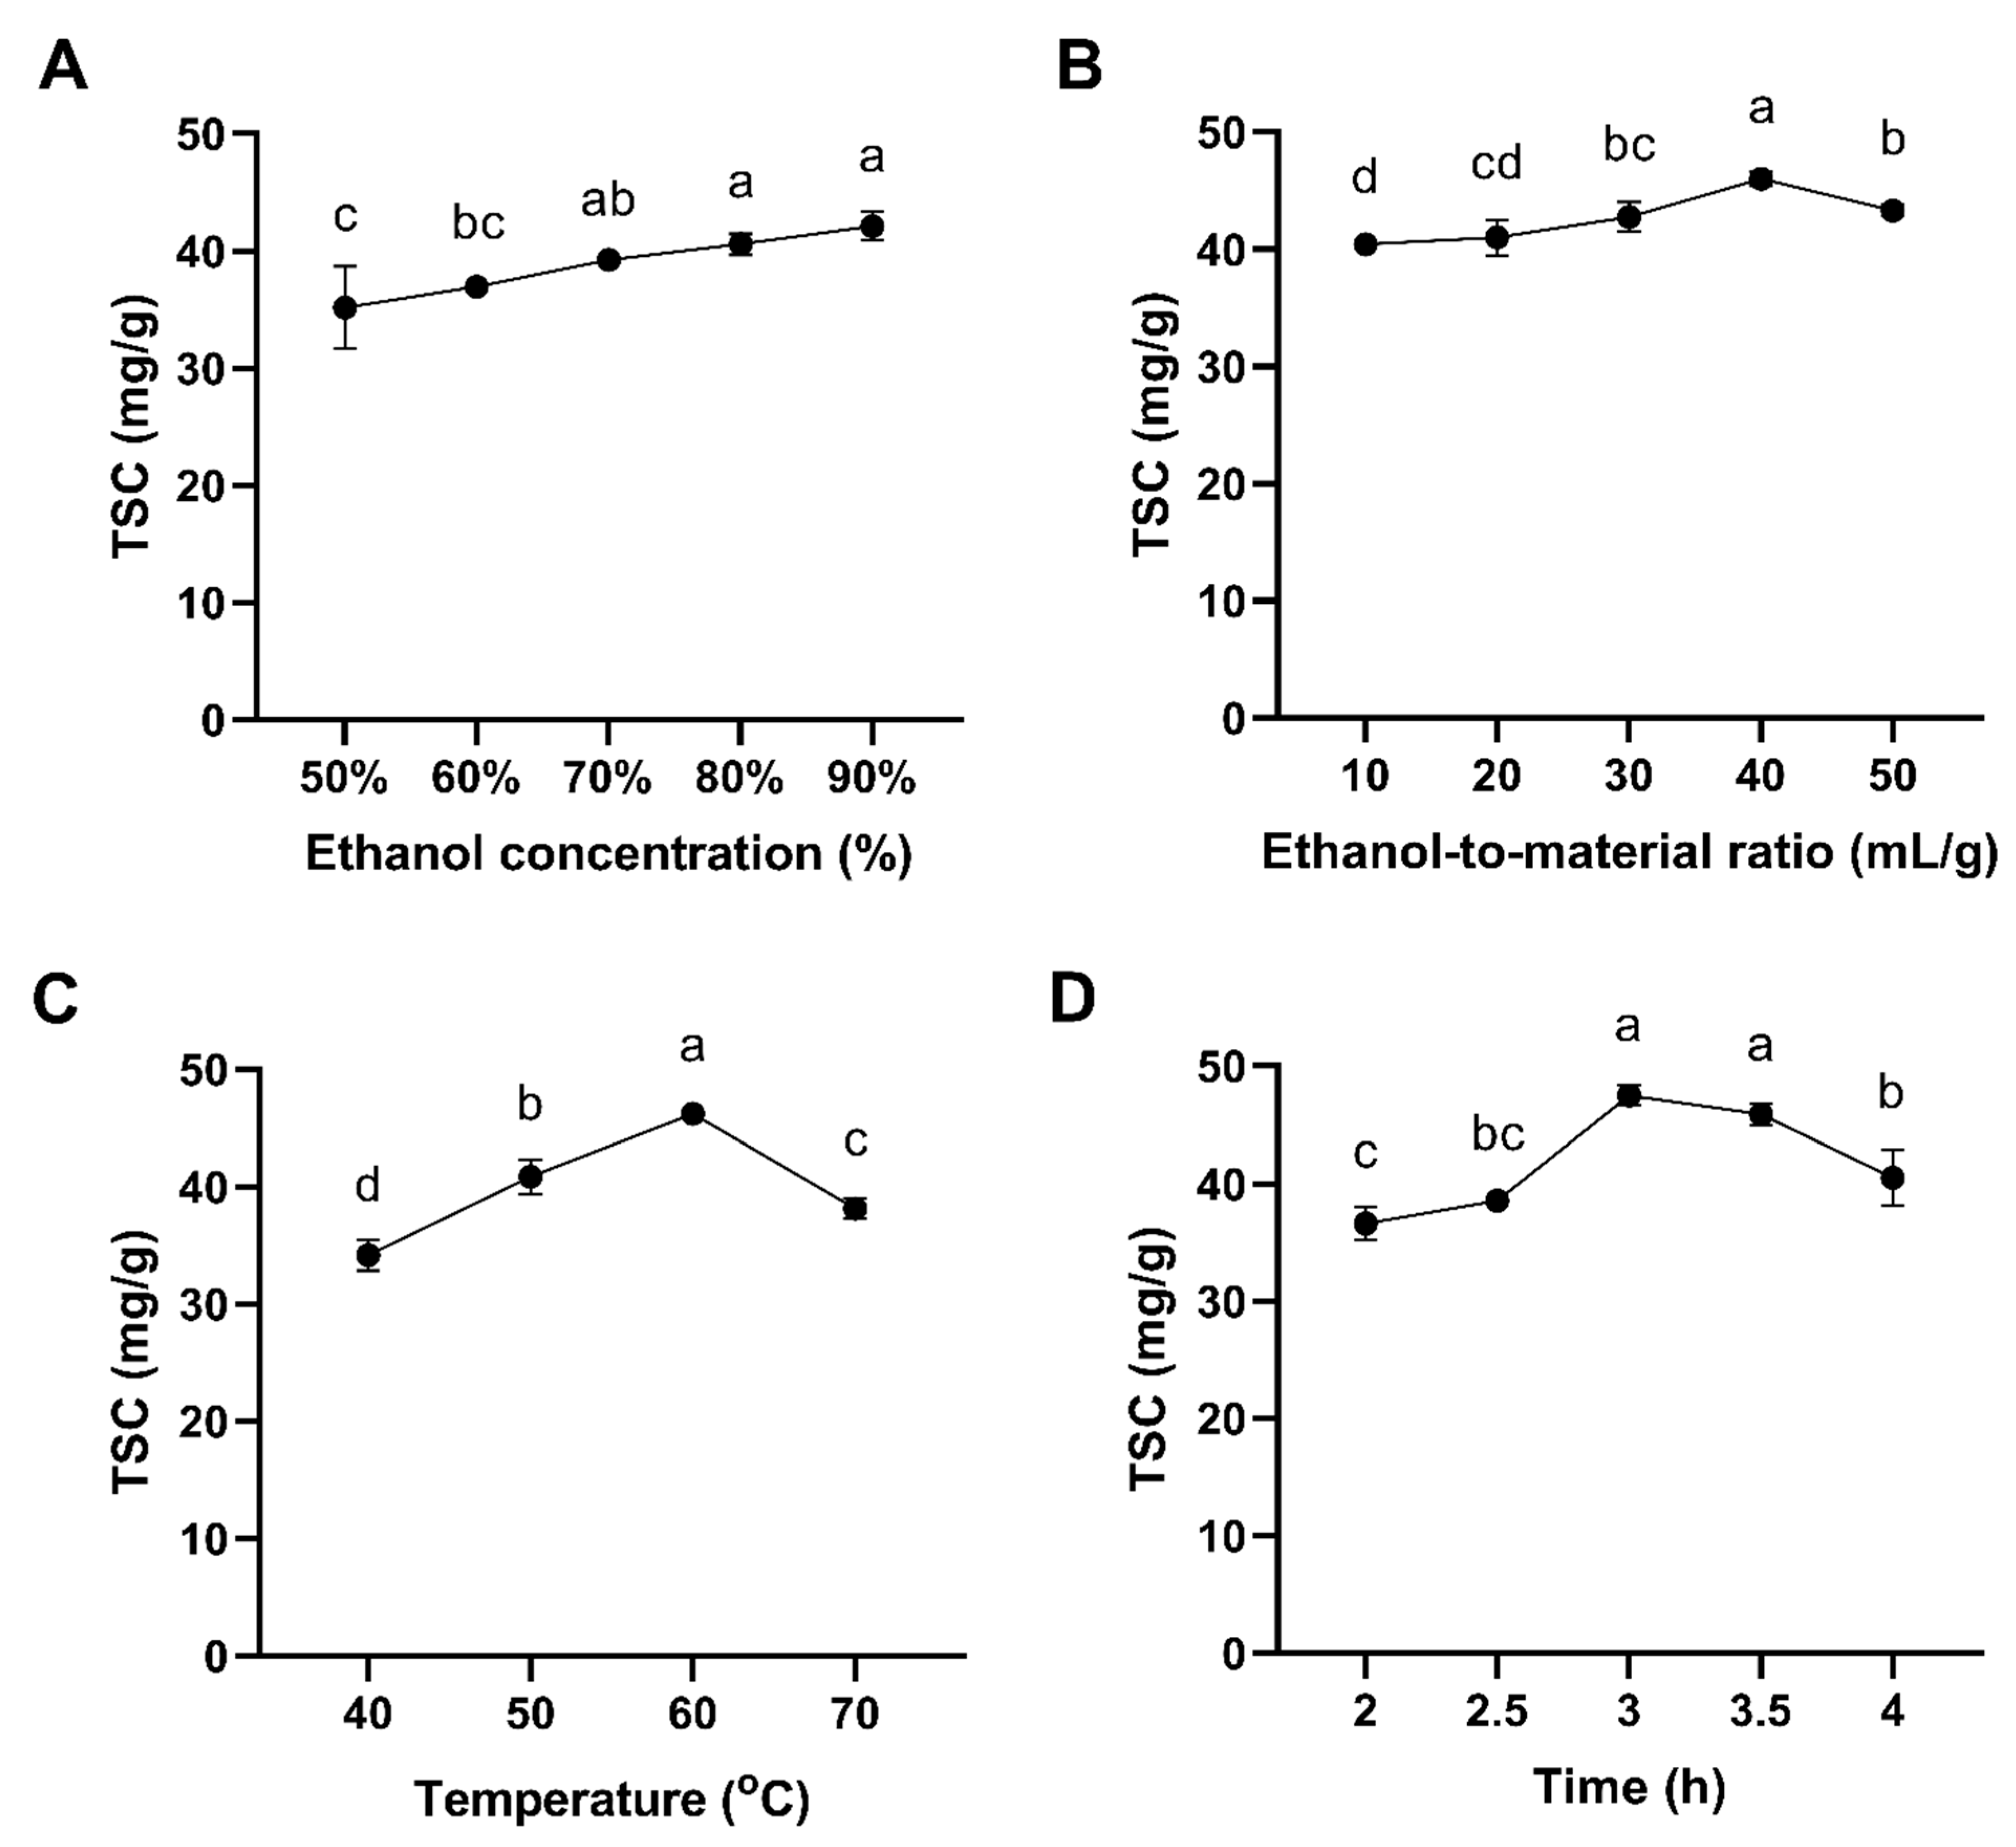
3.2.1. Effect of Solvent Concentration

To determine the effect of solvent concentration on TSC yield, the extraction was performed at 60 °C for 3 h with five different ethanol concentrations in the solvent-to-material ratio. The effect of ethanol concentration is exhibited in Figure 2A. As the ethanol concentration increased from 50 to 90%, the TSC yield increased steadily from 35.16 to 42.12 mg/g. There was no statistically significant difference between ethanol concentrations of 80 and 90%, with TSC yields of 40.57 and 42.12 mg/g dried sample, respectively. Moreover, Gong et al. [24] also mentioned that 79–80% ethanol was found to be the optimal solvent concentration for extracting saponins from Panax notoginseng. Thus, 80% ethanol was selected for further experiments.

3.2.2. Effect of Material-to-Ethanol

To investigate the effect of the ethanol-to-material ratio on the TSC yield, the extraction was performed at 60 °C for 3 h using 80% ethanol across five different ratios ranging from 10 to 50 mL/g. As shown in Figure 2B, the TSC yield significantly increased from 40.34 to 45.99 mg/g as the ratio rose from 10 to 30 mL/g. However, when the ratio was further increased to 50 mL/g, the TSC yield decreased to 43.30 mg OAE/g. Consequently, an ethanol-to-material ratio of 40 mL/g was chosen as the baseline level (0) for subsequent experiments.

3.2.3. Effect of Temperature

The effect of extraction temperature on TSC yield is presented in Figure 2C. As the temperature increased from 40 to 60 °C, the TSC yield proportionally rose from 34.16 to 46.19 mg/g. Then, the TSC yield dramatically decreased to 38.16 mg OAE/g when the temperature reached to 70 °C. Higher temperatures generally accelerate the diffusion of compounds, which can lead to increased TSC. Nevertheless, excessively high extraction temperatures can diminish saponin’s extraction efficiency, likely due to the decomposition and denaturation of saponins, thereby reducing the overall TSC [20]. Additionally, Khoang, Huyen, Chung, Duy, Toan, Bich, Minh, Pham and Hien [20] also indicated that the optimal temperature for saponin extraction from Polyscias fruticosa roots is 60 °C. Thus, a temperature of 60 °C was selected as the baseline level (0) for subsequent statistical optimization.

3.2.4. Effect of Time

Finally, the extraction time was varied across five different values ranging from 2 to 4 h. The results show that as the extraction time increased from 2 to 3 h, the TSC yield significantly increased from 36.61 to 47.5 mg/g. However, when the extraction time was extended from 3 to 3.5 h, the extraction system reached a dynamic equilibrium. Prolonged extraction times beyond this point led to a decline in the extraction efficiency of saponins and increased processing costs. Hence, an extraction time of 3 h was selected as the baseline level (0) for statistical optimization.

3.2.5. Optimization of Extract Conditions Using RSM

The experimental design matrix was composed of 15 runs with 3 factors (Table 2). The central experiments (run 13–15) were used to determine the experimental error. A quadratic model was employed to express the relationship between the measured response and the input variables, as follows:
Y = 46.16 + 0.4037A − 0.3513B + 0.58C + 0.115AB + 0.0925AC − 0.6575BC − 1.54A2 − 1.41B2 − 1.06C2
where A, C, AB, and AC factors positively influenced the measured response, whereas the other factors demonstrated a negative effect.
The statistical significance of the model equation was evaluated by an F-test ANOVA, as presented in Table 3. The high F-value (25.78) and a low p-value (0.0011) indicate that the model was highly significant and suitable for this experiment. The high coefficient of determination (R2 = 97.89%) further demonstrates a strong correlation between the predicted and experimental values [21]. In the regression model, the secondary terms BC, A2, B2, and C2 were highly significant (p < 0.01). Based on the comparison of F-values, the factors were ranked in order of importance as follows: C > A > B. Additionally, the lack of fit was non-significant (p = 0.6674), suggesting the model is adequate. This is consistent with the findings of Tran et al. (2021) [25], who also observed a non-significant lack-of-fit (p > 0.05) in their RSM-based optimization of ultrasonic-assisted extraction (UAE) of triterpenoids from Vietnamese red Ganoderma lucidum.
These statistical parameters are in line with previous studies applying Response Surface Methodology for saponin extraction. For instance, Zhang (2025) [26] reported an R2 of 92.48% when optimizing saponin yield from Camelia oleifera, while Liang (2024) Liang, Guan, Lv, Yang, Zhang, Zhao, Zhao and Chen [17] observed an R2 of 92.48% for Panax notoginseng and Panax quinquefolium under similar experimental designs. The higher R2 value (97.89%) obtained in the present study suggests a superior model fit, indicating high predictive accuracy and minimal unexplained variation.
Model adequacy checking was performed by comparing predicted and actual values, as illustrated in Figure 3. The close alignment of the data points to a straight line indicates a satisfactory agreement between the real and predicted results, confirming the suitability of the model.

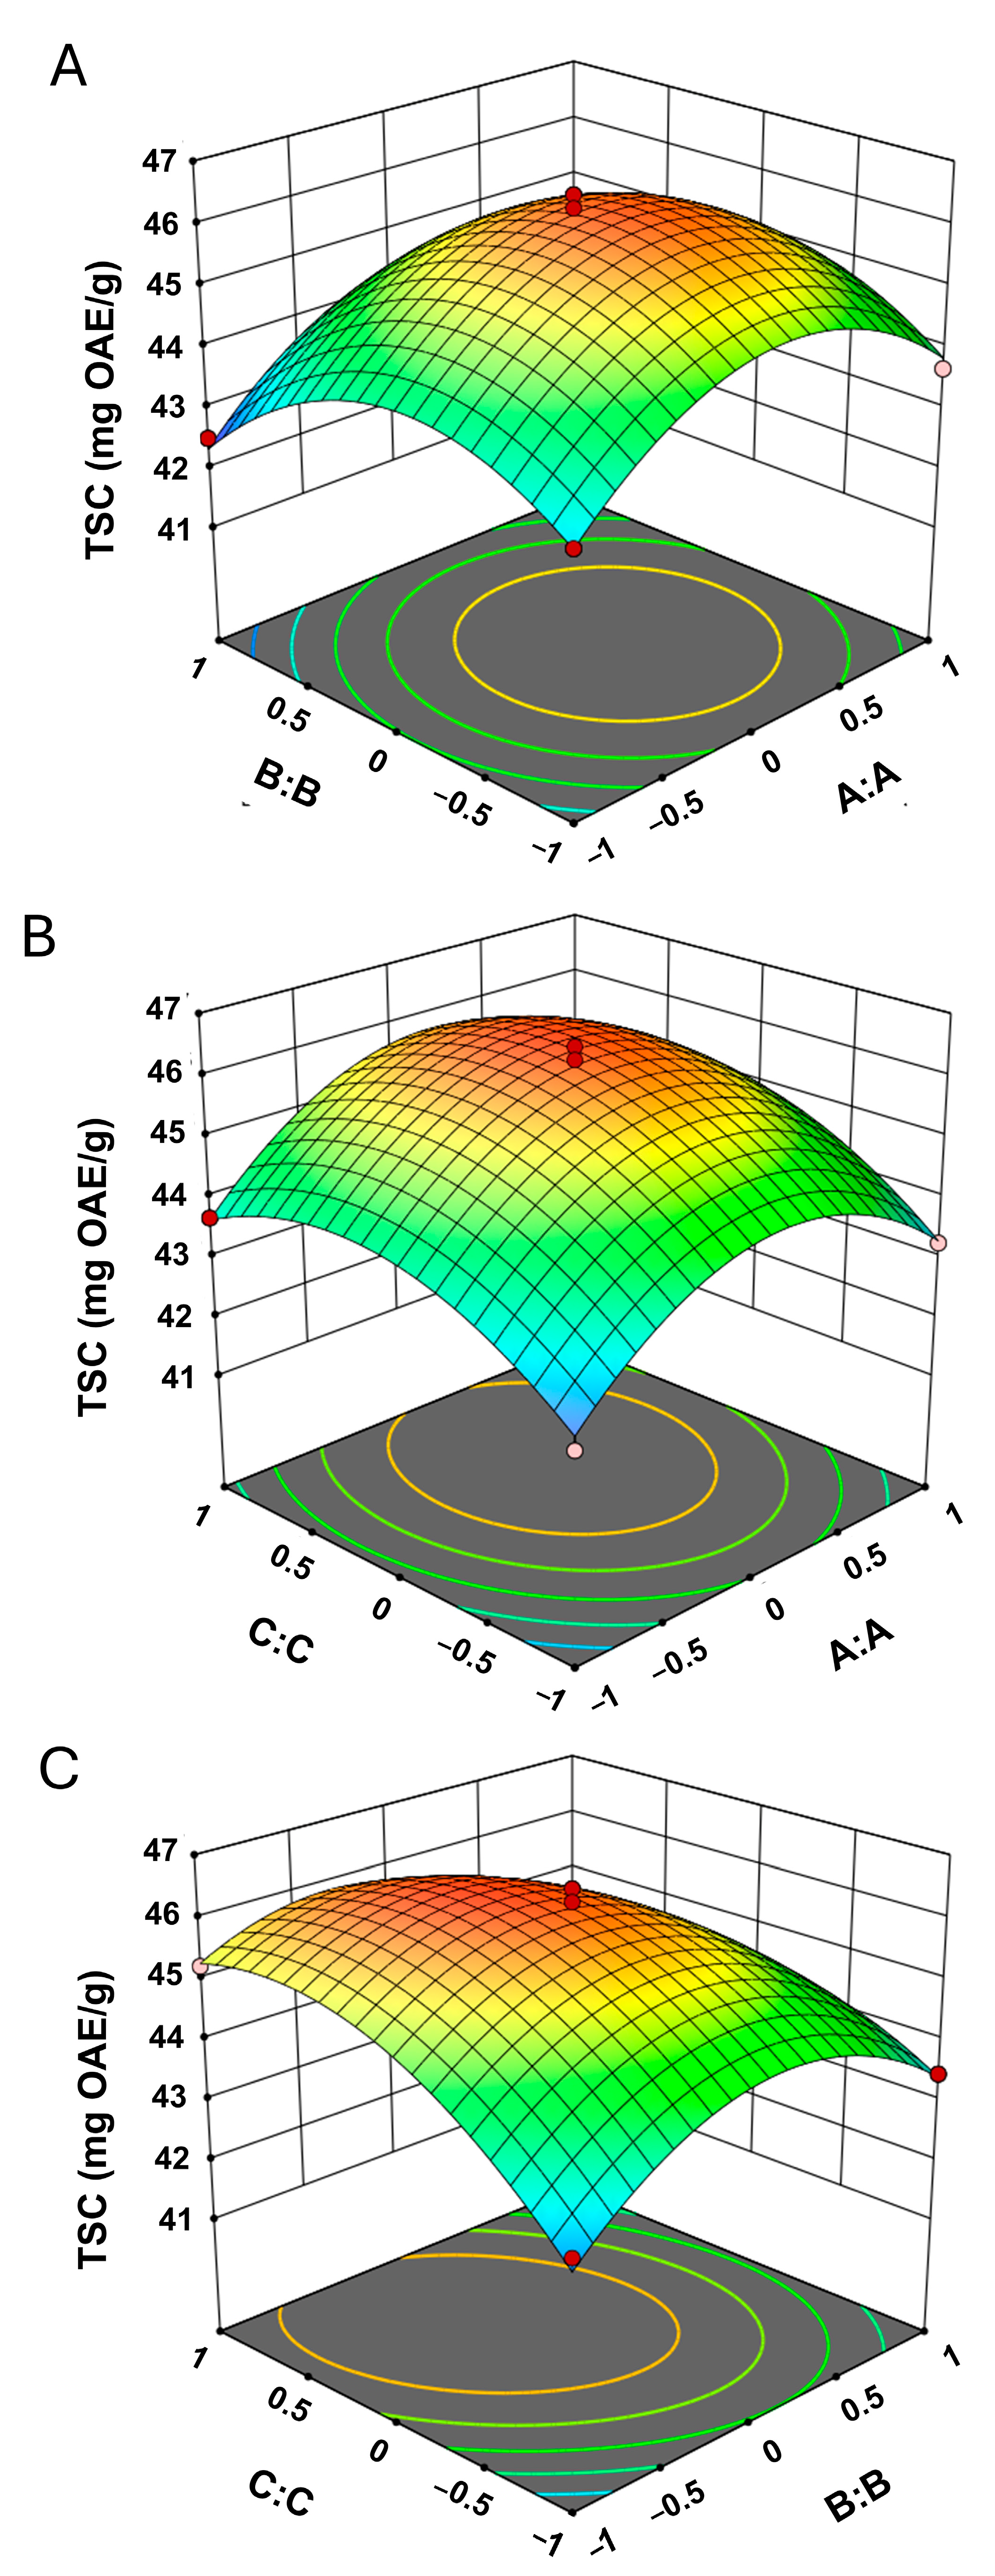
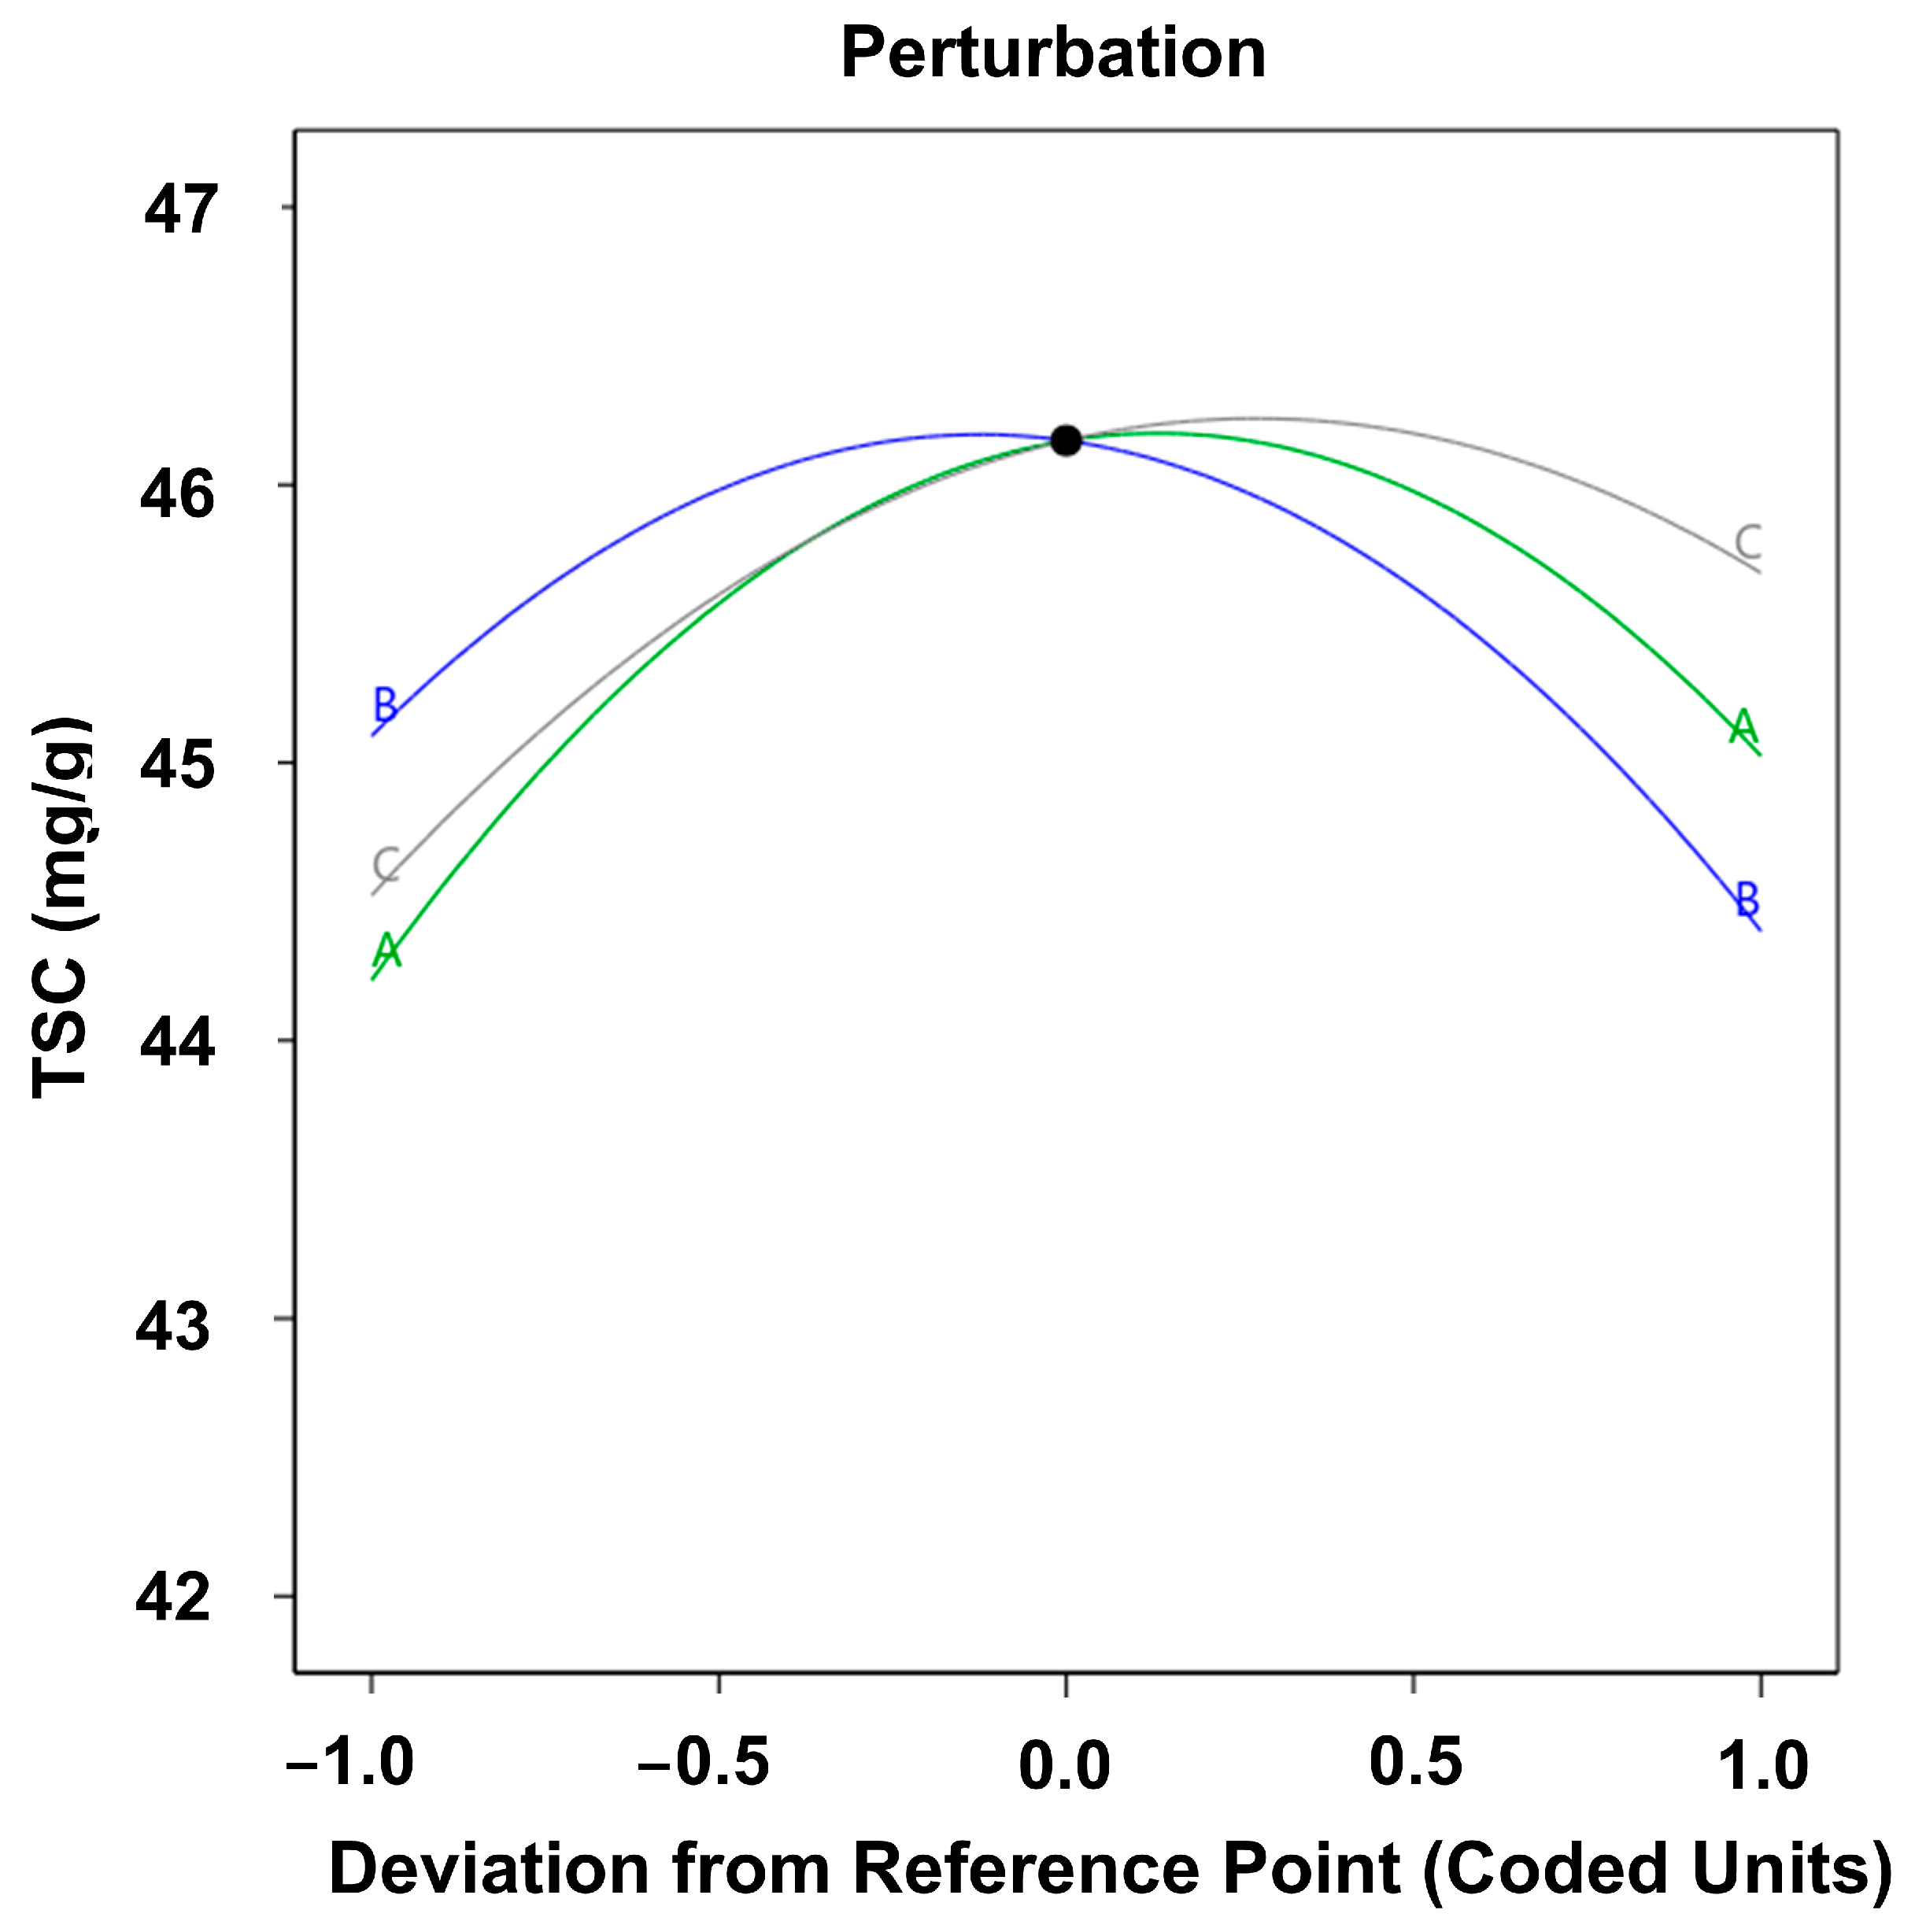
3.2.6. Combined Influence of Extraction Factors on the Extraction of Saponins

The influence of key factors on the saponin red sage root is shown in Figure 4. As seen in Figure 4A,B, the saponin extraction rapidly increased with an increase in ethanol volume in the 1 g sample, reaching a maximum at a ratio of around 40:1 mL/g. However, as the volume of ethanol continued to increase, the saponin content began to decrease. This could be attributed to an initial increase in the concentration gradient between the solvent and the raw material at higher liquid-to-solid ratios, which enhances the dissolution rate of saponins. Conversely, an excessively high liquid-to-solid ratio might negatively impact the cavitation effect, consequently reducing the overall saponin extraction yield [27].
As illustrated in Figure 4A,C, the saponin extraction yield rose with increasing temperature within a certain range. Beyond approximately 60 °C, however, the extraction yield began to decline as the temperature continued to rise. An increase in temperature generally enhances the diffusion coefficient of saponins in the solvent, thereby facilitating its extraction from sage root. Nevertheless, when the temperature exceeds a certain threshold, the structure of saponins may be compromised, leading to a reduction in extraction efficiency. A similar behavior was found for the recovery of saponins from Polyscias fruticosa roots, with an optimal extraction temperature of 60 °C [20,21], suggesting the need for careful control of the extraction temperature to preserve saponin integrity.
As regards the effect of time, Figure 4A,C show that an optimal extraction time of about 3 h maximizes the extraction efficiency. This result agrees with that of another study [21] and can be explained by 3h being a sufficient time for saponins’ release from the materials. As the extraction time increased above 3 h, the yield of total saponins reduced, which implies negative reactions causing the yield decline [21].
Collectively, these results highlight that optimal extraction conditions are crucial to balance efficient solute mass transfer and prevent degradation reactions. These findings are in line with fundamental mass transfer theories in solid–liquid extraction, where extraction efficiency is controlled by the interplay between solute diffusion, solvent saturation, and the thermal stability of target compounds [28,29].

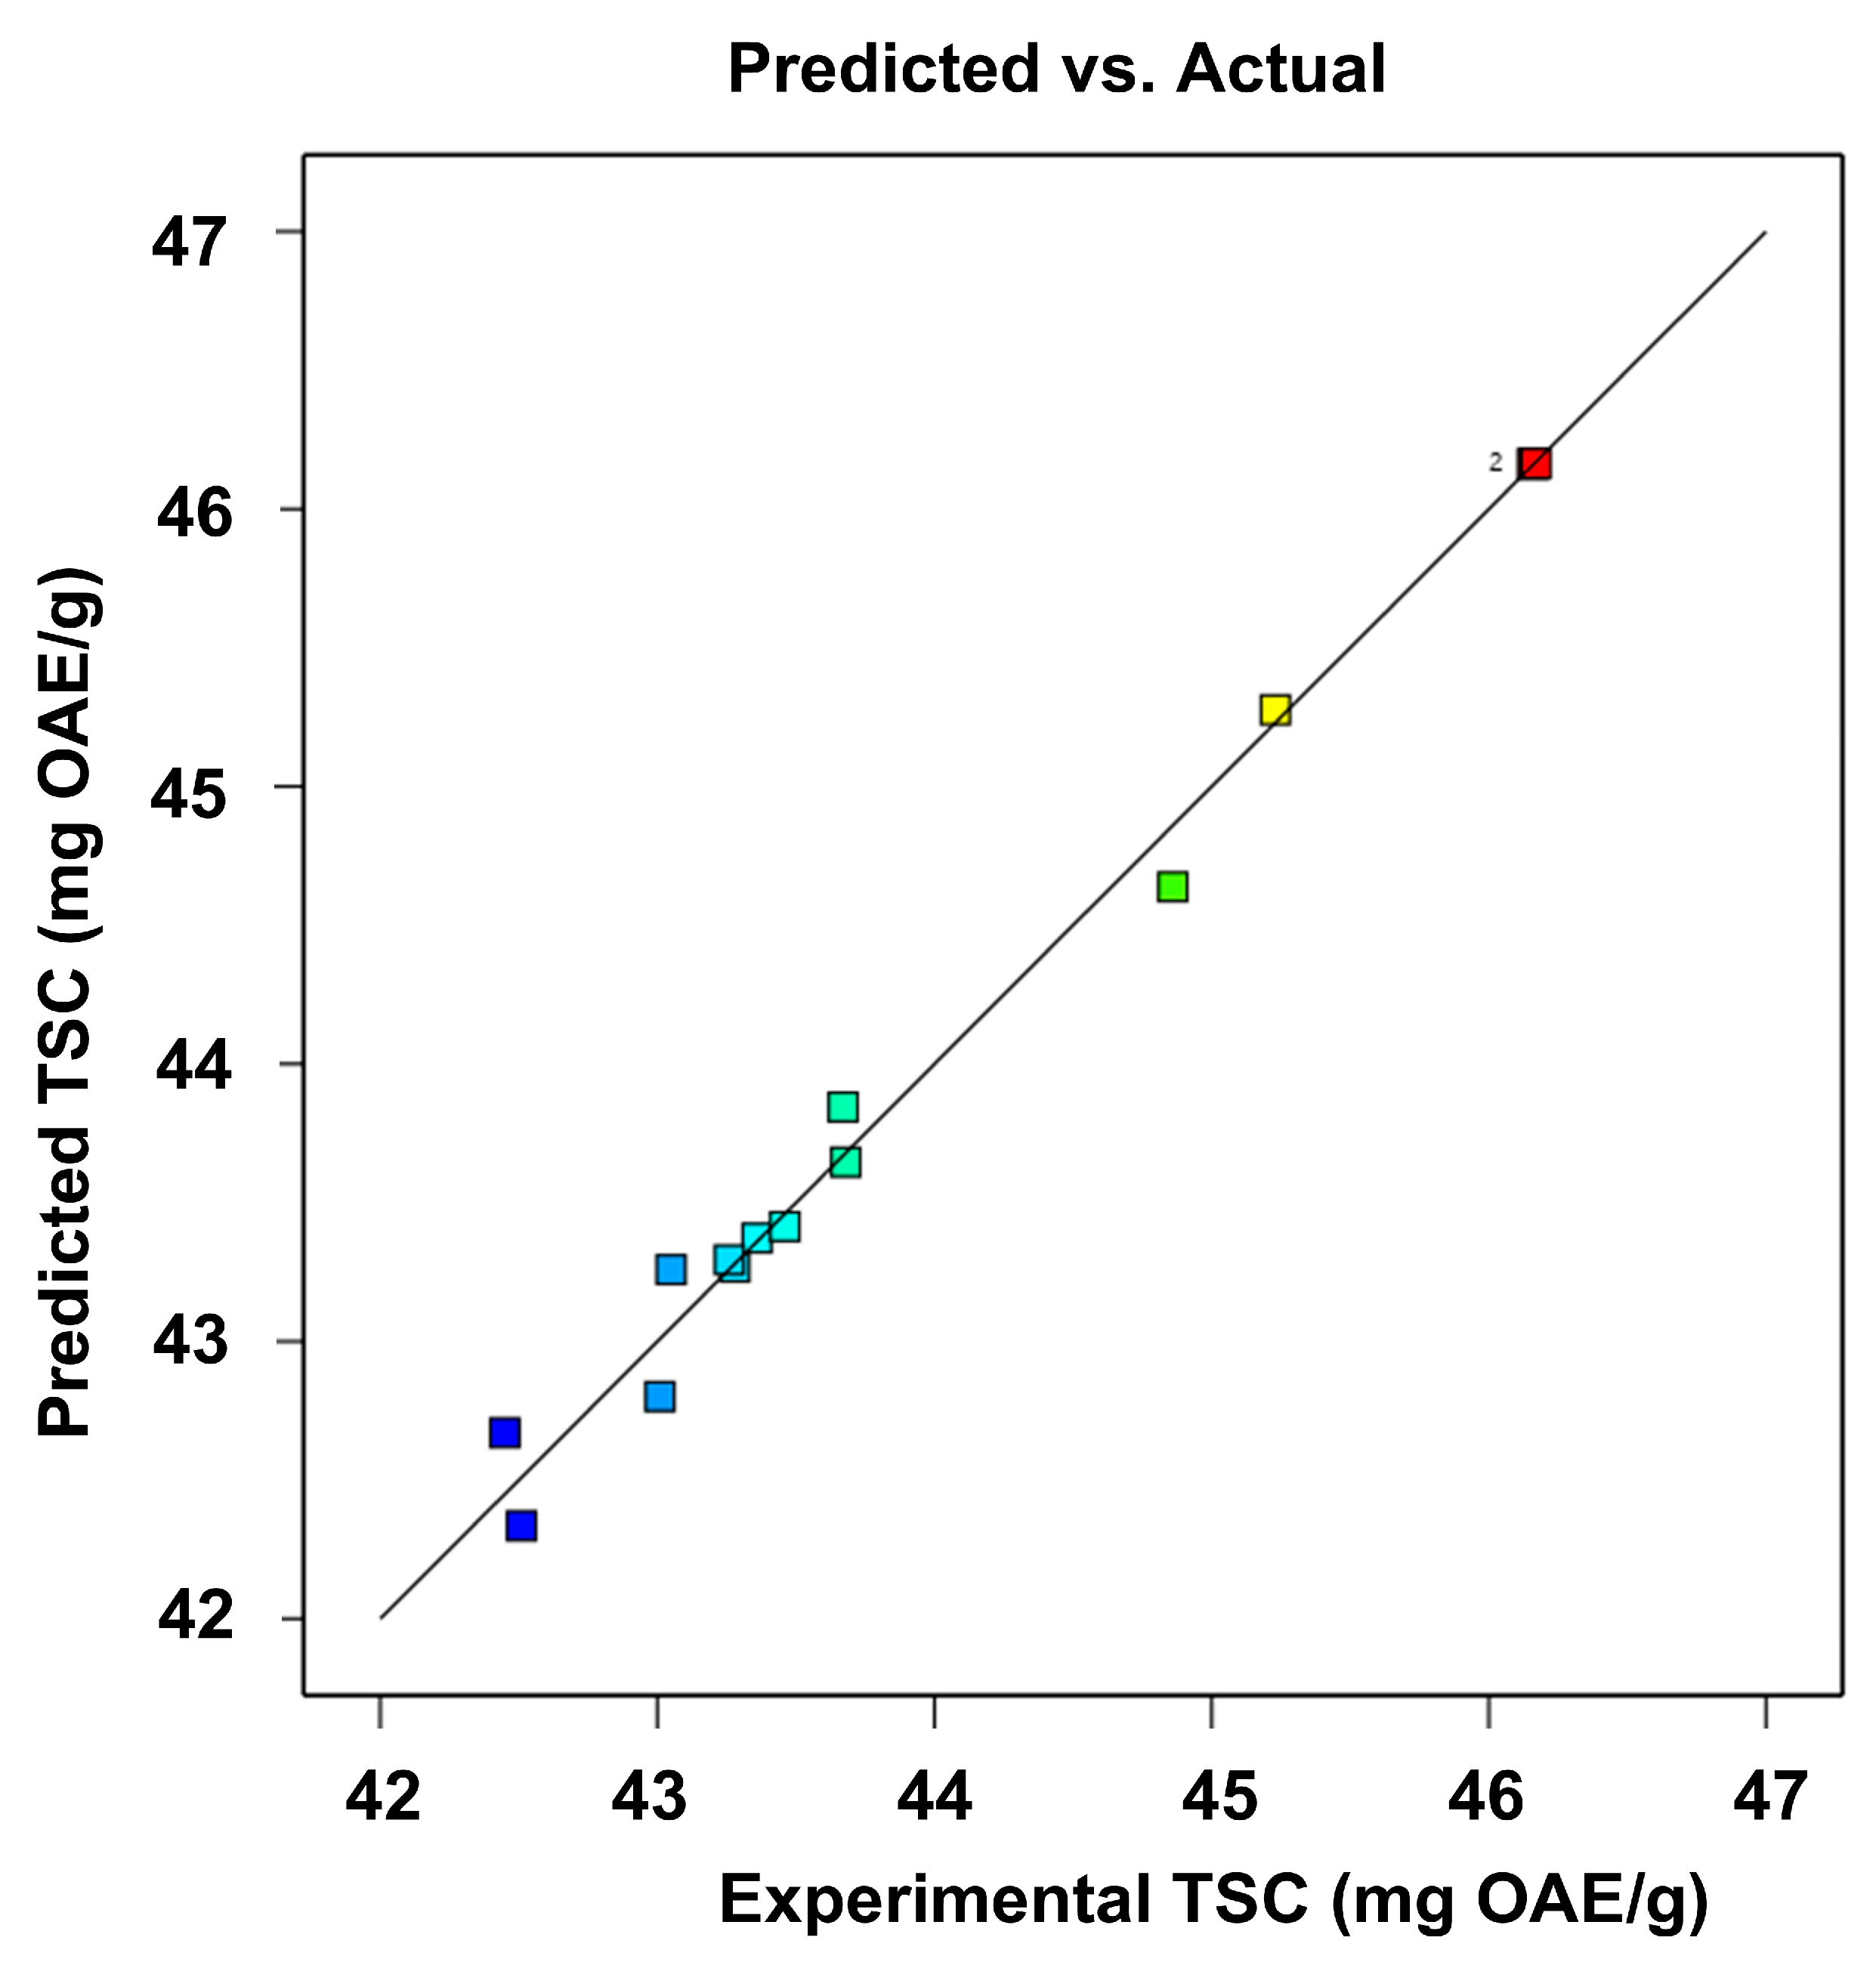
3.2.7. Model Prediction and Validation

The characteristics of the response surfaces and contour plots, as presented in Figure 5, indicate that the recovery of saponins from red sage root can be optimized through the judicious selection of extraction conditions. Numerical maximization of the response variable was performed using the gradient descent method, yielding the following results: A = 0.1313, B = −0.1919, C = 0.3333, in terms of natural variables, 41.31:1 (mL/g), extraction temperature = 58.08 °C, and time = 3.17 h. The corresponding maximum extraction yield was 47.71 ± 0.15 mg/g, which is consistent with the predicted yield of 46.32 mg/g. As a result, the model was considered to be accurate and reliable for predicting saponin yield.
The relatively low deviation between the experimental and predicted yields reflects the robustness of the Box–Behnken design and the suitability of Response Surface Methodology (RSM) for modeling complex multivariable extraction processes. The narrow standard deviation also suggests good reproducibility under optimized conditions.
Notably, the TSC yield of red sage was found to be considerably higher than that of Camellia fascicularis leaves (36.8 mg/g) [21] and Polyscias fruticosa Roots (41.24 mg/g) [20]. This indicates that red sage roots are a potential source of saponin compounds. This comparison highlights the superior saponin content of S. miltiorrhiza roots, suggesting a greater source for pharmaceutical or nutraceutical development.

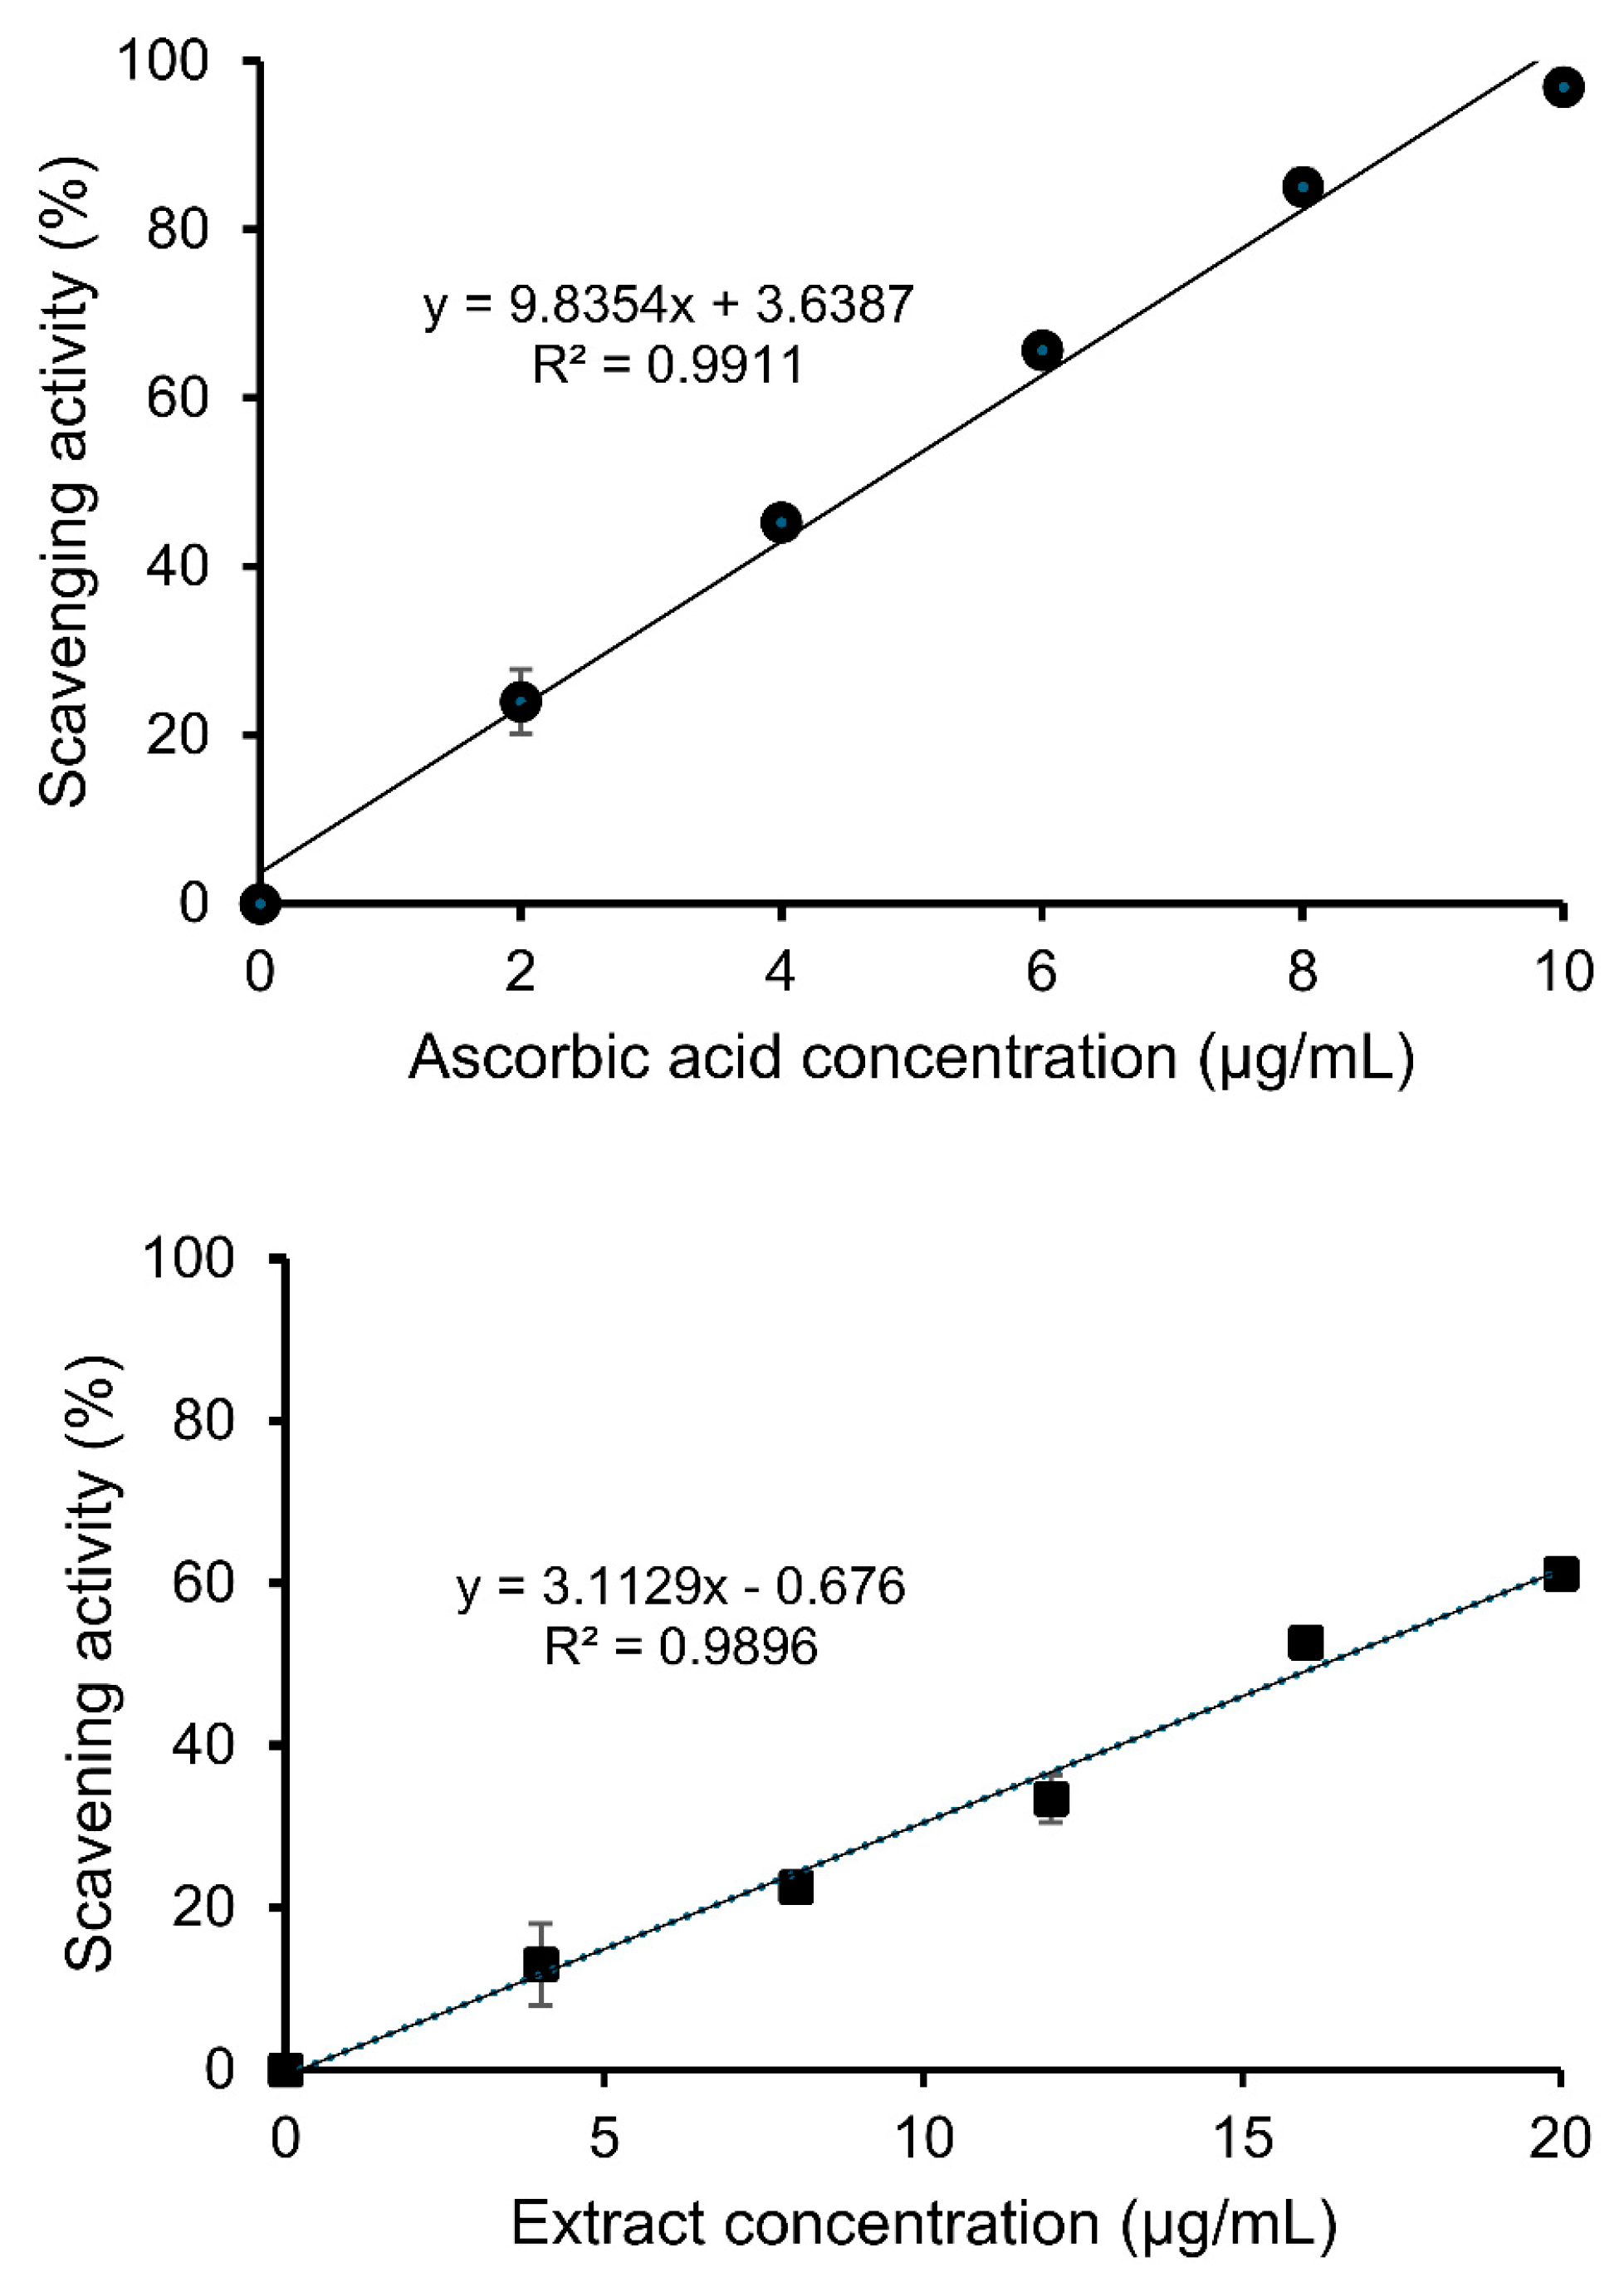
3.2.8. DPPH Scavenging Activity

The DPPH radical scavenging activity of the reducing power was measured to evaluate the antioxidant activities of red sage root extracts and ascorbic acid (Figure 6). The sample rapidly inhibited DPPH radicals by up to 61.14% at a concentration of 20 µg/mL. The scavenging activity of red sage extract was approximately 3.38 times lower than that of ascorbic acid, with IC50 values of 16.28 and 4.81 µg/mL, respectively. Our study demonstrates that Salvia miltiorrhiza root extract, obtained under optimized extraction conditions, exhibits significantly enhanced DPPH radical scavenging activity compared to extracts derived from 70% ethanol extraction (IC50 of 23.45 μg/mL) [30]. These findings indicate that employing RSM for optimization is highly effective in maximizing the extraction of bioactive compounds with antioxidant properties from Salvia miltiorrhiza. The antioxidant activity of the S. miltiorrhiza extract was superior to that of several other plant extracts reported in previous studies. Specifically, the DPPH radical scavenging activity of red sage extract was 12.82 times higher than that of Sida rhombifolia leaf extract (IC50 of 208.63 µg/mL) [31]. The IC50 of the S. tomentosa aqueous methanol extract was 18.7 µg/mL, which was slightly higher than S. miltiorrhiza extract [32]. Moreover, the IC50 red sage extract was significantly lower than that of both the total saponin fraction (440 ± 49 µg/mL) and the crude extract (181 ± 34 µg/mL) derived from Chlorophytum borivilianum tubers, which exhibited a higher total saponin content (196.28 mg DE/g) [33]. These findings reinforce the significance of red sage root extract as a valuable natural antioxidant for future applications in the functional food, cosmetic, and pharmaceutical industries.

3.2.9. Cytotoxicity of Red Sage Extract on HepG2

The cytotoxicity of the crude extract of red sage root on HepG2 cell lines was determined through SRB assay. As shown in Table 4, the crude extract of red sage (100 µg/mL) notably inhibited 61.79% of HepG2 cells. Ly et al. [34] also mentioned that plant extract containing saponins exhibited antitumor activity against HepG2. Ethanol extract of Xanthium strumarium L. (100 µg/mL) inhibited 73.27% of HepG2 cell proliferation. Furthermore, several studies have also proved that S. miltiorrhiza extract presents a potential source for inhibiting HepG2 [35,36,37]. Thus, red sage extract and its total saponin content exhibited moderate cytotoxicity.

4. Conclusions

This study employed Response Surface Methodology to optimize saponin extraction from Salvia miltiorrhiza roots, improving both yield and biological activity. Through the systematic investigation of extraction temperature, time, solvent concentration, and solid-to-liquid ratio, significant enhancements in saponin recovery were achieved. In vitro assessments confirmed the potent antioxidant and anticancer activities of the extracted saponins. These findings demonstrate not only the effectiveness of RSM in optimizing natural product extraction but also the significance of S. miltiorrhiza as a sustainable source of multifunctional bioactive compounds that have the potential to improve health. The methodological approach presented here offers a reproducible and scalable strategy suitable for use in the pharmaceutical and nutraceutical industries. Future studies should explore the in vivo efficacy, safety, and bioavailability of the optimized extract. These results affirm the efficacy of RSM in optimizing natural product extraction and underscore the pharmacological value of S. miltiorrhiza for potential therapeutic and nutraceutical development.

Author Contributions

Conceptualization, T.D.T. and H.T.T.N.; Data curation, H.C.L. and H.D.L.; Formal analysis, H.T.T.N.; Investigation, H.D.L. and T.D.T.; Methodology, H.C.L. and H.D.L.; Software, H.D.L., L.T.T.N. and H.T.T.N.; Supervision, H.T.T.N.; Validation, H.D.L., T.D.T. and L.T.T.N.; Visualization, H.D.L.; Writing—original draft, H.C.L.; Writing—review and editing, H.T.T.N. All authors have read and agreed to the published version of the manuscript.

Funding

This research received no external funding.

Data Availability Statement

The original contributions presented in this study are included in the article. Further inquiries can be directed to the corresponding author.

Conflicts of Interest

The authors declare no conflict of interest.

References

  1. Valko, M.; Leibfritz, D.; Moncol, J.; Cronin, M.T.; Mazur, M.; Telser, J. Free radicals and antioxidants in normal physiological functions and human disease. Int. J. Biochem. Cell Biol. 2007, 39, 44–84. [Google Scholar] [CrossRef]
  2. Ito, N.; Fukushima, S.; Hagiwara, A.; Shibata, M.; Ogiso, T. Carcinogenicity of butylated hydroxyanisole in F344 rats. J. Natl. Cancer Inst. 1983, 70, 343–352. [Google Scholar] [CrossRef]
  3. Shahidi, F.; Ambigaipalan, P. Phenolics and polyphenolics in foods, beverages and spices: Antioxidant activity and health effects—A review. J. Funct. Foods 2015, 18, 820–897. [Google Scholar] [CrossRef]
  4. Rai, S.; Acharya-Siwakoti, E.; Kafle, A.; Devkota, H.P.; Bhattarai, A. Plant-Derived Saponins: A Review of Their Surfactant Properties and Applications. Sci 2021, 3, 44. [Google Scholar] [CrossRef]
  5. Timilsena, Y.P.; Phosanam, A.; Stockmann, R. Perspectives on Saponins: Food Functionality and Applications. Int. J. Mol. Sci. 2023, 24, 13538. [Google Scholar] [CrossRef] [PubMed]
  6. Podolak, I.; Galanty, A.; Sobolewska, D. Saponins as cytotoxic agents: A review. Phytochem. Rev. 2010, 9, 425–474. [Google Scholar] [CrossRef]
  7. Sparg, S.G.; Light, M.E.; van Staden, J. Biological activities and distribution of plant saponins. J. Ethnopharmacol. 2004, 94, 219–243. [Google Scholar] [CrossRef]
  8. Arzumanian, V.A.; Kiseleva, O.I.; Poverennaya, E.V. The Curious Case of the HepG2 Cell Line: 40 Years of Expertise. Int. J. Mol. Sci. 2021, 22, 13135. [Google Scholar] [CrossRef]
  9. Zhou, L.; Zuo, Z.; Chow, M.S. Danshen: An overview of its chemistry, pharmacology, pharmacokinetics, and clinical use. J. Clin. Pharmacol. 2005, 45, 1345–1359. [Google Scholar] [CrossRef]
  10. Petitjean, S.J.L.; Lecocq, M.; Lelong, C.; Denis, R.; Defrère, S.; Mariage, P.-A.; Alsteens, D.; Pilette, C. Salvia miltiorrhiza Bunge as a Potential Natural Compound against COVID-19. Cells 2022, 11, 1311. [Google Scholar] [CrossRef]
  11. Jung, I.; Kim, H.; Moon, S.; Lee, H.; Kim, B. Overview of Salvia miltiorrhiza as a Potential Therapeutic Agent for Various Diseases: An Update on Efficacy and Mechanisms of Action. Antioxidants 2020, 9, 857. [Google Scholar] [CrossRef] [PubMed]
  12. Kim, S.-H.; Ryu, H.G.; Lee, J.; Shin, J.; Harikishore, A.; Jung, H.-Y.; Kim, Y.S.; Lyu, H.-N.; Oh, E.; Baek, N.-I. Ursolic acid exerts anti-cancer activity by suppressing vaccinia-related kinase 1-mediated damage repair in lung cancer cells. Sci. Rep. 2015, 5, 14570. [Google Scholar] [CrossRef]
  13. Zhao, M.; Wu, F.; Tang, Z.; Yang, X.; Liu, Y.; Wang, F.; Chen, B. Anti-inflammatory and antioxidant activity of ursolic acid: A systematic review and meta-analysis. Front. Pharmacol. 2023, 14, 1256946. [Google Scholar] [CrossRef]
  14. Han, D.; Chen, Y.-B.; Zhao, K.; Li, H.-Z.; Chen, X.-Y.; Zhu, G.-Z.; Tu, C.; Gao, J.-W.; Zhuang, J.-S.; Wu, Z.-Y. Tanshinone IIA alleviates inflammation-induced skeletal muscle atrophy by regulating mitochondrial dysfunction. Arch. Biochem. Biophys. 2024, 762, 110215. [Google Scholar] [CrossRef]
  15. Jiang, Y.; Zhang, L.; Rupasinghe, H.P. Antiproliferative effects of extracts from Salvia officinalis L. and Saliva miltiorrhiza Bunge on hepatocellular carcinoma cells. Biomed. Pharmacother. 2017, 85, 57–67. [Google Scholar] [CrossRef] [PubMed]
  16. Myers, R.H.; Montgomery, D.C.; Anderson-Cook, C.M. Response Surface Methodology: Process and Product Optimization Using Designed Experiments; John Wiley & Sons: Hoboken, NJ, USA, 2016. [Google Scholar]
  17. Liang, Z.-W.; Guan, Y.-H.; Lv, Z.; Yang, S.-C.; Zhang, G.-H.; Zhao, Y.-H.; Zhao, M.; Chen, J.-W. Optimization of saponin extraction from the leaves of Panax notoginseng and Panax quinquefolium and evaluation of their antioxidant, antihypertensive, hypoglycemic and anti-inflammatory activities. Food Chem. X 2024, 23, 101642. [Google Scholar] [CrossRef] [PubMed]
  18. Gong, W.; Huang, Y.; Ji, A.; Peng, W.; Liu, C.; Zeng, Y.; Yang, R.; Yan, L.; Wang, X.; Sheng, J. Optimisation of saponin extraction conditions with Camellia sinensis var. assamica seed and its application for a natural detergent. J. Sci. Food Agric. 2018, 98, 2312–2319. [Google Scholar] [CrossRef] [PubMed]
  19. Nguyen, T.C.V.; Trinh, L.T.T.; Nguyen, K.L.; Nguyen, H.C.; Tran, T.D. Optimization of Phenolics Extraction from Strobilanthes cusia Leaves and their Antioxidant Activity. Pharm. Chem. J. 2022, 56, 374–380. [Google Scholar] [CrossRef]
  20. Khoang, L.T.; Huyen, H.T.T.; Chung, H.V.; Duy, L.X.; Toan, T.Q.; Bich, H.T.; Minh, P.T.H.; Pham, D.T.N.; Hien, T.T. Optimization of Total Saponin Extraction from Polyscias fruticosa Roots Using the Ultrasonic-Assisted Method and Response Surface Methodology. Processes 2022, 10, 2034. [Google Scholar] [CrossRef]
  21. Hu, T.; Guo, Y.Y.; Zhou, Q.F.; Zhong, X.K.; Zhu, L.; Piao, J.H.; Chen, J.; Jiang, J.G. Optimization of ultrasonic-assisted extraction of total saponins from Eclipta prostrasta L. using response surface methodology. J. Food Sci. 2012, 77, C975–C982. [Google Scholar] [CrossRef]
  22. Nguyen, M.-N.T.; Ho-Huynh, T.-D. Selective cytotoxicity of a Vietnamese traditional formula, Nam Dia long, against MCF-7 cells by synergistic effects. BMC Complement. Altern. Med. 2016, 16, 220. [Google Scholar] [CrossRef] [PubMed]
  23. Charalambous, D.; Christoforou, M.; Kitiri, E.N.; Andreou, M.; Partassides, D.; Papachrysostomou, C.; Frantzi, M.; Karikas, G.A.; Pantelidou, M. Antimicrobial Activities of Saponaria cypria Boiss. Root Extracts, and the Identification of Nine Saponins and Six Phenolic Compounds. Molecules 2022, 27, 5812. [Google Scholar] [CrossRef]
  24. Gong, X.; Zhang, Y.; Pan, J.; Qu, H. Optimization of the ethanol recycling reflux extraction process for saponins using a design space approach. PLoS ONE 2014, 9, e114300. [Google Scholar] [CrossRef] [PubMed]
  25. Tran, D.; Tai, N.; Linh, N.; Thao, L.; Thi Kim Ngan, N.; Nguyen, T.V.A.; Vuong Hoai, T.; Viet, N.; Nam, H.; Mai, P.; et al. Response surface optimized extraction of triterpenoids from red Vietnamese Ganoderma lucidum and anticancer evaluation of the extract. Vietnam J. Sci. Technol. 2021, 59, 158–168. [Google Scholar] [CrossRef]
  26. Zhang, N.; Ebrahim, Z.M.S.; Tao, L.; Shi, W.; Li, W.; Lu, W. Optimized Extraction of Saponins from Camelia Oleifera Using Ultrasonic-Assisted Enzymes and Their Surface Performance Evaluation. Processes 2025, 13, 1063. [Google Scholar] [CrossRef]
  27. Lin, X.-t.; Zhou, S.-x.; Sun, Z.-p.; Cao, M.-y.; Zhou, T.; Zhao, L.-y.; Chen, G.-t. Deep eutectic solvent-based ultrasonic-assisted extraction of polyphenol from Chenopodium quinoa Willd.: Optimization and lipid-lowering activity. Food Chem. 2025, 464, 141733. [Google Scholar] [CrossRef] [PubMed]
  28. Castillo-Santos, K.; Ruiz-López, I.I.; Rodríguez-Jimenes, G.C.; Carrillo-Ahumada, J.; García-Alvarado, M.A. Analysis of mass transfer equations during solid-liquid extraction and its application for vanilla extraction kinetics modeling. J. Food Eng. 2017, 192, 36–44. [Google Scholar] [CrossRef]
  29. Geankoplis, C. Transport Processes and Separation Process Principles (Includes Unit Operations); Prentice Hall Press: Saddle River, NJ, USA, 2003. [Google Scholar]
  30. Zhao, G.-R.; Xiang, Z.-J.; Ye, T.-X.; Yuan, Y.-J.; Guo, Z.-X. Antioxidant activities of Salvia miltiorrhiza and Panax notoginseng. Food Chem. 2006, 99, 767–774. [Google Scholar] [CrossRef]
  31. Wirman, A.P.; Kristiana, H.; Sunaryo, H. Determination of Total Saponin Content and Antioxidant Activity Using DPPH (2,2-diphenyl-1-picrylhydrazyl) Method of 70% Ethanol Extract of Sidaguri Leaves (Sida rhombifolia L.). Int. J. Eng. Sci. Inf. Technol. 2024, 4, 81–85. [Google Scholar] [CrossRef]
  32. Tepe, B.; Daferera, D.; Sokmen, A.; Sokmen, M.; Polissiou, M. Antimicrobial and antioxidant activities of the essential oil and various extracts of Salvia tomentosa Miller (Lamiaceae). Food Chem. 2005, 90, 333–340. [Google Scholar] [CrossRef]
  33. Ashraf, M.F.; Abd Aziz, M.; Stanslas, J.; Ismail, I.; Abdul Kadir, M. Assessment of Antioxidant and Cytotoxicity Activities of Saponin and Crude Extracts of Chlorophytum borivilianum. Sci. World J. 2013, 2013, 216894. [Google Scholar] [CrossRef] [PubMed]
  34. Ly, H.T.; Truong, T.M.; Nguyen, T.T.H.; Nguyen, H.D.; Zhao, Y.; Le, V.M. Phytochemical screening and anticancer activity of the aerial parts extract of Xanthium strumarium L. on HepG2 cancer cell line. Clin. Phytosci. 2021, 7, 14. [Google Scholar] [CrossRef]
  35. Liu, J.; Shen, H.-M.; Ong, C.-N. Salvia miltiorrhiza inhibits cell growth and induces apoptosis in human hepatoma HepG2 cells. Cancer Lett. 2000, 153, 85–93. [Google Scholar] [CrossRef] [PubMed]
  36. Liu, X.; Yang, Y.; Zhang, X.; Xu, S.; He, S.; Huang, W.; Roberts, M.S. Compound Astragalus and Salvia miltiorrhiza extract inhibits cell invasion by modulating transforming growth factor-β/Smad in HepG2 cell. J. Gastroenterol. Hepatol. 2010, 25, 420–426. [Google Scholar] [CrossRef]
  37. Lee, W.; Chiu, L.; Yeung, J. Cytotoxicity of major tanshinones isolated from Danshen (Salvia miltiorrhiza) on HepG2 cells in relation to glutathione perturbation. Food Chem. Toxicol. 2008, 46, 328–338. [Google Scholar] [CrossRef]
Figure 1. Effect of different solvents on TSC extracted from Salvia miltiorrhiza (Red Sage) roots. The experiment was conducted in triplicate (n = 3). Different letters (a–e) indicate a statistically significant difference among five different sovlents.
Processes 13 02225 g001
Figure 2. Effects of (A) ethanol concentration (B) ethanol-to-material ratio, (C) extraction temperature, and (D) extraction time on TSC extracted from Salvia miltiorrhiza roots. These experiments were conducted in triplicate (n = 3). Different letters (a–d) in one graph indicate a statistically significant difference among different levels in one factor.
Processes 13 02225 g002
Figure 3. Correlation between predicted and experimental for TSC.
Processes 13 02225 g003
Figure 4. Response surface plots showing the interaction effects of (A) ethanol-to-material ratio and temperature, (B) ethanol-to-material ratio and time, and (C) temperature and time on TSC from Salvia miltiorrhiza roots.
Processes 13 02225 g004
Figure 5. Perturbation plot showing the influence of extraction parameters on TSC.
Processes 13 02225 g005
Figure 6. DPPH radical scavenging activity of Salvia miltiorrhiza extract and ascorbic acid. The experiment was conducted in triplicate (n = 3).
Processes 13 02225 g006
Table 1. Independent variables and their corresponding levels.
VariableSymbolLevel
−101
Ethanol-to-material ratio (mL/g)A304050
Temperature (°C)B506070
Time (h)C2.533.5
Table 2. BBD for investing simultaneous effects of extraction conditions.
StandardRunsEthanol-to-Material RatioTemperatureTimeTSC Yield (mg/g)
1110−1145.23 ± 1.14 *
32−11042.51 ± 0.67
12301143.05 ± 0.65
14−1−1043.28 ± 0.81
6510−143.26 ± 0.96
56−10−142.45 ± 1.12
14700046.47 ± 0.93
4811043.36 ± 0.81
8910144.86 ± 0.75
131000045.75 ± 0.97
2111−1043.67 ± 0.88
151200046.26 ± 0.97
9130−1−143.01 ± 1.33
714−10143.68 ± 0.80
101501−143.46 ± 1.16
* Each value represents mean ± SD (n = 3).
Table 3. ANOVA table of the response surface quadratic model analysis of variance table.
SourceSum of SquaresDfMean SquareF-Valuep-Value
Model24.4792.7225.780.0011 *
A-A1.3011.3012.360.0170 *
B-B0.987010.98709.360.0281 *
C-C2.6912.6925.520.0039 *
AB0.052910.05290.50150.5105 ns
AC0.034210.03420.32450.5936 ns
BC1.7311.7316.390.0098 *
A28.7618.7683.020.0003 *
B27.3917.3970.090.0004 *
C24.1314.1339.150.0015 *
Residual0.527450.1055
Lack of Fit0.253230.08440.61550.6674 ns
Pure Error0.274220.1371
Cor Total25.0014
R20.9789
Adj-R20.9409
* p < 0.05 = significant; ns = non-significant.
Table 4. Anticancer activity of Salvia miltiorrhiza extract against HepG2.
SamplesConcentration (μg/mL)Inhibition Rate
Salvia miltiorrhiza extract10061.79 ± 3.57
Camptothecin0.0156.82 ± 2.13
Each value represents mean ± SD (n = 6).
Disclaimer/Publisher’s Note: The statements, opinions and data contained in all publications are solely those of the individual author(s) and contributor(s) and not of MDPI and/or the editor(s). MDPI and/or the editor(s) disclaim responsibility for any injury to people or property resulting from any ideas, methods, instructions or products referred to in the content.

