Abstract
While the arrival of sargassum on the coasts of the Mexican Caribbean represents a threat to the population and the environment, its valorization into high-value-added products represents an opportunity from a circular economy perspective. This paper proposes four technological processing routes to produce sodium alginate, polyhydroxybutyrate, lactic acid, and bioenergy. The study includes synthesis, industrial scale design, simulation, and techno-economic-environmental assessment, which allows the determination of the feasibility and profitability for informed decision-making based on the conceptual design of a biorefinery. The results of the comprehensive evaluation of the case studies indicate that the best alternative is sodium alginate production, with a return on investment of over 80%, a payback period of less than three years, and low environmental impact in terms of CO2 emissions, water consumption, heat transfer agents, and electricity. The cases of co-production of sodium alginate, lactic acid, and biofertilizer and co-production of sodium alginate, PHB, and biofertilizer also demonstrate profitability, with returns on investment of up to 73% and 51%, respectively. However, bioenergy production by cogeneration is unprofitable due to the current costs of sargassum collection and management.
1. Introduction
Sargassum is a brown macroalga that grows in tropical and subtropical waters. It can grow anchored to rocky surfaces or float in the middle of the sea, forming colonies that cover large areas. The sargassum species that reach the coasts of the Mexican Caribbean (CMC) are mainly generated in two areas of the Atlantic Ocean: (1) the so-called Sargassum Sea, which grows off the coast of the southeastern United States, is delimited by different ocean currents that prevent its spread and has been recorded for several centuries, but the arrivals of these algae to the CMC were in moderate quantities so they were not a cause for concern; and (2) the second area is the so-called Great Atlantic Sargassum Belt, which was identified in 2011 and extends from the west coast of Africa to the Gulf of Mexico as a result of various factors related to ocean eutrophication and climate change [1]. Since the appearance of this second area, sargassum has become more frequent and has arrived in greater quantities on the CMC. This has caused various problems for the fishing, tourism, and environmental sectors. Its presence prevents seagrass from photosynthesizing, and its degradation increases the concentration of greenhouse gases in the atmosphere. This has led to the deterioration of water quality, mass mortality of marine species, and risk to human health.
Currently, comprehensive management of sargassum on the CMC focuses on implementing strategies and actions from detection and monitoring to collection, transportation, and final disposal. Regarding the latter, its final disposal is generally carried out in landfills, and a minimal amount is used to produce compost, biofertilizers, or bricks as a building material. Therefore, studies are needed to take advantage of the large amounts of available biomass by implementing valorization technologies using a circular economy approach. Sargassum has a high content of carbohydrates, proteins and lipids. In particular, carbohydrates mainly comprise polysaccharides such as alginates, fucoidans, cellulose, hemicellulose, and lignin [2,3]. In this way, these sargassum components could be recovered to industrialize and market biofuels, biopolymers, and other high-value-added products [4,5,6].
From a circular economy perspective, several investigations have reported important results for the valorization of sargassum, ranging from reviews of sargassum components and applications [7] molecular and bioengineering studies to improve the production of biopolymers (such as alginates and polyhydroxyalkanoates) from algae [8], the analysis of yields for obtaining value-added products, such as alginate and ethanol from Sargassum angustifolium [4], yields for the production of ethanol from S. latifolium [6], to biorefinery approaches with technical and economic evaluations, such as the production of biogas, calcium alginate, and fertilizer from S. muticum [5]. Quality indicators for sargassum have also been reported, allowing for a qualitative assessment of its suitability for various applications. A recent study [9] compared various quality and investment indicators for the valorization of sargassum from the CMC, such as the amount of sargassum used, sargassum quality, degree of technological processing, potential for downstream value addition, level of technical knowledge, experience and skills, suitability for batch or continuous production, investment capital, and sustainability. Based on the reported results, the recommended applications were biochar, biogas, compost, and biofertilizers, followed by construction materials, food, and beverages, and then biofuels, bioplastics, and biotechnological products. However, the quality and utilization indicators for sargassum were qualitative, and the investment indicators (net present value and payback time) were estimated without rigorously evaluating the conceptual designs of industrial processes.
This work proposes the design and techno-economic assessment of a sargassum biorefinery oriented to the production of biopolymers: sodium alginate (SA), polyhydroxybutyrate (PHB), and lactic acid (LA) as a precursor to polylactic acid (PLA); as an alternative to traditional plastics, which pollute the environment due to their lack of biocompatibility and high resistance to degradation. Biopolymers from natural resources (such as agri-food waste, yeast biomass, and lignocellulosic biomass), as well as biopolymer blends (i.e., PLA-SA or PHB-SA), have been reported to have potential applications in the food, pharmaceutical, textile, packaging, and biomedical device industries, among others [10].
The remainder of this paper is organized as follows. The composition of sargassum is first determined based on recoverable (e.g., alginate) and transformed (e.g., conversion of cellulose to PHB or AL) components. Subsequently, a conceptual design of the biorefinery is proposed, formulating the technological routes for sargassum processing, defining the equipment to be used for each unit operation and its dimensions on an industrial scale, the processing cycle, and the restrictions imposed on the material and energy balances. Finally, technical and economic parameters and criteria are proposed to determine the feasibility of the process, verify improvement opportunities, and determine the profitability of the biorefinery for different process configurations.
2. Collected Quantities and Composition of Sargassum
As mentioned above, the arrival of sargassum to the CMC began in 2011 with low quantities, with accumulation records of 2360 tons in 2014, increasing to approximately 10,000 tons in 2019 and up to 40,000 tons in 2020 [11]. The Government of the State of Quintana Roo [1], where the CMC is located, reported that 52,647 tons of sargassum were removed in 2022, and one of the tourist centers most affected by the algae was the Municipality of Tulum, with a collection of 4550 tons (wet basis, wb). For the purposes of this study, the latter quantity was considered the minimum feed for an industrial process. Given that the collected material has a moisture content of 12% [2], this amount corresponds to 4000 tons of sargassum per year (dry basis, db).
Regarding the characterization of sargassum from the CMC, marine brown macroalgae of the genus Sargassum spp. were identified, specifically the species S. fluitans and S. natans, with an average (wb) composition of 20% fiber, 5.36% fat, 5.47% protein, 38.77% carbohydrates, 18.4% ash, and 12% moisture [2]. However, to carry out the modeling and simulation of a biorefinery, a more detailed composition of the carbohydrates involved in the transformation reactions is required. Thus, other characterizations were compiled based on the participating compounds, and an intermediate value was defined for modeling and simulation purposes in this study, as presented in Table 1.

Table 1.
Sargassum composition.
3. Design of Sargassum Valorization Technologies
Different configurations are proposed using the same raw material with the objective of comparing technological process designs through techno-economic evaluations and some environmental impact factors to determine the best-proposed configuration. Three cases consider the design of a biorefinery to valorize sargassum into products for use in the biopolymer industry: SA, PHB, and LA (as a precursor to polylactic acid). These will be compared with a bioenergy cogeneration process, given the current trend of biomass combustion.
3.1. Case I: SA Production
This technological process involves obtaining SA through three processing sections: sargassum conditioning, SA extraction, SA purification, and solid waste disposal, as shown in Figure 1a.
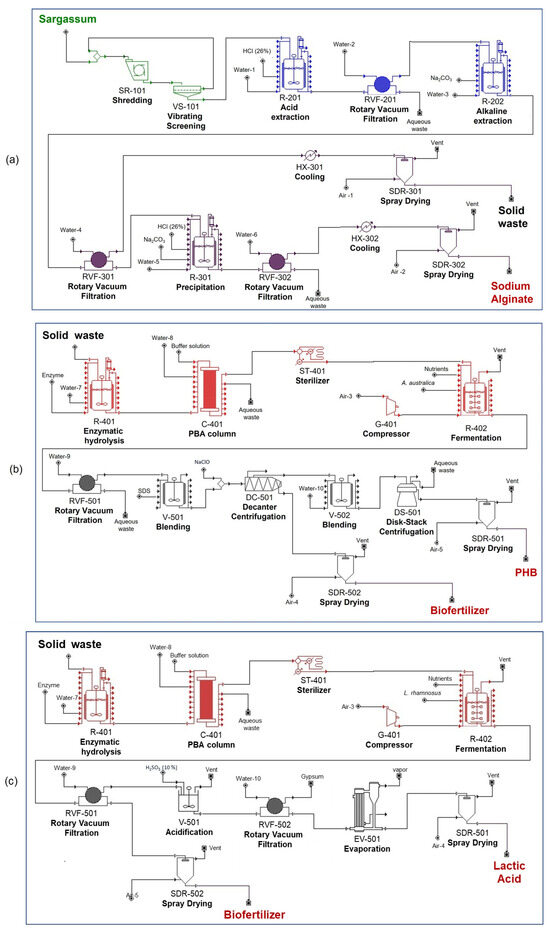
Figure 1.
Process flow diagram for the following areas: (a) SA production; (b) production of PHB and biofertilizer from solid waste from the SA production section (a); (c) lactic acid and biofertilizer from solid waste from the SA production section (a).
Sargassum conditioning section: At the beginning of the process, reducing the particle size of sargassum is important to increase the contact area and, consequently, mass transfer. This is achieved using the SR-101 equipment in Figure 1. To ensure that the desired size is not exceeded, screening is performed using VS-101.
SA extraction section: After the algae are crushed, they are transferred to the R-201 stirred-tank reactor, where water and hydrochloric acid are added to break the bonds between cellulose (reaction of Equation (1) with a conversion of 6.5%), hemicellulose (reaction of Equation (2) with a conversion of 75%), and lignin (reaction of Equation (3) with a conversion of 5%), as well as to transform calcium alginate into alginic acid according to reaction of Equation (4). Similarly, part of the xylan present is converted into furfuraldehyde (reaction in Equation (5) with a conversion of 10%), and part of the mannan and galactan into HMF (5-hydroxymethylfurfural) (reaction in Equation (6) with a conversion of 15%). Subsequently, the acid residues are eliminated using the RVF-201 rotary filter (Figure 1a), and an alkaline extraction is carried out in the R-202 reactor by adding sodium carbonate, with the aim of SA represented in reaction 7 [14,15].
(C6H10O5)n + n H2O → n C6H12O6
(C5H8O4)n + n H2O → n C5H10O5
(C10H10O2)n + n H2O → n C10H12O3
(C12H14CaO12)n + 2n HCl → 2 (C6H8O6)n + n CaCl2
(C5H8O4)n → n C5H4O2 + 2n H2O
(C6H10O5)n → n C6H6O3 + 2n H2O
2(C6H8O6)n + n Na2CO3 → 2(C6H7NaO6)n + n CO2 + n H2O
SA purification and solid waste disposal section: The liquid phase containing soluble alginates and furan derivatives is separated from the solid phase containing lignocellulosic biomass. The latter is dried and acquires a negative value as solid waste, while the former is sent to the R-301 reactor and treated with hydrochloric acid and calcium carbonate to precipitate SA, as represented by Equations (8) and (9), respectively. Finally, the solid SA is recovered using a rotary filter RVF-302 and spray-dried using SDR-301 (Figure 1a).
(C6H7NaO6)n + n HCl → (C6H8O6)n + n NaCl
2 (C6H8O6)n + n Na2CO3 → 2 (C6H7NaO6)n + n CO2 + n H2O
3.2. Case II: Co-Production of SA, PHB and Biofertilizer
For the second case, the same three sections as in Case I (sargassum conditioning, SA extraction, SA purification, and solid waste separation) are maintained, as described in Figure 1a. Subsequently, the solid waste corresponding to the lignocellulosic biomass will pass through the PHB fermentation section, and thereafter, PHB and biofertilizer separation and purification will be carried out, as shown in Figure 1b.
PHB fermentation section: During this stage, the cellulose bonds of the lignocellulosic biomass are first hydrolyzed by applying a glucanase cocktail in the R-401 reactor (completing the reaction in Equation (1)). Subsequently, the packed bed adsorption (PBA) chromatography column (C-401) is responsible for removing heavy metals from the hydrolysate, and the ST-401 equipment sterilizes the hydrolysate to prevent contamination and the production of undesirable compounds. The glucose contained in the hydrolysate is then used as a carbon source in the R-402 reactor to produce PHB using Azohydromonas australica (CH1.8O0.5N0.2) as the fermenting microorganism, according to Equation (10) [16].
C6H12O6 + 0.261 NH3 + 2.96 O2 → 0.706 CH1.8O0.5N0.2 + 0.765 C4H6O2 + 2.613 CO2 + 3.319 H2O
PHB and biofertilizer separation and purification section: Once fermentation is complete, the product obtained is intracellular (the microorganism grows alongside the PHB), which requires cell disruption and subsequent separation and purification steps. The intracellular product is first separated from the aqueous phase using an RVF-501 rotary filter (Figure 1b). Sodium dodecyl sulfate (SDS) is then added as a surfactant to a storage tank (V-501), which causes cell lysis and releases PHB into the medium. A 30% NaClO solution is then used for further cell disruption in the DC-501 centrifuge, separating the PHB from the remaining lignocellulosic compounds and the lysed remains of the microorganisms, which are subsequently dried in the SDR-502 equipment to produce biofertilizer. The concentrate from DC-501 is washed (V-502), centrifuged (DS-501), and dried (SDR-501) to obtain PHB with a purity of approximately 95%.
3.3. Case III: Co-Production of SA, LA and Biofertilizer
As in Case II, for LA production, the sargassum conditioning, SA extraction, SA purification, and solid waste separation sections previously described in Section 3.1 and Figure 1a are first implemented. Subsequently, the solid waste resulting from SA extraction is incorporated into the fermentation section, and finally, LA and the biofertilizer are separated and purified [17], as shown in the flow diagram in Figure 1c.
LA fermentation section: Here, enzymatic hydrolysis is performed to release glucose into the medium (using a glucanase cocktail) in reactor R-401, followed by heavy-metal removal in column C-401. Next, the necessary nutrients (yeast extract, ammonium sulfate, tryptone, and calcium hydroxide) are added to the mainstream of the FR-401 reactor, together with the sterilized hydrolysate and Lactobacillus casei Rhamnosus (biomass with a molecular mass of 24,630) as a microorganism for glucose fermentation (according to Equations (11) and (12)).
C6H12O6 + 0.0037 (NH4)2SO4 → 0.236 Biomass + 1.941 C3H6O3
Ca(OH)2 + 2 C3H6O3 → C6H10CaO6 + 2 H2O
LA and biofertilizer separation and purification section: The purification stage begins with the RVF-501 rotary filter, which removes biomass and lignocellulosic residues, separating the solid phase from the liquid. The solids are then transferred to the SDR-502 spray dryer to obtain the biofertilizer. The aqueous phase enters the V-501 acidification tank, where sulfuric acid is added to promote the dissociation of calcium lactate, forming gypsum and LA (reaction of Equation (13)). The final product, LA suspension with a purity of 50%, is recovered by filtration (RVF-502), water removal by evaporation (EV-501), and drying (SDR-501).
C6H12CaO6 + H2SO4 → CaSO4 + 2 C3H6O3
3.4. Case IV: Bioenergy Production
For this configuration, the cogeneration of electrical energy and water vapor is proposed, as shown in Figure 2. First, the particle size of the dried sargassum is reduced in the SR-101 shredder and then compacted into pellets using the XD-101 equipment. Subsequently, the pellets are preheated (HX-101) with flue gases from the boiler (to harness and integrate the heat). Subsequently, the material is introduced into a steam generator (SG-101), where combustion reactions occur. Finally, the high-pressure steam generated is sent to the power generation in an extraction steam turbine (SE-101).
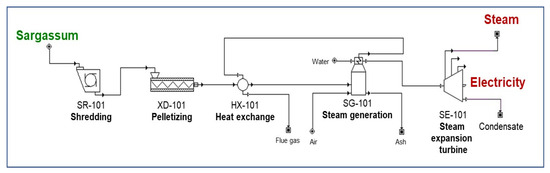
Figure 2.
Process flow diagram for bioenergy production through cogeneration.
4. Evaluation Methodology for Proposed Processing Technologies
From a circular economy perspective, biorefinery assessments seek to determine the sustainability of the processes involved in terms of technical feasibility, profitability, and environmental impact. This requires defining evaluation parameters and criteria, data collection and analysis (in this work, using biorefinery simulations), discussion of results to enable comparison of different processing configurations or technologies, and decision-making at an early stage of biorefinery design. The evaluations considered in this study are described briefly below.
Technical Feasibility: The technical evaluation is based on the resolution of material and energy balances along with process constraints (quantities and concentrations of raw materials, reactions, conversions, operating conditions, etc.), taking into account the size, dimensions, and efficiency of the processing equipment, equipment occupancy times, downtime, cycling time, and the annual plant operating time. The parameters to be considered are primarily the annual production capacities of value-added products and by-products, as well as the product-substrate yields to quantify the efficiency of the technological process under evaluation. The criteria for determining technical feasibility is to verify that the production capacities comply with the availability of raw materials (i.e., sargassum) and, in general, with the market demands for the products. Meanwhile, the product-substrate yields will allow for adjusting the reaction conditions to improve production capacities and facilitate the selection of the most suitable products for commercialization under-informed decisions.
Profitability analysis: The purpose of the economic evaluation is to measure the efficiency of the investment made and its potential cost-benefit analysis over time. To evaluate this aspect, capital investment, potential revenue and process credits, operating costs, taxes, equipment depreciation, and net profit are estimated. The economic parameters selected in the first stage of the biorefinery conceptual design are established as the return on investment (ROI) and payback period (PBP), based on an economic model without discounted cash flow. However, if the biorefinery proves to be highly profitable and detailed engineering continues, it is recommended to evaluate more rigorous economic models with cash flow, such as the net present value. In particular, the desirable profitability criteria for a biorefinery are an ROI greater than 20% and a PBP of less than 3 years [18].
Environmental impact: At this stage of biorefinery conceptual design selection, various factors are considered to identify, predict, and evaluate potential environmental impacts in terms of pollution, climate change, and responsible use of natural resources. In this regard, the quantities and yields of the following materials and utilities are estimated: solid waste generation, CO2 emissions, thermal and electrical energy consumption, and water consumption. As mentioned above, if a biorefinery design is selected and detailed engineering is pursued, more rigorous environmental assessments, such as life cycle analysis (LCA), are recommended.
5. Results of the Simulation and Evaluation of the Case Studies
The biorefinery flowsheets for the four case studies described in Section 3 were implemented in SuperPro Designer, a modular bioprocess simulator that allows for the assessment of established parameters such as technical feasibility, profitability, and environmental impact. The simulations consider the selection of equipment for each unit operation, its operating conditions, and the times for material loading, process operation, material unloading, and equipment cleaning, as appropriate.
5.1. Main Assumptions for Process Modeling and Simulation
As established in Section 2, the minimum calculation basis for the biorefinery design was 4000 t/y of sargassum (db), which corresponds to the quantity reported in one of the most affected areas of CMC. For the comprehensive evaluation of the biorefinery, the following assumptions are made: annual operating time of 336 days, depreciation period of 15 years, income tax rate of 30%, and all costs are in US dollars. The acquisition cost of sargassum was 0.05 USD/kg [5], and the revenue costs of AS [8], PHB [19], AL [17], and biofertilizer [5] were 20, 5, 1.38, and 0.2 USD/kg, respectively. The costs of the other raw materials were obtained from the SuperPro Designer database, as well as the utility costs of cooling water, cooled water, chilled water, steam, and electricity, which were 0.0125 USD/t, 0.025 USD/t, 0.175 USD/t, 0.28 USD/t, and 0.1 USD/kW-h, respectively, while the cost of high-pressure steam generated by the cogeneration process (Case IV) was 0.020 USD/kg.
5.2. Technical Feasibility Analysis
Table 2 shows the annual quantities of sargassum treated for each case study and their equivalent quantities per batch. It is important to note that Cases I, II, and III were implemented in batch mode (since these are biotechnological processes, and this mode is preferred to control potential microbial contamination), while the cogeneration process in Case IV was implemented in continuous mode. The values reported in Table 2 were obtained based on the equipment operating sequence, occupancy, operation, downtime, and cycle times. The batch time, cycle time, and number of annual batches were as follows:
Table 2.
Amount of sargassum processed, modifying the main feed of the biorefinery.
Case I: 175.38 h, 31.0 h, and 255 batches.
Case II: 179.92 h, 37.28 h, and 212 batches.
Case II: 257.60 h, 31.0 h, and 252 batches.
Case IV: Batches were not considered. The process is continuous in a steady state.
Relevant information on the flow rates, pressure, temperature, and composition of the outlet streams for each unit operation is provided in the Supplementary Materials. For Case IV, the combustion process is configured to produce saturated steam at 80 bar (295 °C), which requires 634.37 kcal/kg of generated steam and produces 1.91 kg steam/kg sargassum. Meanwhile, the steam expansion turbine produces 0.166 kW-h/kg sargassum and releases 1.889 kg steam/kg sargassum at 100 °C (1.013 bar) and 0.019 kg condensate/kg sargassum at 45 °C (1.013 bar).
As part of the technical evaluation, the quantities and annual yields of the products and by-products obtained were determined in relation to the amount of sargassum processed (Table 3). It is important to note that biofertilizer yields vary depending on the microbial residues generated during sugar fermentation. These residues (A. australica and L. casei Rhamnosus) exhibit different growth mechanisms and rates, as well as varying nutrient consumption levels. Therefore, the greater the number of bacteria cultivated and used in the process, the greater the amount of biofertilizer obtained. As shown in Table 3, the highest yield corresponds to the biofertilizer (although it is a byproduct with a low sales cost), followed by SA (the product with the highest sales cost), LA, and finally, PHB.
Table 3.
Technical report considering an annual amount of sargassum processed of 20,000 t/y.
5.3. Profitability Analysis
For the economic evaluation, the following were estimated: (a) total capital investment, which includes direct fixed capital, working capital, and start-up costs; (b) total revenues, which include income from the sale of products and by-products, as well as credits generated from steam and electricity for Case IV; and (c) net profit, which considers prior costs, as well as annual operating costs, depreciation, and taxes. A summary of these economic estimates is presented in Table 4, where it can be observed that net profits are positive for Cases I, II, and III; however, the net profit is negative for Case IV (indicating that this case is not profitable). Regarding the cases with positive profits, the one with the highest net profit is Case I (SA production), followed by Case III (co-production of SA, LA, and biofertilizer), and finally Case II (co-production of SA, PHB, and biofertilizer).
Table 4.
Economic evaluation report considering an annual amount of sargassum processed of 20,000 t/y.
Regarding the annual operating costs presented in Table 4, it can be observed that the estimated values vary significantly for each case study. This is because each processing technology has different requirements for raw materials, labor-dependent costs, facility-dependent expenses, quality control, consumables, utilities, and waste management. Regarding these latter economic concepts, Figure 3 shows the percentage distribution within the annual operating costs for all case studies. It can be observed that in some cases, the highest expenditure is on raw materials, in others on facility-dependent expenses or consumables (with the highest cost being the purchase of the enzyme, USD 3/kg, used in the hydrolysis of Cases II and III). Meanwhile, in all cases, the lowest percentage of costs corresponds to quality control, labor-dependent expenses, utilities, and waste management.
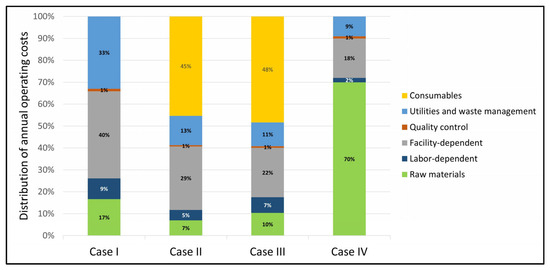
Figure 3.
Distribution of the annual operating costs for all case studies.
For the techno-economic analysis, the ROI and PBP were calculated to verify compliance with the profitability criteria and to compare the configurations of the four proposed case studies. The data presented in Figure 4 show that the economic parameters are positive in all cases. A case study was considered profitable if it met both criteria: ROI ≥ 20% and PBP ≤ 3 years. In particular, Case I presented the highest profitability, followed by Case III, which is profitable for the entire range of sargassum feed studied (from 4000 to 20,000 t/y). Case II is the least profitable, only in the range between 12,000 and 20,000 t/y. Figure 4 also shows that the behavior of the economic parameters tends to be asymptotic; that is, as annual sargassum consumption increases, profitability reaches a maximum limit at the ROI and a minimum at the PBP.
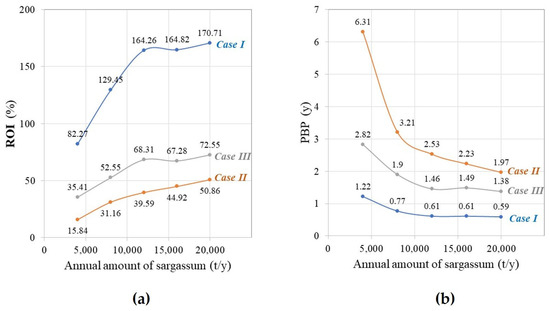
Figure 4.
Profitability analysis by varying the annual amount of sargassum feeding: (a) ROI, return on investment; (b) PBP, payback period.
Because the net profit for Case IV was negative for the entire studied range of annual sargassum feed (see Table 4), this biorefinery design is not profitable. In Mexico, a net cost for the acquisition of sargassum has not been reported; therefore, in this study, an estimate of 0.05 USD/kg was used, according to the literature [5,20]. However, the cost of sargassum depends on cleanup management strategies, such that the cost of sargassum increases to 0.07 USD/kg if sargassum collection is carried out solely using labor, that is, without any machinery [20]. Table 5 shows a parametric analysis of the processed amount and acquisition cost of sargassum. It is observed that the parameter that has the greatest impact on the profitability of industrial biorefineries is not the amount processed but the acquisition cost of sargassum. The values framed in the gray boxes show positive profitability values, and it is observed that Case IV meets the profitability requirements if the cost of sargassum is 0.03 USD/kg or less and with more than 8000 tons of sargassum processed annually.
Table 5.
Technical-economic analysis for Case IV when varying the annual amount of sargassum and the acquisition cost of sargassum (values highlighted in gray indicate the profitable region, and NA means not available).
5.4. Environmental Impact Aspects
To measure the effect of biorefinery operation on the environment, Table 6 presents the values of the environmental impact factors calculated for each case study. The results are analyzed as follows.
Table 6.
Environmental impact factors per unit of processed sargassum.
- (a)
- Process water consumption is required to carry out the reactions, dilutions, and washings at different stages of the process. Cases II and III show the highest consumption due to the fermentation sections, followed by Case I, where only SA is recovered, while Case IV shows the lowest consumption, as water is only required for steam generation.
- (b)
- Steam is used as a heating medium for unit operations that require heating. Steam consumption is typically low in Cases I, II, and III because all the processing stages operate at moderate temperatures. In Case IV, steam is not consumed but generated by the turbine; therefore, no value is available.
- (c)
- Cooling water is used as a heat transfer agent in unit operations. There is a significant difference in the values obtained, with Case II (Co-production of SA, PHB, and biofertilizer) having the highest consumption, followed by Case III (Co-production of SA, LA, and biofertilizer). The highest consumption in these cases is concentrated in separation and purification processes. Case I (SA production) has moderate consumption, while Case IV (bioenergy production) has low consumption since cooling is only required in the steam expansion turbine.
- (d)
- The electrical energy consumption of the biorefinery equipment in Case I was moderate but increased in Cases II and III, mainly due to the energy required by the stirred-tank reactors during the fermentation stages. Case III had higher electrical consumption than Case II because the PHB fermentation reaction requires air supplied by a compressor (whose electrical consumption is high), while lactic fermentation is anaerobic, resulting in substantial energy savings due to the absence of a compressor. Case IV had a lower consumption for shredding and pelletizing, but the electrical energy generated by the turbine was higher; thus, the environmental impact is offset.
- (e)
- CO2 emissions from biorefineries are due to fermentation or cogeneration processes; therefore, there are no emissions in Case I. Furthermore, as mentioned in the previous point, because the lactic fermentation reaction is anaerobic, it also generates no CO2 emissions in Case III. Regarding Case II, the low CO2 emissions are due to PHB fermentation. As expected, Case IV has the highest CO2 emissions due to the combustion reactions; however, it is important to mention that the environmental impact of these emissions is neutralized by the CO2 consumption required for the growth of sargassum itself.
- (f)
- Finally, solid waste is generated in Case I, corresponding to unused lignocellulosic waste after SA recovery, and in Case IV, solid waste corresponds to the ash remaining from the sargassum combustion process. Cases II and III do not generate solid waste, as the remaining solids from fermentation are used as biofertilizers.
6. Conclusions
Although the arrival of sargassum in the CMC is considered a threat to the population and the environment, this study proposes the design of biorefineries as an alternative for its valorization. Four possible configurations were proposed for the design of a biorefinery to generate useful products in the biopolymer industry, such as SA, PHB, and LA (as a precursor to polylactic acid), and these were compared with a bioenergy cogeneration process. The results contribute to the following:
- The synthesis of biorefineries through the construction of process flow diagrams, as well as their design, implementation, simulation, and technical-economic-environmental evaluation, considering that most reported research has not exhaustively addressed all these aspects.
- The technological configurations of the four biorefinery case studies were evaluated on an industrial scale, and parametric sensitivity analysis (varying the amount of sargassum introduced and the acquisition cost) allowed to determine the technical feasibility, profitability, and environmental impact.
- The results of the comprehensive assessments indicate that Case I (corresponding to SA production) is the most profitable, with the lowest environmental impact. Case III (corresponding to the co-production of SA, LA, and biofertilizer) had satisfactory profitability and moderate environmental impact. Case II (corresponding to the co-production of SA, PHB, and biofertilizer) had acceptable profitability, requiring more than 12,000 t/year to be processed, and had a greater environmental impact than the previous two cases. The cogeneration process was unprofitable unless the sargassum collection and handling costs were significantly reduced.
The above demonstrates that implementing a biorefinery to address the problem of sargassum inflow can bring many benefits. However, more rigorous studies are still needed to better understand the conversion processes, such as analyzing what other value-added products can be generated alongside their processing technological routes and identifying the challenges and opportunities that would be involved in implementing an industrial plant for sargassum processing.
Supplementary Materials
The following supporting information can be downloaded at: https://www.mdpi.com/article/10.3390/pr13061916/s1, Table S1: Technical report for the production of sodium alginate, Table S2: Economic report for the production of sodium alginate, Table S3: Execute summary for the production of sodium alginate.
Author Contributions
Conceptualization, O.F.-M. and T.L.-A.; methodology, T.L.-A.; software, T.L.-A.; validation, O.F.-M.; formal analysis, O.F.-M.; investigation, O.F.-M.; resources, T.L.-A.; data curation, O.F.-M. and T.L.-A.; writing—original draft preparation, T.L.-A.; writing—review and editing, O.F.-M. and T.L.-A.; visualization, T.L.-A.; supervision, T.L.-A.; project administration, T.L.-A.; funding acquisition, T.L.-A. All authors have read and agreed to the published version of the manuscript.
Funding
This research was funded by Secihti (Conahcyt) in 2024, grant number CBF2023-2024-3615.
Data Availability Statement
The original contributions presented in this study are included in the article/Supplementary Material. Further inquiries can be directed to the corresponding author.
Conflicts of Interest
The authors declare no conflicts of interest.
References
- Rodríguez-Martínez, R.E.; van Tussenbroek, B.I.; Navarro-Guerrero, G.; Mora-Domínguez, G.; González-Rivera, L.I. Estrategia Integral para el Manejo y Aprovechamiento del Sargazo (EIMAS) en Quintana Roo; Secretaría de Ecología y Medio Ambiente de Quintana Roo y Deutsche Gesellschaft für Internationale Zusammenarbeit (GIZ) GmbH: Mexico, Mexico, 2023. [Google Scholar]
- Paredes-Camacho, R.M.; González-Morales, S.; González-Fuentes, J.A.; Rodríguez-Jasso, R.M.; Benavides-Mendoza, A.; Charles-Rodríguez, A.V.; Robledo-Olivo, A. Characterization of Sargassum spp. from the Mexican Caribbean and Its Valorization through Fermentation Process. Processes 2023, 11, 685. [Google Scholar] [CrossRef]
- López-Sosa, L.B.; Alvarado-Flores, J.J.; Corral-Huacuz, J.C.; Aguilera-Mandujano, A.; Rodríguez-Martínez, R.E.; Guevara-Martínez, S.J.; Alcaraz-Vera, J.V.; Rutiaga-Quiñones, J.G.; Zárate-Medina, J.; Ávalos-Rodríguez, M.L.; et al. A Prospective Study of the Exploitation of Pelagic Sargassum spp. as a Solid Biofuel Energy Source. Appl. Sci. 2020, 10, 8706. [Google Scholar] [CrossRef]
- Ardalan, Y.; Jazini, M.; Karimi, K. Sargassum angustifolium brown macroalga as a high potential substrate for alginate and ethanol production with minimal nutrient requirement. Algal Res. 2018, 36, 29–36. [Google Scholar] [CrossRef]
- Caxiano, I.N.; Mello, P.A.; Alijó, P.H.R.; Teixeira, L.V.; Cano, R.F.; Maia, J.G.S.S.; Bastos, J.B.V.; Pavão, M.S.G. Continuous design and economic analysis of a Sargassum muticum biorefinery process. Bioresour. Technol. 2022, 343, 126152. [Google Scholar] [CrossRef] [PubMed]
- El-Gendy, N.S.; Hosny, M.; Ismail, A.R.; Radwan, A.A.; Ali, B.A.; Ali, H.R.; El-Salamony, R.A.; Abdelsalam, K.M.; Mubarak, M.A. Study on the Potential of Valorizing Sargassum latifolium into Biofuels and Sustainable Value-Added Products. Int. J. Biomater. 2024, 2024, 5184399. [Google Scholar] [CrossRef] [PubMed]
- Devault, D.A.; Pierre, R.; Marfaing, H.; Dolique, F.; Lopez, P.J. Sargassum contamination and consequences for downstream uses: A review. J. Appl. Phycol. 2020, 33, 567–602. [Google Scholar] [CrossRef]
- Galindo, E.; Peña, C.; Núñez, C.; Segura, D.; Espín, G. Molecular and bioengineering strategies to improve alginate and polydydroxyalkanoate production by Azotobacter vinelandii. Microb. Cell Factories 2007, 6, 7. [Google Scholar] [CrossRef] [PubMed][Green Version]
- Bennett, M.; March, A.; Li, H.; Lallemand, P.; Maréchal, J.P.; Failler, P. Qualitative and quantitative assessment of Sargassum valorisation solutions for the Caribbean. J. Environ. Manag. 2025, 381, 124954. [Google Scholar] [CrossRef] [PubMed]
- Balart, R.; Garcia-Garcia, D.; Fombuena, V.; Quiles-Carrillo, L.; Arrieta, M.P. Biopolymers from Natural Resources. Polymers 2021, 13, 2532. [Google Scholar] [CrossRef] [PubMed]
- Leal-Bautista, R.M.; Rodríguez-García, J.C.; Chablé-Villacis, R.; Acosta-González, G.; Bautista-García, J.E.; Tapia-Tussell, R.; Ortega-Camacho, D.; Olguín-Maciel, E.; González López, G. Assessment of Leachate Generated by Sargassum spp. in the Mexican Caribbean: Part 2, Mobility of Metals. Water 2024, 16, 2719. [Google Scholar] [CrossRef]
- Bertagnolli, C.; Espindola, A.P.; Kleinübing, S.J.; Tasic, L.; da Silva, M.G. Sargassum filipendula alginate from Brazil: Seasonal influence and characteristics. Carbohydr. Polym. 2014, 111, 619–623. [Google Scholar] [CrossRef] [PubMed]
- Tejada-Tejada, P.; Rodríguez-Rodríguez, Y.; Rodríguez de Francisco, L.E.; Paíno-Perdomo, O.; Boluda, C.J. Lead, chromium, nickel, copper and zinc levels in Sargassum species reached the coasts of Dominican Republic during 2019: A preliminary evaluation for the use of algal biomass as fertilizer and animal feeding. Tecnol. Y Cienc. Del Agua 2021, 12, 124–163. [Google Scholar] [CrossRef]
- Hernández-Carmona, G.; Rodríguez-Montesinos, Y.E.; Arvizu-Higuera, D.L.; Reyes-Tisnado, R.; Murillo-Álvarez, J.I.; Muñoz-Ochoa, M. Technological Advance for Alginate Production in Mexico. Ing. Investig. Y Tecnol. 2012, 13, 155–168. [Google Scholar] [CrossRef][Green Version]
- Wooley, R.J.; Ruth, M.; Glassner, D.; Sheehan, J.; Ibsen, K. Lignocellulosic Biomass to Ethanol Process Design and Economics Utilizing Co-Current Dilute Acid Prehydrolysis and Enzymatic Hydrolysis Current and Futuristic Scenarios; Technical Report TP-580-26157; National Renewable Energy Laboratory (NREL): Golden, CO, USA, 1999. Available online: http://www.nrel.gov/docs/fy99osti/26157.pdf (accessed on 1 May 2024).
- Lopez-Arenas, T.; González-Contreras, M.; Anaya-Reza, O.; Sales-Cruz, M. Analysis of the fermentation strategy and its impact on the economics of the production process of PHB (polyhydroxybutyrate). Comput. Chem. Eng. 2017, 107, 140–150. [Google Scholar] [CrossRef]
- Anaya-Reza, O.; Lopez-Arenas, T. Design of a sustainable biorefinery for the production of lactic acid from sugarcane molasses. Rev. Mex. De Ing. Química 2018, 17, 243–259. [Google Scholar] [CrossRef]
- Seider, W.D.; Lewin, D.R.; Seader, J.D.; Widagdo, S.; Gani, R.; Ng, K.M. Product and Process Design Principles: Synthesis, Analysis and Evaluation, 4th ed.; John Wiley & Sons: Hoboken, NJ, USA, 2017. [Google Scholar]
- Wang, J.; Huang, J.; Liu, S. The production, recovery, and valorization of polyhydroxybutyrate (PHB) based on circular bioeconomy. Biotechnol. Adv. 2024, 72, 108340. [Google Scholar] [CrossRef] [PubMed]
- Rodríguez-Martínez, R.E.; Torres-Conde, E.G.; Jordán-Dahlgren, E. Pelagic Sargassum cleanup cost in Mexico. Ocean Coast. Manag. 2023, 237, 106542. [Google Scholar] [CrossRef]


Disclaimer/Publisher’s Note: The statements, opinions and data contained in all publications are solely those of the individual author(s) and contributor(s) and not of MDPI and/or the editor(s). MDPI and/or the editor(s) disclaim responsibility for any injury to people or property resulting from any ideas, methods, instructions or products referred to in the content. |
© 2025 by the authors. Licensee MDPI, Basel, Switzerland. This article is an open access article distributed under the terms and conditions of the Creative Commons Attribution (CC BY) license (https://creativecommons.org/licenses/by/4.0/).