Article

Unsteady Natural Convection and Entropy Generation in Thermally Stratified Trapezoidal Cavities: A Comparative Study

by
Md. Mahafujur Rahaman
1,2,*,
Sidhartha Bhowmick
1 and
Suvash C. Saha
3,*
1
Department of Mathematics, Jagannath University, Dhaka 1100, Bangladesh
2
Department of Computer Science and Engineering, Z. H. Sikder University of Science and Technology, Shariatpur 8024, Bangladesh
3
School of Mechanical and Mechatronic Engineering, University of Technology Sydney, Sydney, NSW 2007, Australia
*
Authors to whom correspondence should be addressed.
Processes 2025, 13(6), 1908; https://doi.org/10.3390/pr13061908
Submission received: 17 May 2025 / Revised: 9 June 2025 / Accepted: 13 June 2025 / Published: 16 June 2025

Abstract

:
This study numerically investigates unsteady natural convection (NC) heat transfer (HT) and entropy generation (Egen) in trapezoidal cavities filled with two thermally stratified fluids. Both air-filled and water-filled configurations are analyzed to evaluate and compare their thermal performance under varying conditions. The cavities are characterized by a heated base, thermally stratified sloped walls, and a cooled top wall. The governing equations are numerically solved using the finite volume (FV) approach. The study considers a Prandtl number (Pr) of 0.71 for air and 7.01 for water, Rayleigh numbers (Ra) ranging from 103 to 5 × 10⁷, and an aspect ratio (AR) of 0.5. Flow behavior is examined through various parameters, including temperature time series (TTS), average Nusselt number (Nu), average entropy generation (Eavg), average Bejan number (Beavg), and ecological coefficient of performance (ECOP). Three bifurcations are identified during the transition from steady to chaotic flow for both fluids. The first is a pitchfork bifurcation, occurring between Ra = 105 and 2 × 10⁵ for air, and between Ra = 9 × 10⁴ and 105 for water. The second, a Hopf bifurcation, is observed between Ra = 4.7 × 10⁵ and 4.8 × 10⁵ for air, and between Ra = 105 and 2 × 10⁵ for water. The third bifurcation marks the onset of chaotic flow, occurring between Ra = 3 × 10⁷ and 4 × 10⁷ for air, and between Ra = 4 × 10⁵ and 5 × 10⁵ for water. At Ra = 106, the average HT in the air-filled cavity is 85.35% higher than in the water-filled cavity, while Eavg is 94.54% greater in the air-filled cavity compared to water-filled cavity. At Ra = 106, the thermal performance of the cavity filled with water is 4.96% better than that of the air-filled cavity. These findings provide valuable insights for optimizing thermal systems using trapezoidal cavities and varying working fluids.

1. Introduction

Natural convection (NC), driven by temperature-induced density gradients in the absence of external forces, is a key heat transfer mechanism relevant to various engineering applications, including solar collectors [1], heat exchangers [2], building climate control [3], electronic cooling [4], and thermal energy storage [5,6]. Extensive research has focused on NC in diverse cavity geometries and boundary conditions through experimental and numerical methods to elucidate associated thermal and fluid dynamic behaviors. Bhowmick et al. [7] numerically investigated the onset of chaotic flow in a V-shaped cavity heated from below.
In both natural settings, such as the atmosphere and oceans, and in a variety of industrial applications, HT often occurs through NC within thermally stratified media. Despite its significant role in influencing heat transport processes, relatively few studies have addressed NC in stratified fluids. Pioneering work by Eichhorn and his collaborators [8,9,10] focused on NC heat transfer in fluids with uniform thermal characteristics, and suggested some analytical solutions for predicting HT from perpendicular plate in stratified environments. Angirasa and Srinivasan [11] explored NC over a uniformly heated wall embedded in a thermally stratified porous medium, highlighting the effect of stratification intensity on HT rates. Tripathi and Nath [12] conducted a numerical study of NC in a stratified fluid adjacent to a perpendicular isothermal boundary, revealing the impact of stratification on boundary layer development. Further studies [13,14,15] examined stratification effects across various geometries, including infinite vertical plates, vertical circular cones, and semi-infinite plates. Their analyses yielded analytical solutions for cases with a Pr of unity, as well as conditions involving sudden temperature changes and variable heat fluxes. Extending their earlier work, Shapiro and Fedorovich [16] investigated the influence of the Pr on NC in stratified fluids along vertical plates, employing a combination of analytical and numerical techniques.
In engineering systems, NC flows are often unsteady, motivating extensive studies on their transitional behavior in enclosures subjected to sudden thermal changes. Patterson and Imberger [17] provided foundational insights into unsteady NC in rectangular cavities, highlighting flow structure development, stratification effects, and the significance of dimensionless parameters, particularly the Rayleigh number (Ra), in characterizing flow regimes and HT. Kuhn and Oosthuizen [18] further examined transient convection under differential heating in rectangular enclosures. Beyond rectangular geometries, Lei et al. [19] used shadowgraph techniques to visualize time-dependent flow in a triangular cavity. Ma and Xu [20] investigated convective enhancement in non-uniformly heated enclosures at high Ra, focusing on HT performance and the influence of fin placement. Xu et al. [21] analyzed the role of fin thermal conductivity, comparing adiabatic and conductive fins, and demonstrated its impact on flow behavior and HT efficiency.
In many engineering and geophysical applications, enclosure geometries often deviate from standard shapes, making traditional triangular, square, or rectangular models insufficient for accurate analysis. Trapezoidal enclosures, characterized by sloped walls, pose greater challenges for studying NC compared to other complex geometries such as elliptical [22], eccentric [23,24], and inclined enclosures [25]. Pioneering research on NC heat transfer in trapezoidal enclosures was conducted by Iyican et al. [26,27], who provided both analytical and experimental insights. Subsequently, Kuyper and Hoogendoorn [28] revealed the influence of the inclination angles of uniformly heated walls and the influences of Rayleigh number on NC heat transfer within trapezoidal cavities. Moukalled and Darwish [29] numerically examined NC flow in a divided trapezoidal enclosure with a baffle attached to the base wall, revealing that escalating the baffle height and the Pr led to a decrease in HT. They later extended their work in [30] to examine NC flows within a trapezoidal cavity featuring a baffle attached to the top inclined wall. Basak et al. [31] studied NC in trapezoidal cavities with both uniformly and non-uniformly heated base surfaces, adiabatic top walls, and isothermal sloped sidewalls, finding that non-uniform heating had minimal impact on the overall HT rate. More recently, Rahaman et al. [32,33,34,35] comprehensively investigated natural convection HT within trapezoidal cavities under a variety of fluid characteristics and boundary conditions, further advancing understanding in this field.
A review of the existing literature reveals that most studies have primarily relied on the first law of thermodynamics to explore NC and HT performance through experimental and numerical models. However, Bejan [36] introduced an alternative perspective by employing the second law of thermodynamics to quantify irreversibility in fundamental heat transfer processes. He later formalized the concept of Egen minimization [37], emphasizing its potential in enhancing energy saving by analyzing the degradation of existing energy due to entropy production. In recent years, Egen minimization has emerged as a powerful approach for the thermodynamic efficiency of various thermal systems [38,39]. Researchers have applied this framework to classical natural convection problems, such as flow in rectangular cavities [40,41] with vertically heated and horizontally adiabatic walls, revealing the thermodynamic costs associated with thermal gradients and fluid friction. Further investigations in porous media [42,43,44,45] have explored the collective effects of HT and fluid friction (FF) irreversibilities on system performance. More recently, Rahaman et al. [46] studied the influence of AR on NC, HT, and Egen in trapezoidal cavities. Their results suggested that a rise in AR leads to a reduction in the overall thermal performance of the cavity, highlighting the relevance of geometric configuration in entropy-based analysis.
Analysis of the literature indicates that numerous studies have explored NC, HT, and Egen analysis in various cavity geometries using different analytical, numerical, and experimental methods. However, according to existing studies, a comprehensive comparative analysis of unsteady NC heat transfer and Egen in trapezoidal cavities filled with two thermally stratified fluids, incorporating a heated base, stratified inclined walls, and a cooled top wall has yet to be thoroughly investigated. To bridge this gap, the present study proposes a novel numerical investigation focusing on the unsteady behavior of NC heat transfer and Egen within such cavities. Both air-filled and water-filled configurations are analyzed to evaluate and compare their thermal performance under varying conditions. To ensure the reliability and accuracy of the numerical model, validation is performed through comparisons with previously published experimental and numerical results. The findings of this study have direct relevance to environmental fluid dynamics and the design of fluid flow systems.

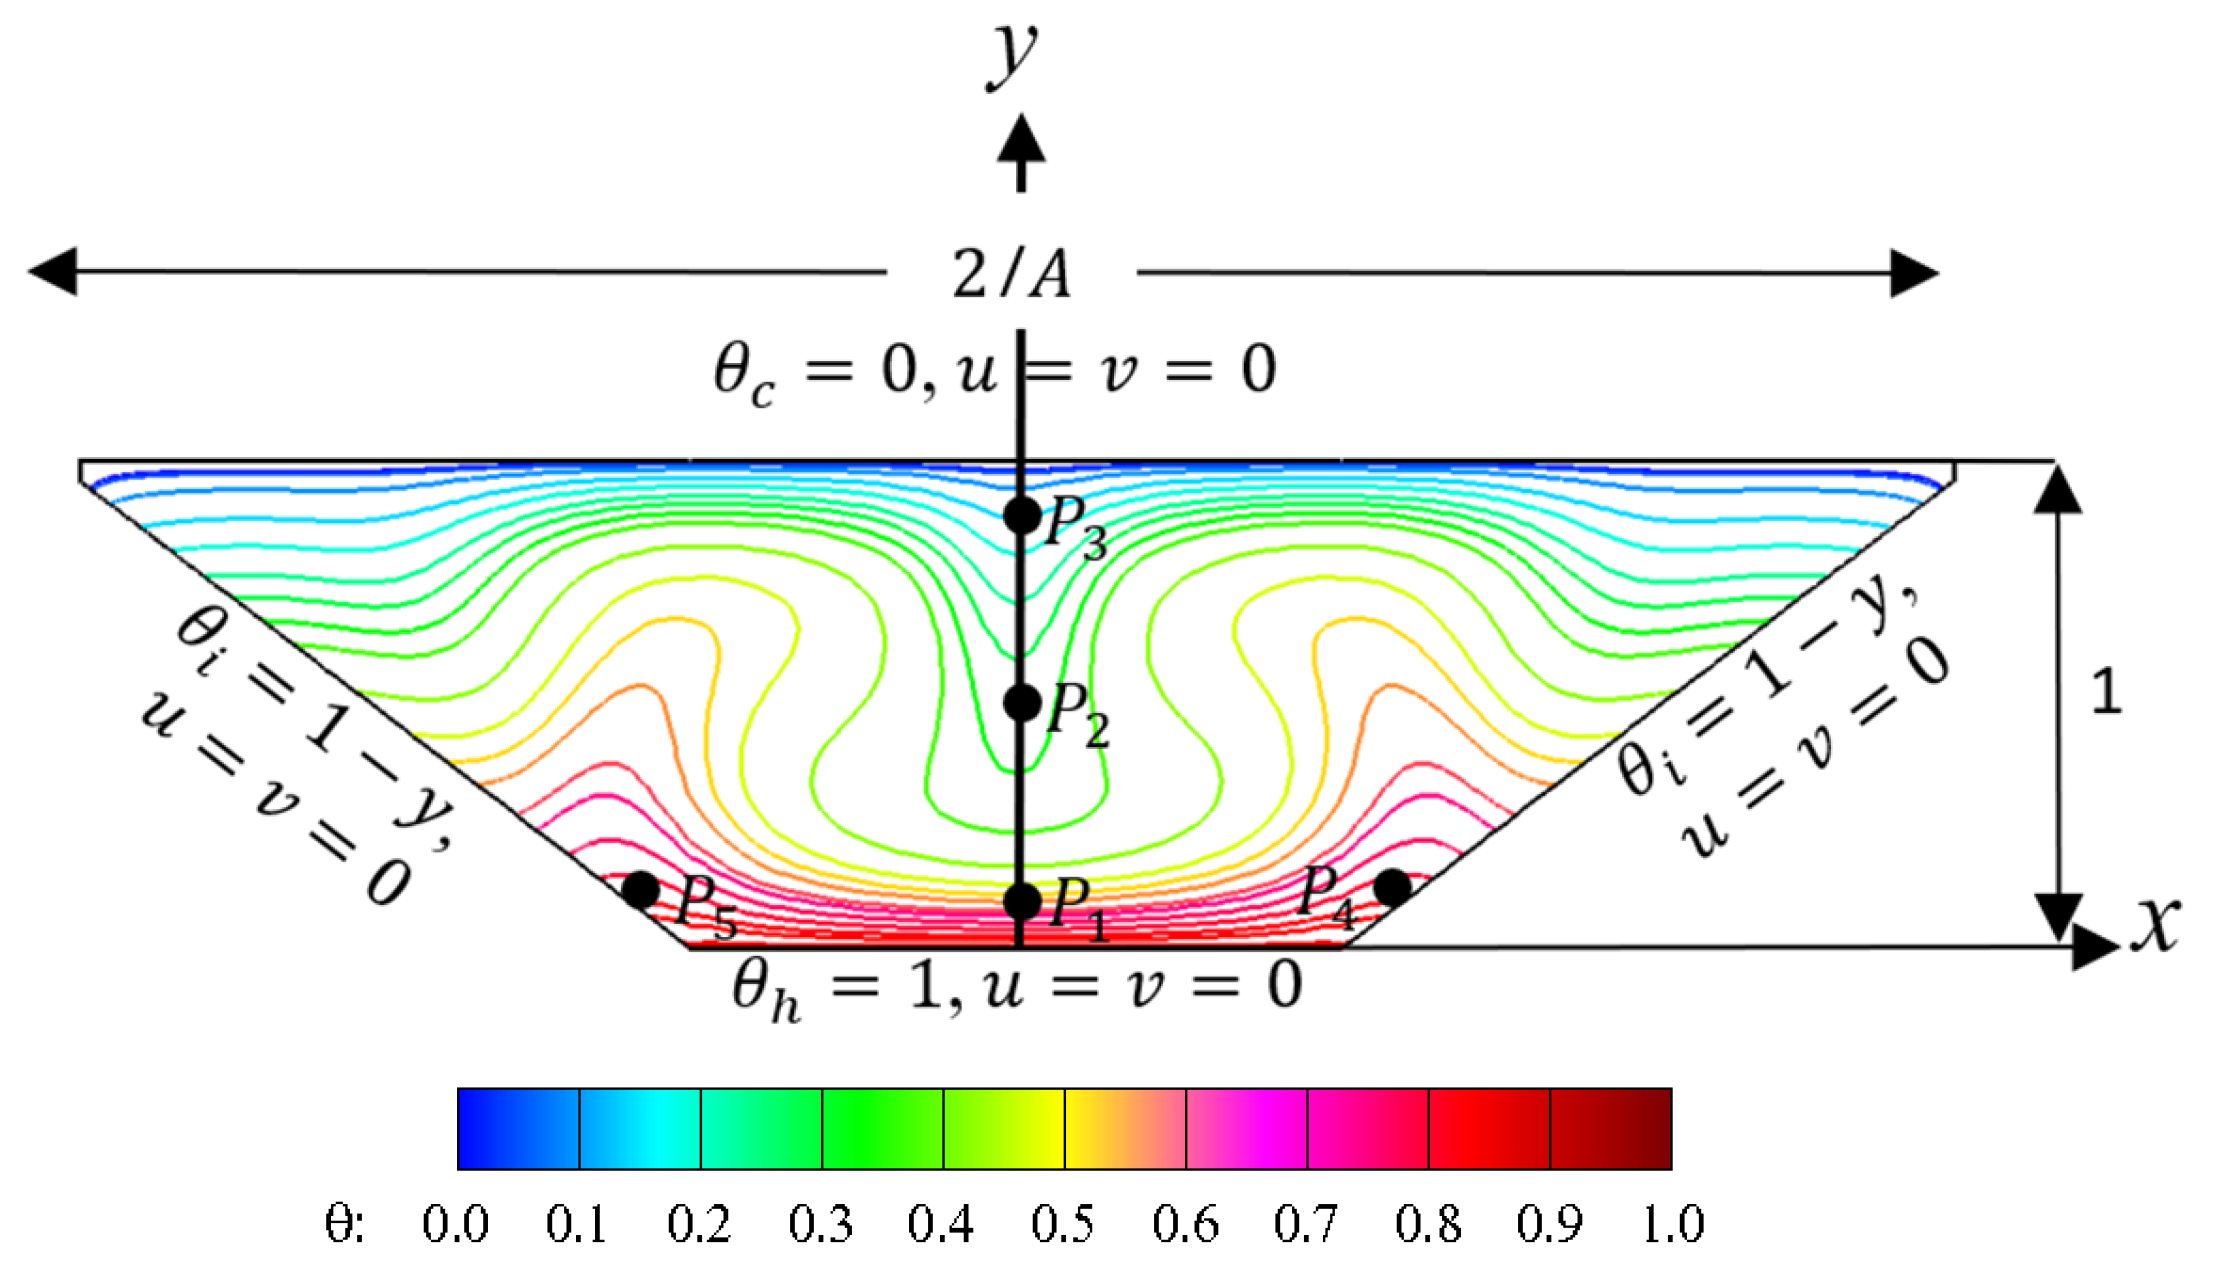
2. Mathematical Model Formulations

This research is mainly intended to analyze the influence of different fluids on unsteady NC heat transfer, Egen, and thermal performance inside trapezoidal cavities. For this purpose, a 2D numerical simulation methodology was used. A schematic of the physical domain and associated boundary conditions is illustrated in Figure 1. The cavities have a horizontal length of 2L and a vertical height of H, where L is equal to 2H, yielding an AR of 0.5. To mitigate the singularities typically encountered at the junction between the top and sloped walls, particularly where cold and heated boundaries meet, a minor geometric modification was applied. Such singularities are known to produce unrealistic local gradients and may hinder numerical convergence. In this study, approximately 4% of the material was removed from each of the upper corners, resulting in small tips represented by minuscule vertical tips in the diagram. This approach has been validated in several prior studies [46,47,48] and has been demonstrated to exert a negligible influence on the overall fluid flow and HT characteristics in the cavity. A comparison presented in Figure 3 demonstrates the minimal impact of this on natural convection flow. Initially, the air-filled and water-filled cavities are thermally stratified, with the minimum temperature, θc, at the top and the maximum temperature, θh, at the base of the cavities. The sloped walls are thermally stratified, with the maximum temperature located near the base wall and the minimum temperature adjacent to the top wall. Thermo-physical characteristics of the fluids are listed in Table 1. The boundary walls are immovable and non-slip.
This investigation centers on the examination and evaluation of 2D NC flows that occur within the enclosures characterized by trapezoidal configurations. The governing equations utilized in this study are provided below, incorporating the Boussinesq approximation as (refer to [48]):
  U X + V Y = 0
U t + U U X + V U Y = 1 ρ P X + ν 2 U X 2 + 2 U Y 2
V t + U V X + V V Y = 1 ρ P Y + ν 2 V X 2 + 2 V Y 2 + g β T T 0
T t + U T X + V T Y = κ 2 T X 2 + 2 T Y 2
The dimensionless variables that were employed are as follows:
  x = X H ,   y = Y H ,   u = U H κ R a 1 2 ,   v = V H κ R a 1 2 ,   p = P H 2 ρ κ 2 R a ,   θ = T T T h T c , τ = t κ R a 2 H 2 .
The analysis is governed by three controlling parameters: the AR, the Pr, and the Ra, defined as follows:
  A R = H L ,   P r = ν κ ,   and   R a = g β T h T c H 3 ν κ .
By substituting the above dimensionless variables, Equations (1)–(4) are transformed into the following form as follows (refer to [48]):
u x + v y = 0
u τ + u u x + v u y = p x + P r R a 1 2 2 u x 2 + 2 u y 2
v τ + u v x + v v y = p y + P r R a 1 2 2 v x 2 + 2 v y 2 + P r θ
θ τ + u θ x + v θ y = P r R a 1 2 2 θ x 2 + 2 θ y 2
In Equations (7) and (8), the variables x, y, u, v, p, τ, and θ demonstrate the non-dimensional forms of X, Y, U, V, P, t, and T, respectively.
The average Nusselt number (Nu) at the horizontal and sloped walls is defined as follows (refer to [46], for details):
N u = 1 l 0   1 θ y d x and   N u = 1 l 0   1 θ n d s
In a NC arrangement, thermodynamics irreversibility arises primarily from two mechanisms: HT and FF. The normalized local Egen corresponding to these processes can be expressed as follows (refer to [48] for details):
  E h t = θ x 2 + θ y 2 , E f f = φ 2 u x 2 + v y 2 + u y + v x 2 .
where Eht and Eff denote the local Egen arising from HT and FF. The irreversibility distribution ratio φ is defined as (refer to [48]):
φ = μ T k κ L Δ T 2
The local Egen inside the enclosure, denoted as El, is derived from the sum of Egen due to HT (Eht) and Egen due to FF (Eff) (refer to [48]):
  E l = E h t + E f f
The local Bejan number ( B e l ) is defined as follows [46]:
B e l = E h t E h t + E f f
The average Bejan number (Beavg) is defined as follows [46]:
B e a v g = 0 1 0 1 B e l   d x   d y 0 1 0 1 d x   d y  
The ecological coefficient of performance (ECOP) is defined as follows (refer to [48] for details):
E C O P = N u E a v g
In the present study, the finite volume (FV) based ANSYS fluent 17.0 software was employed to solve the governing Equations (7)–(10), together with the specified initial and boundary conditions. To solve Equations (7)–(10), the SIMPLE algorithm was utilized for pressure–velocity coupling. The advection terms were discretized by using the QUICK scheme. Central differencing scheme with second order accurate was applied to discretize the advection terms. Also, for the unsteady term a second order implicit time-marching scheme was used. The non-uniform 2D grid system was generated using the commercial software ICEM CFD 17.0. The iterative solutions were deemed converged when the absolute difference between successive iterations was less than 10−5. All numerical computations were carried out on a personal computer equipped with an Intel Core i7-12700K processor operating at a 3.6 GHz clock speed and 32 GB of RAM. The maximum computation time required for solving a single case was approximately 340 h, while the minimum was about 3 h. A flowchart of the SIMPLE scheme is presented in Figure 2.

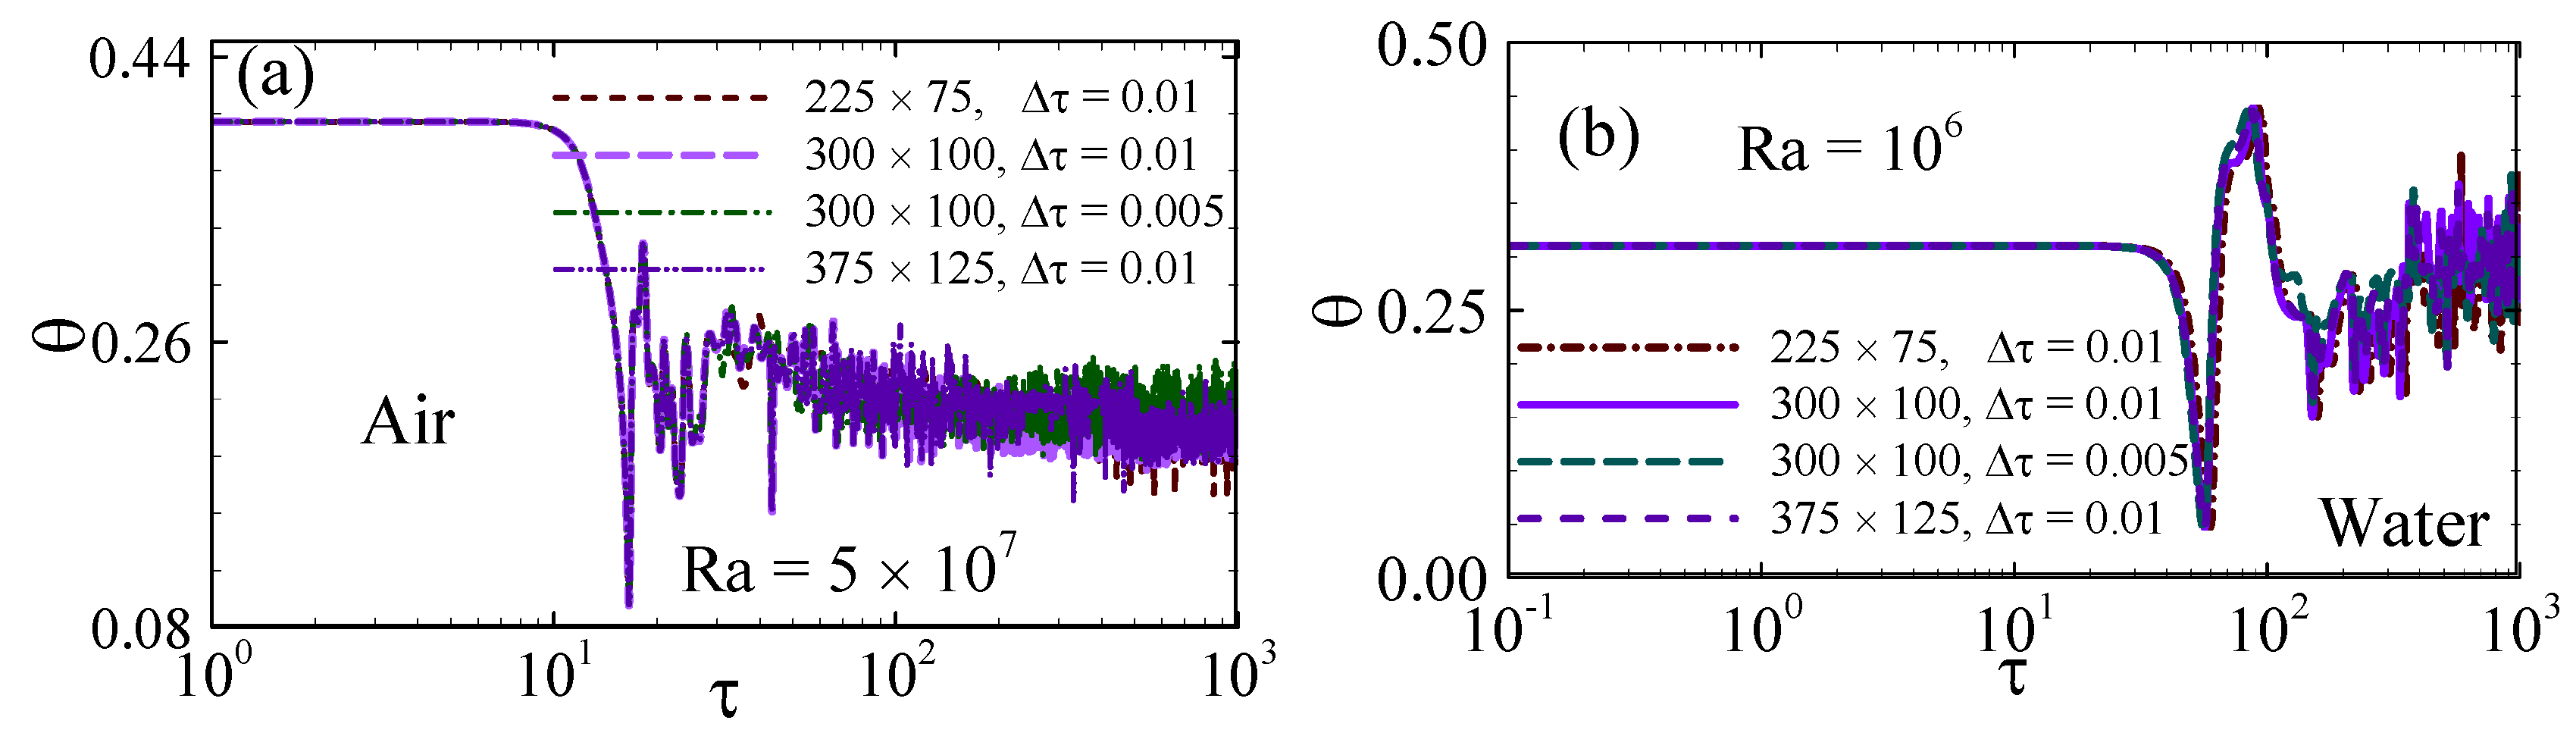
3. Grid Dependency Test

The grid resolution used in the computational domain plays a crucial role in determining the stability and accuracy of numerical results. To assess the sensitivity to grid size and time step, a comparative analysis was performed for the maximum Ra, under the hypothesis that the grid and time step optimized for this extreme Ra would remain adequate for cases with smaller Ra values. For this comparison, three symmetric grids (225 × 75, 300 × 100, and 375 × 125) and two time steps (0.01 and 0.005) were systematically selected. These grids were designed with finer grids along the boundaries and coarser grids in the central region. Specifically, in the 300 × 100 grid, the grid width increases by 3% per unit distance, ranging from 0.00075 near the wall to 0.0075 in the interior region. Figure 3 presents the time series of temperature at position P1 (0, 0.133), obtained using different grids and time steps for Ra = 5 × 10⁷ (air) and Ra = 106 (water). The recorded temperatures, derived from the various grids and time steps, show consistency during the initial period and slight divergence in the later stages. Additionally, Table 2 provides the time-averaged temperatures computed for the fully developed stage. The total variation in the results across all grid and time step configurations was found to be within an acceptable range, measuring less than 1% for cavities filled with both air and water. Consequently, a grid resolution of 300 × 100 and a time step of 0.01 were adopted for the present numerical model.
Figure 3. Grid and time step dependency test at point P1 (0, 0.133): (a) air-filled cavity for Ra = 5 × 10⁷, and (b) water-filled cavity for Ra = 106.
Processes 13 01908 g003

4. Validation

A qualitative validation of the present numerical results was performed by comparing them with the numerical data reported by Basak et al. [31], as shown in Figure 4. Basak et al. [31] investigated laminar NC heat transfer inside a trapezoidal cavity, where the base wall was uniformly heated, the vertical walls were kept at a fixed cold temperature, and the top wall was thermally insulated. For the comparison, dimensionless parameters were selected with Ra = 105, Pr = 0.71, and a tilt angle of ψ = 45°. This comparison demonstrates a remarkable consistency between the present findings and those described by Basak et al. [31].
Additionally, a quantitative validation was performed by comparing the current results with previously published numerical data [49] and experimental findings [27], as summarized in Table 3. This comparison was also based on dimensionless parameters, using Pr = 0.7, a Ra range from 103 and 107, and a slope angle of 90°. The strong correlation observed in these comparisons confirms the reliability of the present numerical approach in capturing transitional flow behavior within the enclosure. Therefore, the numerical method employed in this study can be regarded as a valid tool for analyzing complex unsteady flow structures in similar geometrical configurations.

5. Results and Discussions

This study presents a comparative analysis of transitional flow evolution within trapezoidal cavities filled with two different fluids. Numerical simulations were performed for Ra ranging from 103 to 5 × 10⁷, with Pr of 0.71 for air and 7.01 for water, and an AR of 0.5. The results classify the flow dynamics into three distinct regimes: symmetric, asymmetric, and unsteady flow. The aim of this investigation is to explore the conditions under which thermal performance is maximized for different working fluids, while also providing a foundation for future research focused on optimizing heat management in various applications.

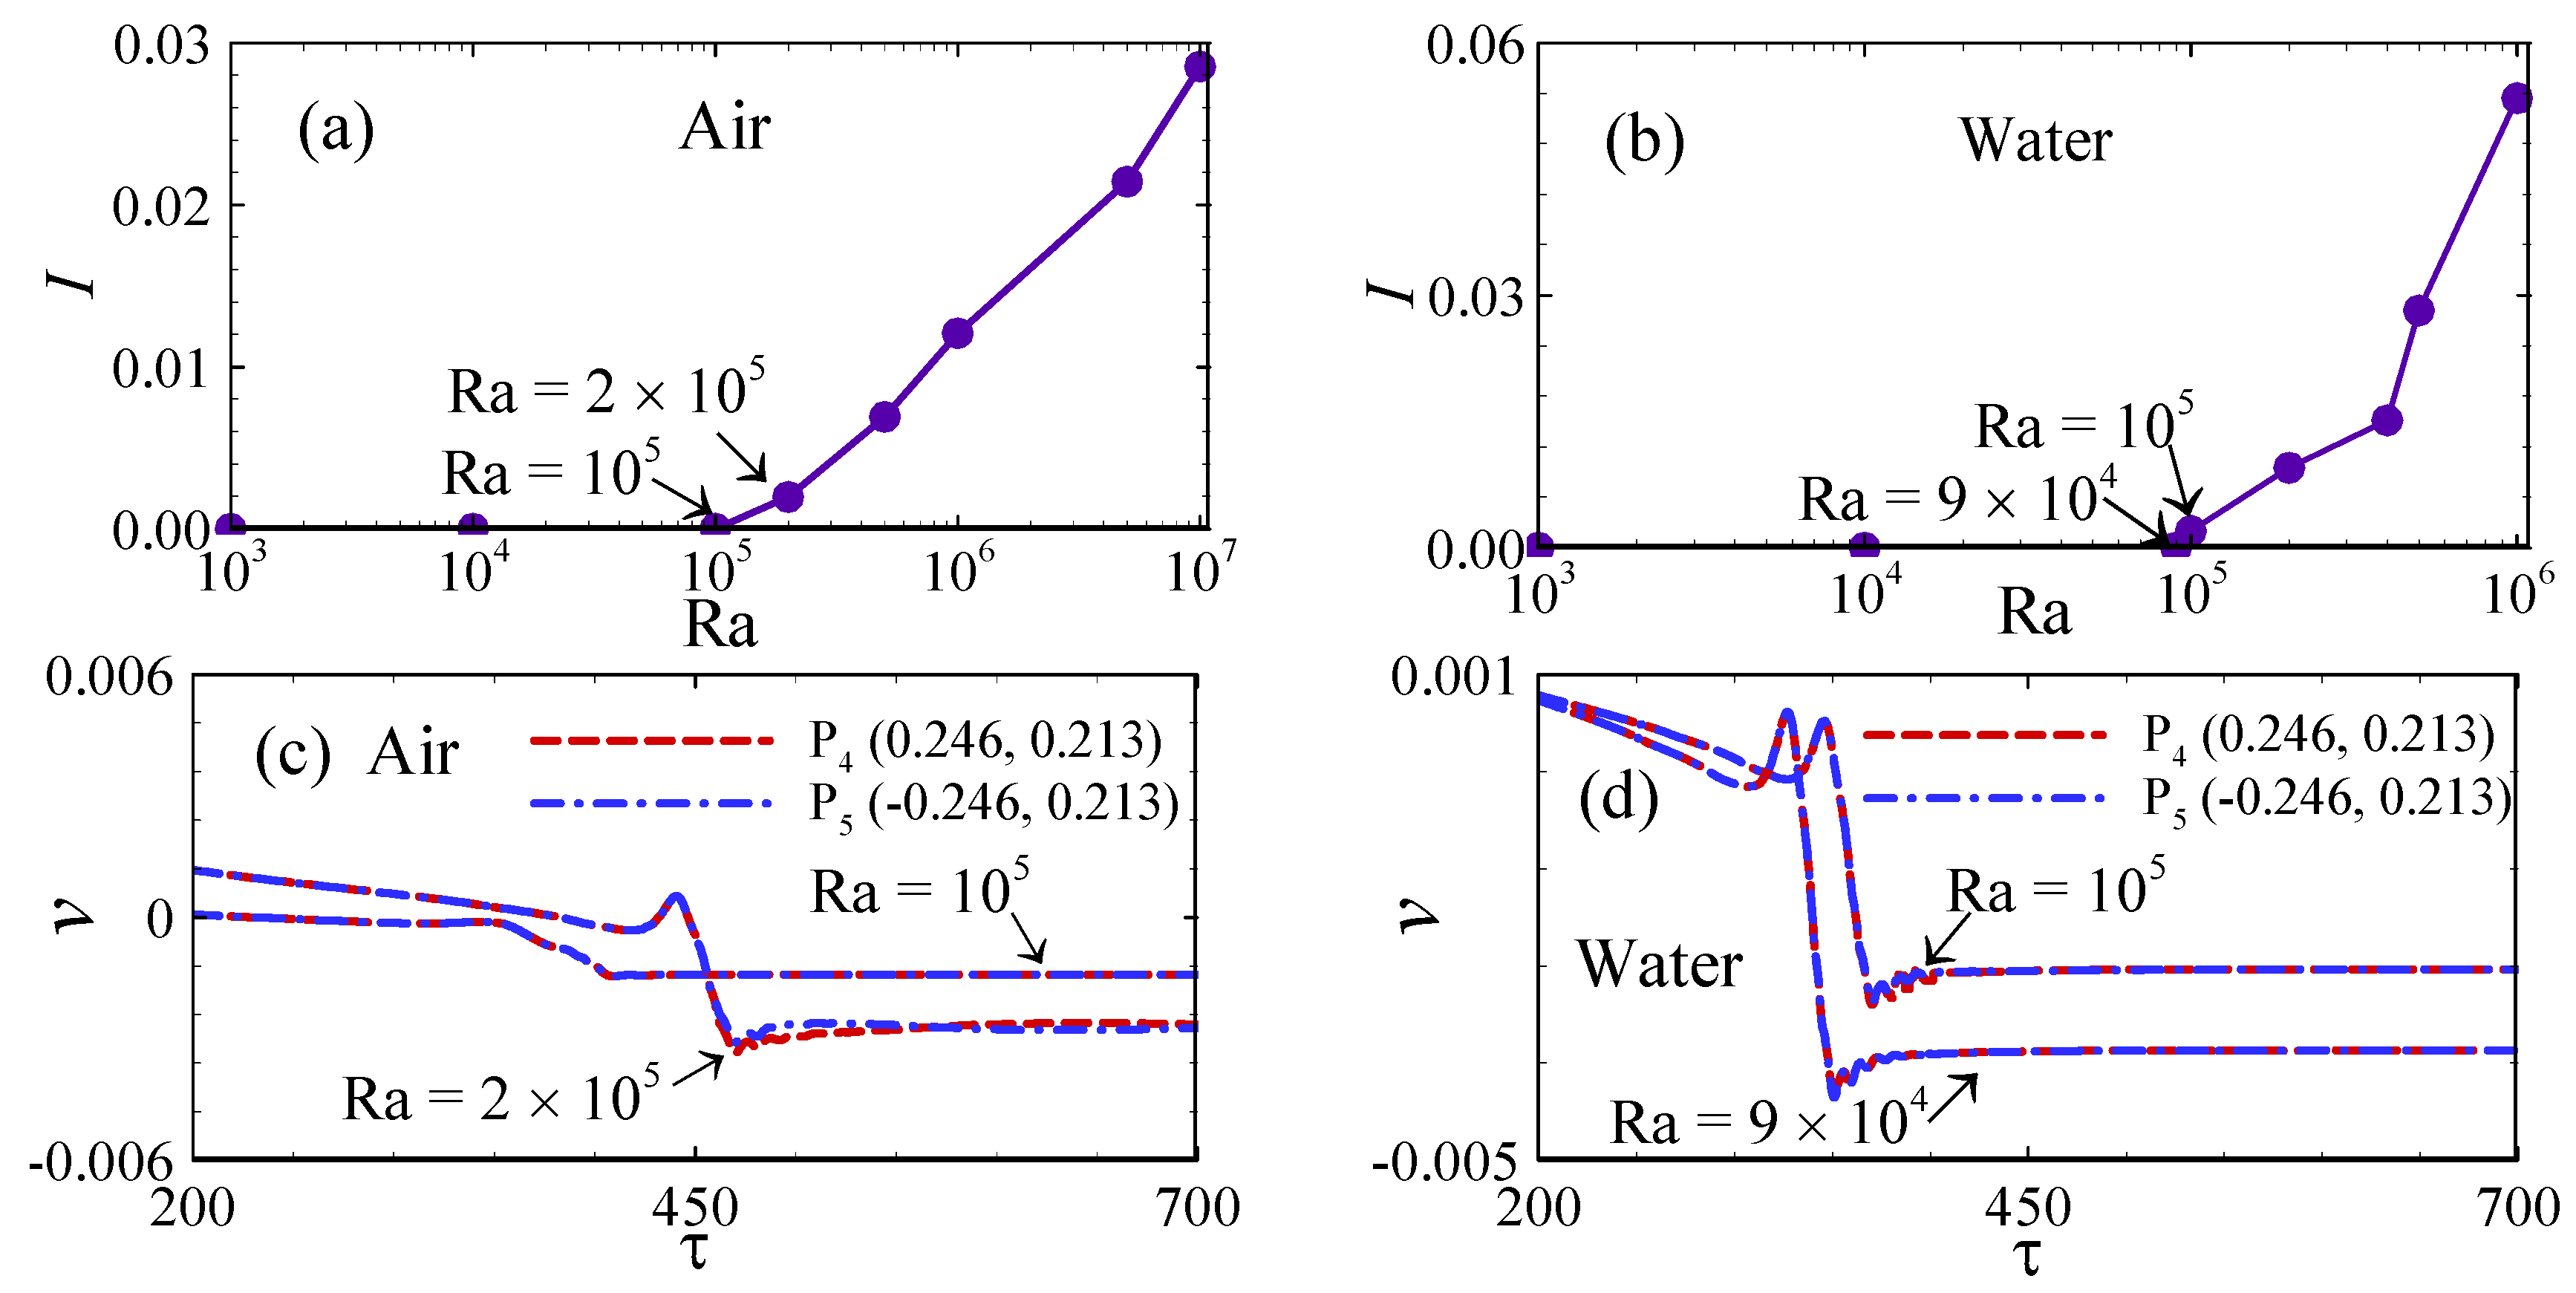
5.1. Transition from Symmetric to Asymmetric Flow

The results reveal a clear progression from steady-state behavior characterized by symmetric flow patterns to asymmetric configurations as the Ra increases. This transition is notably marked by the occurrence of a pitchfork bifurcation, signifying the onset of flow instability and a critical shift in fluid dynamics within the cavity.
To quantify the temperature discrepancies induced by the asymmetrical flow structures, the degree of asymmetry in the isotherms within the enclosure is evaluated using the following expression (for further details, refer to [50]:
  I = θ x ,   y θ x ,   y 2 d x d y 4 θ x ,   y 2 d x d y
A degree of asymmetry, denoted by I, with a value of zero indicates a steady, symmetrically reflective state. In contrast, a positive value of I signifies the emergence of an asymmetric state. The variation in I over a range of Ra from 103 to 106 is presented in Figure 5a,b. As shown in Figure 5a, I remains approximately zero up to Ra = 105 in the air-filled cavity, indicating symmetry. However, at Ra = 2 × 10⁵, I exhibits a significant increase, suggesting a transition from a symmetry to an asymmetry state. A similar trend is observed for the cavity filled with water, as depicted in Figure 5b. Here, I remains close to zero up to Ra = 9 × 10⁴, while a significant increase is observed at Ra = 105, again indicating the onset of asymmetry. Furthermore, it is evident from Figure 5a,b that I continues to rise with increasing Ra values, reinforcing the progressive development of asymmetry at higher thermal driving forces.
To demonstrate the occurrence of a pitchfork bifurcation, the TTS were analyzed at two symmetrically positioned points, P5 and P6. These investigations were conducted for Ra = 105 and 2 × 10⁵ in the air-filled enclosure, and for Ra = 9 × 10⁴ and 105 in the water-filled enclosure. As illustrated in Figure 5c for the air-filled enclosure, the TTS at Ra = 105 remain closely aligned over an extended period, indicating the persistence of symmetrical flow with respect to the enclosure’s mid-plane. Though, at Ra = 2 × 10⁵, a noticeable divergence in the TTS is observed. Specifically, within the time interval τ = 450 to 500, this divergence confirms the occurrence of a pitchfork bifurcation, signifying a transition from symmetric to asymmetric flow behavior. A similar pattern is observed in terms of the water-filled enclosure, as depicted in Figure 5d. Here, the TTS at Ra = 9 × 10⁴ exhibit close alignment, consistent with symmetric flow. In contrast, at Ra = 105, a clear deviation between the TTS emerges within the interval τ = 300 to 450, further confirming the onset of a pitchfork bifurcation and the associated symmetry-breaking transition.

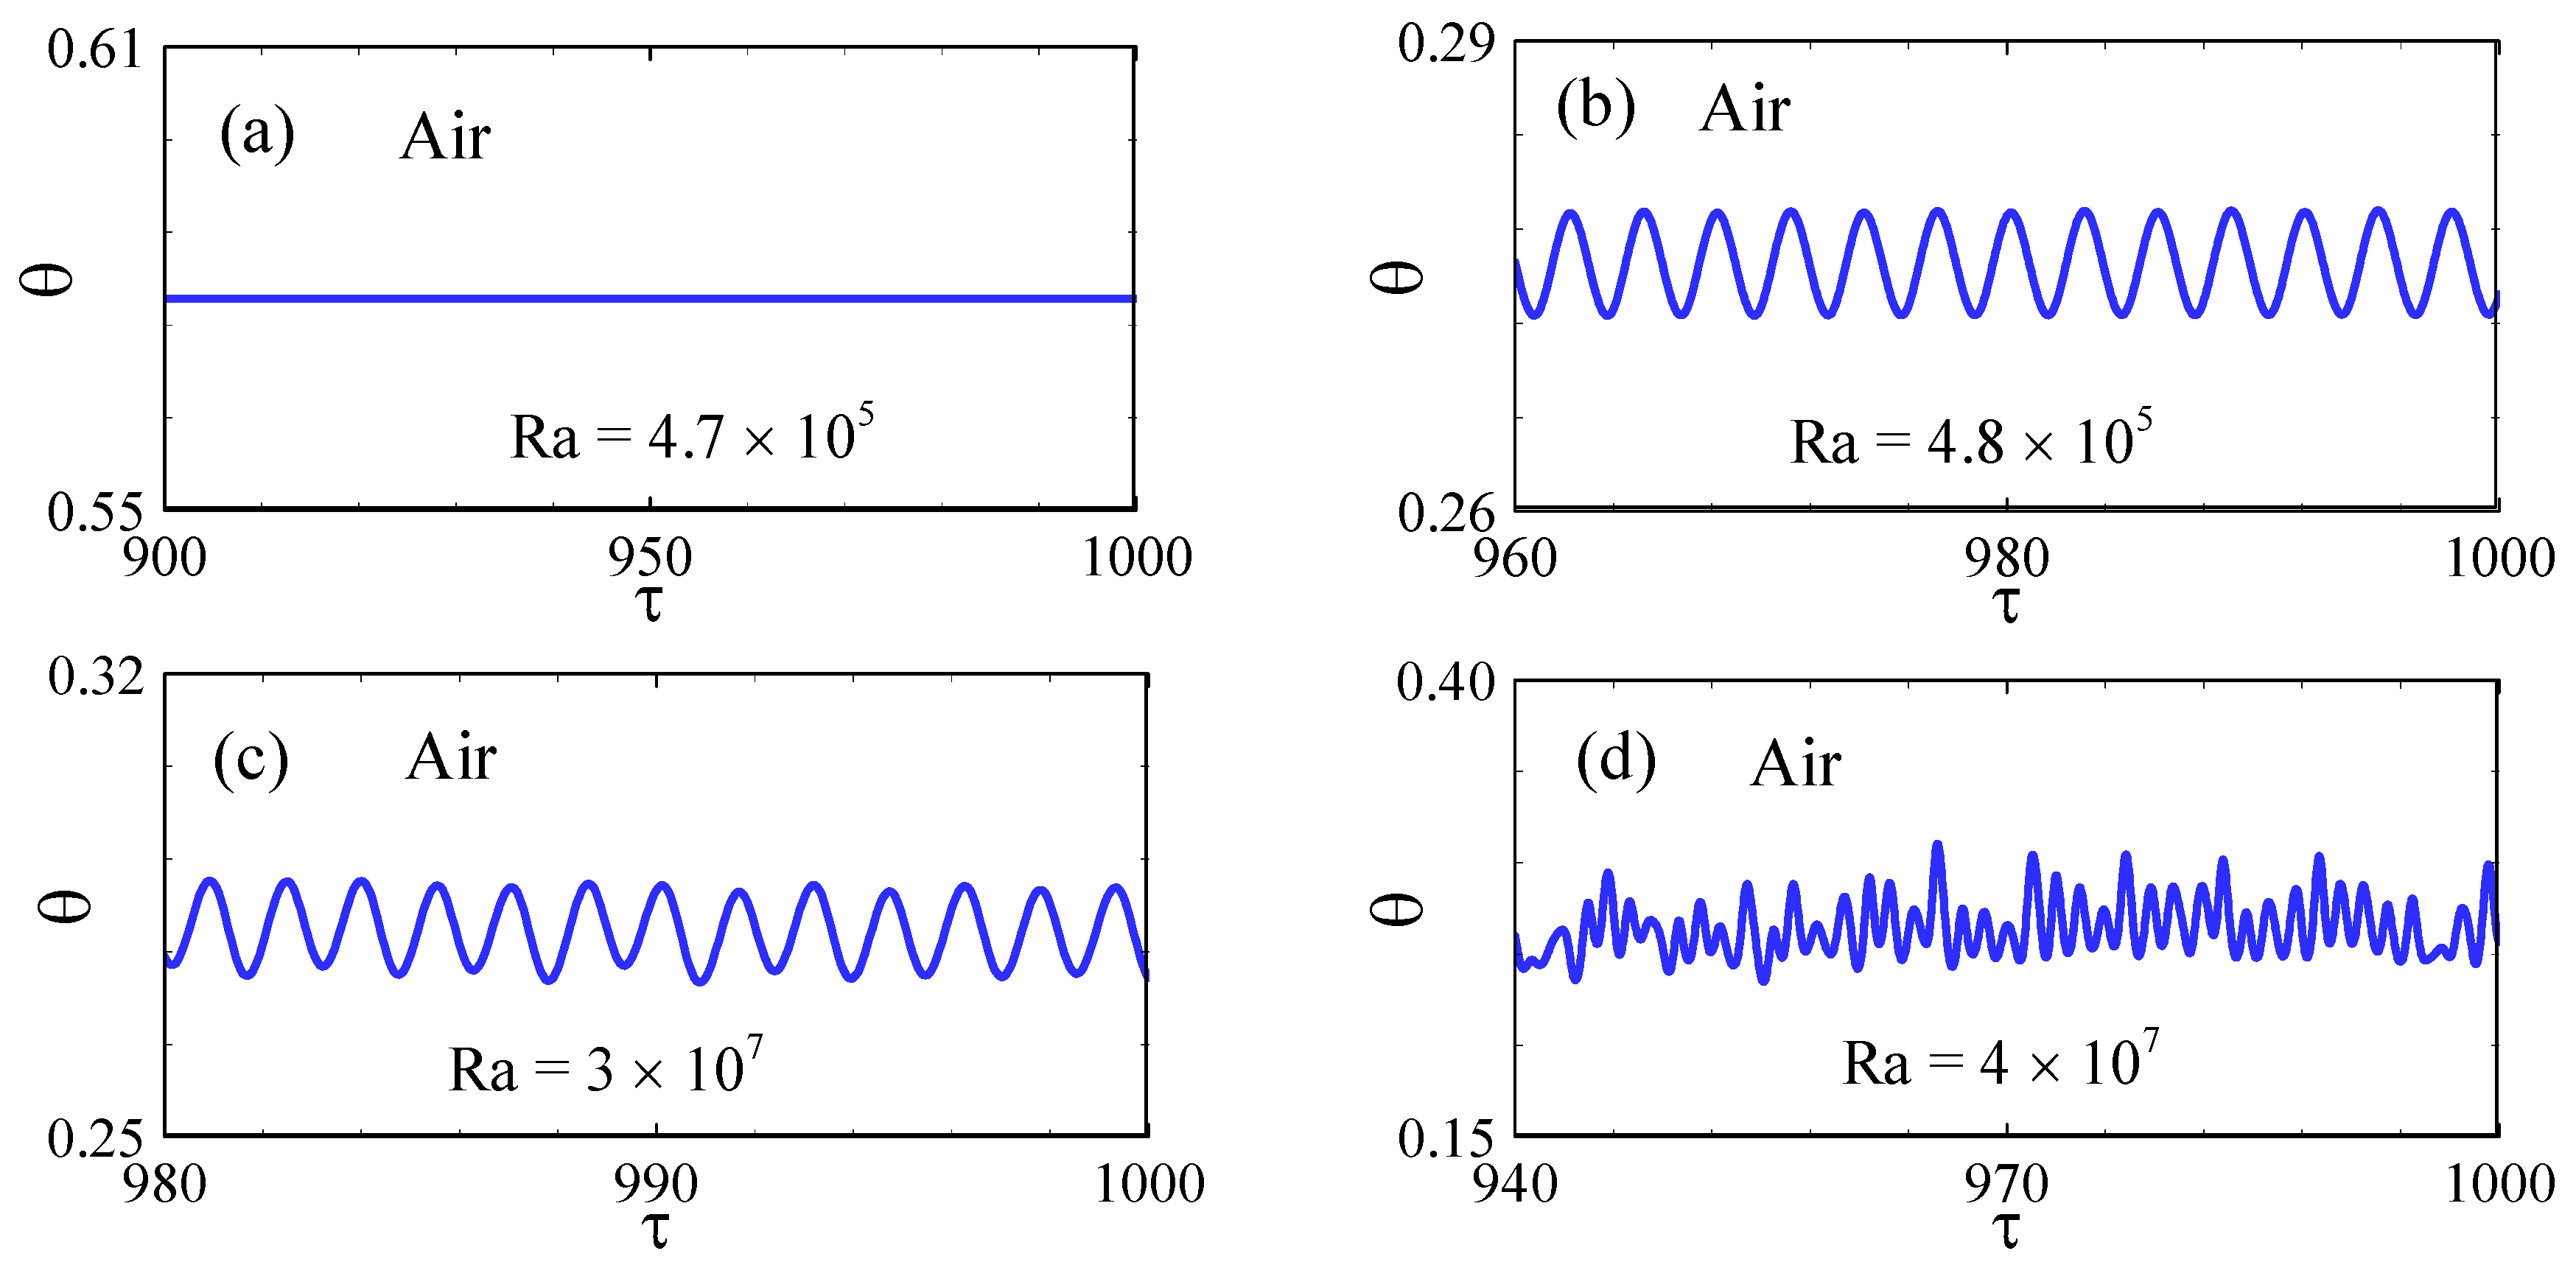
5.2. Transition from Steady to Chaotic Flow
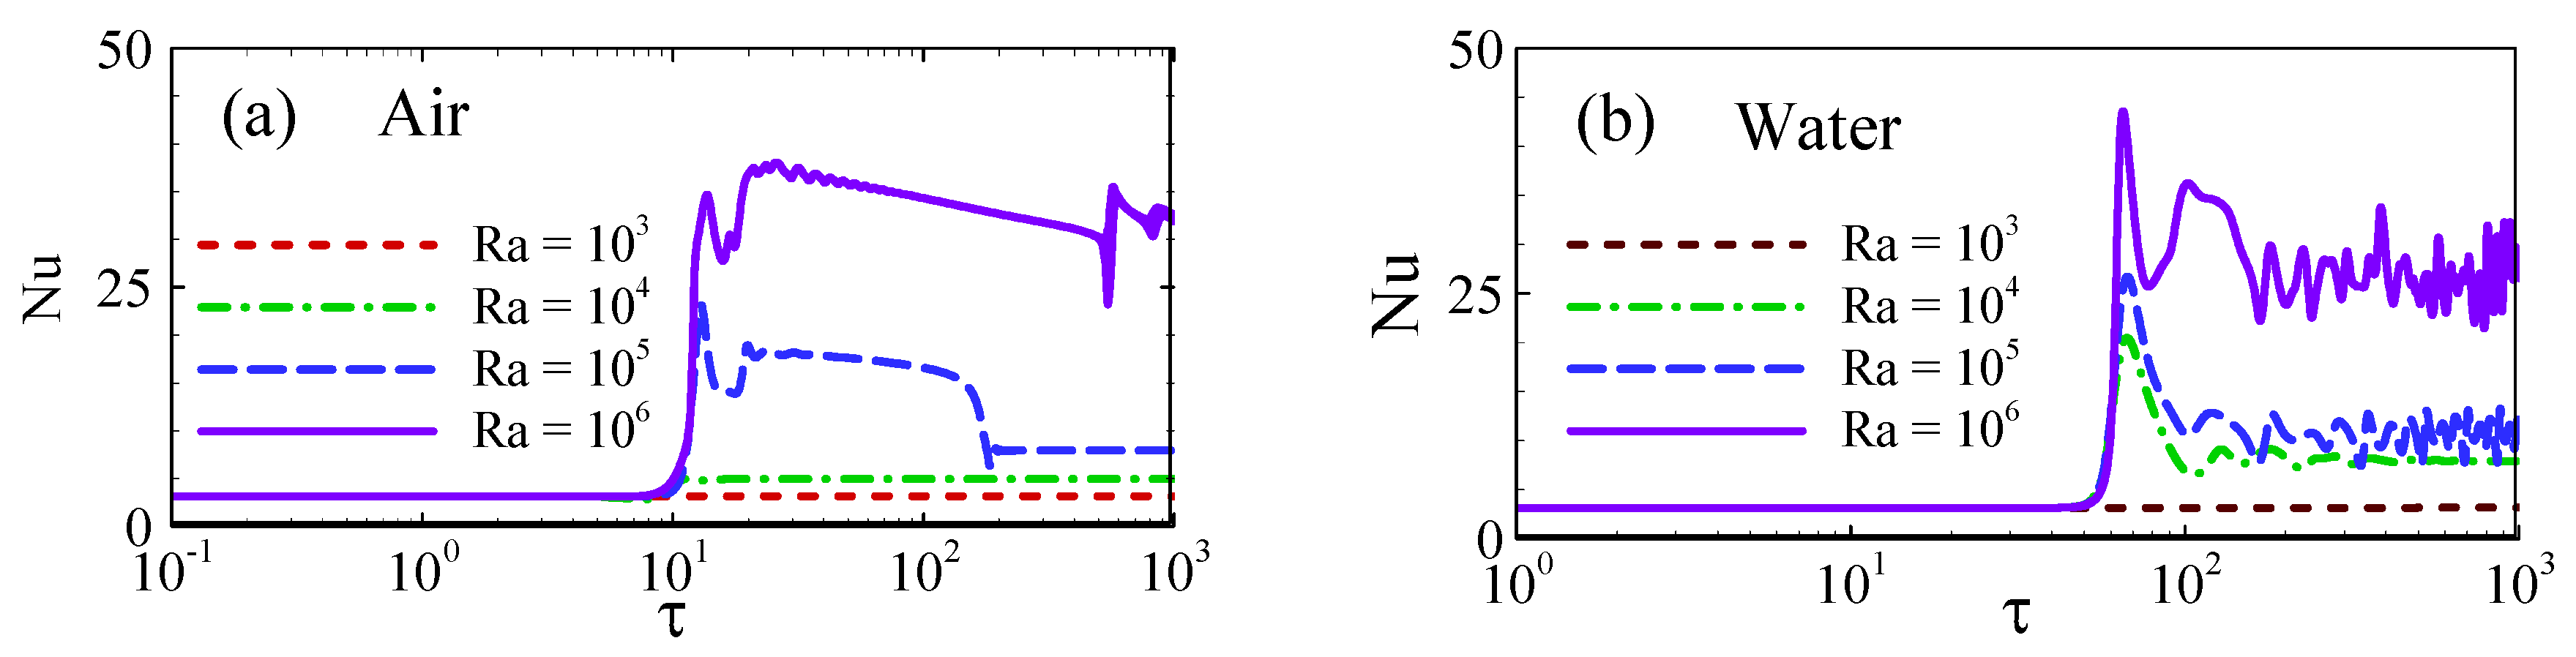
A dynamic transition from a symmetric to an asymmetric flow regime is identified within the trapezoidal cavities, as evidenced by the asymmetry index analysis and the y-velocity time series recorded at the geometrically symmetric points P4 (0.246, 0.213) and P5 (−0.246, 0.213). These measurements indicate that the transition from symmetry to asymmetry occurs at comparatively lower Rayleigh numbers in the enclosure filled with water than in the enclosure filled with air.
To further analyze the unsteady flow behavior, the TTS at the fully developed stage (FDS) are presented in Figure 6 and Figure 7. At this stage, the TTS at point P3 (0, 0.80) attains a steady state at Ra = 4.7 × 10⁵, as shown in Figure 6a. However, when the Ra is increased to 4.8 × 10⁵, the TTS display periodic oscillations, indicating the onset of a Hopf bifurcation within the interval between Ra = 4.7 × 10⁵ and 4.8 × 10⁵, as depicted in Figure 6b for the air-filled cavity. The emergence of this Hopf bifurcation signifies the development of oscillatory flow arising from the previously asymmetric steady state. The presence of this bifurcation has been further validated through spectral analysis of the TTS, as demonstrated in the author’s previous studies [47,48]. Notably, the periodic behavior persists up to Ra = 3 × 10⁷, as shown in Figure 6c, beyond which it transitions to chaotic flow at Ra = 4 × 10⁷, as illustrated in Figure 6d.
For the cavity filled with water, at the FDS, the TTS at point P3 (0, 0.80) attain a steady state at Ra = 105, as shown in Figure 7a. In contrast, when the Ra is increased to 2 × 10⁵, the TTS display periodic oscillations, indicating the occurrence of a Hopf bifurcation in the interval between Ra = 105 and 2 × 10⁵, as portrayed in Figure 7b. The emergence of this Hopf bifurcation signifies the development of oscillatory flow arising from an asymmetric state. This periodic behavior persists up to Ra = 4 × 10⁵, as depicted in Figure 7c, beyond which it transitions to chaotic flow at Ra = 5 × 10⁵, as demonstrated in Figure 7d. These observations indicate that the transitions from steady to periodic and from periodic to chaotic flow states occur at comparatively lower Ra values in the water-filled enclosure than in the air-filled enclosure.
To further elucidate the Hopf bifurcation and the onset of chaotic behavior, Figure 8 and Figure 9 present the phase-space trajectories in the v-θ plane at point P2 (0, 0.533) over the time interval τ = 700 and 1000. For the air-filled cavity, as depicted in Figure 8a, at a Ra of 4.7 × 10⁵, the trajectory converges to a static point (indicated by the blue rounded point). Conversely, Figure 8b illustrates the trajectory evolving into a closed limit cycle at Ra = 4.8 × 10⁵ (characterized by the blue trajectory). This changeover from a fixed point to a limit cycle attractor, as Ra increases from 4.7 × 10⁵ to 4.8 × 10⁵, confirms the occurrence of a Hopf bifurcation. The periodic behavior persists at Ra = 3 × 10⁷, as depicted in Figure 8c, while it disappears and transitions to chaotic flow at Ra = 4 × 10⁷, as shown in Figure 8d.
For the cavity filled with water, as demonstrated in Figure 9a, at Ra = 105, the trajectory approaches a static point (indicated by the purple circular point). Conversely, Figure 9b illustrates the trajectory transitioning to a closed limit cycle at Ra = 2 × 10⁵ (characterized by the purple trajectory). This shift from a fixed point to a limit cycle attractor as the Ra rises from 105 to 2 × 10⁵ marks the onset of a Hopf bifurcation. The periodic behavior persists up to Ra = 4 × 10⁵, as depicted in Figure 9c, while at Ra = 5 × 10⁵, the periodic behavior disappears and the flow becomes chaotic, as shown in Figure 9d.
The above analysis provides a comprehensive account of the critical transformations occurring within the cavities as thermal forcing increases. The results underscore the sensitivity of flow dynamics to variations in Ra and demonstrate the progression from stable convection to complex chaotic behavior through successive bifurcations. A detailed examination of these dynamics offers valuable insights into the nature of convection within geometrically confined spaces, thereby contributing to a broader understanding of fluid mechanics and HT processes. The transition from stable to chaotic flow, driven by various bifurcations, highlights the intricate interplay between thermal driving forces and fluid response, a key consideration for predicting and managing flow behaviors in engineering applications.
A summary is presented in Table 4, that outlines the transition points between different flow regimes, specifically, steady, periodic, and chaotic flows.

5.3. Heat Transfer

Convective HT plays a dominant role in the thermal transport processes in the trapezoidal cavities, particularly during the transitional phase of fluid flow. The onset of asymmetrical oscillations and vortex formation significantly enhances fluid mixing, thereby facilitating more efficient convective HT. To quantify the effectiveness of this mechanism, the average Nu is employed, representing the ratio of convective to conductive HT in the fluid. Figure 10 demonstrates time series of the Nu at the bottom wall, serving as an indicator of the HT rate through the cavity’s wall. The Nu is defined in Equation (11), and the observed HT behavior provides critical insights into the underlying thermal dynamics. For Ra = 103, the Nu is 3.166 for both the air-filled and water-filled cavities. However, at Ra = 106, the Nu increases to 32.098 for the air-filled cavity, while it reaches 25.858 for the water-filled cavity. Consequently, at Ra = 106, the HT rate in the air-filled cavity is 24.13% greater than that in the water-filled cavity.
The variation in average HT within the cavities with respect to Ra values for both air and water is shown in Figure 11. For Ra = 103, the average HT from the air-filled cavity is 2.84, while the average HT from the water-filled cavity is 2.83. Thus, at Ra = 103, the HT rate is nearly identical for both fluids. However, at Ra = 106, the average HT from the air-filled cavity increases to 27.79, while it is 14.9935 in the water-filled cavity. Therefore, at Ra = 106, the average HT in the air-filled cavity is 85.35% higher than that in the water-filled cavity.

5.4. Entropy Generation Analysis

In this section, the average energy generation (Eavg) within the cavities for different fluids is investigated, as illustrated in Figure 12. At lower Ra values, the influence of buoyancy forces is minimal, and the flow remains steady. Under these conditions, conductive HT dominates the thermal transport process, and thus, conduction effects primarily govern both the fluid motion and the associated energy generation (Egen).
As the Ra increases, buoyancy-driven convection becomes progressively more dominant, resulting in enhanced fluid motion and a corresponding increase in Egen. From the authors’ previous study [46,48], it is evident that for Ra values up to 105, the contours of local Egen closely resemble those of Egen due to the HT. This suggests that for Ra values up to 105, Egen due to FF is less substantial, and the fluid flow is predominately influenced by Egen due to HT. In contrast, at higher Ra values, particularly at Ra = 106, the contours of local Egen closely match those of Egen due to FF. This shift suggests that, at this higher Ra value, frictional forces become the primary contributor to Egen. The intensified flow dynamics at this higher Ra value leads to greater viscous dissipation, thereby amplifying the role of FF-induced Egen relative to HT. At Ra = 106, the Eavg within the air-filled enclosure is 139.29, while in the water-filled enclosure it is 71.5994. This indicates that fluid friction irreversibilities are significantly higher in the air-filled enclosure compared to the water-filled enclosure. Accordingly, at Ra = 106, the Eavg in the air-filled enclosure is 94.54% greater than that in the water-filled enclosure.
A clear inverse relationship is observed between the Beavg and the Ra value, with Beavg decreasing as Ra increases. The highest value of Beavg (Beavg, max ≈ 1) is recorded under conditions where Egen is predominantly attributed to irreversibilities due to HT. This indicates that, at lower Ra values, thermal diffusion remains the dominant mechanism governing entropy production. As Ra increases, the declines in Beavg signifies the growing influence of FF on the overall Egen. As illustrated in Figure 13, for Ra values ranging from 103 to 105, Beavg consistently exceeds 0.5. This indicates that, within this range, irreversibilities due to HT contribute more significantly to Egen than those due to FF. Conversely, at the higher Ra value of 106, Beavg falls below 0.5, signaling a transition in the dominant source of Egen, where viscous effects associated with FF become more substantial than those arising from thermal gradients. For Ra = 103, the average HT from the air-filled cavity is 2.84, while the average HT from the water-filled cavity is 2.83. Thus, at Ra = 103, the Beavg is nearly identical for both the air-filled and water-filled cavities. However, at Ra = 106, the Beavg decreases to 0.36 in the air-filled cavity and to 0.286 in the water-filled cavity. Therefore, at Ra = 106, the Beavg in the water-filled cavity is 20.56% lower than that in the air-filled cavity.
The analysis of ECOP, which reflects the thermal performance in the computational domain, is presented in terms of Ra for both air-filled and water-filled cavities, as illustrated in Figure 14. A higher ECOP value suggests a decrease in the system’s entropy generation, signifying improved thermal efficiency, whereas a smaller ECOP value reflects a reduction in HT efficiency due to increased thermal convection. The results demonstrate that the magnitude of ECOP diminishes as the Ra value increases. The highest ECOP value of 0.95302 is observed at the lowest Ra of 103 in the cavity filled with air, while the corresponding highest ECOP value in the water-filled cavity is 0.78515. This suggests that, at Ra = 103, thermal efficiency is 21.38% higher in the air-filled cavity compared to the water-filled one. However, at Ra = 105, the thermal efficiency of the water-filled cavity exceeds that of the air-filled cavity by 7.11%. For Ra = 106, the efficiency remains 4.96% greater in the enclosure filled with water than the enclosure filled with air. These findings suggest that, with increasing Ra, thermal performance improves more significantly in the water-filled enclosure than in the air-filled enclosure.

6. Conclusions

In this study, CFD method was employed to rigorously investigate transitional two-dimensional NC flows within trapezoidal cavities filled with two thermally stratified fluids, with a heated base, thermally stratified inclined walls, and a cooled top wall. Simulations were performed over a Ra range from 103 to 5 × 10⁷, considering Prandtl numbers of 0.71 for air and 7.1 for water, with an AR of 0.5. The results provide detailed insights into the flow dynamics and thermal performance in both the air-filled and water-filled cavities, demonstrating a clear dependence of HT efficiency and Egen analysis on both the working fluids and the Ra.
The key outcomes are outlined as follows:
  • The transition from symmetric to asymmetric, steady to periodic, and periodic to chaotic states were analyzed for both air-filled and water-filled cavities. All these transitions were observed to occur at comparatively lower Ra values in the water-filled enclosure than in the air-filled one.
  • Transition from a symmetric to an asymmetric state occurs in the air-filled cavity between the Ra values of Ra = 105 and 2 × 10⁵, and in the water-filled cavity between Ra = 9 × 10⁴ and 105.
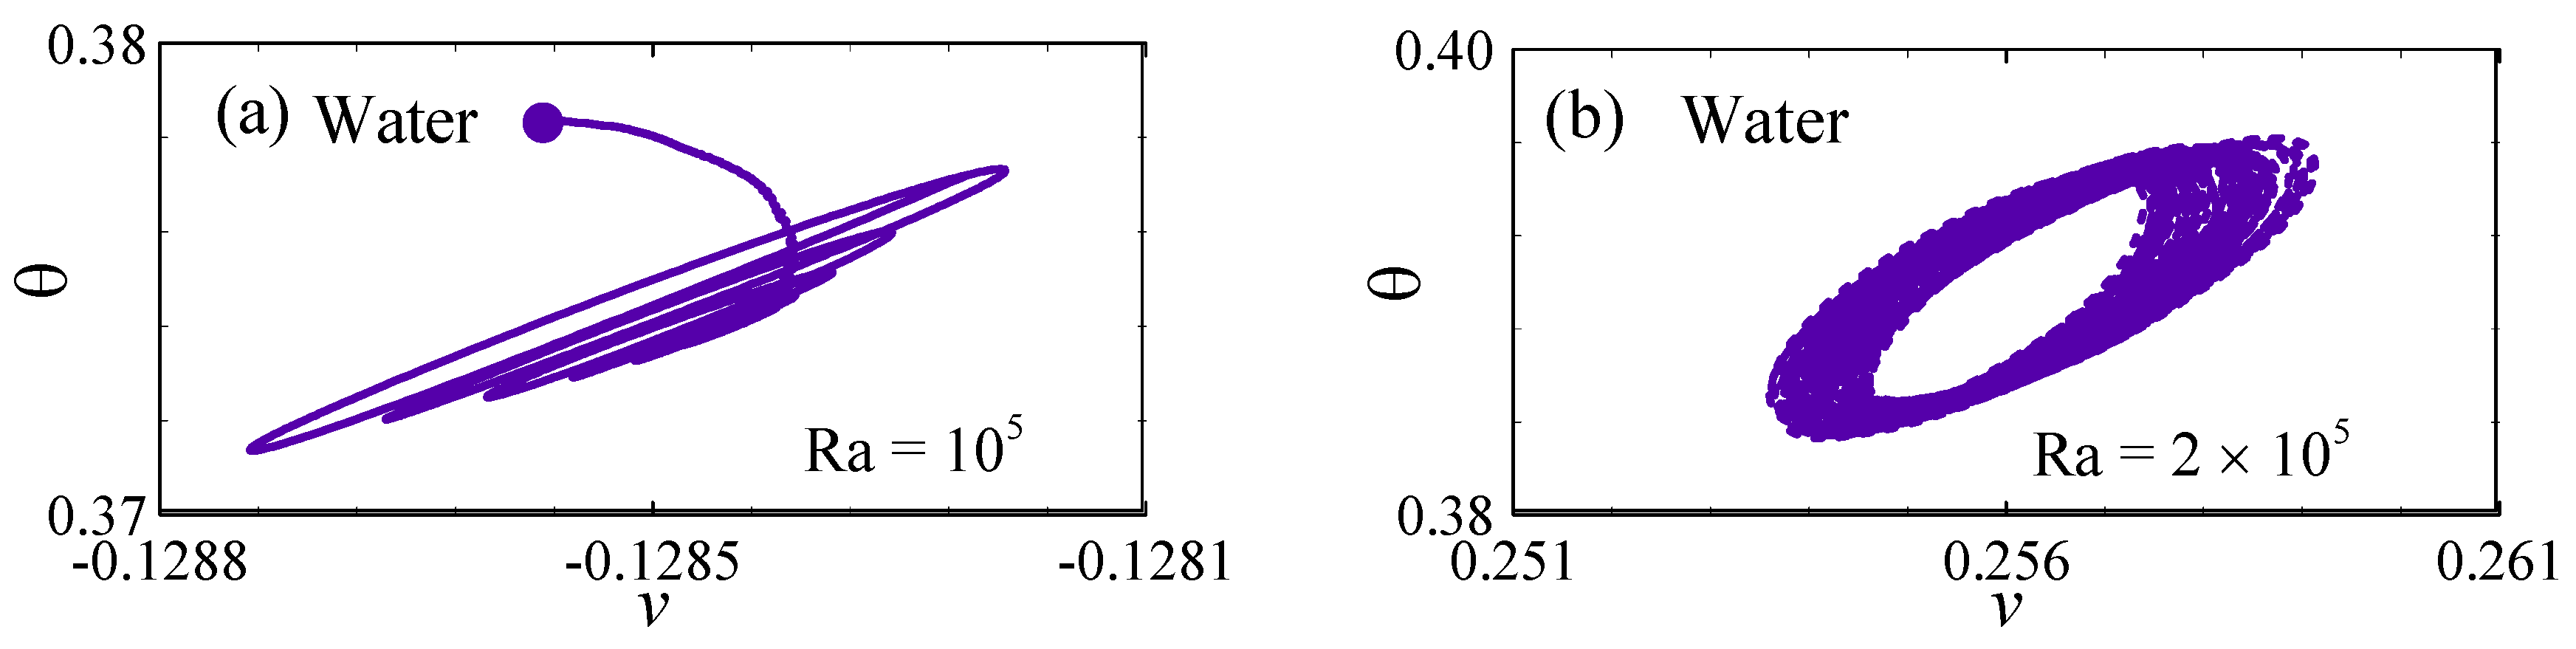
  • Transition from a steady to a periodic state occurs in the air-filled cavity between the Ra values of Ra = 4.8 × 10⁵ and 3 × 10⁷, and in the water-filled cavity between Ra = 2 × 10⁵ and 4 × 10⁵.
  • Transition from a periodic to a chaotic state occurs in the air-filled cavity between the Ra values of Ra = 3 × 10⁷ and 4 × 10⁷, and in the water-filled cavity between Ra = 4 × 10⁵ and 5 × 10⁵.
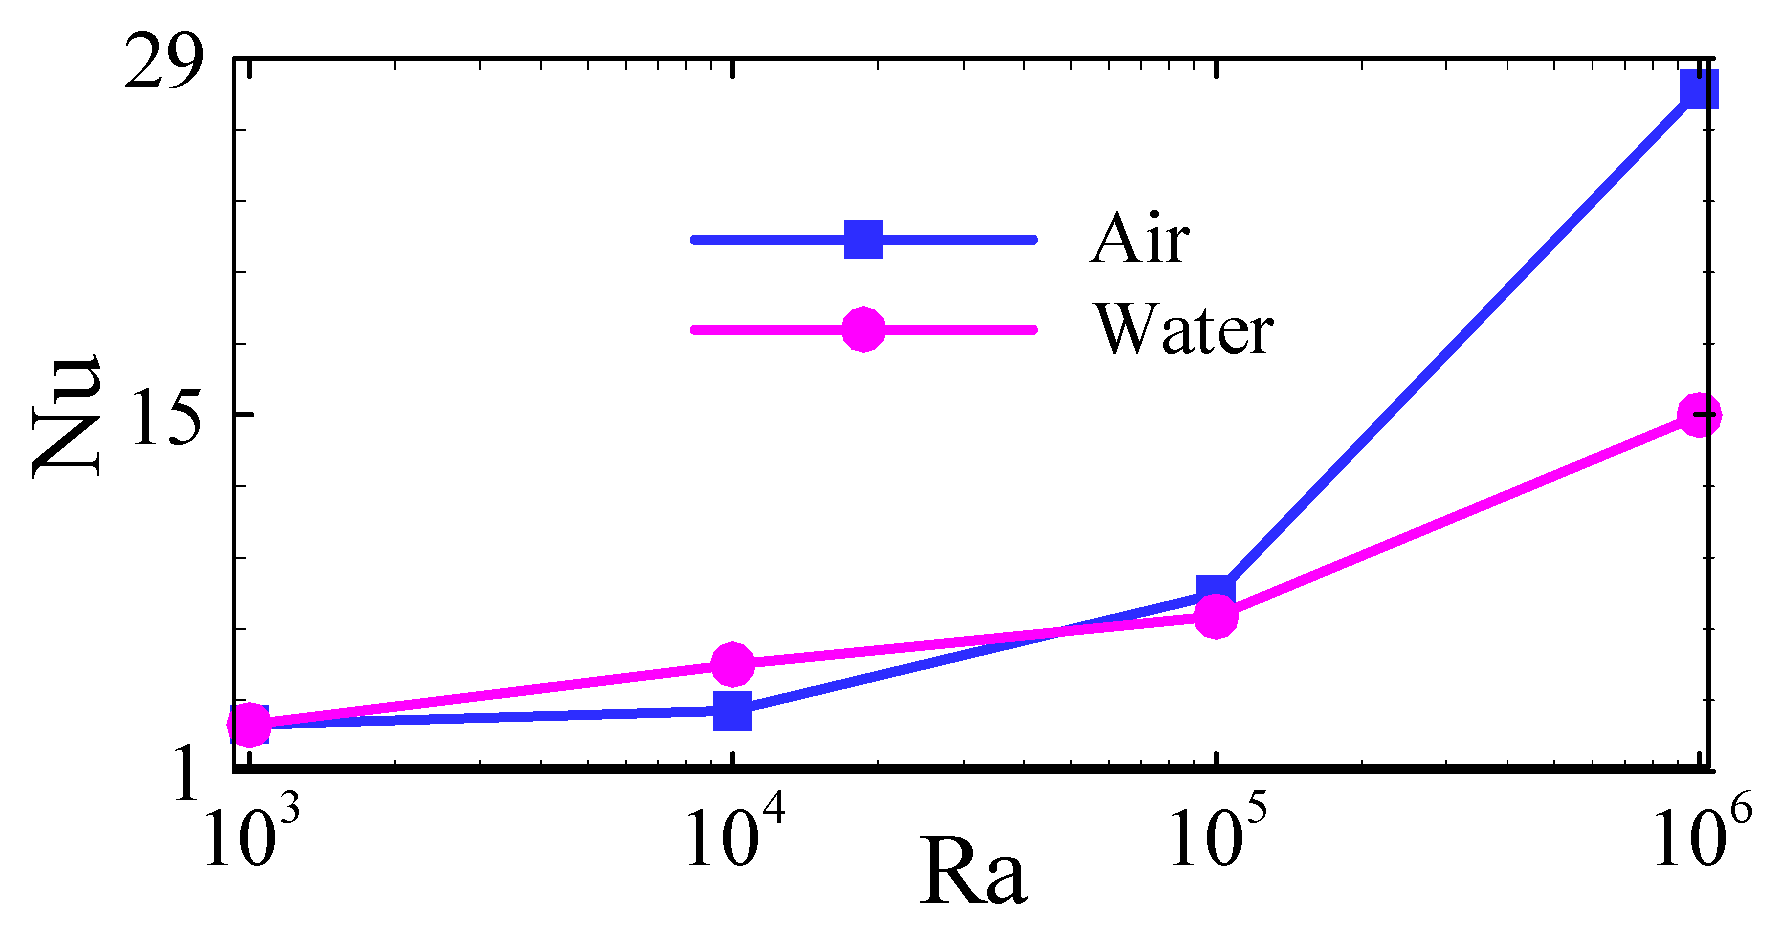
  • At Ra = 106, the HT rate at the bottom wall is 24.13% higher in the air-filled cavity than in the water-filled cavity.
  • At Ra = 106, the average HT from the entire cavity is 85.35% greater in the air-filled enclosure than in the water-filled one.
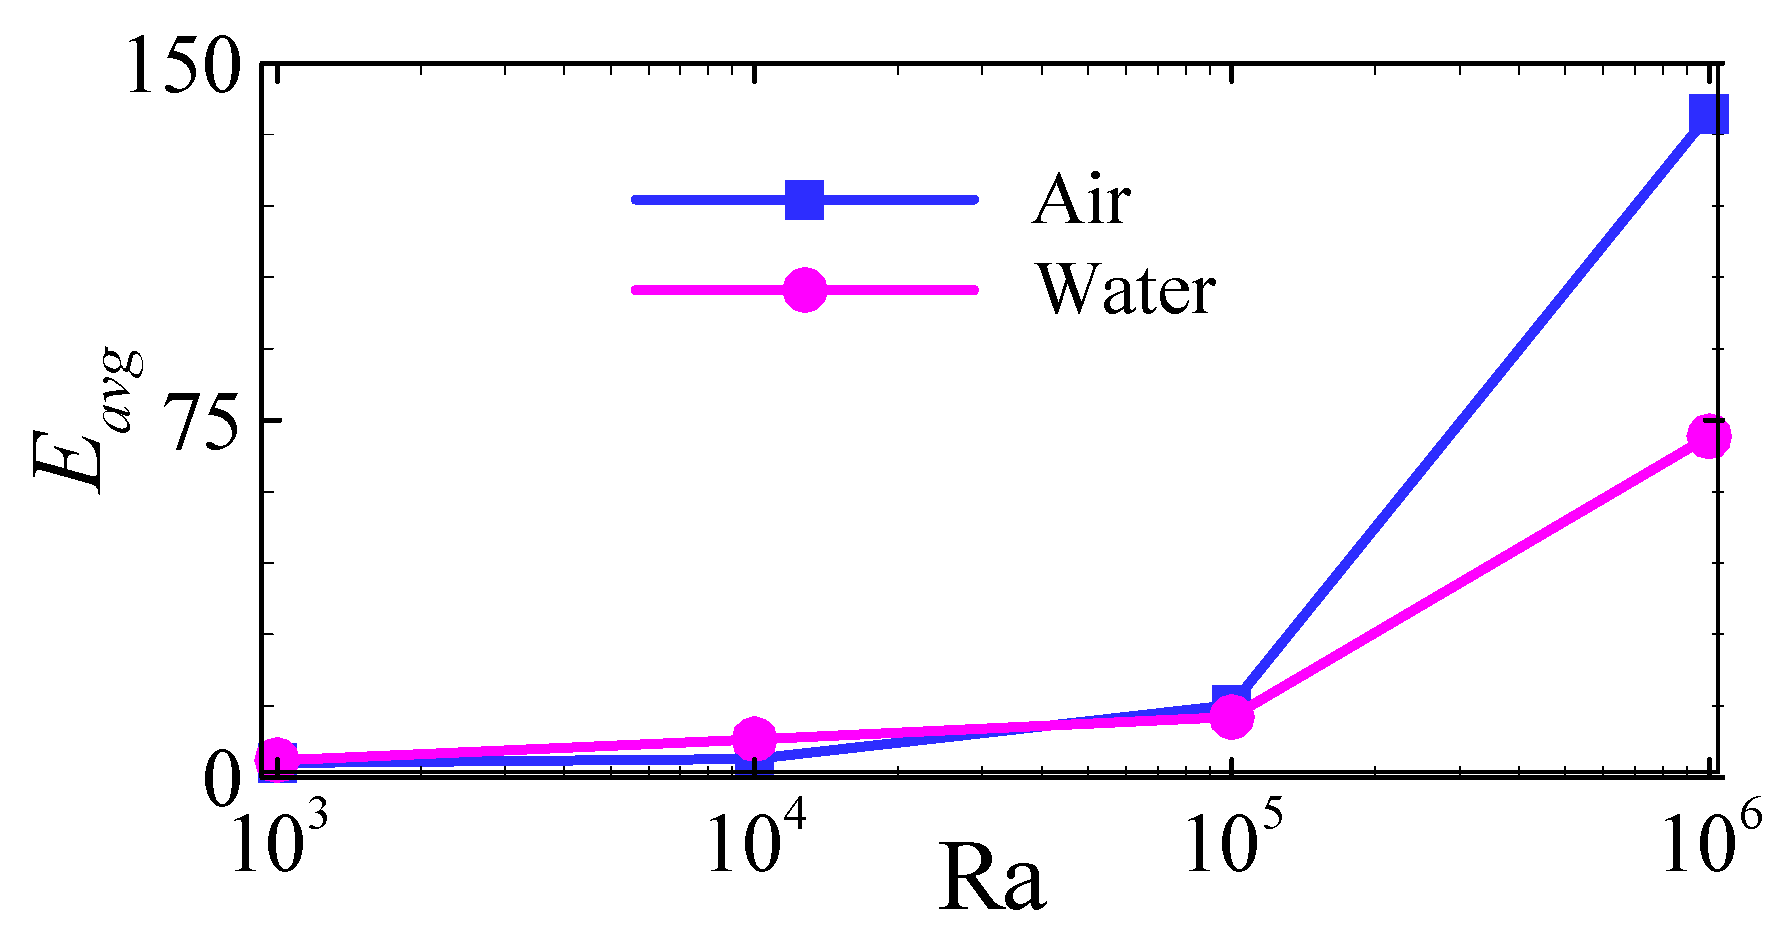
  • At Ra = 106, the average entropy production in the air-filled cavity is 94.54% higher than that in the water-filled cavity.
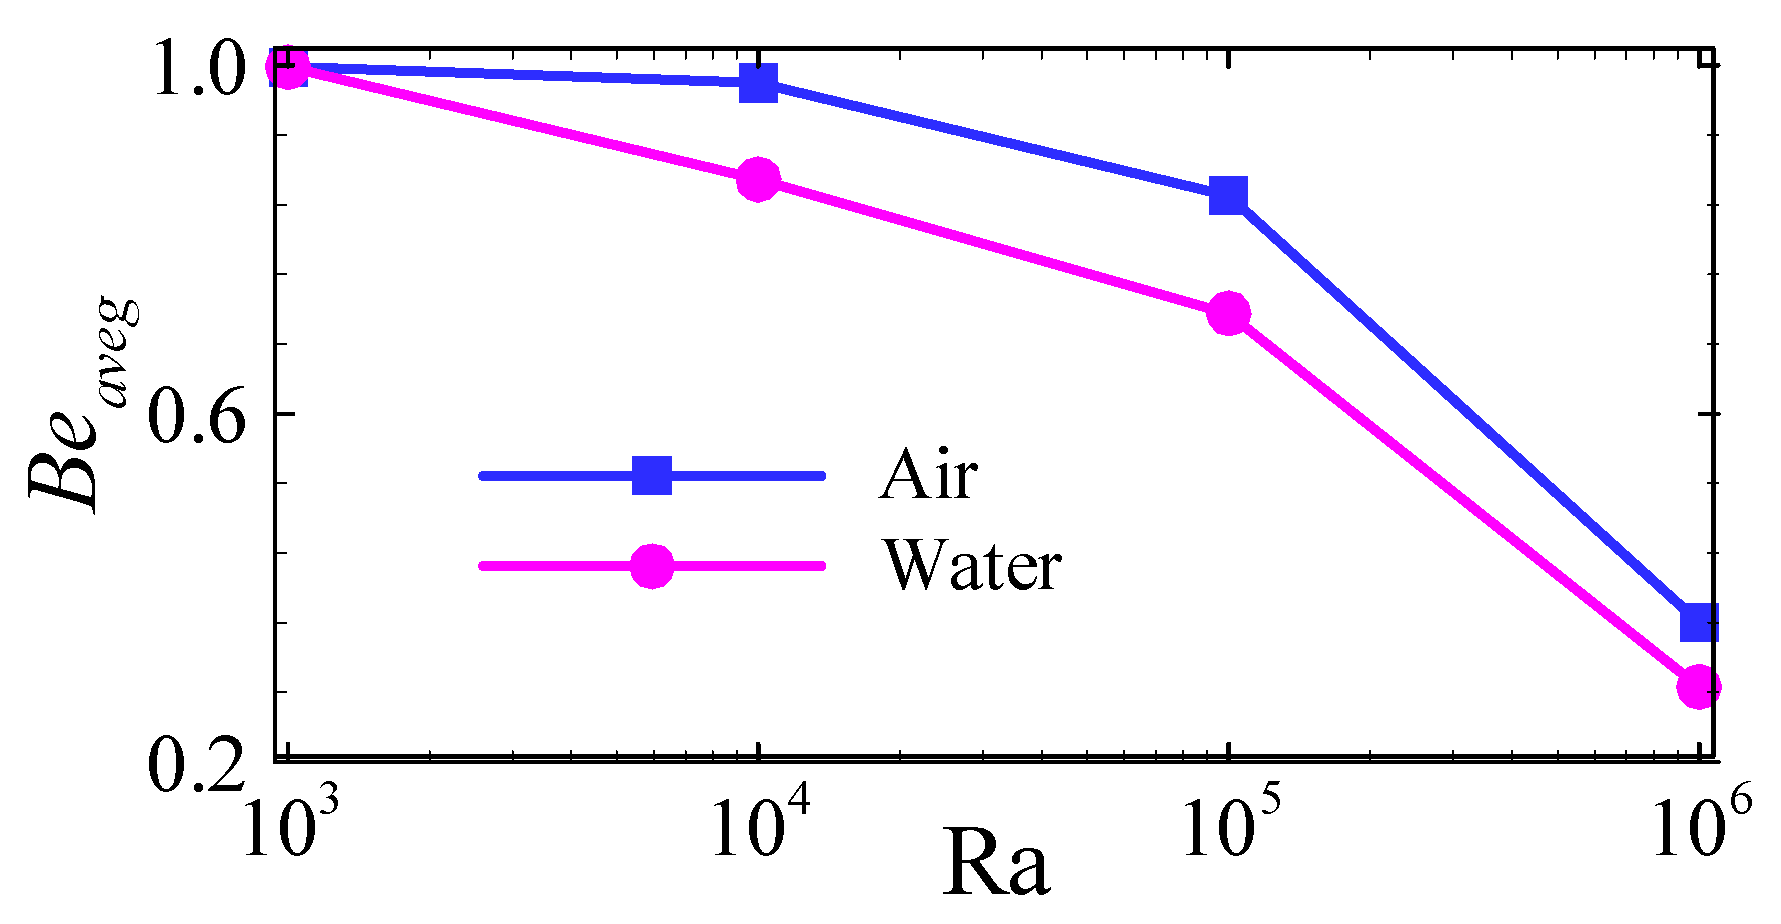
  • At Ra = 10⁶, the average Bejan number in the enclosure filled with water is 20.56% lower than that of the enclosure filled with air.
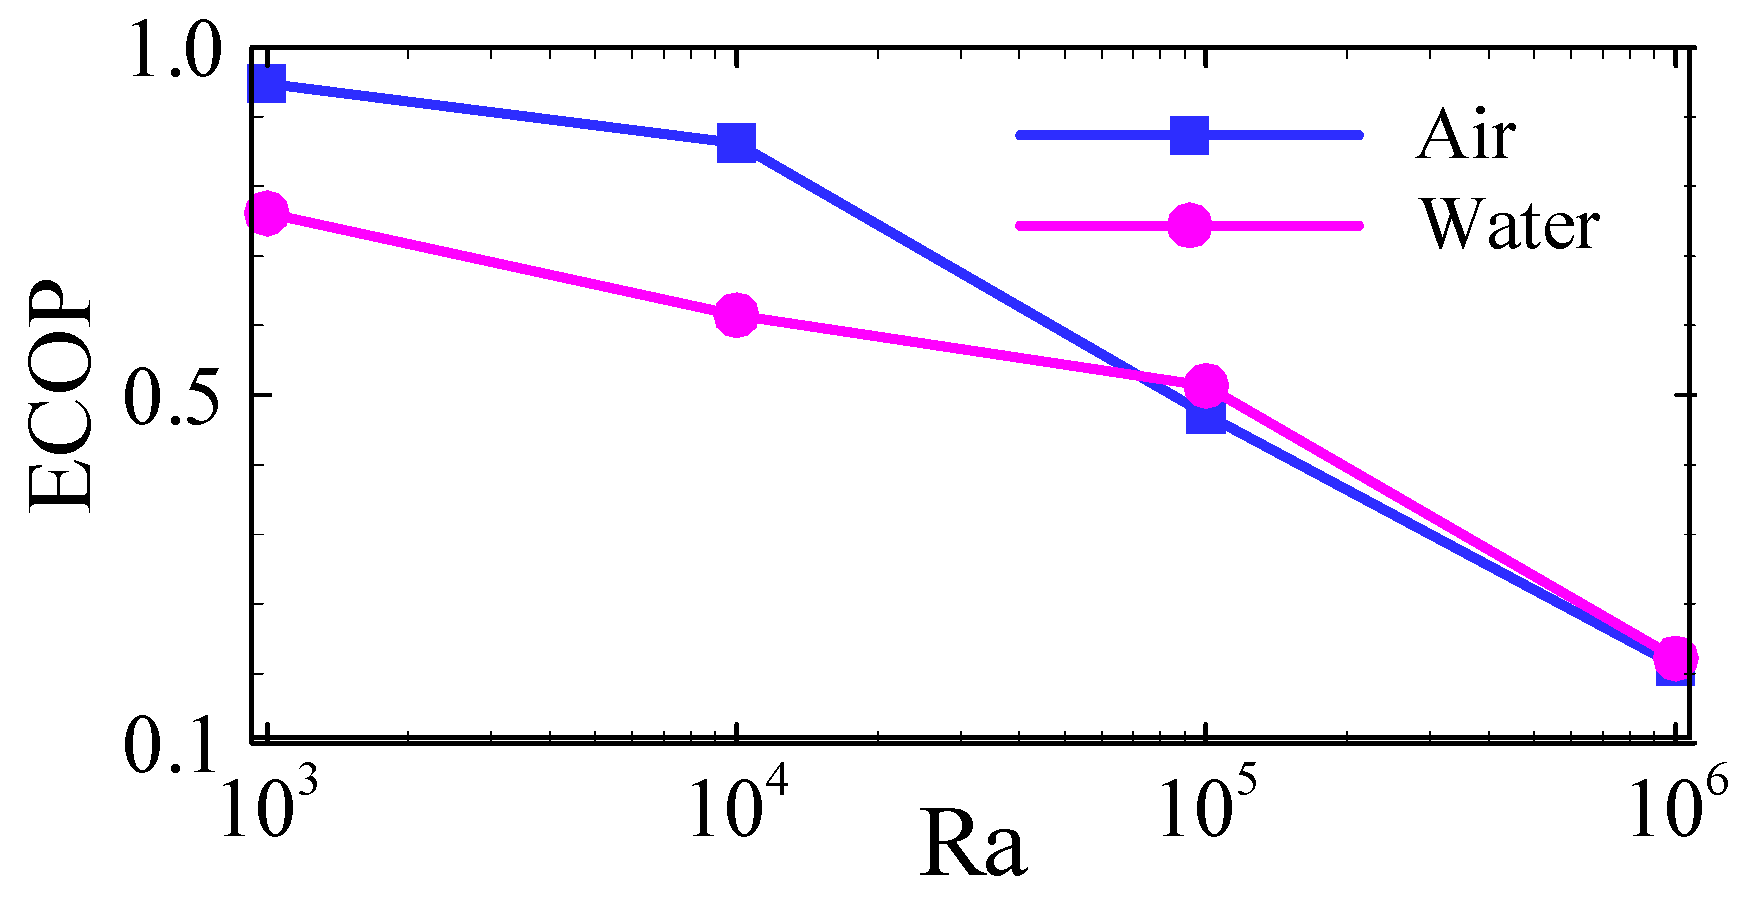
  • At Ra = 106, the thermal efficiency of the enclosure filled with water is 4.96% higher than that of the enclosure filled with air.
These results enhance the understanding of NC heat transfer and Egen in geometrically complex cavities and provide critical insights, indicating that the thermal performance of the cavity is more efficient when filled with water compared to air.

7. Limitations and Future Research

While this study provides valuable insights, several limitations should be acknowledged. The numerical model is restricted to two-dimensional, laminar flow with constant fluid properties under the Boussinesq approximation. These assumptions, though widely adopted in thermal–fluid simulations, may neglect important three-dimensional and transient effects, particularly near flow transition regimes. Future investigations incorporating variable properties, turbulence modeling, and three-dimensional analyses would further enhance the generality and applicability of the present results.
Building on the insights gained from the present study of transitional natural convection across Rayleigh numbers ranging from Ra = 103 to 5 × 10⁷, future research can further advance this work in several directions. Incorporating three-dimensional simulations would allow for the capture of spatially complex flow instabilities that are not resolved in two-dimensional models but are critical in real-world applications. Additionally, accounting for variable thermophysical properties would improve the model’s accuracy, particularly under large temperature gradients. Extending the analysis to include non-Newtonian fluids could uncover novel convection behaviors in rheologically complex media. Finally, implementing appropriate turbulence models would be essential to accurately represent and analyze fully developed turbulent regimes. These extensions would contribute to a deeper theoretical understanding and support the development of more efficient and robust thermal management systems.

Author Contributions

Conceptualization, S.C.S. and S.B.; methodology, M.M.R.; software, M.M.R.; validation, M.M.R. and S.B.; formal analysis, M.M.R., S.B. and S.C.S.; investigation, M.M.R. and S.B.; resources, M.M.R.; data curation, M.M.R.; writing—original draft preparation, M.M.R.; writing—review and editing, S.B. and S.C.S.; visualization, M.M.R.; supervision, S.B. and S.C.S.; project administration, S.B. All authors have read and agreed to the published version of the manuscript.

Funding

This research received no external funding.

Data Availability Statement

The data presented in this study are available on request from the corresponding authors.

Conflicts of Interest

The authors declare no conflicts of interest.

Nomenclature

ARaspect ratioBellocal Bejan number
L, Hhalf-length and height of the cavity (m)Beavgaverage Bejan number
ggravitational force (m/s2)kthermal conductivity (W/(m·K))
ttime (s)X, Ycoordinates
Cpspecific heat (J/kg K)x, ydimensionless coordinates
Ppressure (N/m2)U, Vvelocity components (m/s)
pdimensionless pressureu, vdimensionless velocity components
Ttemperature (K)Greek symbols
Tenvironmental temperature (K)κthermal diffusivity (m2/s)
Thtemperature of the bottom wall (K)θdimensionless temperature
Tctemperature of the top wall (K)νkinematic viscosity (m2/s)
Titemperature of the inclined walls (K)φirreversibility distribution ratio
ψinclination angle
ΔTtemperature difference, (ThTc)ρdensity (kg/m3)
Ehtentropy generation due to heat transferτdimensionless time
PrPrandtl numberΔτdimensionless time step
Egenentropy generationθhdimensionless temperature of the bottom wall
Ra Rayleigh number, (ThTc)H3/νκ
Nuaverage Nusselt numberθidimensionless temperature of the inclinedwalls
Effentropy generation due to fluid friction
Ellocal entropy generationθcdimensionless temperature of the top wall
Eavgaverage entropy generation

References

  1. Nourdanesh, N.; Hossainpour, S.; Adamiak, K. Numerical simulation and optimization of natural convection heat transfer enhancement in solar collectors using electrohydrodynamic conduction pump. Appl. Therm. Eng. 2020, 180, 115825. [Google Scholar] [CrossRef]
  2. Chen, H.T.; Hsieh, Y.L.; Chen, P.C.; Lin, Y.F.; Liu, K.C. Numerical simulation of natural convection heat transfer for annular elliptical finned tube heat exchanger with experimental data. Int. J. Heat Mass Transf. 2018, 127, 541–554. [Google Scholar] [CrossRef]
  3. Letan, R.; Dubovsky, V.; Ziskind, G. Passive ventilation and heating by natural convection in a multi-storey building. Build. Environ. 2003, 38, 197–208. [Google Scholar] [CrossRef]
  4. Rath, S.; Dash, S.K. Thermal performance of a wavy annular finned horizontal cylinder in natural convection for electronic cooling application. Int. Commun. Heat Mass Transf. 2021, 128, 105623. [Google Scholar]
  5. Vogel, J.; Felbinger, J.; Johnson, M. Natural convection in high temperature flat plate latent heat thermal energy storage systems. Appl. Energy 2016, 184, 184–196. [Google Scholar] [CrossRef]
  6. Bhavsar, H.P.; Patel, C.M. Performance investigation of natural and forced convection cabinet solar dryer for ginger drying. Mater. Today Proc. 2021, 47, 6128–6133. [Google Scholar] [CrossRef]
  7. Bhowmick, S.; Saha, S.C.; Qiao, M.; Xu, F. Transition to a chaotic flow in a V-shaped triangular cavity heated from below. Int. J. Heat Mass Transf. 2019, 128, 76–86. [Google Scholar] [CrossRef]
  8. Chen, C.C.; Eichhorn, R. Natural convection from a vertical surface to a thermally stratified fluid. ASME J. Heat Transf. 1976, 98, 446–451. [Google Scholar] [CrossRef]
  9. Eichhorn, R. Natural convection in a thermally stratified fluid. Prog. Heat Mass Transf. 1969, 2, 41–53. [Google Scholar]
  10. Eichhorn, R.; Lienhard, J.H.; Chen, C.C. Natural convection from isothermal spheres and cylinders immersed in a stratified fluid. In International Heat Transfer Conference Digital Library; Begel House Inc.: Danbury, CT, USA, 1974. [Google Scholar]
  11. Angirasa, D.; Peterson, G.P. Natural convection heat transfer from an isothermal vertical surface to a fluid saturated thermally stratified porous medium. Int. J. Heat Mass Transf. 1997, 40, 4329–4335. [Google Scholar] [CrossRef]
  12. Tripathi, R.K.; Nath, G. Unsteady natural convection flow over a vertical plate embedded in a stratified medium. Int. J. Heat Mass Transf. 1993, 36, 1125–1128. [Google Scholar] [CrossRef]
  13. Lin, W.; Armfield, S.W.; Morgan, P.L. Unsteady natural convection boundary-layer flow along a vertical isothermal plate in a linearly stratified fluid with Pr > 1. Int. J. Heat Mass Transf. 2002, 45, 451–459. [Google Scholar] [CrossRef]
  14. Shapiro, A.; Fedorovich, E. Prandtl number dependence of unsteady natural convection along a vertical plate in a stably stratified fluid. Int. J. Heat Mass Transf. 2004, 47, 4911–4927. [Google Scholar] [CrossRef]
  15. Shapiro, A.; Fedorovich, E. Unsteady convectively driven flow along a vertical plate immersed in a stably stratified fluid. J. Fluid Mech. 2004, 498, 333–352. [Google Scholar] [CrossRef]
  16. Shapiro, A.; Fedorovich, E. Natural convection in a stably stratified fluid along vertical plates and cylinders with temporally periodic surface temperature variations. J. Fluid Mech. 2006, 546, 295–311. [Google Scholar] [CrossRef]
  17. Patterson, J.; Imberger, J. Unsteady natural convection in a rectangular cavity. J. Fluid Mech. 1980, 100, 65–86. [Google Scholar] [CrossRef]
  18. Kuhn, D.; Oosthuizen, P.H. Unsteady natural convection in a partially heated rectangular cavity. J. Heat Transf. 1987, 109, 798–801. [Google Scholar] [CrossRef]
  19. Lei, C.; Armfield, S.W.; Patterson, J.C. Unsteady natural convection in a water-filled isosceles triangular enclosure heated from below. Int. J. Heat Mass Transf. 2008, 51, 2637–2650. [Google Scholar] [CrossRef]
  20. Ma, J.; Xu, F. Unsteady natural convection and heat transfer in a differentially heated cavity with a fin for high Rayleigh numbers. Appl. Therm. Eng. 2016, 99, 625–634. [Google Scholar] [CrossRef]
  21. Xu, F.; Patterson, J.C.; Lei, C. Unsteady flow and heat transfer adjacent to the sidewall wall of a differentially heated cavity with a conducting and an adiabatic fin. Int. J. Heat Fluid Flow 2011, 32, 680–687. [Google Scholar] [CrossRef]
  22. Elkhazen, M.I.; Hassen, W.; Gannoun, R.; Hussein, A.K.; Borjini, M.N. Numerical study of electroconvection in a dielectric layer between two cofocal elliptical cylinders subjected to unipolar injection. J. Eng. Phys. Thermophys. 2019, 92, 1318–1329. [Google Scholar] [CrossRef]
  23. Hassen, W.; Elkhazen, M.I.; Traore, P.; Borjini, M.N. Charge injection in horizontal eccentric annuli filled with a dielectric liquid. Eur. J. Mech.-B/Fluids 2018, 72, 691–700. [Google Scholar] [CrossRef]
  24. Elkhazen, M.I.; Hassen, W.; Öztop, H.F.; Kolsi, L.; Al-Rashed, A.A.; Borjini, M.N.; Ali, M.E. Electro-thermo-convection in dielectric liquid subjected to partial unipolar injection between two eccentric cylinders. Int. J. Numer. Methods Heat Fluid Flow 2019, 29, 78–93. [Google Scholar] [CrossRef]
  25. Akrour, D.; Elkhazen, M.I.; Hassen, W.; Kriaa, K.; Maatki, C.; Hadrich, B.; Kolsi, L. Numerical Investigation of the Electro-Thermo Convection in an Inclined Cavity Filled with a Dielectric Fluid. Processes 2023, 11, 2506. [Google Scholar] [CrossRef]
  26. Iyican, L.; Bayazitoglu, Y.; Witte, L.C. An analytical study of natural convective heat transfer within a trapezoidal enclosure. J. Heat Transf. 1980, 102, 640–647. [Google Scholar] [CrossRef]
  27. Iyican, L.; Witte, L.C.; Bayazitoglu, Y. An experimental study of natural convection in trapezoidal enclosures. J. Heat Transf. 1980, 102, 648–653. [Google Scholar] [CrossRef]
  28. Kuyper, R.A.; Hoogendoorn, C.J. Laminar natural convection flow in trapezoidal enclosures. Numer. Heat Transf. Part A Appl. 1995, 28, 55–67. [Google Scholar] [CrossRef]
  29. Moukalled, F.; Darwish, M. Natural convection in a partitioned trapezoidal cavity heated from the side. Numer. Heat Transf. Part A Appl. 2003, 43, 543–563. [Google Scholar] [CrossRef]
  30. Moukalled, F.; Darwish, M. Natural convection in a trapezoidal enclosure heated from the side with a baffle mounted on its upper inclined surface. Heat Transf. Eng. 2004, 25, 80–93. [Google Scholar] [CrossRef]
  31. Basak, T.; Roy, S.; Pop, I. Heat flow analysis for natural convection within trapezoidal enclosures based on heatline concept. Int. J. Heat Mass Transf. 2009, 52, 2471–2483. [Google Scholar] [CrossRef]
  32. Rahaman, M.M.; Titab, R.; Bhowmick, S.; Mondal, R.N.; Saha, S.C. Unsteady 2D flow in an initially stratified air-filled trapezoid. Jagannath Univ. J. Sci. 2022, 8, 1–6. [Google Scholar]
  33. Rahaman, M.M.; Bhowmick, S.; Mondal, R.N.; Saha, S.C. Unsteady natural convection in an initially stratified air-filled trapezoidal enclosure heated from below. Processes 2022, 10, 1383. [Google Scholar] [CrossRef]
  34. Rahaman, M.M.; Bhowmick, S.; Mondal, R.N.; Saha, S.C. A Computational Study of Chaotic Flow and Heat Transfer within a Trapezoidal Cavity. Energies 2023, 16, 5031. [Google Scholar] [CrossRef]
  35. Rahaman, M.M.; Bhowmick, S.; Mondal, R.N.; Saha, S.C. Unsteady Natural Convection Flow Within a Trapezoidal Enclosure. 2024. Available online: https://papers.ssrn.com/sol3/papers.cfm?abstract_id=4951897 (accessed on 12 February 2025).
  36. Bejan, A. Second law analysis in heat transfer. Energy 1980, 5, 720–732. [Google Scholar] [CrossRef]
  37. Bejan, A. Entropy generation minimization: The new thermodynamics of finite-size devices and finite-time processes. J. Appl. Phys. 1996, 79, 1191–1218. [Google Scholar] [CrossRef]
  38. Biswal, P.; Basak, T. Entropy generation vs energy efficiency for natural convection based energy flow in enclosures and various applications: A review. Renew. Sustain. Energy Rev. 2017, 80, 1412–1457. [Google Scholar] [CrossRef]
  39. Goh, L.H.K.; Hung, Y.M.; Chen, G.M.; Tso, C.P. Entropy generation analysis of turbulent convection in a heat exchanger with self-rotating turbulator inserts. Int. J. Therm. Sci. 2021, 160, 106652. [Google Scholar] [CrossRef]
  40. Magherbi, M.; Abbassi, H.; Brahim, A.B. Entropy generation at the onset of natural convection. Int. J. Heat Mass Transf. 2003, 46, 3441–3450. [Google Scholar] [CrossRef]
  41. Ilis, G.G.; Mobedi, M.; Sunden, B. Effect of aspect ratio on entropy generation in a rectangular cavity with differentially heated vertical walls. Int. Commun. Heat Mass Transf. 2008, 35, 696–703. [Google Scholar] [CrossRef]
  42. Varol, Y.; Oztop, H.F.; Koca, A. Entropy generation due to conjugate natural convection in enclosures bounded by vertical solid walls with different thicknesses. Int. Commun. Heat Mass Transf. 2008, 35, 648–656. [Google Scholar] [CrossRef]
  43. Varol, Y.; Oztop, H.F.; Pop, I. Entropy generation due to natural convection in non-uniformly heated porous isosceles triangular enclosures at different positions. Int. J. Heat Mass Transf. 2009, 52, 1193–1205. [Google Scholar] [CrossRef]
  44. Basak, T.; Kaluri, R.S.; Balakrishnan, A.R. Entropy generation during natural convection in a porous cavity: Effect of thermal boundary conditions. Numer. Heat Transf. Part A Appl. 2012, 62, 336–364. [Google Scholar] [CrossRef]
  45. Siavashi, M.; Yousofv, R.; Rezanejad, S. Nanofluid and porous fins effect on natural convection and entropy generation of flow inside a cavity. Adv. Powder Technol. 2018, 29, 142–156. [Google Scholar] [CrossRef]
  46. Rahaman, M.M.; Bhowmick, S.; Saha, G.; Xu, F.; Saha, S.C. Transition to chaotic flow, bifurcation, and entropy generation analysis inside a stratified trapezoidal enclosure for varying aspect ratio. Chin. J. Phys. 2024, 91, 867–882. [Google Scholar] [CrossRef]
  47. Rahaman, M.M.; Bhowmick, S.; Ghosh, B.P.; Xu, F.; Mondal, R.N.; Saha, S.C. Transient natural convection flows and heat transfer in a thermally stratified air-filled trapezoidal cavity. Therm. Sci. Eng. Prog. 2024, 47, 102377. [Google Scholar] [CrossRef]
  48. Rahaman, M.M.; Bhowmick, S.; Saha, S.C. Thermal performance and entropy generation of unsteady natural convection in a trapezoid-shaped cavity. Processes 2025, 13, 921. [Google Scholar] [CrossRef]
  49. Lasfer, K.; Bouzaiane, M.; Lili, T. Numerical study of laminar natural convection in a side-heated trapezoidal cavity at various inclined heated sidewalls. Heat Transf. Eng. 2010, 31, 362–373. [Google Scholar] [CrossRef]
  50. Ridouane, E.H.; Campo, A. Formation of a pitchfork bifurcation in thermal convection flow inside an isosceles triangular cavity. Phys. Fluids 2006, 18, 074102. [Google Scholar] [CrossRef]
Figure 1. Schematic of the physical domain and non-dimensional boundary conditions, with the designated points P1 (0, 0.133), P2 (0, 0.533), P3 (0, 0.80), P4 (0.246, 0.213), and P5 (−0.246, 0.213), used in the subsequent analyses.
Processes 13 01908 g001
Figure 2. Flowchart of the SIMPLE scheme for unsteady flow.
Processes 13 01908 g002
Figure 4. Comparison of isotherm contours: (a) results from Basak et al. [31], and (b) results from the current study.
Processes 13 01908 g004
Figure 5. Transition form symmetry to asymmetry state: (a,b) asymmetry index I as a function of Ra in the cavities, respectively; (c,d) TTS at two symmetrical points in the cavities, respectively.
Processes 13 01908 g005
Figure 6. Transition form steady to chaotic state in the air-filled cavity at different Ra: (a) steady at Ra = 4.7 × 10⁵, (b) periodic at Ra = 4.8 × 10⁵, (c) sustained periodic at Ra = 3 × 10⁷, and (d) chaotic at Ra = 4 × 10⁷.
Processes 13 01908 g006
Figure 7. Transition form steady to chaotic state in the water-filled cavity at different Ra: (a) steady at Ra = 105, (b) periodic at Ra = 2 × 10⁵, (c) continued periodic at Ra = 4 × 10⁵, and (d) chaotic at Ra = 5 × 10⁵.
Processes 13 01908 g007
Figure 8. Phase-space trajectories showing the changeover from steady to chaotic states in the air-filled cavity at different Ra values: (a) fixed point at Ra = 4.7 × 10⁵, (b) limit cycle at Ra = 4.8 × 10⁵, (c) sustained periodic orbit at Ra = 3 × 10⁷, and (d) chaotic trajectory at Ra = 4 × 10⁷.
Processes 13 01908 g008
Figure 9. Phase-space trajectories showing the changeover from steady to chaotic states in the water-filled cavity at different Ra values: (a) fixed point at Ra = 105, (b) limit cycle at Ra = 2 × 10⁵, (c) sustained periodic orbit at Ra = 4 × 10⁵, and (d) chaotic trajectory at Ra = 5 × 10⁵.
Processes 13 01908 g009aProcesses 13 01908 g009b
Figure 10. Nu time series at the bottom wall for Ra values ranging from 103 to 106: (a) in the air-filled enclosure, and (b) in the water-filled enclosure.
Processes 13 01908 g010
Figure 11. Variation in Nu with respect to the Ra values for the air-filled and water-filled cavities.
Processes 13 01908 g011
Figure 12. Variation in average energy generation (Eavg) with respect to the Ra values for air-filled and water-filled cavities.
Processes 13 01908 g012
Figure 13. Variation in average Bejan number (Beavg) with respect to the Ra values for air-filled and water-filled cavities.
Processes 13 01908 g013
Figure 14. Variation in ECOP with respect to the Ra values for air-filled and water-filled cavities.
Processes 13 01908 g014
Table 1. Thermo-physical characteristics of stratified air and water (refer to [47,49], for details).
Property (Unit)Stratified AirStratified Water
ρ (kg/m3)1.177998.4
Cp (J/kg K)10124182
k (W/m K)0.02578870.566
β (1/K)0.0080453.109 × 10−4
μ (kg/m s)1.8093 × 10−59.4748 × 10−4
Table 2. Variation in average temperature in the fully developed stage for various grids and time steps.
Grids and Time StepsAirWater
Average TemperatureVarianceAverage TemperatureVariance
225 × 75 and Δτ = 0.010.20070.89%0.28890.73%
300 × 100 and Δτ = 0.010.20250.2924
300 × 100 and Δτ = 0.0050.20360.54%0.29370.44%
375 × 125 and Δτ = 0.010.20300.25%0.29310.24%
Table 3. Comparison of the present numerical results with experimental data form [27], and numerical results from [49] for the correlation between Nu and Ra.
RaExperimental [27]Numerical [49]Present Study
1031.661.56
1042.202.332.31
1055.206.095.99
10612.5013.4013.10
10729.5229.21
Table 4. Transition points between different flow regimes and their corresponding physical applications.
Cavity:Rayleigh NumbersFlow RegimesApplications
Air-filled cavityRa ≤ 105Symmetric steadyin fluid transport, cooling, microfluidics, and aerodynamics.
Ra = 2 × 10⁵ to 4.7 × 10⁵Asymmetric steadyin transport systems, biomedical devices, thermal management, and aerodynamics.
Ra = 4.8 × 10⁵ to 3 × 10⁷Periodicin biological systems, engineering devices, and natural phenomena.
Ra ≥ 4 × 10⁷Chaoticin biomedical flows, thermal systems, chemical reactors, and natural environments.
Water-filled cavityRa ≤ 9 × 10⁴Symmetric steadyin fluid flow systems, heat dissipation technologies, microfluidic devices, and aerodynamic analysis.
Ra = 105Asymmetric steadywithin transportation design, medical device development, thermal systems engineering, and aerodynamic analysis.
Ra = 2 × 10⁵ to 4 × 10⁵Periodicin living organisms, technological applications, and environmental systems.
Ra ≥ 5 × 10⁵Chaoticin biological fluid systems, thermal management, industrial reactors, and environmental processes.
Disclaimer/Publisher’s Note: The statements, opinions and data contained in all publications are solely those of the individual author(s) and contributor(s) and not of MDPI and/or the editor(s). MDPI and/or the editor(s) disclaim responsibility for any injury to people or property resulting from any ideas, methods, instructions or products referred to in the content.

