Article

Active/Reactive Power Separation Mechanisms for Different Signal-Modulated Power Devices Based on Time-Varying Amplitude/Frequency Rotating Vectors in Dynamic Processes

1
School of Electrical and Electronic Engineering, Huazhong University of Science and Technology, Wuhan 430074, China
2
Electric Power Dispatching and Control Center of Guangdong Power Grid, Guangzhou 510635, China
*
Author to whom correspondence should be addressed.
Processes 2025, 13(6), 1907; https://doi.org/10.3390/pr13061907
Submission received: 15 May 2025 / Revised: 12 June 2025 / Accepted: 13 June 2025 / Published: 16 June 2025

Abstract

:
The dynamic behavior of large-scale systems containing diverse devices is a crucial focus for system operators, particularly in power systems where grid-connected devices generate AC electrical signals through various modulated methods. One of the main objectives of power systems is to transmit power. To this end, time-varying amplitude/frequency rotating vectors are used to describe different AC voltage and current signals, and then the active/reactive power separation mechanisms and characteristics for different signal-modulated power devices are explored. These mechanisms and characteristics are analyzed and verified through time-domain simulations. The theoretical contribution of this paper is that it thoroughly clarifies the misconception in current power theories by demonstrating that active power and reactive power naturally arise as inherent physical quantities rather than being solely mathematically defined. In terms of practicality, this paper can provide physically grounded insights for the power calculation methods and offer guidance for the design of power measurement in actual power system dynamic processes. Through the analysis presented in this study, the analysis, measurement, and control of the active/reactive components in renewable energy equipment based on the instantaneous reactive power calculation method or the traditional sinusoidal steady-state power calculation method do not need to be updated.

1. Introduction

With the large-scale integration of renewable energy devices into the power grid, EHV DC transmission projects have been implemented to facilitate the consumption of renewable energy generated in the western and northern regions of China [1,2,3]. For example, the renewable energy base in Jiuquan delivers electricity via the Jiuquan-Xiangtan ±800 kV EHV DC transmission project [1], and the renewable energy base in Xinjiang delivers electricity through the Jundong-Wananan ±1100 kV EHV DC transmission project [2]. As a result, systems that include SGs, VSCs, and LCC-HVDC transmission are now common in China. However, the DC transmission sending-end system, which is connected to large-scale, centralized renewable energy generation, often experiences dynamic stability issues [3]. Since the mechanisms behind these stability problems are still unclear, they pose a threat to the safe and stable operation of the large-scale power system. One of the main objectives of a power system is to transmit power [4]. This means that various grid-connected devices should convert different forms of primary energy inputs (e.g., mechanical energy, solar energy, wind energy) into electricity; then, electrical power is delivered through the power grid as alternating voltages and currents. Therefore, power theory intrinsically forms the foundation of power system analysis and inherently affects explanations of dynamic behaviors and stabilization mechanisms in large-scale systems. Overall, there is an urgent need to establish a comprehensive understanding of the generation mechanisms of active and reactive power, as well as their characteristics across SGs, VSCs, and LCCs during the dynamic processes of AC power systems.
Numerous power theories have been proposed in the literature [5,6,7]. The traditional understanding of active and reactive power can be categorized into two main frameworks: the classical sinusoidal steady-state power theory and the power theories under non-sinusoidal conditions [5]. The classical sinusoidal steady-state power theory applies specifically to circuits operating under sinusoidal steady-state conditions. In contrast, power theories under non-sinusoidal conditions can be broadly classified into three categories: (1) Frequency-domain-based theories, first introduced by Budeanu in 1927, approach the problem from a harmonic perspective using the Fourier series as the mathematical foundation. However, because the Fourier series can only describe periodic steady-state waveforms, this class of theories is inherently limited to steady-state system analysis [6]. (2) Time-domain-based theories, initially proposed by Fryze in 1932, also apply only to steady-state systems. Although these methods avoid frequency-domain decomposition, they still rely on averaging or RMS calculations to determine active and reactive power, thus restricting their use to steady-state conditions [7]. (3) The instantaneous reactive power theory, first proposed by Akagi et al. in 1983, has been widely adopted for generating reference signals in harmonic compensation applications [8,9]. While effective in mitigating harmonic distortions, this theory also relies on the Fourier series to represent instantaneous voltage and current in circuits containing harmonics.
Thus, the current understanding of active/reactive power is primarily limited to steady-state conditions. Power theory research methodologies predominantly rely on mathematical definitions and the Fourier series, confining their applicability mainly to steady-state systems. For instance, the instantaneous reactive power theory defines active/reactive power using mathematical formulations based on the dot/cross product of voltage and current rotating vectors [8]. This theory ultimately generates command signals for compensating harmonic currents [9]. It employs the Fourier series to describe the AC voltage and current of each phase, enabling the analysis of power phenomena in circuits containing harmonics, but not for the dynamic processes. Thus, existing power theories are primarily suited for the periodic and steady-state systems [10]. They lack sufficient consideration for system dynamics and are not well suited for analyzing time-varying or transient behaviors.
In current power system analyses, such as scenarios involving low-frequency oscillations, active and reactive power characterizations often rely on the phasor method [4]. Phasors portray the relationship between the active/reactive power output from generators and amplitude, as well as the phase difference of each internal voltage. However, since the phasor is used to describe a standard sinusoidal signal [11], the above relationship is actually a steady-state relationship. Some other studies are based on the dynamic phasor method, which uses a Fourier series with time-varying amplitude and phase to represent the AC signals in dynamic processes [12]. However, as previously discussed, the Fourier series is limited to periodic signals and struggles to characterize non-stationary, non-periodic signals in dynamic processes. In conclusion, the above-mentioned works also lack a comprehensive physical understanding of active and reactive power in dynamic processes.
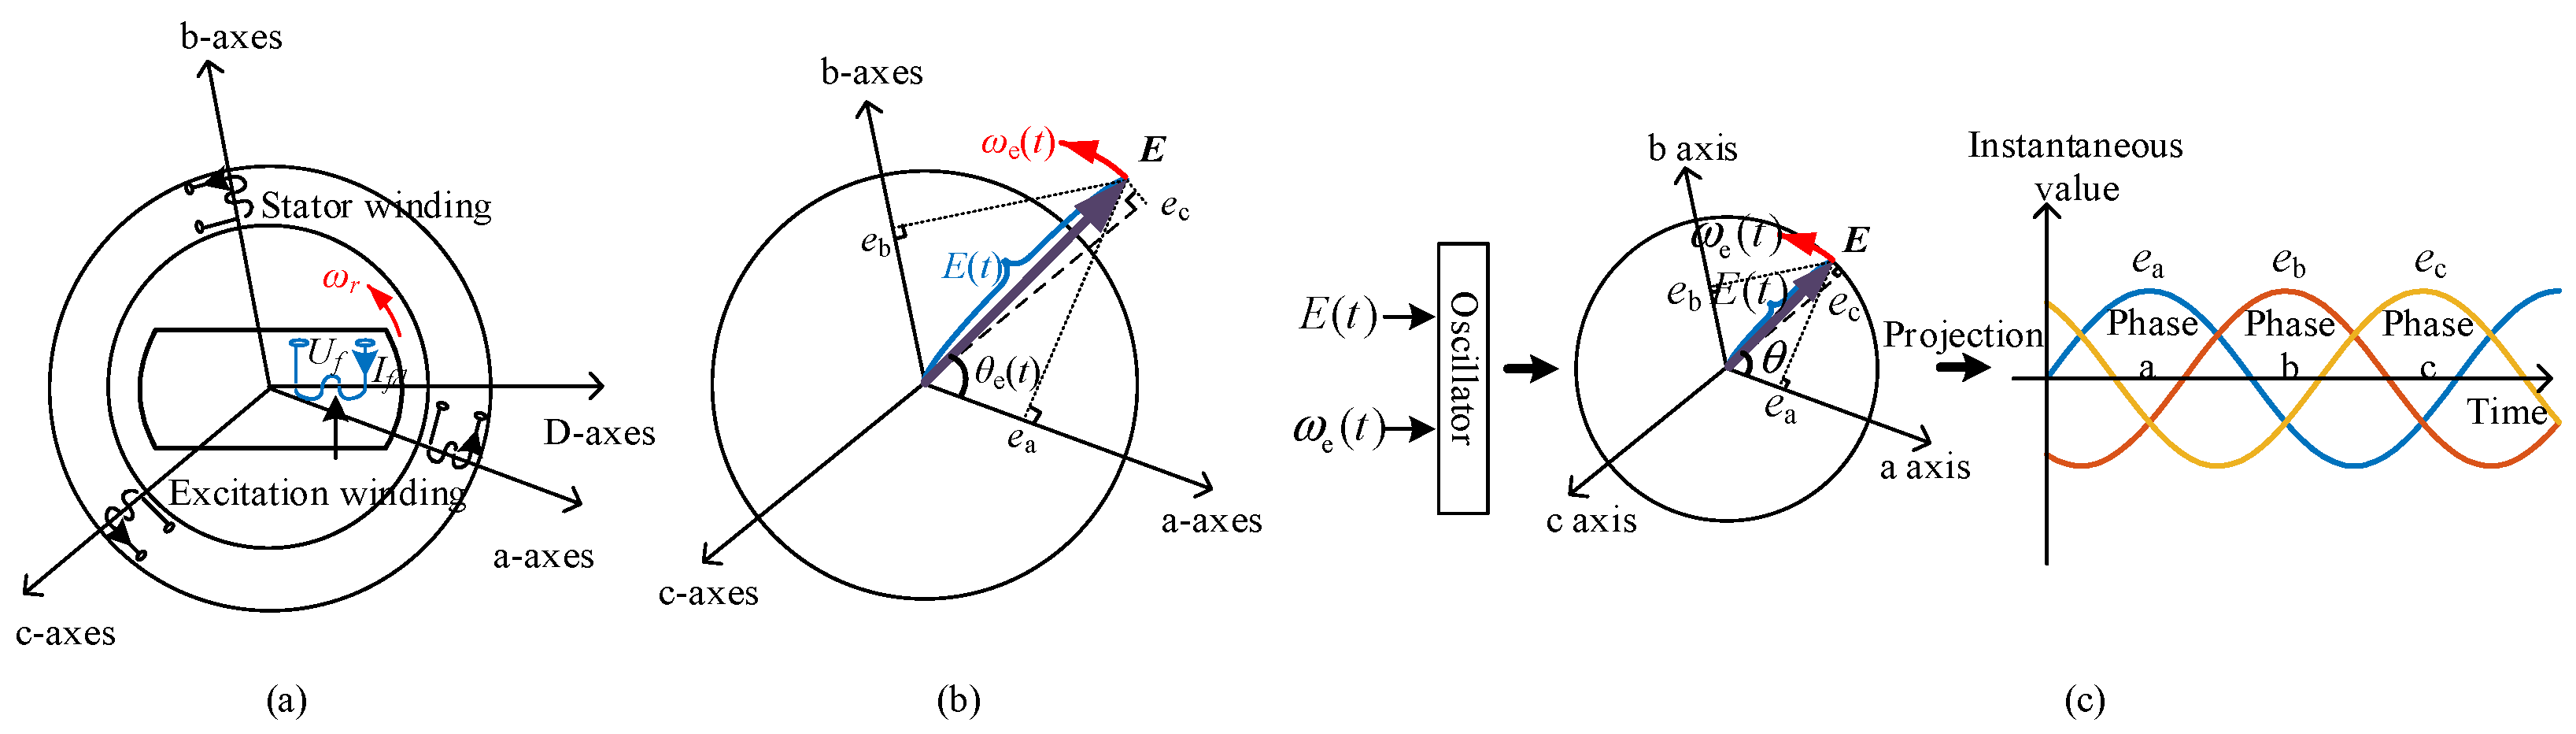
In dynamic processes, the AC voltage and frequency level of the power system are jointly established by all grid-connected devices, and, thus, all grid-connected devices must necessarily possess the ability to regulate the amplitude/frequency of their internal voltages based on the active/reactive power [13,14]. The power conversion on the AC and DC sides of the converter is briefly introduced as follows: On the DC side, the converter handles DC current, voltage, and power. Under certain switching pulse signals of the converter, AC current, voltage, and active/reactive power on the AC side can be handled by the conduction and shutdown of six switching tubes. In new-type power systems, different grid-connected devices generate AC electrical signals using different modulated methods. For example, SG adopts continuous modulation to produce a basic sinusoidal AC voltage in steady-state conditions. VSC adopts the PWM control technique to produce AC values, while LCC adopts a simple square-wave modulation control technique to produce AC values. In dynamic processes, AC voltages and currents at the outlets of different grid-connected devices are exhibited as time-varying amplitude/frequency signals, instead of harmonics [10,15]. Thus, the instantaneous value of each phase of the AC system can be characterized by the time-varying amplitude/frequency rotating vector [10]. Building on this, the authors of [15] discussed the separation mechanism of active/reactive power components specifically for VSC grid-connected devices using SPWM signal modulation. However, ref. [15] did not explore the separation mechanism of active/reactive power for other types of grid-connected devices. To address stability challenges in systems comprising SGs, VSCs, and LCC-HVDC transmission, it is necessary to understand the generation mechanisms of active and reactive power, as well as their characteristics across these devices during the dynamic processes of AC power systems.
Consequently, this paper extends the work of [15] by using time-varying amplitude/frequency rotating vectors to describe different AC signals, exploring the separation mechanisms of active/reactive power under continuous, SPWM, and simple square-wave modulation for the SG, VSC, and LCC. The aim is to compare and analyze their characteristics, thereby clarifying the physical generation mechanisms of active/reactive power in the dynamic processes of systems containing different grid-connected devices. Additionally, in terms of practicality, the findings of this paper can provide physically grounded insights for power calculation methods and offer guidance for the design of power measurement in actual power system dynamic processes.
The structure of this paper is organized as follows: Section 2 introduces the basic working principles and corresponding time-varying amplitude/frequency rotating vectors of SG, VSC, and LCC, as the foundation. Section 3 explores the active/reactive power separation mechanisms for different signals modulated power devices. Section 4 further explains the separation characteristics of active/reactive components in different devices. These mechanisms and characteristics are also verified through the time-domain simulations in Section 4. Section 5 discusses the theoretical and practical contributions of this paper. Finally, Section 6 provides a concluding summary for the entire paper.

2. Basic Working Principles and Time-Varying Amplitude/Frequency Rotating Vectors of SG, VSC, and LCC

In this section, the basic working principles of SG, VSC, and LCC are first introduced. Building on this foundation, the characteristics of AC signals generated by different grid-connected devices in dynamic processes are explained. To establish the correlation mechanism of power conversion on the AC-DC side, it is necessary to characterize voltage and current signals. These signals are described by the time-varying amplitude/frequency. Thus, the instantaneous values of AC signals are represented by the time-varying amplitude/frequency rotating vectors on the spatial complex plane. The work in this section would lay the foundation for understanding the separation mechanisms and characteristics of active/reactive power for different signals modulated power devices in system dynamic processes.

2.1. Time-Varying Amplitude/Frequency Rotating Vector for SG

The relative stability of amplitude/frequency during dynamic processes is the basis for electric power production, transmission, and consumption. Additionally, AC voltage/frequency levels of systems are jointly established by the amplitude/frequency of internal voltages across all grid-connected devices. Thus, Figure 1a shows a schematic of an ideal SG as an example to introduce the basic principle of the formation mechanism of internal voltage in SG, including the excitation and stator windings.
In Figure 1a, as the rotor of SG rotates, the current in the excitation winding generates a rotated magnetic field. During the rotor’s rotation, electromagnetic induction occurs due to the rotated magnetic field cutting through the three-phase stator windings. The excitation current flowing in the excitation winding generates the amplitude of the internal voltage, and the rotor speed generates the frequency of the internal voltage. The amplitude and frequency then form the three-phase AC voltage through an oscillator [14], as shown in Figure 1c, where the motor acts as an oscillator. The AC voltage can be described by the time-varying amplitude/frequency rotating vector E. The projections of this rotating vector onto the stationary coordinate axes are the instantaneous values of three-phase AC voltage, as shown in Figure 1b. The amplitude/angular frequency of the internal voltage rotating vector E is time-varying, since they are continuously modulated by the regulation of the excitation system and rotor motion during the dynamic processes.
Therefore, the AC voltage signals output of SG during dynamic processes are continuous time-varying amplitude/frequency signals. It is important to note that the steady-state is a special case where the SG outputs a standard sinusoidal AC signal with constant amplitude/frequency.

2.2. Time-Varying Amplitude/Frequency Rotating Vector for VSC

A VSC grid-connected device also needs the ability to regulate the amplitude/frequency of the internal voltage based on active/reactive power. This capability enables the conversion of various forms of primary energy inputs into electricity, allowing power to be delivered through the grid. Figure 2a illustrates the principle of forming the amplitude/frequency of internal voltage for a VSC. This simplified structure does not compromise the basic functionality of the VSC. In Figure 2a, igdref is the d-axis current reference, igqref is the q-axis current reference, igd is the d-axis current feedback value, igq is the q-axis current feedback value, Egd is the d-axis output of the current controller, and Egq is the q-axis output of the current controller. In addition, θpll is the phase output of the PLL, θt is the phase of the terminal voltage vector, and ωpll is the speed of the PLL. For both steady-state conditions and dynamic processes, according to the study in [14], the relationship between the amplitude E(t) and frequency ωe(t) of the internal voltage of VSC and the outputs of the current controller is as follows:
E ( t ) = ( E g d ) 2 + ( E g q ) 2
ω e ( t ) = ω p l l + d d t ( a r c t a n E g q E g d )
In Figure 2a and Equations (1) and (2), according to the fundamental principle of VSC, the amplitude/frequency of VSC’s internal voltage is formed by the speed of PLL and d/q-axis outputs of the current controller. In Figure 2b, VSC adopts the SPWM method to generate the AC signal. In this figure, the waveforms with certain amplitude/frequency generated from the controllers of VSC behave as the modulated three-phase waves earef, ebref, and ecref. uc is the carrier wave signal. The modulated waves are compared with the carrier wave to form the conductive pulse signals. As a result, these conductive pulse signals act on the six switches of VSC, ultimately generating a three-phase AC voltage.
Figure 3 illustrates the rotating vectors of the conductive pulse and internal voltage of the VSC. The two rotating vectors in Figure 3 have the same phase. In this figure, rotating vectors of the conductive pulse and internal voltage at time t1 are S(t1) and E(t1), respectively. The rotating vectors of the conductive pulse are in blue lines, and the internal voltage of the VSC are in black lines. After several carrier periods, at time t2, rotating vectors of the conductive pulse and internal voltage are S(t2) and E(t2), respectively. The green dashed trajectory is the path of the rotating vector of conductive pulse under steady-state conditions.
As shown in Figure 3, the rotating angular frequency of two rotating vectors is the average angular velocity within a carrier period, and the trajectory on the complex plane resembles a “stepper motor”. As a result, the amplitude/frequency of the internal voltage of VSC remains time-varying in dynamic processes when averaged over the carrier period. Therefore, under the SPWM method, the AC voltage signal outputs of the VSC during dynamic processes are discrete time-varying amplitude/frequency signals.

2.3. Time-Varying Amplitude/Frequency Rotating Vector for LCC

In the AC grid, the rectifier station of an LCC generates three-phase AC current, as the DC inductor is the energy storage element. Figure 4a shows the circuit structure of the converter, which includes six thyristors, a DC side inductor Ldc, DC current idc, and DC voltage udc. The AC currents are denoted as ia, ib, and ic. Figure 4b shows the amplitude and frequency of the internal current generated by the rectifier station of LCC. Here, in Figure 4b, udref represents the DC voltage reference for the rectifier station of LCC, idref is the DC current reference for the constant current control, and αorder is the firing angle order. In addition, μ is the commutation angle, the K is a constant value [16]. θi is the phase of the internal current vector of LCC, ωi is the angular frequency of the internal current vector of LCC, and I is the amplitude of the internal current vector. As Figure 4b shows, under the influence of constant current control and PLL, the angular frequency of the internal current vector is time-varying in dynamic processes. The amplitude of the internal current is also time-varying due to fluctuations in the DC current.
The formation of instantaneous values of LCC’s output AC current is introduced. As shown in Figure 4c, PLL tracks the frequency or phase and zero-crossing points of the commutation voltage. Then, the phase of PLL (represented as a sawtooth wave) is compared with the firing angle command value. If the phase of the PLL equals the firing angle command value, it would generate a sequence of conductive pulses that trigger the individual thyristors. As a result, the current in phase a is an alternating rectangular wave. In steady-state conditions, the angle width of these rectangular waves is 2π/3, and the time width is 2π/(3ω0), where ω0 is the rated angular frequency of the grid (for a 50 Hz grid, the time width is 6.6667 ms). According to sampling control theory, the alternating rectangular wave can be equivalent to a sine wave with an angular frequency ω0, as shown in Figure 4c. This indicates that the LCC’s output AC current can be represented as a current rotating vector with constant amplitude and constant angular frequency ω0 in steady-state conditions.
However, during dynamic processes, changes in the frequency of PLL will result in variation in the phase of PLL, which subsequently leads to changes in the time width of the rectangular wave output by LCC. Although the time width of the rectangular wave changes, the phase output from the PLL still crosses zero after every π/3 interval. Consequently, variations in the PLL’s angular frequency do not alter the angular width of the output rectangular wave. At any given moment, tk in the dynamic process and the phase output from the PLL and the firing angle command satisfy the following relationships [17]:
θ pll t k = ω 0 t k k π / 3 + θ pll 0 + Δ θ pll t k α 0 t k = α 0 _ s t e a d y + Δ α 0 t k
where θpll0 is the initial phase output from PLL, Δθpll is the disturbance in the phase output from PLL, α0_steady is the steady-state firing angle command, and Δα0 is the disturbance in the firing angle command.
Let the time between two adjacent conductive pulses be t1 and t2. Then, (3) can be expressed as follows:
θ pll t 1 = α 0 t 1 , θ pll t 2 = α 0 t 2 ω 0 t + Δ θ pll Δ α 0 t 2 t 1 = π 3 t 1 t 2 ω d d t = π 3
According to (4), the time between two adjacent conductive pulses (time interval between t1 and t2) varies during dynamic processes. Consequently, the average angular velocity of the conductive pulses over a π/3 interval is also time-varying. Figure 5 shows the rotating vectors of the conductive pulse and internal current of LCC. In this figure, two rotating vectors have the same phase. The rotating vectors of conductive pulse and internal current at time t1 are denoted as S(t1) and I(t1), respectively. At time t2, the rotating vectors of conductive pulse and internal current are S(t2) and I(t2), respectively. The green dashed trajectory is the path of the rotating vector of the conductive pulse and internal current. As shown in Figure 5, the rotating angular frequency ωd of the two rotating vectors is the average angular velocity within π/3. As a result, the amplitude and frequency of the internal current of LCC remain time-varying during dynamic processes when averaged over π/3. Under the simple square-wave modulated method, the AC signals outputs of LCC in dynamic processes are discrete time-varying amplitude/frequency signals.

3. Active/Reactive Power Separation Mechanisms for Different Signals Modulated Power Devices

In the previous section, the dynamic characteristics of voltage and current were explored for three different signals modulated power devices, which are SG, VSC, and LCC. The amplitude/frequency behind their AC outputs varies over time in dynamic processes. Specifically, SG produces a continuous time-varying amplitude/frequency signal, while VSC and LCC produce discrete time-varying amplitude/frequency signals. Building upon this foundation, this section will discuss the active/reactive power separation mechanisms for different signals modulated power devices.

3.1. Active/Reactive Power Separation Mechanism for SG

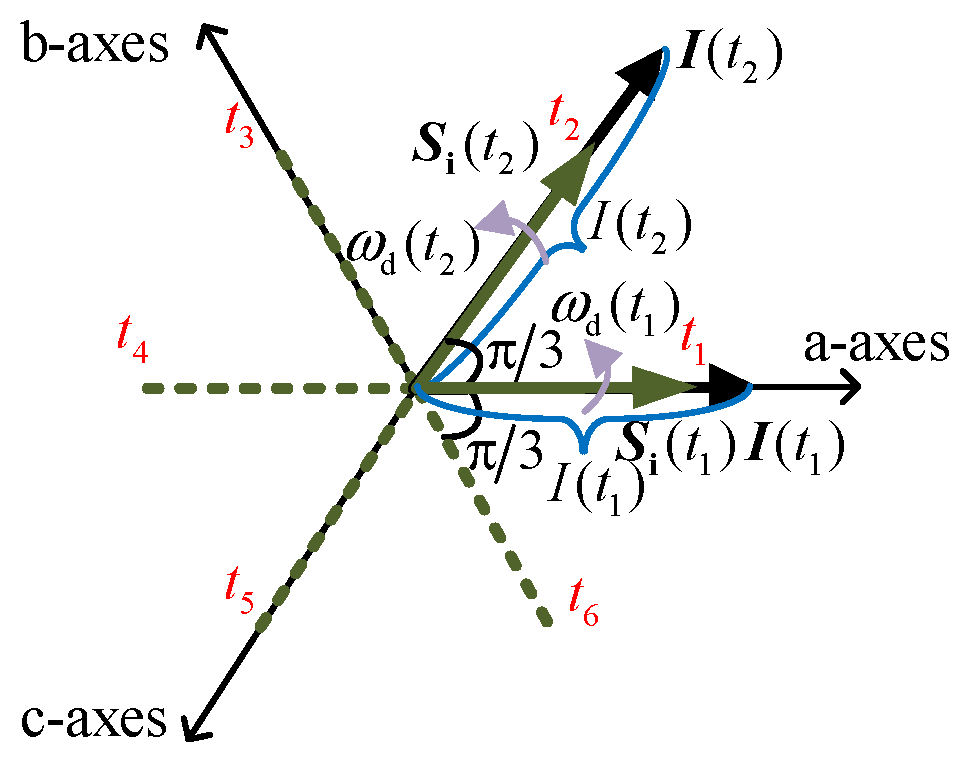
Indeed, the instantaneous power of each phase, formed by the multiplication of the instantaneous voltage and current of each phase, inevitably contains both active and reactive power components due to the phase difference between voltage and current. In the case of SG, the electromagnetic power on the rotor represents active power. This electromagnetic power is equal to the product of mechanical torque and rotational speed. This power is converted from primary energy and externally supplied, as it performs actual work. In addition, the remaining part of the electrical power in the AC system circulates among the three phases, and this represents reactive power. Reactive power does not need an external supply and does not reach the rotor side, and, thus, it does not perform work for the overall three phases.
Figure 6 illustrates the orthogonal decomposition of the time-varying amplitude/frequency rotating vector of the AC-side current along the time-varying amplitude/frequency rotating vector of voltage. This decomposition clearly shows that the AC-side current can be divided into two components: the current vector in-phase with the voltage vector and the current vector orthogonal to the voltage vector, as shown in Figure 6a. Then, the current vector in-phase with the voltage projects onto stationary coordinate axes and forms the active current of each phase, while the current vector orthogonal to the voltage vector projects onto stationary coordinate axes and forms the reactive current of each phase, as depicted in Figure 6b. The instantaneous active/reactive power components of each phase are obtained by multiplying the instantaneous voltage of each phase by the active/reactive current of each phase. As mentioned earlier, the sum of the instantaneous active power components of each phase is nonzero, representing the actual electrical power performing work. For SG, this active power component exactly equals the electromagnetic power. Meanwhile, the sum of instantaneous reactive power components of each phase is zero, indicating that although reactive power is present in each individual phase, it does not contribute to performing actual work by the overall three-phase system. As a result, through the orthogonal decomposition shown in Figure 6, one can intuitively understand and calculate the active/reactive current components of each phase and the corresponding instantaneous active/reactive power components.

3.2. Active/Reactive Power Separation Mechanism for VSC

VSC can also achieve a natural separation of the active and reactive components. The principle is derived as follows.
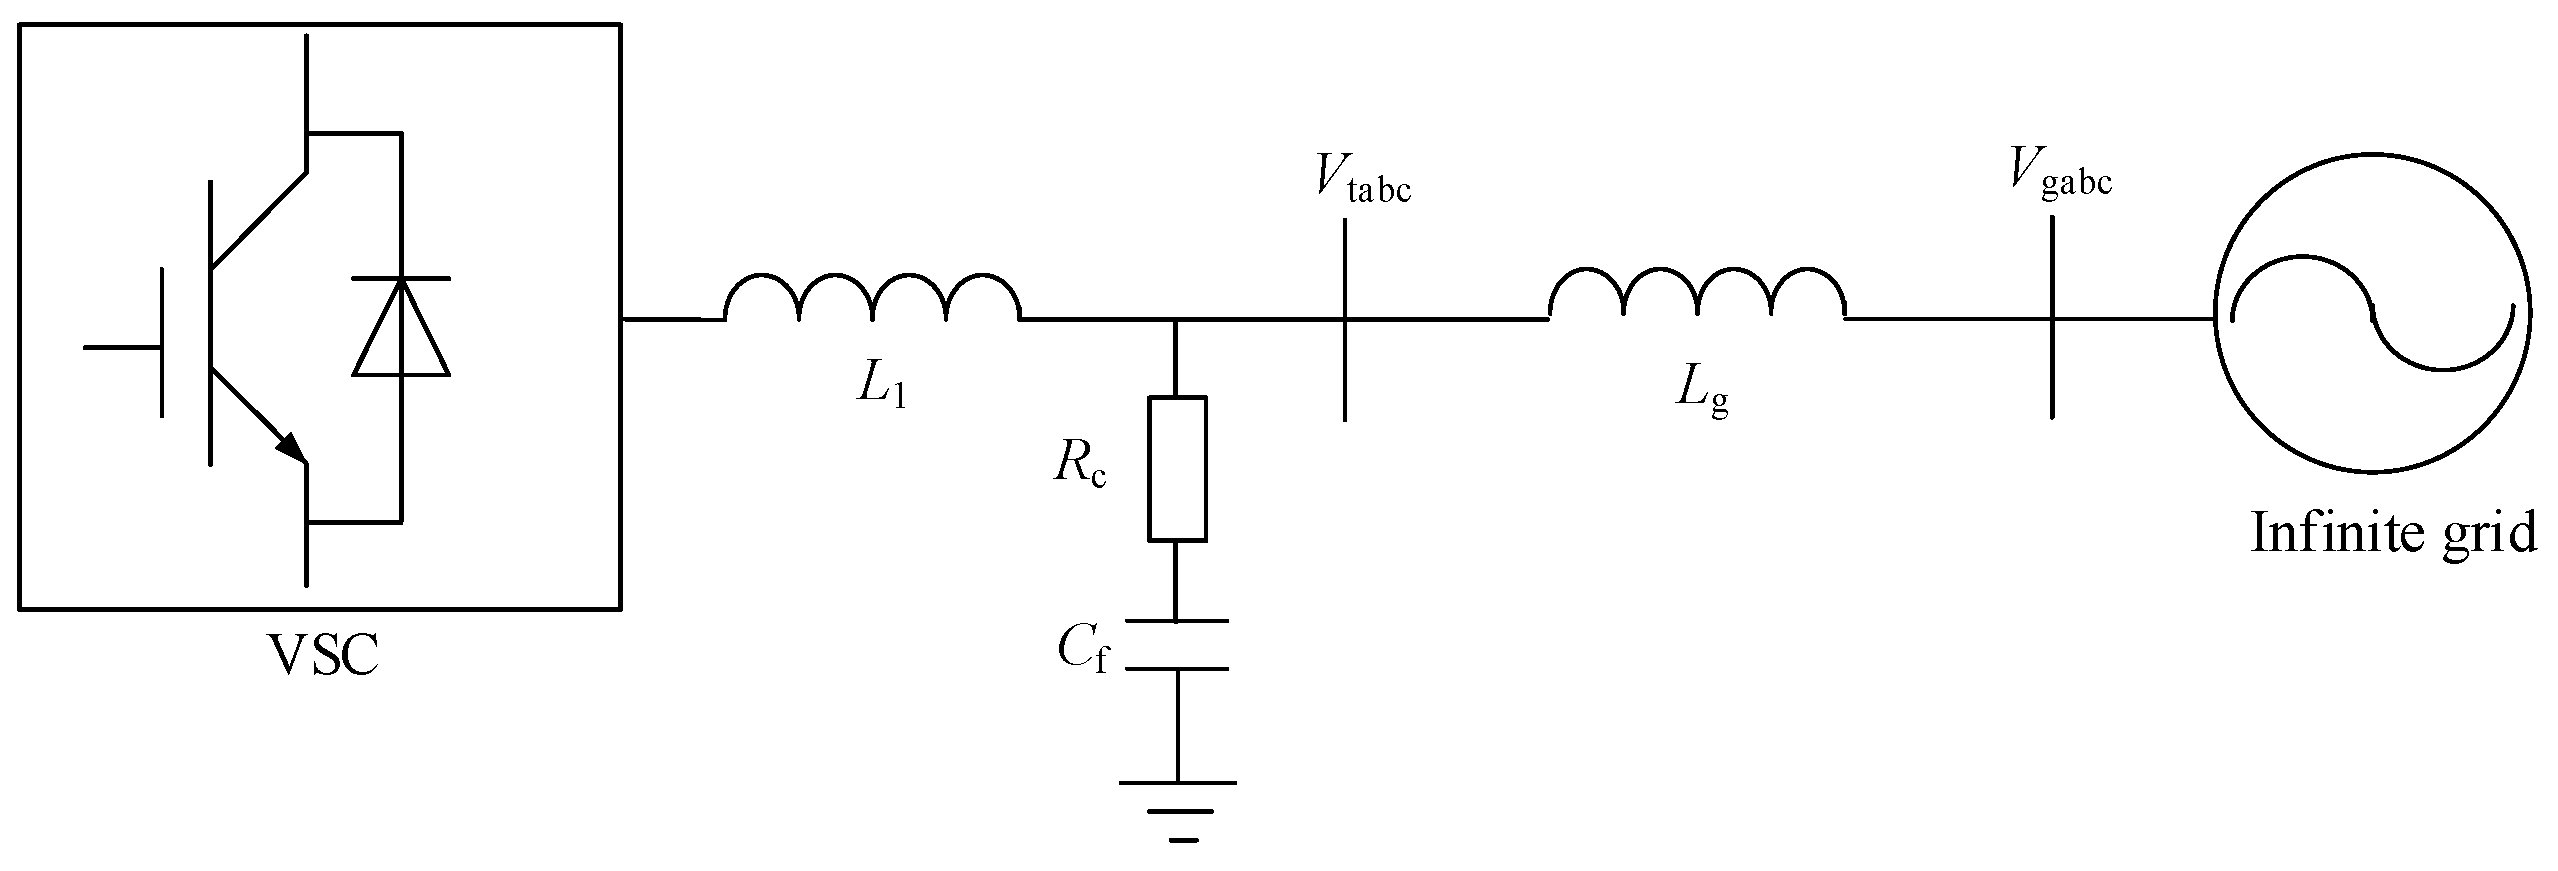
Under the constraints of circuit structure, the relationship between the current of the AC and DC sides can be described by the switching functions. The switching functions describe the conductive mode of the six bridge arms. For example, for phase a, Sa = 1 indicates that the upper bridge arm is conducting, and Sa = 0 indicates that the lower bridge arm is conducting. Then, the relationship between the current of AC/DC side can be expressed as follows:
i d c = i a S a + i b S b + i c S c
Similarly, the relationship between the voltage of the AC/DC side can also be described by the switching functions. For convenience, the negative bus of the DC side can be taken as the 0 voltage reference point. Then, the relationship between the voltage of the AC/DC side can be expressed as follows:
e a = V d c S a e b = V d c S b e c = V d c S c
Combining (5) and (6), the DC current can be expressed as follows:
i d c = e a i a + e b i b + e c i c V d c
Furthermore, (7) can be expressed in the form of the dot product of the vectors of AC voltage and current, as follows:
i d c = E I V d c I P
As seen from (8), the active current that is in-phase with the conductive pulse (or with the three-phase AC voltage rotating vector), denoted as IP of its amplitude, will flow to the DC side and form the DC bus current. As mentioned earlier, through modulation, the AC current is averaged over the carrier period. In the case of VSC, the three-phase AC currents are modulated by conductive pulses and then form the DC current. However, the reactive current, which is orthogonal to the conductive pulse (or the three-phase AC voltage rotating vector), will not flow to the DC side. Therefore, VSC can naturally separate the active/reactive components by modulating the three-phase AC current based on conductive pulses. Additionally, VSC can also perform the orthogonal decomposition shown in Figure 6, and this allows the determination of active/reactive current in each phase accordingly.

3.3. Active/Reactive Power Separation Mechanism for LCC

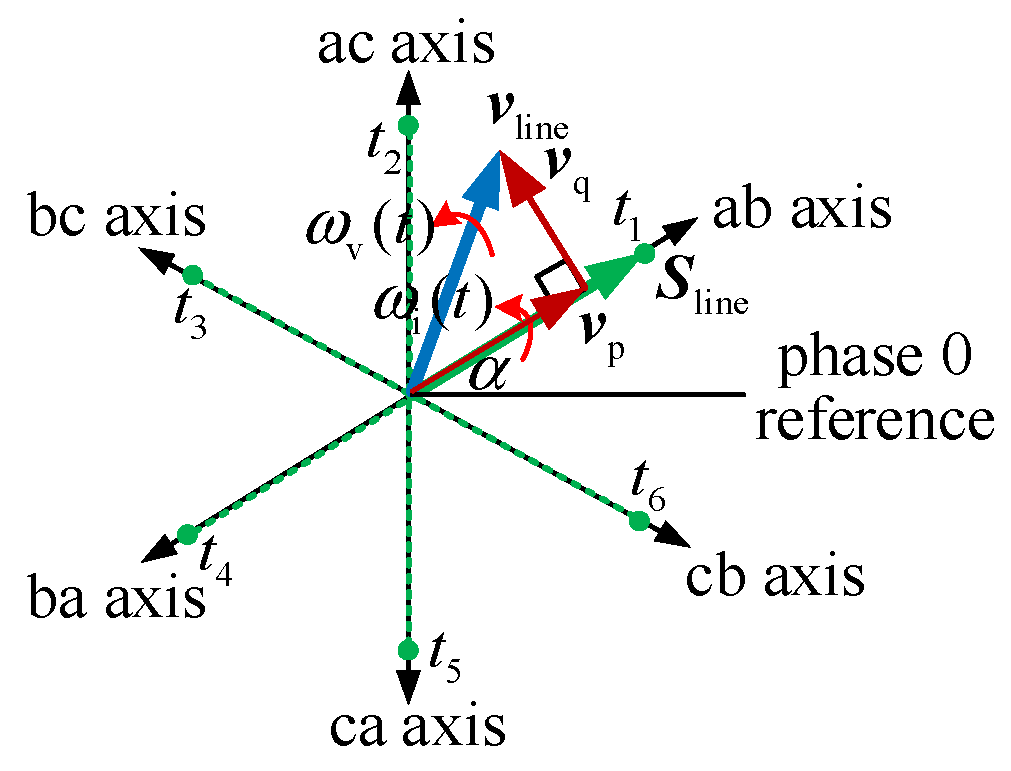
Similarly to VSC, LCC can also achieve the natural separation of active/reactive components. The principle is introduced next.
According to the working principle of LCC, the DC voltage can be represented using the AC line voltages and the corresponding switching functions, as follows [17]:
v d c = v a b S l i n e _ a b + v b c S l i n e _ b c + v c a S l i n e _ c a
where vab, vbc, and vca are the AC line voltages in the three-phase system, and Sline_ab, Sline_bc, and Sline_ca are the switching functions corresponding to the line voltages.
Taking Sline_ab as an example, with α as the actual firing angle, Sline_ab can be expressed as follows:
S l i n e _ a b = 1 , [ α + 2 k π , α + 2 k π + π / 3 ] 0 , [ α + 2 k π + π / 3 , α + 2 k + 1 π ] 1 , [ α + 2 k + 1 π , α + 2 k π + 4 π / 3 ] 0 , [ α + 2 k π + 4 π / 3 , α + 2 k + 2 π ]
The rotating vector of switching functions corresponding to the line voltages can be represented as Sline, as shown in Figure 7. As previously mentioned, conductive pulses are fired in the order of ab, ac, bc, ba, ca, and cb, with t1~t6 representing the firing times. The interval is π/3 radians. The rotating vector of the AC line voltage, denoted as vline, can also be drawn in Figure 7. According to (9), the DC voltage can be expressed as the dot product of the rotating vectors of the AC line voltage and the conductive pulse, as follows:
v d c = v l i n e S l i n e V P
Then, as shown in (11) and Figure 7, after averaging over the square wave period, the AC line voltage vector component that is in-phase with the rotating vector of conductive pulse, denoted as VP, of its amplitude, will reach the DC side and form the DC voltage. This voltage component corresponds to the active voltage. Through modulation of LCC, the AC line voltage is averaged over the square wave period. In the case of LCC, the three-phase AC-side line voltages are modulated by the conductive pulses and then form the DC voltage. Meanwhile, the AC line voltage vector component that is orthogonal to the conductive pulse rotating vector will not reach the DC side. Therefore, by modulating the three-phase AC line voltages with conductive pulses, LCC can also naturally separate the active/reactive components.

4. Simulation Results

In the previous section, how SG, VSC, and LCC achieve natural separation of active/reactive components was explored. This section will delve deeper into the separation characteristics of active/reactive components in different devices.

4.1. Waveforms on the AC and DC Sides for SG

Firstly, for SG, as mentioned earlier, the amplitude/frequency of the internal voltage is modulated by the excitation control system and rotor motion, and the AC voltage signals output by SG during dynamic processes are continuous time-varying amplitude/frequency signals. Figure 8 shows the waveforms of SG’s DC-side electromagnetic torque and AC-side currents. The simulation system uses the Matlab/SIMULINK demo for SG, referring to SG with a rated capacity of 200 MVA and a rated voltage of 13.8 kV connected to a 230 kV network through a transformer. The schematic diagram of the simulation system is shown in Figure 8. At 1 s, a disturbance occurs when the input mechanical power increases from 0.25 pu to 0.75 pu.
Figure 9a shows the electromagnetic torque on the rotor. Figure 9b shows the waveform of the amplitude of the AC-side active current. Figure 9c shows the waveform of the ratio of AC-side voltage amplitude relative to the rotor speed, which corresponds to a conversion factor in the AC-DC transformation.
Next, Figure 9d shows a comparative waveform for SG. It indicates that the electromagnetic torque equals the AC active current multiplied by the ratio of the AC-side voltage amplitude relative to the rotor speed. Thus, it is evident that the electromagnetic torque physically reflects the active current. Additionally, apart from the active current component on the AC side, there is also a reactive current component orthogonal to the voltage. In Figure 9e, the amplitude of the reactive current is shown.

4.2. Waveforms on the AC and DC Sides for VSC

For VSC, due to the presence of switches in the circuit, the AC voltage signal outputs of the VSC during dynamic processes are discrete time-varying amplitude/frequency signals. As shown in Figure 3, the rotating speed of the rotating vector of the conductive pulse is the averaged speed over the carrier period, with its phase equal to the phase of the AC-side output voltage. The simulation system uses a single VSC connected to an infinite grid via a line. The schematic diagram of the simulation system is shown in Figure 10. Specific system parameters are detailed in Appendix A.
Figure 11 illustrates the waveforms of VSC on the AC and DC sides. Figure 11a shows the actual waveform of the DC current. Figure 11b shows the waveform of the amplitude of the AC-side active current. Figure 11c shows the waveform of the ratio of the AC-side voltage amplitude relative to the DC voltage, which corresponds to the modulation ratio.
After that, Figure 11d shows a comparative waveform for VSC. It indicates that, after averaging over the PWM carrier period, the DC current equals the AC active current multiplied by the modulation ratio. This demonstrates that the DC current is a physical reflection of the active current, after averaging over the PWM carrier period. Additionally, apart from the active current component on the AC side, there exists a reactive current component orthogonal to the voltage on the AC side. The amplitude is depicted in Figure 11e.

4.3. Waveforms on the AC and DC Sides for LCC

For LCC, due to the presence of switches in the circuit, the AC current signal outputs of the LCC in dynamic processes are also discrete time-varying amplitude/frequency signals. As shown in Figure 5, the rotating speed of the rotating vector of conductive pulse is the averaged speed over the square-wave period, with its phase equal to the phase of the AC-side output current. The simulation system uses an example of a six-pulse thyristor converter HVDC demonstrated in Matlab/SIMULINK, with a rated capacity of 500 MW, AC rated voltage of 250 kV, and DC rated current of 2 kA. The schematic diagram of the simulation system is shown in Figure 12. At 0.3 s, a disturbance occurs corresponding to a 0.6 pu increase in the DC current command of current control.
Figure 13 depicts the waveforms of LCC on the AC and DC sides. Figure 13a shows the actual waveform of the DC voltage. Figure 13b shows the waveform of the amplitude of the AC-side active voltage. Figure 13c shows the waveform of the ratio of the AC-side current amplitude relative to the DC current, which corresponds to the modulation ratio. After that, Figure 13d shows a comparative waveform for LCC. It indicates that, after averaging over the square-wave period, the DC voltage equals the AC active voltage multiplied by the modulation ratio. This demonstrates that the DC voltage is a physical reflection of the active voltage, after averaging over the square-wave period. Additionally, apart from the active voltage component, there exists a reactive voltage component orthogonal to the current on the AC side. The amplitude is depicted in Figure 13e.
In summary, the AC voltage signals outputs of SG during dynamic processes are continuous time-varying amplitude/frequency signals, whereas the AC signals outputs of VSC and LCC during dynamic processes are discrete time-varying amplitude/frequency signals. As a result, there are differences in their characteristics regarding the separation of active/reactive power components. When modulation is continuous, for SG, the electromagnetic torque physically reflects the active current, while the reactive current on the AC side does not appear on the DC side. When modulation is through PWM, for VSC, the DC current physically reflects the active current. Reactive components do appear on the DC side but are averaged to zero within the PWM carrier period. Finally, when modulation is through a square wave, for LCC, the DC voltage physically reflects the active voltage. Reactive components also appear on the DC side but are averaged to zero within the square-wave period. These characteristics have been seen through simulation waveforms, as shown in Figure 9, Figure 11 and Figure 13.

5. Discussion

Current power theories generally characterize active/reactive power, especially reactive power, through mathematical definitions [5]. As a result, they fail to capture the physical implications of active/reactive power. For example, the popular instantaneous reactive power theory is a practical theory for dealing with the harmonics [8,9]. This calculation method applies to periodic steady-state systems containing harmonics. The time-varying AC voltages and currents it deals with are time-varying periodic signals described in terms of a Fourier series. In addition, the physical meaning of the instantaneous reactive power given in this method is still not clear [18]. In this paper, the physical meanings of active/reactive power are clearly explained through the physical AC-DC conversion process of converters. Additionally, this paper focuses on dynamic system processes, where the time-varying amplitude/frequency signals can include both periodic and non-periodic AC quantities. Thus, the instantaneous reactive power theory could be viewed as a special case of this paper, to some extent. This paper mainly explores the generation mechanisms of the active/reactive power in system dynamics. Through the work in this paper, the three-phase equipment (including SG, VSC, and LCC) can naturally separate the active and reactive components in a three-phase AC system. The separation mechanisms of the three-phase equipment coincide with the inherent properties of active/reactive power, which are indispensable for a rational understanding of the physical concept of active/reactive power. The dynamic analysis, measurement, and control of the active/reactive power all require a rational understanding of the physical concept of active/reactive power.
Grid-connected devices regulate the frequency/amplitude of internal voltages by directly sensing or measuring the active/reactive power (or current), thereby controlling the active/reactive power injected into the system. For each grid-connected device, it is essential to provide pathways for the active/reactive components in three-phase power systems. However, the academic community has yet to place sufficient emphasis on the power generation mechanisms during system dynamic processes. To address this issue, this paper investigates the separation mechanisms and characteristics of active/reactive power for different signals modulated power devices during system dynamic processes.
Practically speaking, previous research in [15] has proposed expressions for calculating active/reactive power in three-phase AC system dynamics under time-varying amplitude/frequency signals. However, ref. [15] investigated the separation mechanism of active/reactive power only in the VSC grid-connected systems. It is important to note that the mathematical representations of active/reactive power in previous research [15] and this paper, the instantaneous reactive power calculation method, and the traditional sinusoidal steady-state power calculation method, are all consistent in form. The representations of active/reactive power are as follows:
P ( t ) = 3 2 E I cos E , I = 3 2 E I P = 3 2 E ( t ) I ( t ) cos ( θ e ( t ) θ i ( t ) )
Q ( t ) = 3 2 E I sin E , I = 3 2 E I Q = 3 2 E ( t ) I ( t ) sin ( θ e ( t ) θ i ( t ) )
Since previous research in [
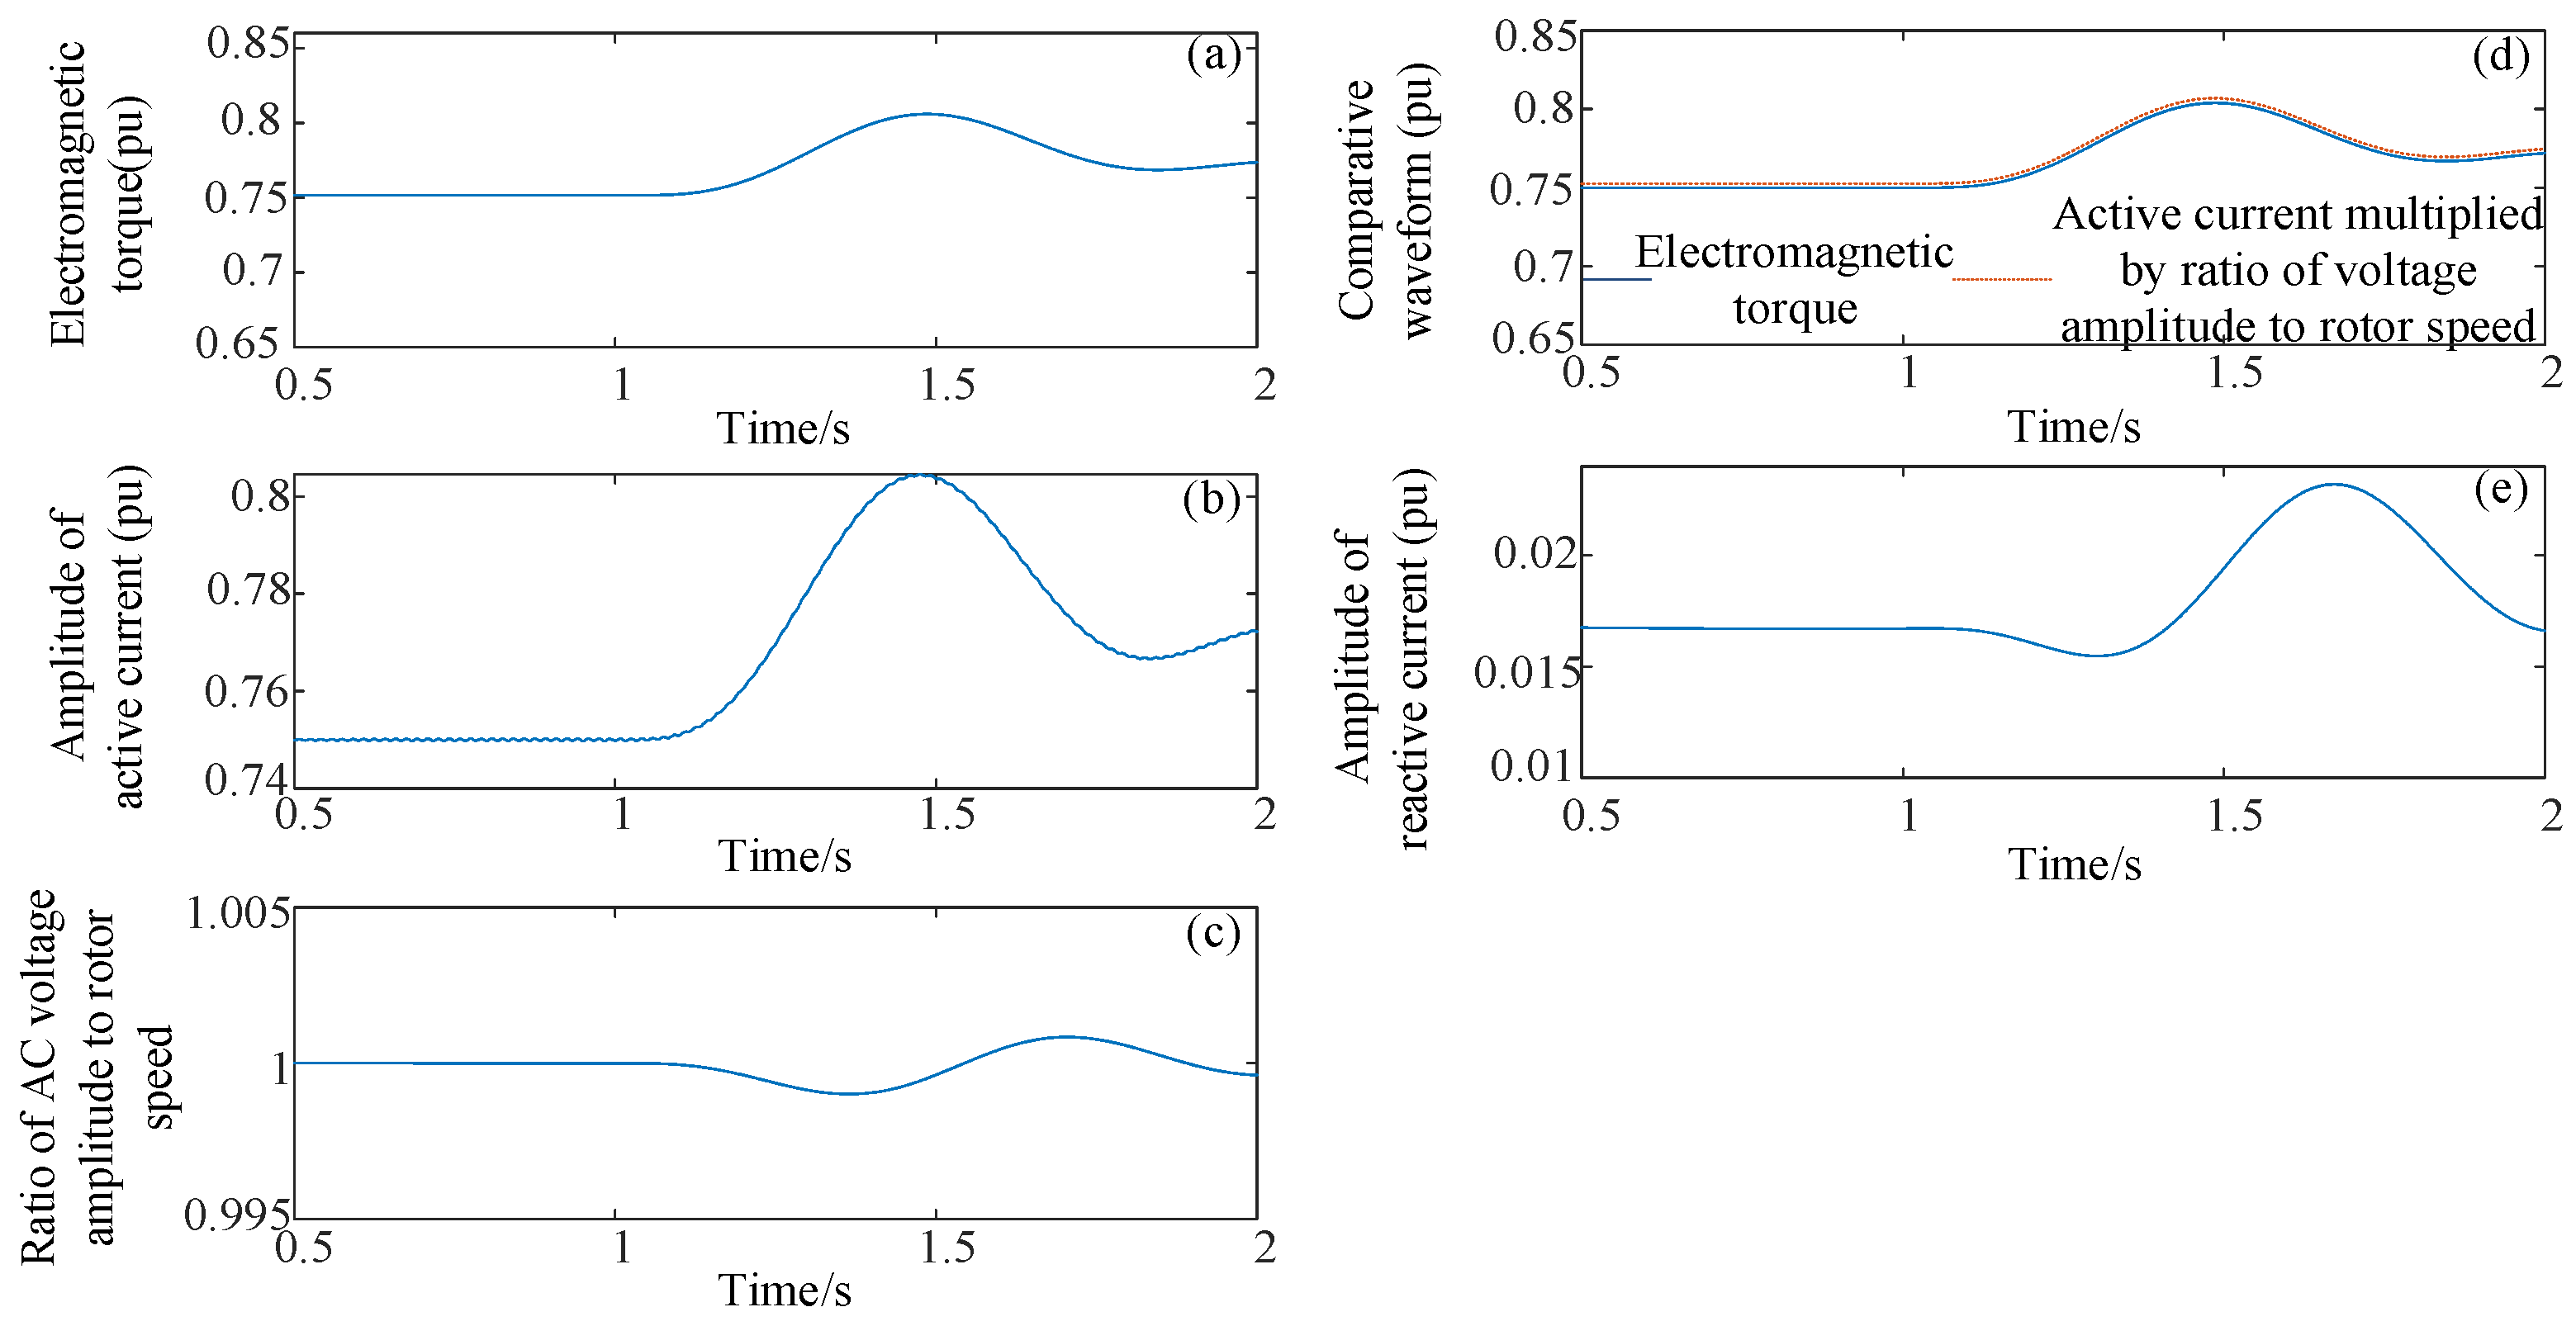
15] has not yet discussed conditions under the continuous and the square-wave signals modulation forms, it can be seen that this paper represents a further deepening of previous findings, aiming to expand applicability to broader domains. More importantly, the work in this paper lays a foundation for power measurement in systems comprising SGs, VSCs, and LCC-HVDC transmission, providing physically grounded insights into dynamic processes. The findings of this paper also indicate that the analysis, measurement, and control of the active/reactive components in renewable energy equipment based on the instantaneous reactive power calculation method or the traditional sinusoidal steady-state power calculation method do not need to be updated. However, the other methods may need to be amended according to the representations of the active/reactive power in Equations (12) and (13). Active power can be calculated using the three-phase instantaneous values, as shown in (12). According to the simulation results in Figure 9d, for the SG, the torque equals the product of the active current and voltage divided by the rotational speed. Since the product of torque and speed represents the active power, Equation (12) for an SG essentially corresponds to the product of torque and rotational speed. The active current is the in-phase component of the current with respect to the voltage, while the quadrature component is the reactive current, as shown in 
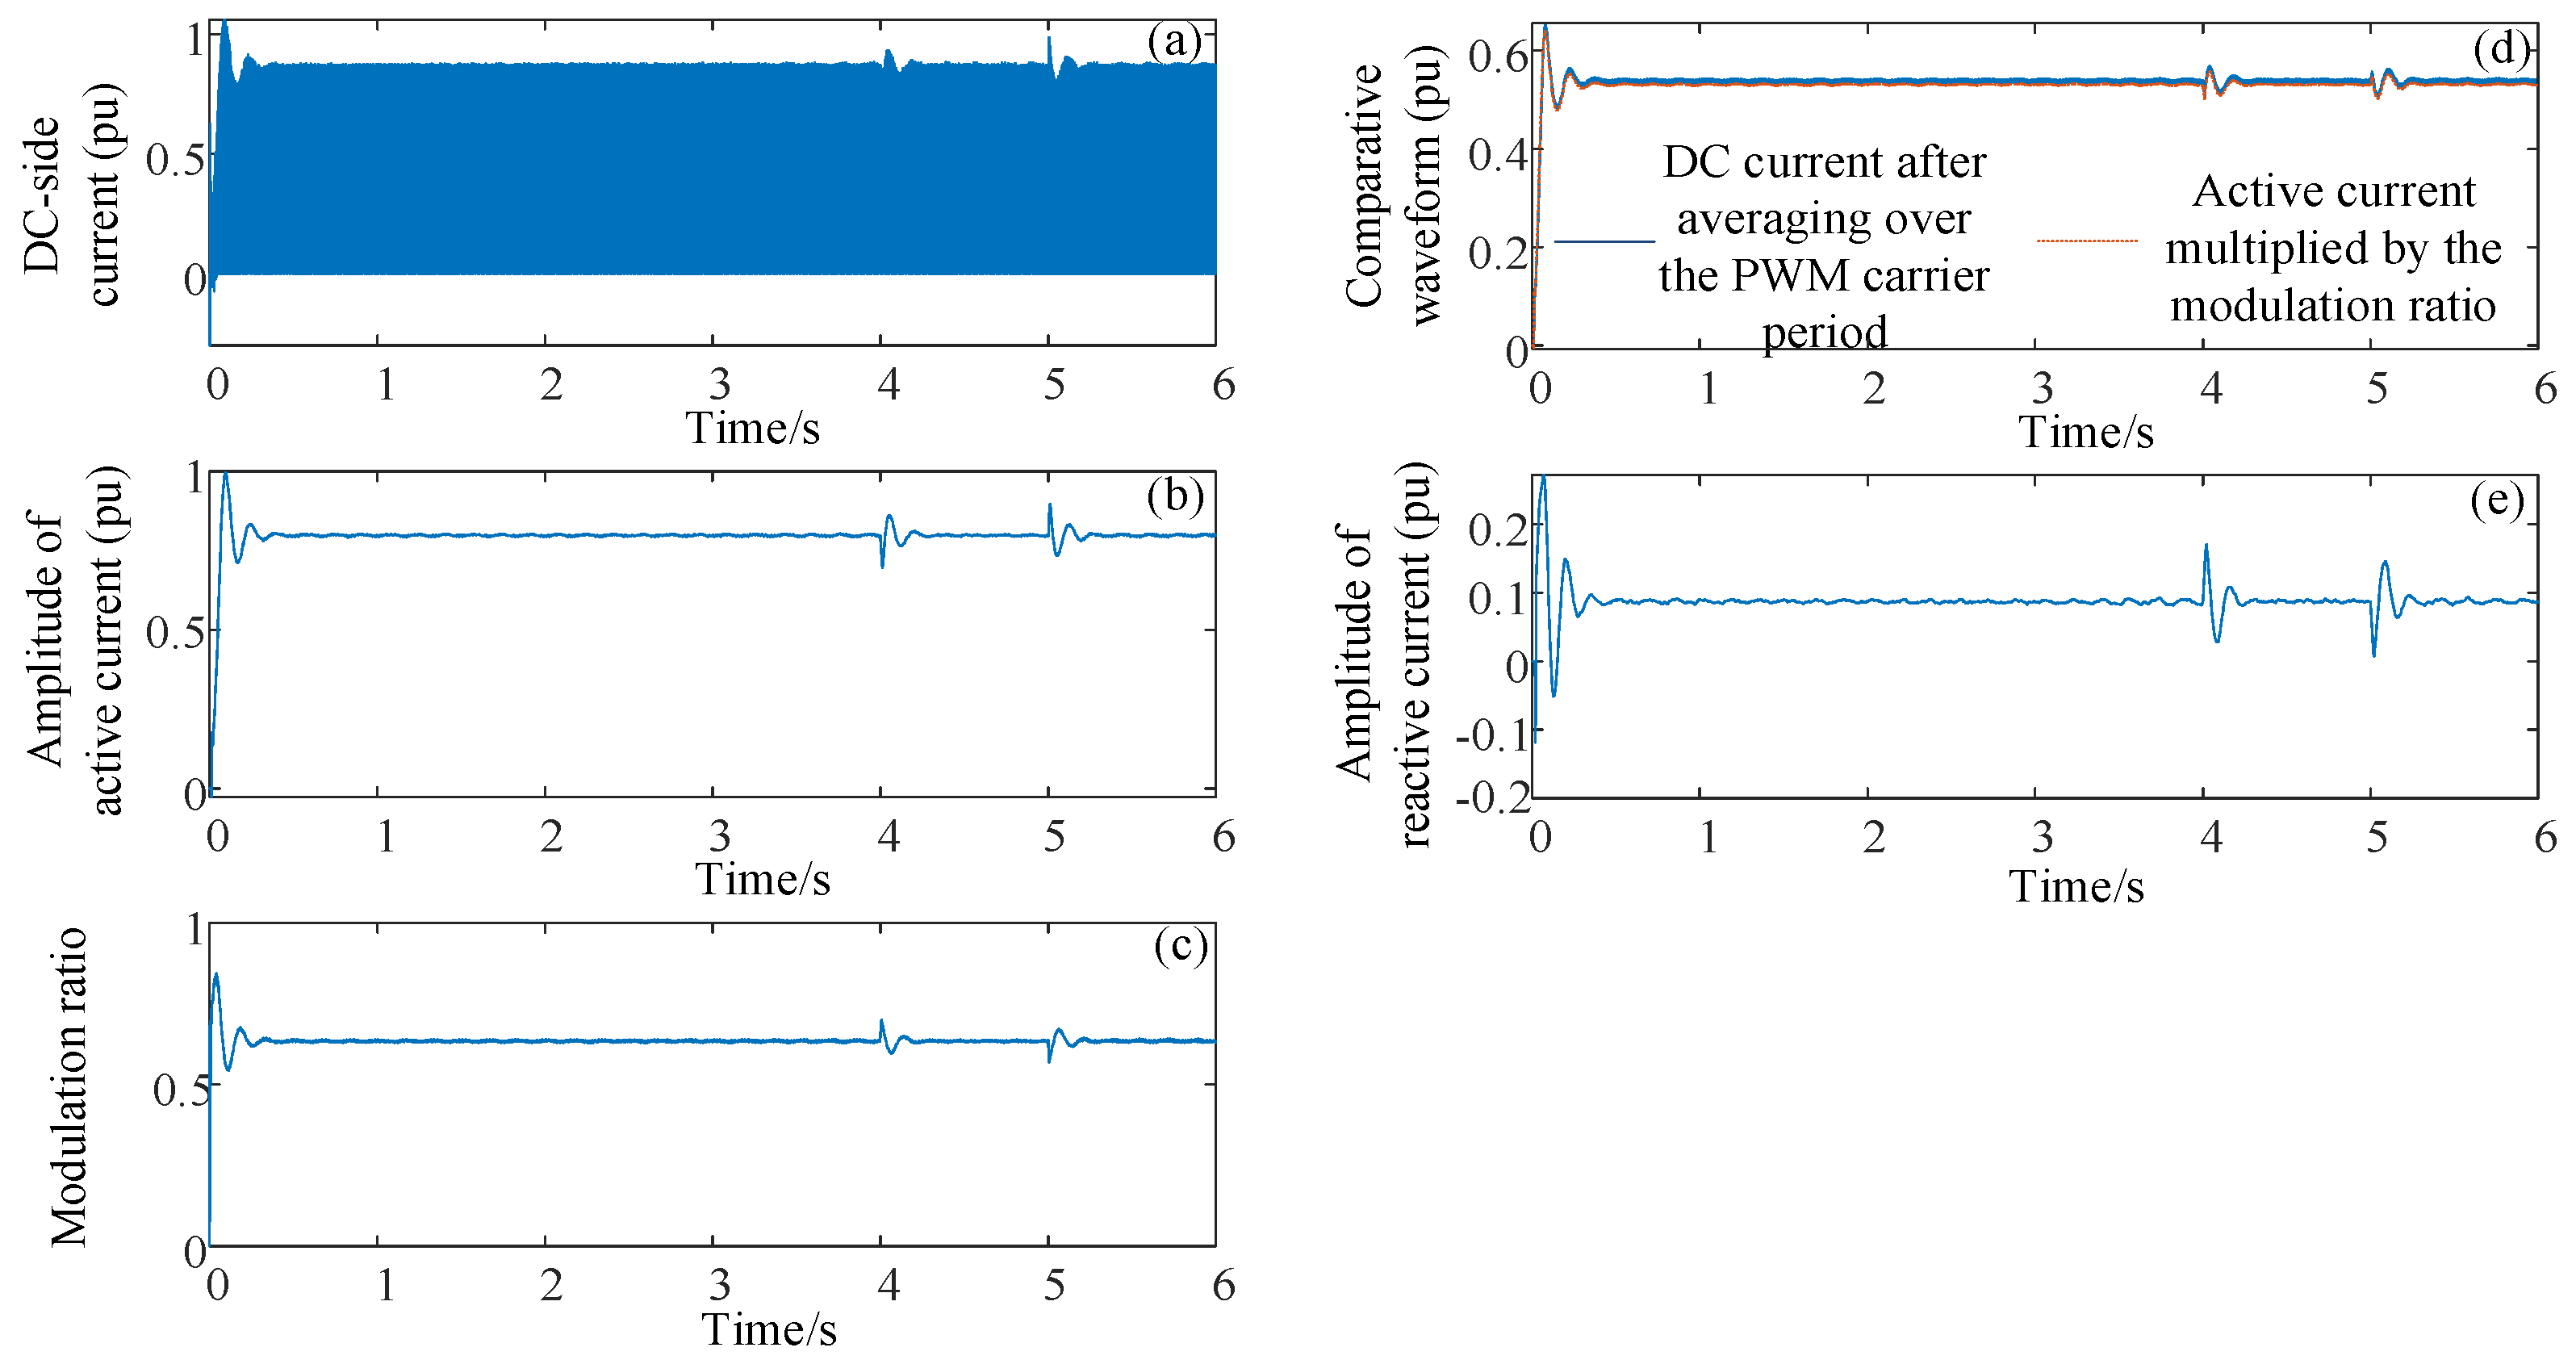
Figure 9e. Reactive power can be calculated as the product of the reactive current and the voltage amplitude. Equivalently, it can also be computed from the three-phase instantaneous values, as shown in (13). For the VSC, as shown in Figure 11d, the average value of the DC current over a PWM carrier period equals the product of the active current and the modulation ratio. Since the product of DC current and DC voltage represents the active power, Equation (12) for the VSC effectively corresponds to the product of the average DC current (over the PWM carrier period) and the DC voltage. The quadrature component of the current with respect to the voltage is the reactive current, as illustrated in 
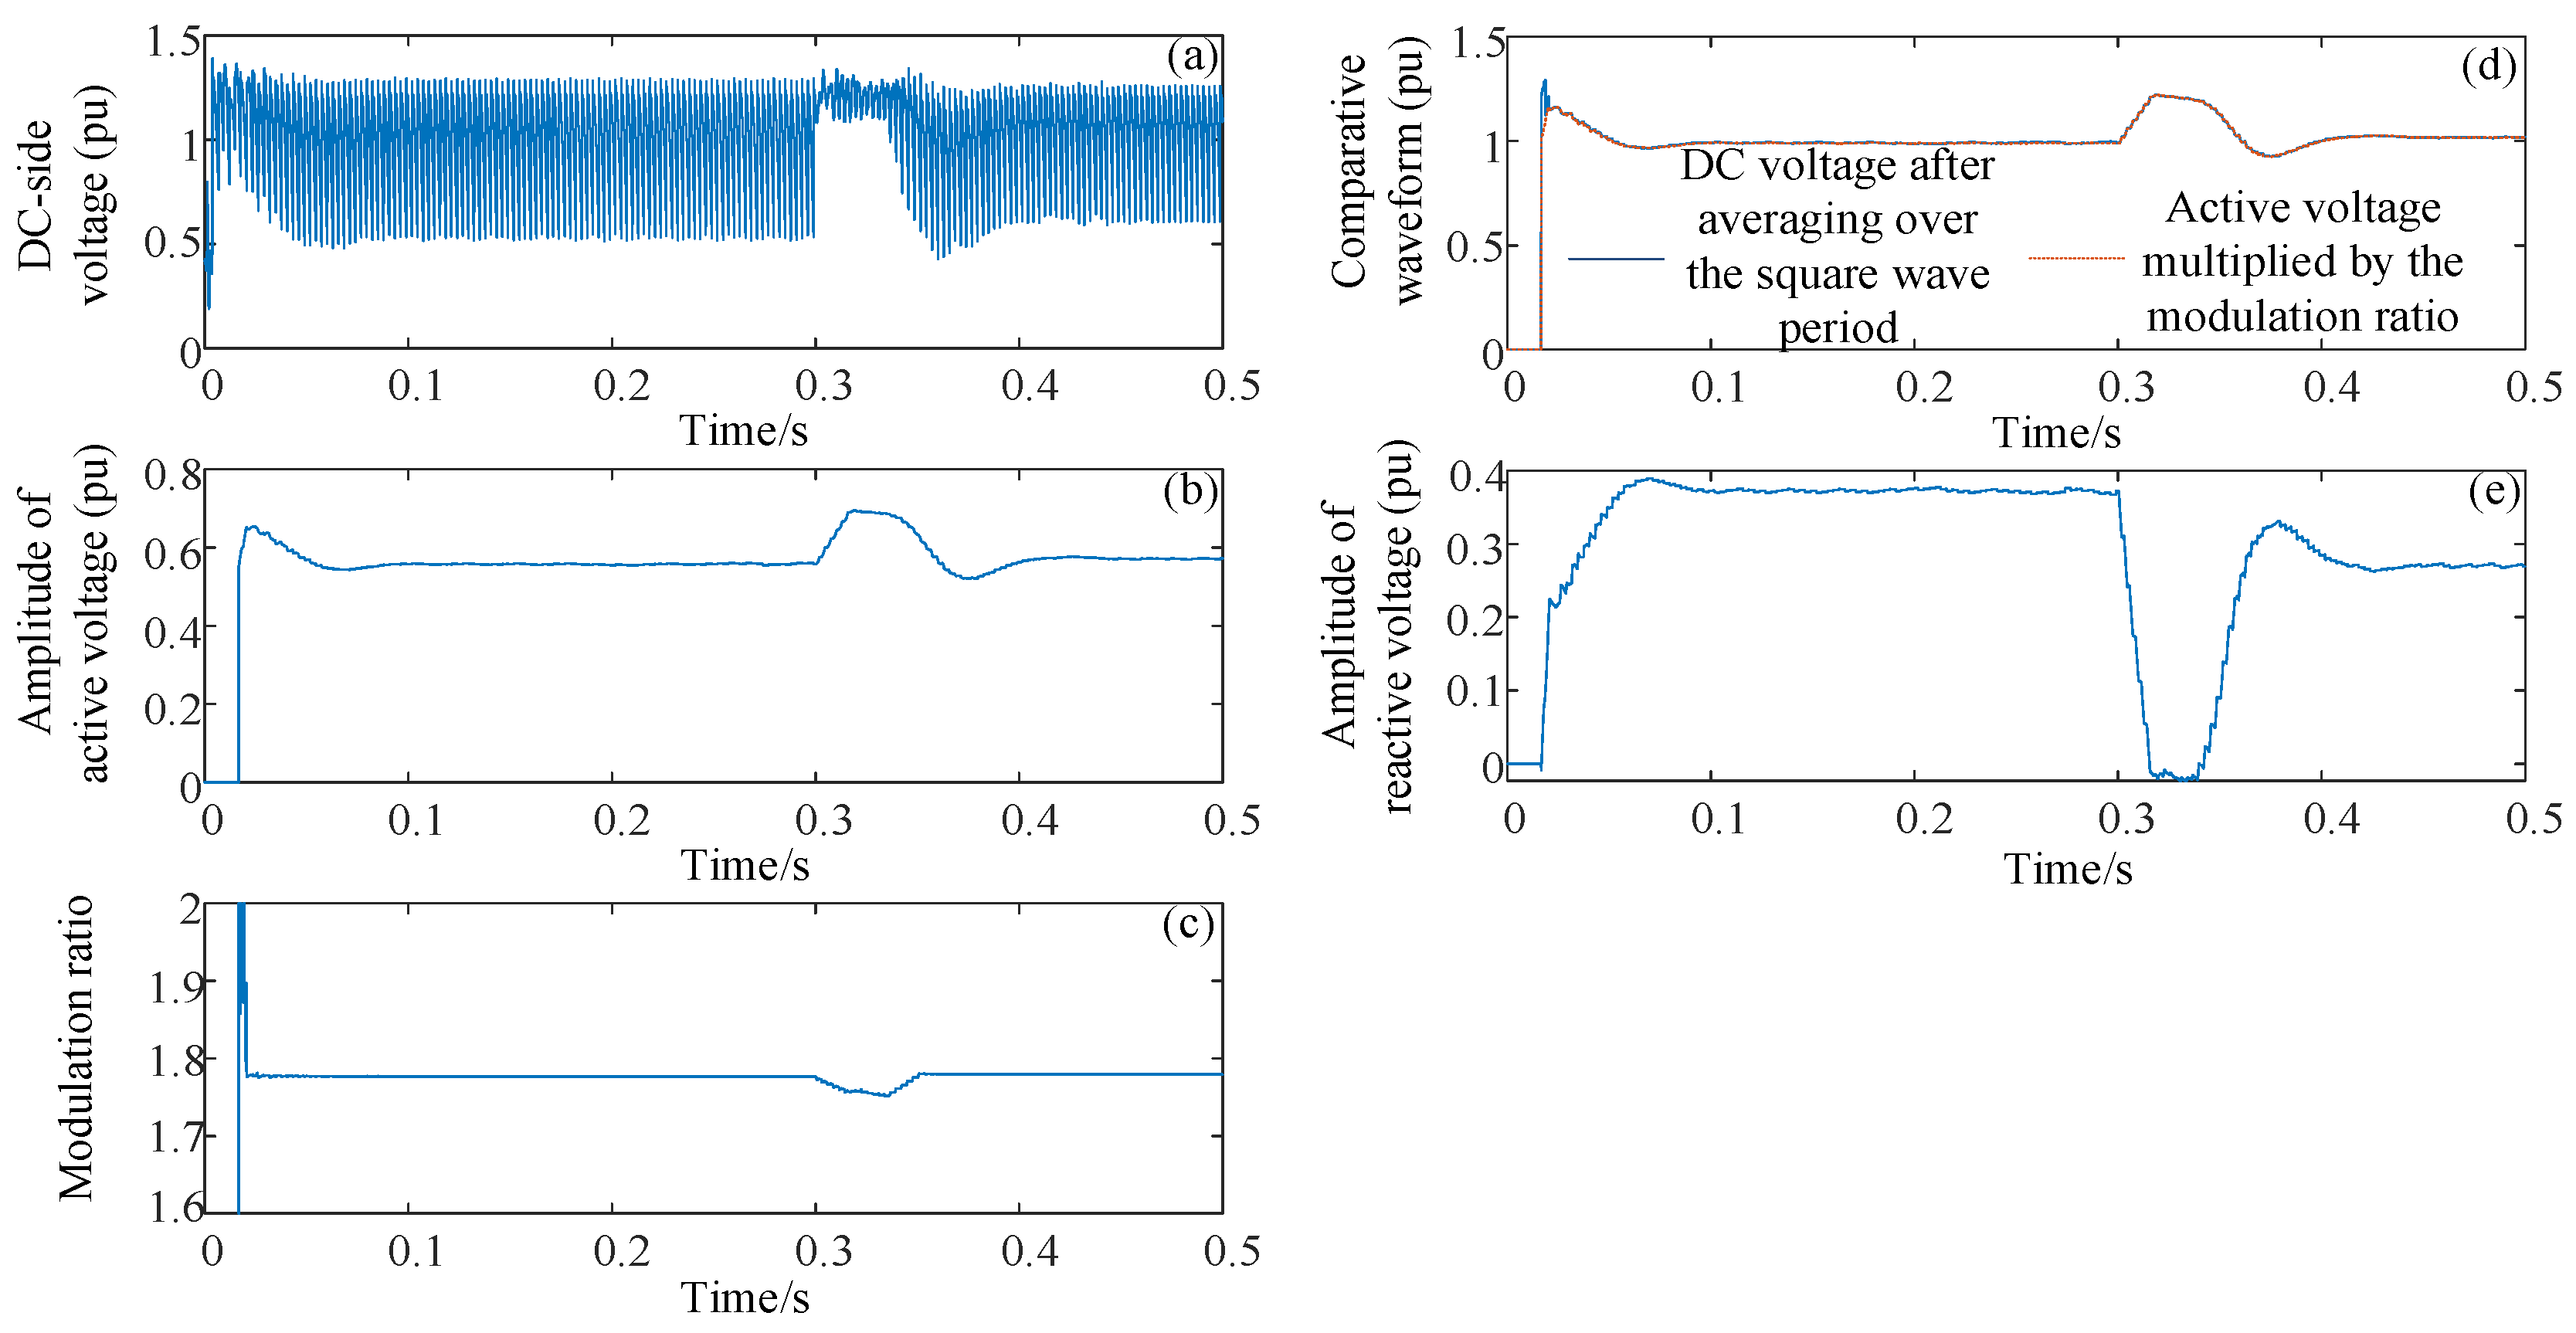
Figure 11e. Reactive power is calculated as the product of reactive current and voltage amplitude. For the VSC, this reactive component circulates among the six switching devices and is physically present. Equivalently, it can also be calculated from the three-phase instantaneous values, as described by (13). For the LCC, based on the simulation results shown in Figure 13d, the average value of the DC voltage over the square-wave carrier period equals the product of the active voltage and the modulation ratio. Since the product of DC voltage and DC current represents the active power, Equation (12) for the LCC likewise corresponds to the product of the average DC voltage (over the square-wave period) and the DC current. The voltage component orthogonal to the current is the reactive voltage, as shown in Figure 13e. In summary, through the analysis presented in this study, the physical meanings of Equations (12) and (13) for calculating active and reactive power are clearly and explicitly demonstrated.

6. Conclusions

This paper describes different AC voltage and current signals based on time-varying amplitude/frequency rotating vectors and explores active/reactive power separation mechanisms for three types of grid-connected devices under continuous/PWM/square wave modulations. According to the basic operating principles of different devices, under continuous/PMW/square-wave modulations, all three types of grid-connected devices output time-varying amplitude/frequency signals in dynamic processes. Meanwhile, these devices can naturally separate active/reactive components; although the specific separation methods vary with the modulation types, the core principles remain consistent. The characteristics of separating active/reactive components by different devices are as follows: in SG with the continuous modulated method, reactive components do not appear on the DC side; in VSC with the PWM method, reactive components appear on the DC side but average to zero within the PWM carrier period; in LCC with the square-wave modulated method, reactive components appear on the DC side but average to zero within the square-wave period. Finally, this paper represents a deeper exploration of the findings in [15], with the aim of expanding the applicability of active/reactive power calculation formulas to broader domains. The main contributions are as follows:
  • From a theoretical perspective, active/reactive power separation mechanisms for three types of grid-connected devices under continuous/PWM/square-wave modulations are explored, including SG, VSC, and LCC-HVDC. The characteristics of separating active/reactive components by different devices are as follows: in SG with the continuous modulated method, reactive components do not appear on the DC side; in VSC with the PWM method, reactive components appear on the DC side but average to zero within the PWM carrier period; in LCC with the square-wave modulated method, reactive components appear on the DC side but average to zero within the square-wave period.
  • From a practical perspective, through the analysis presented in this study, the physical meanings of Equations (12) and (13) for calculating active/reactive power are clearly and explicitly demonstrated. This can form a foundation for power measurement in systems comprising SGs, VSCs, and LCC-HVDC transmission, providing physically grounded insights into dynamic processes. The applicability of active/reactive power calculation formulas of Equations (12) and (13) can be expanded to broader domains.

Author Contributions

H.Y.: writing—original draft preparation. Y.Y. and S.L.: supervision, validation, funding acquisition. Y.Z.: reviewing and validation. All authors have read and agreed to the published version of the manuscript.

Funding

This research was funded by the China Southern Power Grid Company Technology Project under Grant 036000KC23090005 (GDKJXM20231027).

Data Availability Statement

The data presented in this study are available on request from the corresponding author.

Conflicts of Interest

Authors Yang Yi and Shun Li were employed by the company Electric Power Dispatching and Control Center of Guangdong Power Grid. The remaining authors declare that the research was conducted in the absence of any commercial or financial relationships that could be construed as a potential conflict of interest.

Abbreviations

The following abbreviations are used in this manuscript:
EHVExtra high voltage
SGSynchronous generator
VSCVoltage source converter
LCC-HVDCLine-commutated converter-based high-voltage DC
PWMPulse width modulation
SPWMSinusoidal pulse width modulation
PLLPhase-locked loop

Appendix A

Appendix A.1. Base Values

Sbase = 2 MVA, Vbase = 690 V, fbase = 50 Hz, ωbase = 2πfbase

Appendix A.2. Grid Parameters

L1 = 0.2 pu, Cf = 0.05 pu, Rc = 0.55 pu, Lg = 0.4 pu, Vgabc = 1 pu, Idref = 0.8 pu, Iqref = 0 pu

Appendix A.3. VSC Controller Parameters

Current Control: kpd = kpq = 1.4, kid = kiq = 50
PLL: kpp = 60, kip = 1400

References

  1. Ma, J.; Zhao, D.; Qian, M.; Zhu, L.; Yao, L.; Wang, N. Reviews of control technologies of large-scale renewable energy connected to weakly-synchronized sending-end DC power grid. Power Syst. Technol. 2017, 41, 3112–3120. [Google Scholar]
  2. Zhao, M.; Nan, D.; Hao, H. Blocking contingency and commutation failure for Zhundong HVDC transmission. Electr. Eng. 2018, 19, 73–79. [Google Scholar]
  3. Li, M.; Yu, Z.; Xu, T.; He, J.; Wang, C.; Xie, X.; Liu, C. Study of complex oscillation caused by renewable energy integration and its solution. Power Syst. Technol. 2017, 41, 1034–1042. [Google Scholar]
  4. Kundur, P. Power System Stability and Control; McGraw-Hill: New York, NY, USA, 1994. [Google Scholar]
  5. Xiao, X.; Luo, C.; Tao, S. Development and challenges of power theory in electrical power system. Trans. China Elect. Soc. 2013, 28, 1–10. [Google Scholar]
  6. Chen, Y.; Peng, H.; Fan, Y. The definition theory and mathematical model of reactive power for arbitrary periodical voltage and current waveform. Proc. CSEE 2006, 26, 105–112. [Google Scholar]
  7. Fryze, S. Active, reactive and apparent power in circuits with non-sinusoidal voltage and current. Przegląd Elektrotechniczny 1932, 625–627, 596–599. [Google Scholar]
  8. Akagi, H.; Kanazawa, Y.; Nabae, A. Generalized theory of instantaneous reactive power and its application. Trans. Inst. Electr. Eng. Jpn. B 1983, 103, 483–490. [Google Scholar] [CrossRef]
  9. Akagi, H.; Watanabe, E.H.; Aredes, M. Instantaneous Power Theory and Application to Power Condition, 2nd ed.; Wiley-IEEE Press: Hoboken, NJ, USA, 2017. [Google Scholar]
  10. Yang, H.; Yuan, X. Physical concept understanding and mathematical calculation of active/reactive power in dynamic process of three-phase system under time-varying amplitude-frequency signals. Proc. CSEE 2022, 42, 548–558. [Google Scholar]
  11. Steinmetz, C.P. Complex quantities and their use in electrical engineering. In Proceedings of the International Electrical Congress, Chicago, IL, USA, 21–25 August 1893. [Google Scholar]
  12. Venkatasubramanian, V. Tools for dynamic analysis of the general large power system using time-varying phasors. Int. J. Electr. Power Energy Syst. 1994, 16, 365–376. [Google Scholar] [CrossRef]
  13. Yuan, X.; Wang, S. Operating-point identification from dimensions of alternating signal based on the incremental iterative mapping mechanism for analyzing dynamics of AC systems. CSEE J. Power Energy Syst. 2025, 11, 163–172. [Google Scholar] [CrossRef]
  14. Yuan, X.; Li, S. An amplitude/frequency modulation based method of voltage source converter for power systems dynamic analysis in current control. Proc. CSEE 2020, 40, 4732–4744. [Google Scholar]
  15. Yang, H.; Yuan, X.; He, W. Active/reactive power generation mechanisms and representations in system dynamics with time-varying amplitude/frequency signals. CSEE J. Power Energy Syst. 2024, 1–13. [Google Scholar] [CrossRef]
  16. Lu, J.; Yuan, X.; Hu, J.; Zhang, M.; Yuan, H. Motion equation modeling of LCC-HVDC stations for analyzing DC and AC network interactions. IEEE Trans. Power Deliv. 2020, 35, 1563–1574. [Google Scholar] [CrossRef]
  17. He, S.; Yuan, X.; Hu, J.; Yang, H. Mechanism of conversion between AC and DC electrical variables in LCC main circuits during grid dynamics using time-varying amplitude/frequency rotating vectors. IEEE Access 2024, 12, 74148–74160. [Google Scholar] [CrossRef]
  18. Zhao, H. Instantaneous reactive power theory and methods. Proc. CSEE 2014, 34, 47–53. [Google Scholar]
Figure 1. The time-varying amplitude/frequency rotating vector for SG and the formation of the three-phase AC internal voltages. (a) Structure of an ideal SG. (b) Spatial rotating vector E. (c) Schematic diagram of the process of internal voltage rotating vector’s formation and the projection of internal voltage rotating vector to form the three-phase instantaneous values.
Processes 13 01907 g001
Figure 2. The generation of the amplitude/frequency of the internal voltage and waveforms of the three-phase AC internal voltage of the VSC.
Processes 13 01907 g002
Figure 3. Rotating vectors of conductive pulse and internal voltage of VSC.
Processes 13 01907 g003
Figure 4. Generation of amplitude/frequency of internal current by rectifier station and waveforms of AC internal current of LCC.
Processes 13 01907 g004
Figure 5. Rotating vectors of conductive pulse and internal current of LCC.
Processes 13 01907 g005
Figure 6. Orthogonal decomposition of time-varying amplitude/frequency rotating vector of AC current.
Processes 13 01907 g006
Figure 7. Rotating vectors of the AC line voltage vline and corresponding conductive pulse Sline of LCC.
Processes 13 01907 g007
Figure 8. Schematic diagram of SG connected to a 230 kV network through a transformer.
Processes 13 01907 g008
Figure 9. Waveforms of SG on the AC and DC sides. (a) Electromagnetic torque. (b) Amplitude of active current. (c) Ratio of AC voltage amplitude to rotor speed. (d) Comparative waveform. (e) Amplitude of reactive current.
Processes 13 01907 g009
Figure 10. Schematic diagram of a single VSC connected to an infinite grid via a line.
Processes 13 01907 g010
Figure 11. Waveforms of VSC on the AC and DC sides. (a) DC-side current. (b) Amplitude of active current. (c) Modulation ratio. (d) Comparative waveform. (e) Amplitude of reactive current.
Processes 13 01907 g011
Figure 12. Schematic diagram of a six-pulse HVDC transmission system.
Processes 13 01907 g012
Figure 13. Waveforms of LCC on the AC and DC sides. (a) DC-side voltage. (b) Amplitude of active voltage. (c) Modulation ratio. (d) Comparative waveform. (e) Amplitude of reactive voltage.
Processes 13 01907 g013
Disclaimer/Publisher’s Note: The statements, opinions and data contained in all publications are solely those of the individual author(s) and contributor(s) and not of MDPI and/or the editor(s). MDPI and/or the editor(s) disclaim responsibility for any injury to people or property resulting from any ideas, methods, instructions or products referred to in the content.

