Article

Uncertainty-Aware Economic Dispatch of Integrated Energy Systems with Demand-Response and Carbon-Emission Costs

1
State Power Investment Corporation Southwest Energy Research Institute Co., Ltd., Chengdu 610299, China
2
School of Mechanical and Electrical Engineering, University of Electronic Science and Technology of China, Chengdu 610054, China
*
Author to whom correspondence should be addressed.
Processes 2025, 13(6), 1906; https://doi.org/10.3390/pr13061906
Submission received: 29 April 2025 / Revised: 1 June 2025 / Accepted: 5 June 2025 / Published: 16 June 2025

Abstract

This study investigates the economic operation of integrated energy systems under uncertainty, aiming to boost operational efficiency and cost-effectiveness while reducing carbon emissions. Unlike existing methods that either ignore the demand response or treat uncertainties separately, we introduce a two-stage robust optimization scheduling framework that simultaneously integrates demand-response mechanisms and carbon-emission costs. In Stage I, a preliminary dispatch is obtained for deterministic scenarios based on forecasted values of renewable outputs and load demands; in Stage II, the solution is refined against worst-case fluctuations in renewable output and load demand. A column-and-constraint generation algorithm facilitates efficient, iterative coordination between the two stages, resulting in an optimal and robust dispatch strategy. To validate our approach, we performed detailed numerical simulations on a standard benchmark for integrated energy systems commonly used in the literature. The results show that by accounting for multiple sources of uncertainty, the system’s energy cost fell from 7091.03 RMB to 6489.18 RMB—a saving of 8.49%—while the carbon emissions dropped from 6165.57 kg to 5732.54 kg, a reduction of 7.02%. Compared with conventional scenario-based dispatch methods, the proposed two-stage framework demonstrates superior adaptability and robustness in handling renewable generation and load uncertainties, providing strong technical backing and theoretical insights for the sustainable operation of integrated energy systems in uncertain environments.

1. Introduction

With the rapid development of the global economy, energy demand is rising sharply, so traditional energy systems are now under unprecedented pressure [1,2]. Integrated energy systems (IESs), as efficient and sustainable solutions, have gradually emerged and attracted widespread attention [3]. The core advantage of IESs is that they integrate various distributed energy resources—such as photovoltaics, wind power, cogeneration, and energy storage equipment [4]. This integration not only improves energy efficiency and reduces waste but also promotes democratized, distributed energy management, giving consumers greater autonomy in their choices [5]. However, IESs still face significant practical challenges, the most prominent of which is uncertainty in renewable energy generation and load, making accurate demand prediction difficult [6]. These uncertainties both complicate system optimization and scheduling and pose a serious threat to IES stability [7]. Robust optimization scheduling ensures that IESs can achieve an optimal balance between production and consumption under various uncertain factors by coordinating multiple energy resources and optimizing allocation strategies [8,9]. Therefore, studying robust optimization scheduling for IESs in uncertain environments can improve their reliability and efficiency [10,11] and is key to achieving sustainable energy systems.
The scheduling optimization of IESs is a current hot topic in the energy research field. Many scholars have proposed economic dispatch strategies and algorithms for IESs based on a variety of models and methods. Qian J et al. proposed a dual-layer optimization model for a comprehensive energy system that considers multiple types of energy storage, effectively reducing the system’s cost and carbon emissions [12]. Wang J et al. proposed a coordinated scheduling strategy for wind–solar hydrogen-storage IESs that reduces the intermittency of wind and solar energy [13]. Ma Y et al. used the fuzzy analytic hierarchy process to establish an evaluation system for the comprehensive energy systems of electric thermal-cooling energy-storage industrial parks, optimizing the operational performance of the parks [14]. Jia B et al. proposed a knowledge network-embedded method for energy management in IESs that improves user comfort and reduces operating costs [15]. Zhu X et al. proposed a low-carbon economic dispatch method for a comprehensive energy system with multiple time scales considering a stepped carbon trading mechanism, effectively reducing the total cost of the system operation [16]. Yan N et al. proposed a comprehensive energy-system scheduling strategy that considers flexible electric heating loads, achieving peak shaving and valley filling while reducing system carbon emissions and costs [17]. Ye S et al. proposed a comprehensive energy system optimization model that considers the dynamic balance of thermal energy and a hydrogen storage system, effectively improving the consumption level of solar power [18]. Chen X et al. proposed an IES dual-layer optimization planning model that considers multiple operational uncertainties, which can effectively reduce the operating costs of IESs [19]. The aforementioned studies have developed various energy-scheduling frameworks to achieve economic dispatch in IESs, but they do not account for uncertainties in the energy production and consumption processes. Due to factors such as weather variability, fluctuations in supply, and unpredictability of load demand, relying solely on forecasted scenarios for optimization may fail to ensure the economic efficiency and robustness of the optimal scheduling strategy in actual operation [20,21].
In order to address uncertainty in IESs’ scheduling optimization processes, many scholars have introduced stochastic optimization methods to mitigate the variability arising from system energy production and consumption. Ref. [22] proposes a chance-constrained optimization model that incorporates carbon-aware dynamic pricing for EV charging, helping to reduce carbon emissions and improve renewable-energy utilization. Ref. [23] introduces a stochastic energy-scheduling model for a multi-energy hybrid system, considering operating costs, curtailment penalties, and tiered carbon-trading costs to achieve a low-carbon and economical schedule. Ref. [24] has developed a novel stochastic method based on error-based scenarios and a day-ahead/real-time dynamic scheduling strategy, accurately capturing extreme scenarios and enhancing distributed energy-system performance from both economic and environmental perspectives. Ref. [25] presents a stochastic scheduling framework for integrated systems that employs a hybrid characterization approach and a piecewise linear model, effectively boosting renewable-energy utilization and alleviating charging-electricity strain. Ref. [26] offers a stochastic modeling framework for hybrid energy systems and solves the scheduling problem with an improved Kepler optimization algorithm, thereby improving system reliability and reducing operational costs. Although the above studies have investigated IESs’ uncertainty models using stochastic optimization methods, these approaches typically convert the uncertain scheduling problem into a deterministic one based on specific probability distributions. Since precise probability distributions are difficult to determine, the scheduling results often fail to cover all extreme scenarios effectively, and it is often difficult to guarantee the robustness of the resulting strategies [27]. Furthermore, with the urgent global demand for green development, IES scheduling must not only consider economic factors but also account for low-carbon policies to achieve more sustainable, economical operation of the system [28].
Therefore, to ensure the low-carbon, robust, and economical operation of IESs, this paper investigates robust energy-scheduling strategies for IESs that consider low-carbon policies. The main contributions of this paper are as follows:
(1) A two-stage robust energy-scheduling framework is proposed. In the first stage, energy scheduling is conducted based on deterministic scenarios. In the second stage, the worst-case renewable-energy and load profiles are explored, ultimately forming a max–min problem.
(2) During the optimization of the IESs’ operations, we consider demand-response and carbon tax policies to tap into the flexible scheduling potential of the demand side and promote low-carbon, economical operation of the system.
(3) To solve the two-stage robust optimization problem for IESs, Karush–Kuhn–Tucker (KKT) conditions are introduced to transform the max–min problem, and column and constraint generation (CCG) algorithms are employed. By sequentially solving the two-stage energy optimization problems through multiple iterative interactions, optimal low-carbon, economical scheduling for IESs is achieved.

2. IES Scheduling Framework and Model

2.1. IES Operation Structure

The IES studied in this article is shown in Figure 1. Within each IES, multiple distributed-energy sources—including photovoltaics (PVs), wind turbines (WTs), cogeneration (CHP), battery energy storage (BES), etc.—jointly meet electricity and heat demands through local production, conversion, and storage. The IES connects to external networks via physical transmission and piping infrastructure, allowing bidirectional energy exchange: when internal generation is insufficient, electricity and heat can be imported from the external grid and district heating network, and any surplus can be exported back. The IES achieves economic operation and power–heat balance through the flexible scheduling of controllable distributed-energy outputs and demand-response measures while respecting the practical limitations of on-site and external transmission equipment.

2.2. Distributed Energy Model for the IES

The PV power generation is influenced by actual solar radiation, environmental conditions, and system parameters [29,30]. The model is as follows:
E t P V = E E D H H N ( 1 0.004 ( T c T r ) )
In this formula, E t P V represents the PV power generation of the IES at time t, E E D represents the actual PV installed capacity, H represents the solar radiation intensity in the actual scenario, and T represents the actual ambient temperature.
The WT power output is mainly affected by the environmental wind speed [31], and the modeling is as follows:
E t W T = 0 , 0 v t v c i 1 2 σ π R 0 2 v t 3 C p ( ο , η ) , v c i v t v r E t r c , v r v t v c o 0 , v c o v t
In this formula, E t W T represents the wind power output and E t r c represents the rated capacity of the WT power system. σ , C P , ο , and η represent the air density, wind energy utilization coefficient, blade tip speed ratio, and blade pitch angle, respectively. v t , v c i , v r , and v c o represent the actual wind speed, cut-in wind speed, rated wind speed, and cut-out wind speed, respectively.
B A t = B A t 1 + Δ t E t C θ C E t D / θ D
0 E t C E t C , M A X
0 E t D E t D , M A X
B A B A t B A
In this formula, B A t and B A t 1 , respectively, represent the amounts of charge of the BES at times t and t − 1. E t C and E t D , respectively, represent the amounts of charge and discharge. θ C and θ D are the operating efficiencies of the BES. Equations (4) and (5), respectively, represent the upper and lower limits of the BES’s charging and discharging constraints. Equation (6) represents the upper and lower limits of the BES. B A and B A represent the upper and lower limits of the BES capacity, respectively [32].
The operation model of the CHP is as follows:
E t C H P = D t C H P L H V ϑ P , CHP
Q t C H P = D t C H P L H V ( 1 ϑ P , CHP ϑ l o s s ) ϑ H , C H P
R C H P , M i n E t C H P E t 1 C H P R C H P , M a x
0 E t C H P E C H P , M a x
In this formula, E t C H P and Q t C H P represent the electricity and heat production of the CHP. D t C H P represents the natural gas consumption of the CHP. ϑ P , CHP and ϑ H , C H P , respectively, represent the electricity and heat production efficiency of the CHP. ϑ l o s s and L H V represent the loss rate and the low calorific value of the natural gas. In this study, the LHV was 9.78 kWh/m3 [33]. R C H P , M i n and R C H P , M a x represent the lower and upper limits of the climbing power of the CHP.
The operating constraints of the gas boiler (GB) are as follows:
Q t G B = D t G B L H V ϑ H , G B
0 Q t G B Q G B , M a x
In this formula, Q t G B represents the thermal productivity of the GB and ϑ H , G B represents the production efficiency of the GB.
The operating constraints of the heat pump (HP) are as follows:
Q t H P = E t H P C O P
0 E t H P E t H P , M a x
In this formula, Q t H P , E t H P , and C O P , respectively, represent the heat output, power consumption, and performance coefficient of the heat pump.

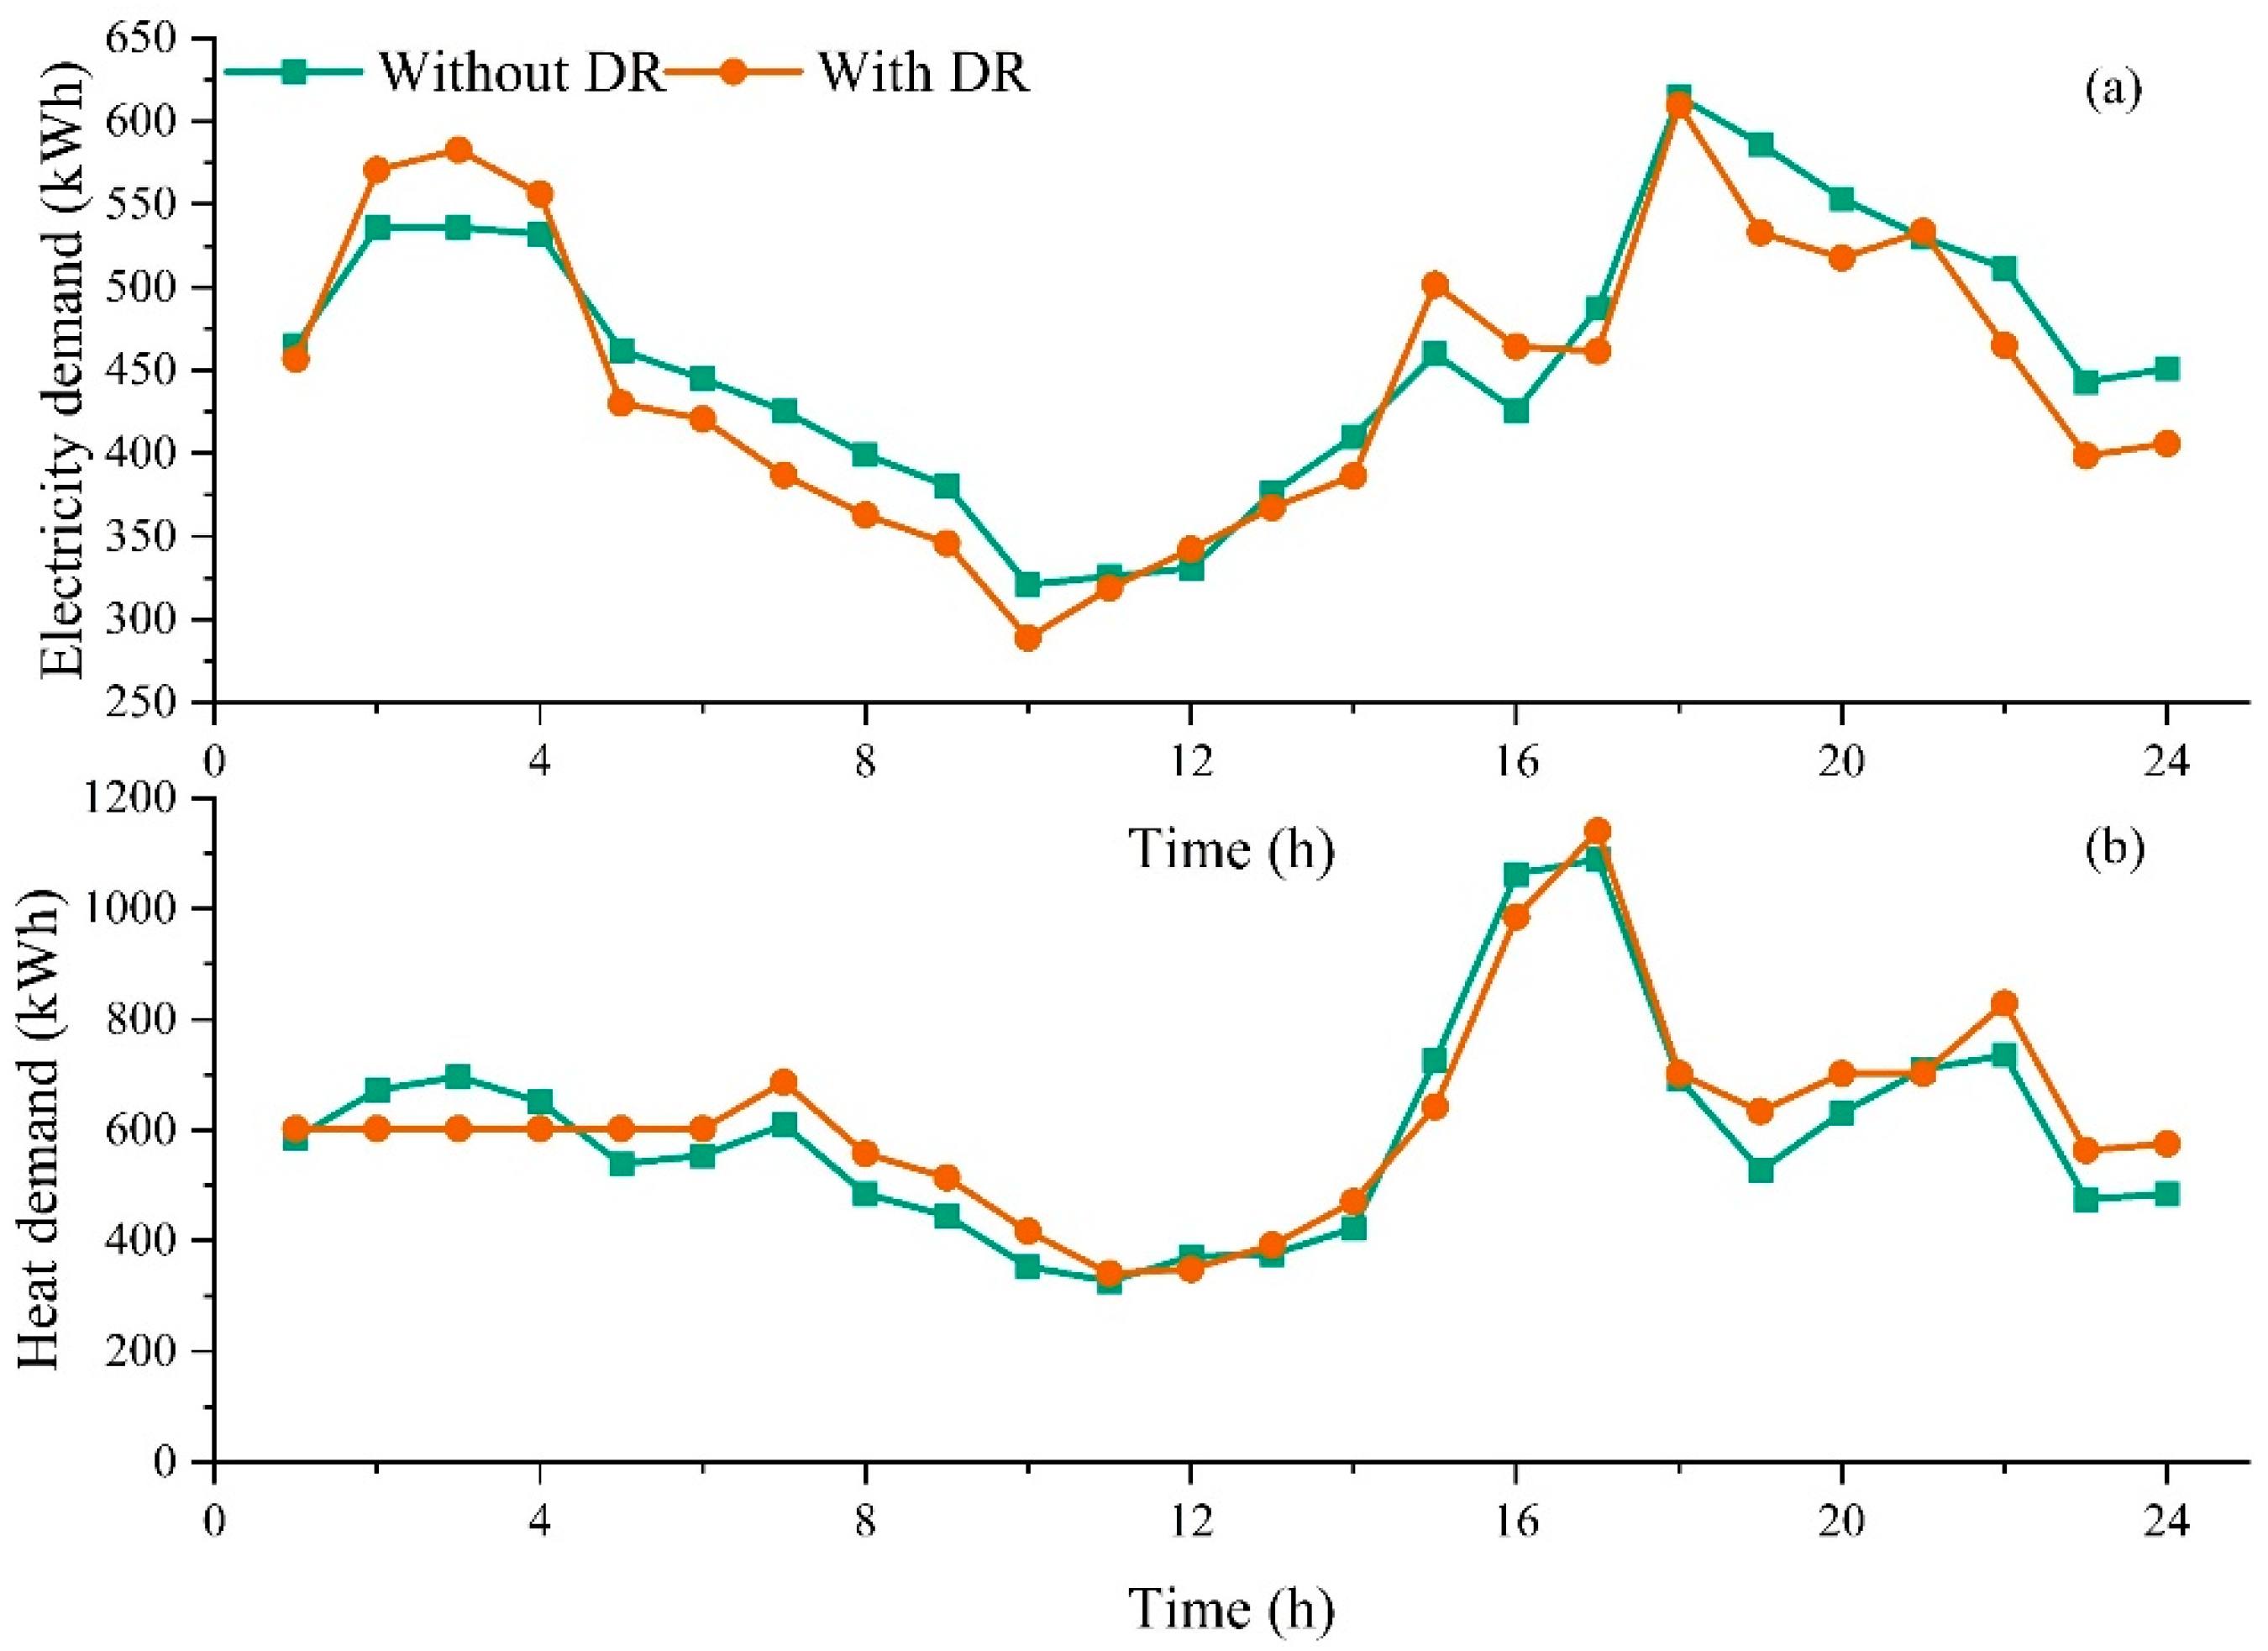
2.3. IES Demand-Response Model

The IESs have multiple energy demands, such as electricity and heat, which are coupled and convertible, making the load side’s participation in the demand response (DR) more flexible. Therefore, this article treats these multiple energy loads—e.g., portions of hot water, heating, and other thermal demands that can be shifted to electricity use—as DR resources, fully utilizing the flexibility of the energy supply and the elasticity between the electricity and heat demands [34]. The specific mathematical model is as follows:
E t L = E ¯ t L + E t C V
Q t L = Q ¯ t L Q t C V
ζ E ¯ t L E t C V ζ E ¯ t L
Q t C V = μ E t C V
Among these values, E ¯ t L and Q ¯ t L , respectively, represent the predicted values of the electricity and heat demand in the comprehensive energy system. E t C V and Q t C V , respectively, represent the conversion amounts of the electricity and heat demand. μ represents the conversion coefficient.

2.4. IES Operation Model

In this article, in order to ensure the robust economic operation of the IES in the face of multiple uncertain factors, we have established a two-stage robust scheduling model to improve the system’s operational stability and economy. The specific construction of this model is as follows:
(1) First stage
In the first stage, the IES will optimize scheduling strategies based on known renewable-energy output and load scenarios, with the objective function of minimizing costs, as shown below:
M I N   C S 1 = t = 1 24 ( C t G 1 + C t B A + C t O M + C t C O 2 )
C t G 1 = λ t G E t G λ t S E t S + λ t H Q t G + λ t D ( D t C H P + D t G B )
C t B A = λ B A ( E t C + E t D )
C t O M = ψ C H P E t C H P + ψ G B Q t G B + ψ H P E t H P
C t C O 2 = π ( c 1 E t G + c 2 Q t G + c 3 ( D t C H P + D t G B ) )
Equation (19) represents the objective function of the first-stage scheduling model. C t G 1 , C t B A , C t O M , and C t C O 2 are, respectively, the energy transaction cost with the external networks, the BES operation degradation cost, the operation and maintenance cost, and the carbon-emission cost. Equations (20)–(23) provide the specific compositions of the above costs. λ t G and λ t S , respectively, represent the time-of-use electricity price and grid electricity price. λ t H and λ t D , respectively, represent the purchase prices of the heat and natural gas. E t G , E t S , and Q t G , respectively, represent the purchase, sale, and heat of the first-stage IES with the external power grid and heating network. λ B A represents the unit degradation cost of the BES. ψ C H P , ψ G B , and ψ H P , respectively, represent the unit operation and maintenance costs for the CHP, GB, and HP. c 1 , c 2 , and c 3 , respectively, represent the unit carbon emissions of the external electricity, heat, and natural gas. π represents the carbon tax price.
In addition to the equipment-operation and DR constraints mentioned above, there are also the following constraints on the balance of power and heat supply and demand in the first stage:
E ¯ t P V + E ¯ t W T + E t C H P + E t G + E t D E t C E t S E t L E t H P = 0
Q t C H P + Q t G B + Q t G + Q t H P Q t L = 0
Among them, + represents the input of electricity and heat and − represents the consumption or output of electricity and heat.
(2) Second stage
In the second stage, we have taken into account the fluctuations in renewable-energy production and load demand and achieved the balance of electricity and heat supply and demand in the IES under multiple uncertain environments through trading with external power grids and heating networks. The mathematical model is as follows:
M A X W   M I N   C S 2 = t = 1 24 ( C t G 2 )
  C t G 2 = λ t G E t G + λ t H Q t G
Equations (26) and (27) represent the objective function of the second-stage IES scheduling model, which aims to achieve the minimum equilibrium cost in the worst-case scenario. C t G 2 represents the balance cost generated due to fluctuations in the production demand. E t G and Q t G are the second-stage grid purchases of electricity and heat, respectively. W is the set of uncertain factors.
After considering multiple uncertain factors, there are still the following constraints on the operation of the IES:
E t P V + E t W T + E t C H P + E t G + E t G + E t D E t C E t S ( E t L + E t C V ) E t H P = 0
Q t C H P + Q t G B + Q t G + Q t G + Q t H P ( Q t L Q t C V ) = 0
W t U = W ¯ t U + ω U γ U + ω U γ U γ U + + γ U 1 t = 1 24 ( γ U + + γ U ) = Γ U P V , W T , E , Q U
Equations (28) and (29) represent the supply–demand balance constraints in the second stage, where the variables marked with ~ are the variables to be optimized in the second-stage problem. E t P V , E t W T , E t L , and Q t L are the actual values of the PV power generation, WT generation, and load demand, respectively. Equation (30) represents the constraint of uncertain variables; ω U and Γ U are the maximum deviation and uncertain budget of the uncertain variables, respectively. Both γ U + and γ U are 0–1 variables corresponding to upward and downward movements.

3. Problem Calculation

3.1. Two-Stage Robust Optimization Problem

Based on the above modeling, the two-stage robust model of the IES is as follows:
M I N   ( c T y + M A X W   M I N   d T x )
Equation (31) represents the objective function of the two-stage robust problem, which aims to minimize the total cost of two-stage scheduling in IESs. However, as it is a minimax problem, solving it directly is quite difficult [35,36]. Therefore, we will introduce column and CCG algorithms to achieve the sequential solving of the two-stage robust optimization problems. These algorithms dynamically generate variables (i.e., columns) and add them to the current model, gradually improving the quality of the solution. In two-stage robust optimization, CCG algorithms can be applied to the subproblems of each stage to gradually optimize the total cost of the IES.

3.2. Two-Stage Robust Optimization Problem Solving

In this section, we have decomposed problem (31) into a main problem and subproblems and solved the two-stage robust optimization problem of the IES through the interaction between the two problems. The model is as follows:
(1) Main problem:
M I N   ( c T y + β )
β d T x
Among them, y is the main variable to be optimized in the problem, c is the coefficient matrix, and β is the auxiliary variable. Equation (33) is the new constraints added to the main problem and also includes all constraints from the first-stage problem.
(2) Subproblem:
M A X W   M I N   d T x
Among these values, x is the variable to be optimized for the subproblem and d is the coefficient matrix. The constraints of the subproblem are all constraints of the second-stage scheduling problem of the IES. In order to directly solve the maximum–minimum problem, this paper will introduce KKT conditions to transform it [37]. The transformed subproblems are as follows:
M A X   d T x
G y * h Q x M u G T ξ d ( G y * h + Q x + M u ) ξ = 0 , ( d G T ξ ) x = 0
Therefore, both the main problem and subproblems can be directly solved. The main problem can obtain the initial scheduling strategy of the IES under deterministic scenarios and transmit it to the subproblems, while the subproblems are responsible for exploring the worst-case uncertain scenarios and feeding back the results to the main problem. Through multiple iterations, the information exchange flow and feedback between the main problem and subproblems will converge, thereby achieving the robust optimization scheduling and economic operation management goals of the IES. Algorithm 1 shows the specific steps of the CCG algorithm for solving the two-stage robust optimization issue of the IES.
Algorithm 1: CCG algorithm solution process.
1: Initialization: LB = −∞, UB = +∞, iteration index n = l, Set error threshold ϵ
2: repeat
3: In n-th iteration
4: Solve the main problem according to Formula (19) and update LB.
5: Introducing the KKT conditions, transform Equation (26), solve the subproblem, and update UB.
6: Update the worst-case scenario and add column constraints.
7: Update iteration index: n = n + 1;
8: Until the stopping condition is fulfilled, i.e., LB-UB ϵ
End

4. Case Study

4.1. Case Setting

This article has conducted numerical simulation analysis on a comprehensive energy system aimed at verifying the effectiveness of the proposed two-stage robust scheduling framework. The forecasted renewable-energy output and load curves for the IES are shown in Figure 2 [38,39]. The BES has a rated capacity of 150 kWh, a maximum charging and discharging power of 50 kW, and a degradation cost of 0.1 RMB/kWh [40]. The installed capacities of the distributed energy production equipment within the system are listed in Table 1, with unit operation and maintenance costs of 0.1 RMB/kWh, 0.07 RMB/kWh, and 0.05 RMB/kWh, respectively. The time-of-use electricity prices are also given in Table 2 [41]. The maximum fluctuation rates of the renewable-energy output and load are 20% and 10% of their forecasted values, respectively [42], and the maximum DR adjustment ratio is limited to 10% of the forecasted load [43]. The carbon tax is 100 RMB/t [44].
To verify the effectiveness of this strategy, this article will compare the following scenarios:
Scenario 1: Considering demand response without considering source-load uncertainty.
Scenario 2: Ignoring demand response and considering source-load uncertainty.
Scenario 3: Considering both demand response and source-load uncertainty simultaneously.
It is worth noting that the benchmark case in this study is scenario 1, in which IESs optimize scheduling based on forecast data and cover any supply–demand mismatch through external purchases [34]. By simulating and comparing these three scenarios, we can comprehensively evaluate the proposed strategy’s effectiveness in real-world IES operation and provide a scientific basis for optimizing IES management and scheduling.

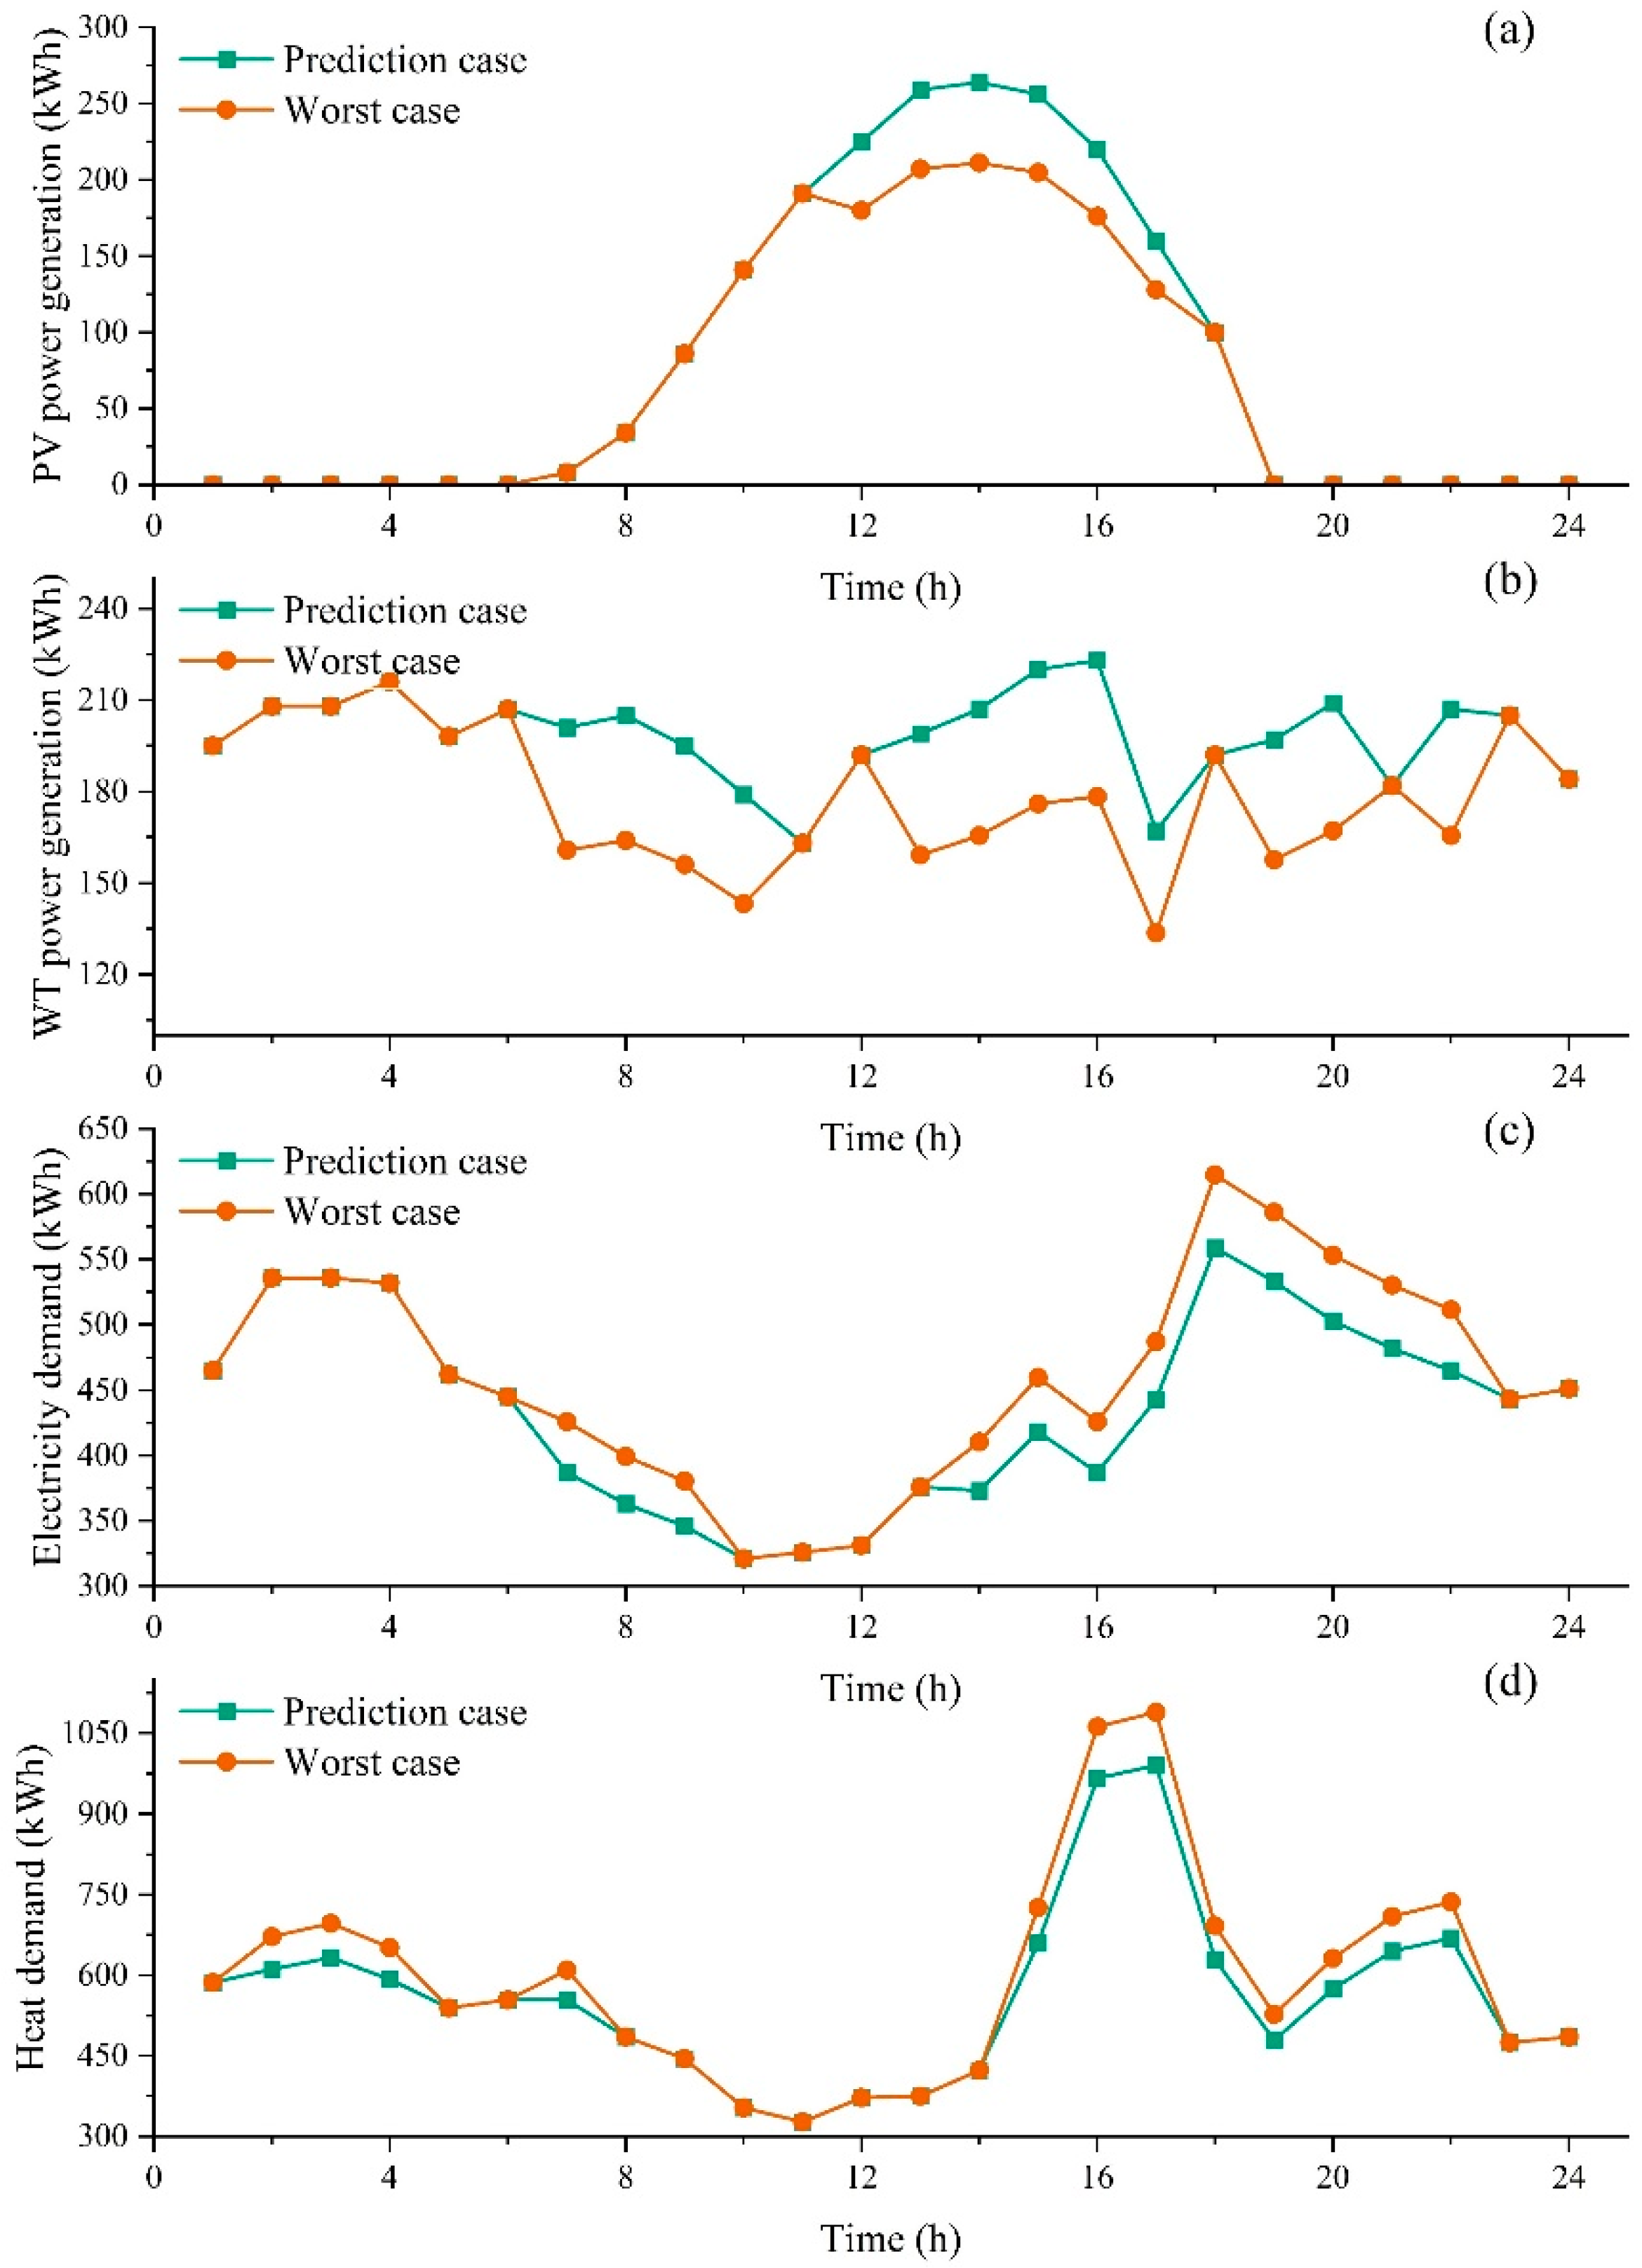
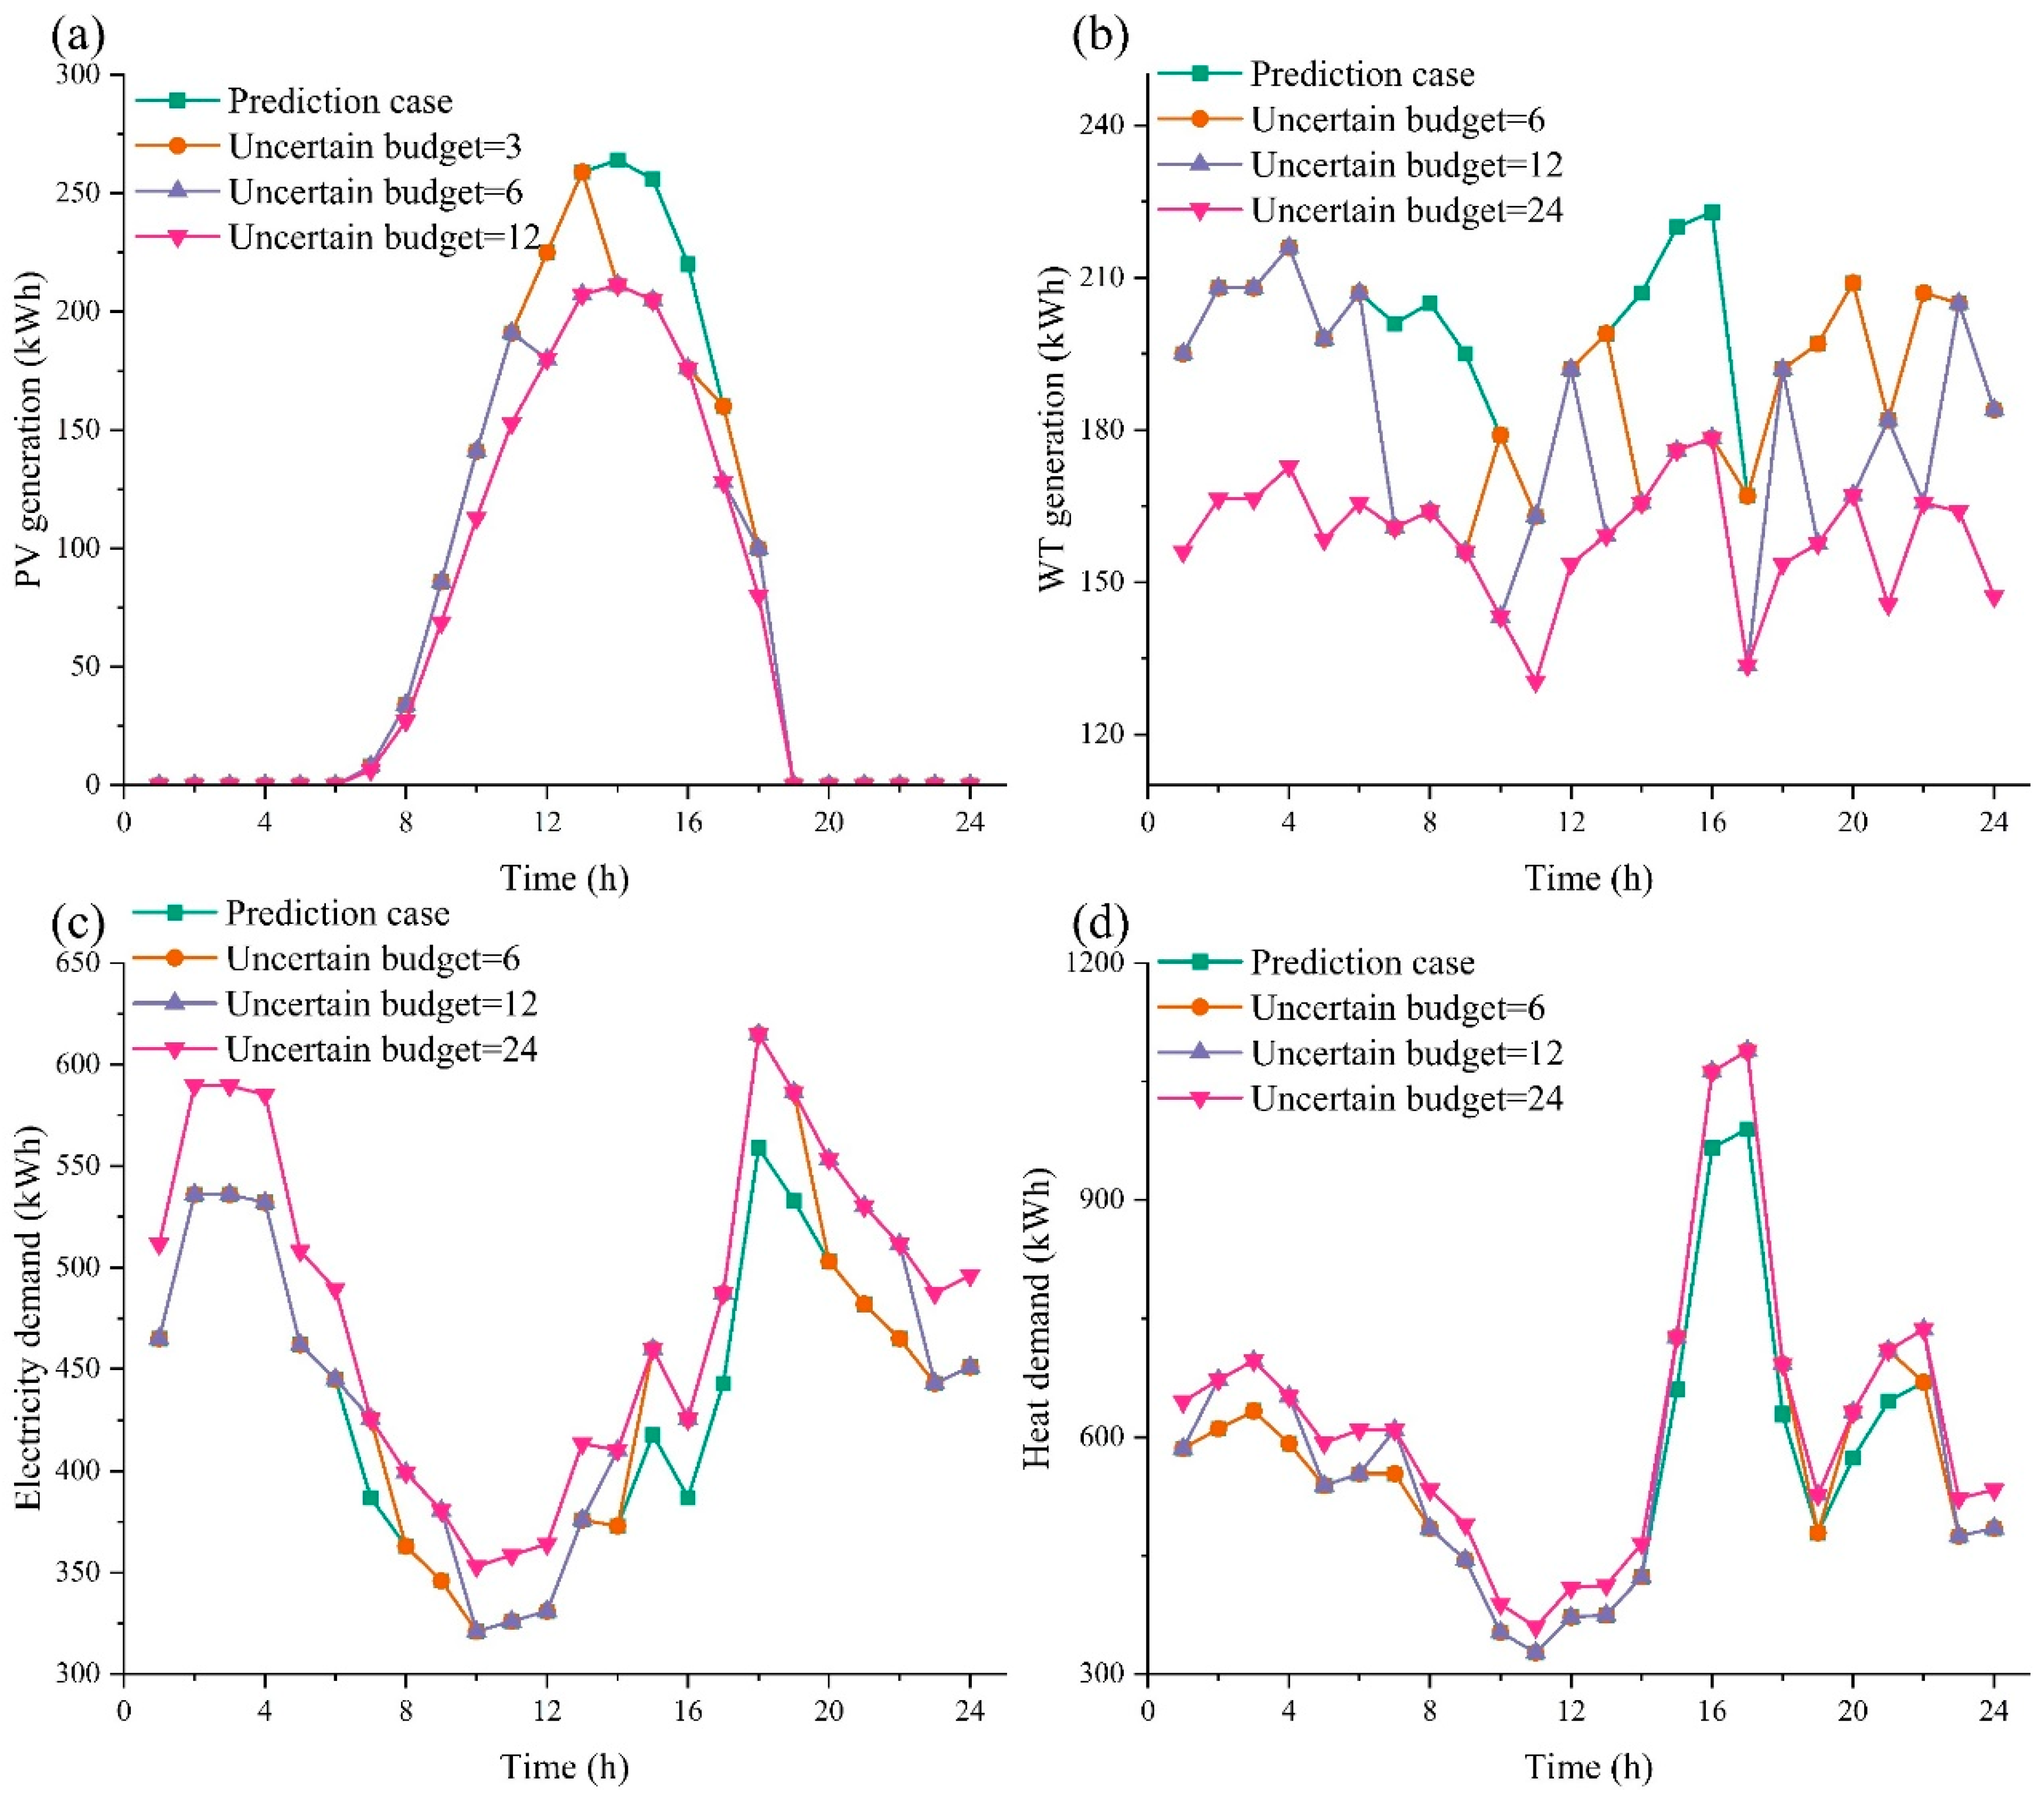
4.2. Uncertainty Analysis

In Figure 3, it can be seen that there are significant differences in the renewable-energy production and the demand for electricity and heat energy between the worst-case scenario and the predicted scenario. The production of the PVs and WTs in the worst-case scenario significantly decrease in the 6 h and 12 h time periods, respectively, while the demand for electricity and thermal energy increases significantly in the 12 h time period. The above offset ratios are the upper limits of the fluctuations for various uncertain factors. It is worth noting that the decline in the renewable energy output and the increase in the energy demand are mainly concentrated during the peak or off-peak periods of the electricity prices. This concentration phenomenon will greatly increase the energy cost of the IESs. For example, during peak electricity prices, a decrease in photovoltaic output may result in the need to purchase more electricity from traditional grids to meet the demand, while an increase in the demand will mean higher energy consumption and costs.
Therefore, the worst-case scenario obtained based on the two-stage robust optimization model has strong robustness and scientificity. This model considers the possible impacts of various uncertain factors and predicts and explores the worst-case scenarios, enabling us to better cope with potential adverse situations and ensure the stable operation and economy of IESs.
Figure 4 and Figure 5 show the supply–demand balance of the electric and thermal energy in the IESs in scenarios 1 and 3. In these deterministic scenarios, the IESs perform the optimal energy scheduling in the first stage based on the predicted renewable-energy production and load data and then purchase energy from the external networks for the electricity and heat balance in the second stage, considering the prediction bias of the worst-case scenario. In uncertain scenarios, the optimal robust scheduling is achieved by obtaining the worst-case scenario through two-stage robust optimization. From Figure 4 and Figure 5, it can be seen that compared to the deterministic scenarios, uncertain scenarios, due to obtaining the worst-case output and load curves in advance, will enable the controllable distributed energy sources within the system, such as cogeneration and gas boilers, to produce more electricity and heat to meet the supply-and-demand deviation caused by uncertainty and significantly reduce the purchase of the electricity and heat from the external networks for the IES, as shown in the black box in the figures. Therefore, the strategy proposed in this article not only improves the robustness of energy scheduling in IESs but also helps to reduce the electricity costs of IESs.
Figure 6 shows the electricity and heat demands of the IESs in scenarios 2 and 3. It can be clearly seen from the graph that after implementing of the demand response, the flexibility of the energy scheduling in the IESs is significantly improved. Specifically, this improvement was mainly achieved through the mutual conversion of the heating and electrical demands. The electricity demand of the IES significantly decreases during the flat and peak periods of the electricity prices, while it significantly increases during the valley period. Relatively speaking, the above electricity demand will be converted into heat demand. The above changes have a significant impact on the operation of IESs, as they help reduce energy costs and improve energy utilization efficiency. By managing electricity and heat demand reasonably, especially through mutual conversion during peak periods, the system can effectively reduce external energy purchases during price peaks, bringing a more economical and sustainable operating mode to the IESs.

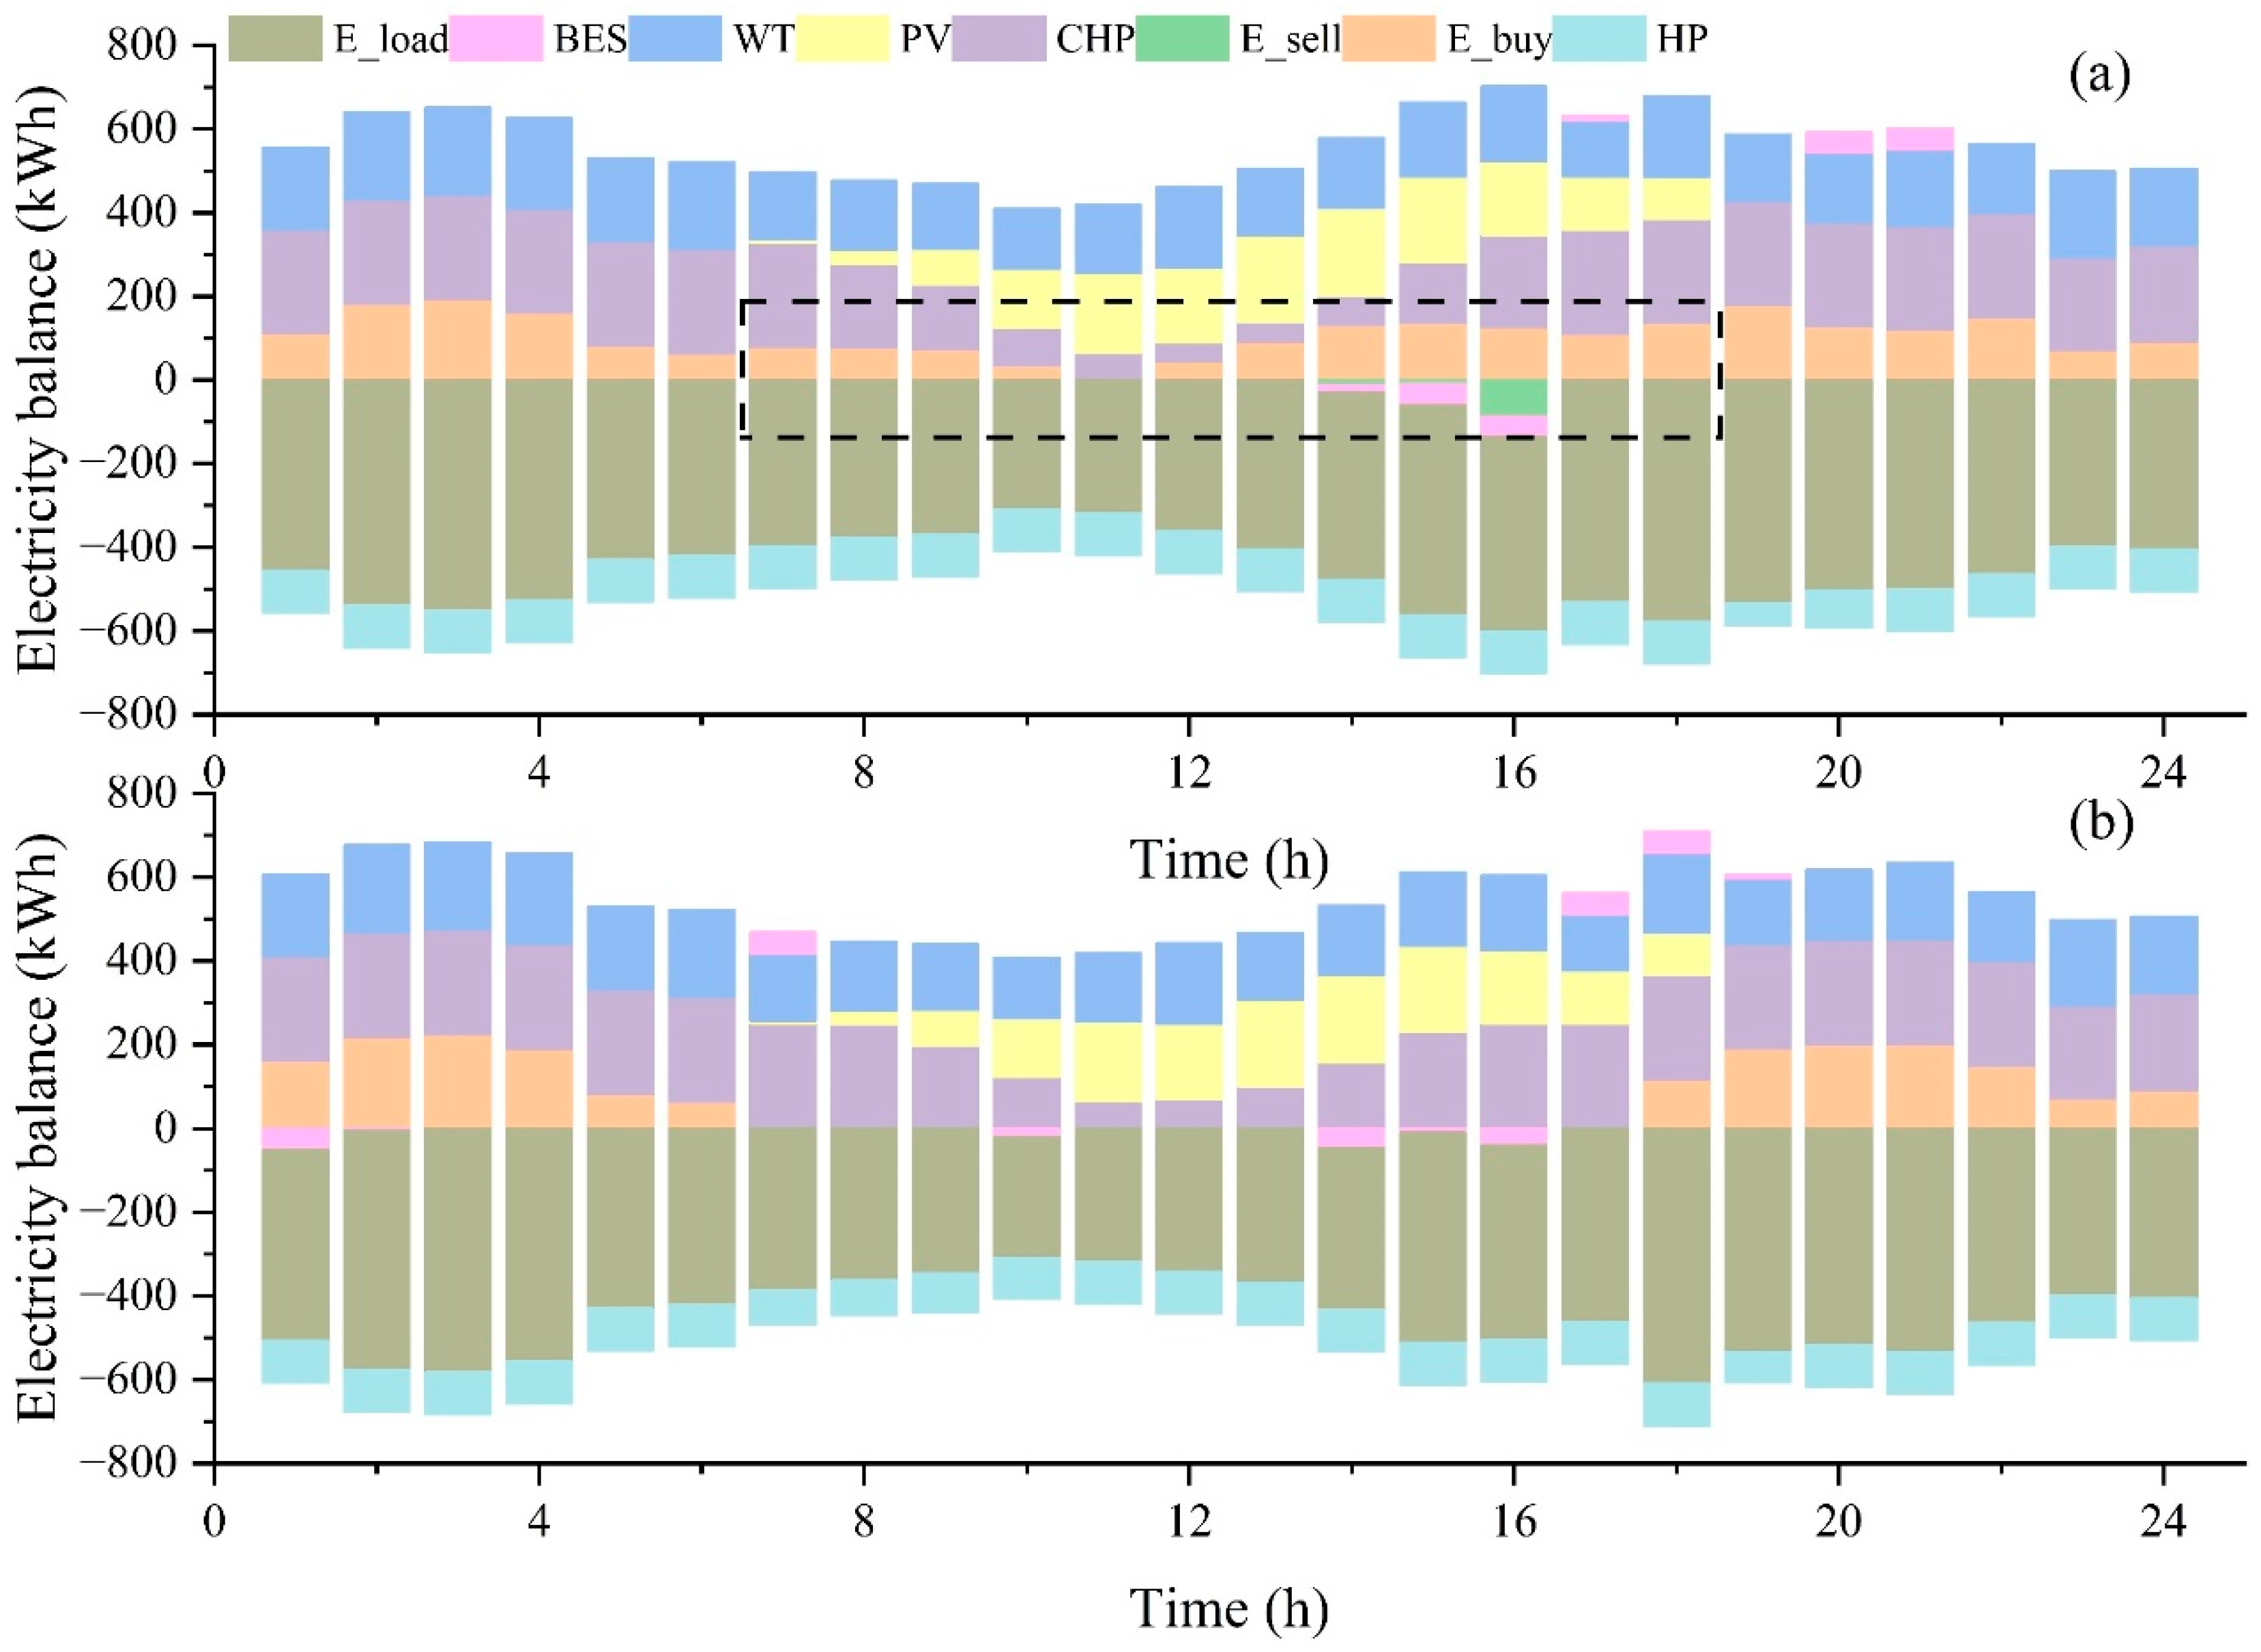
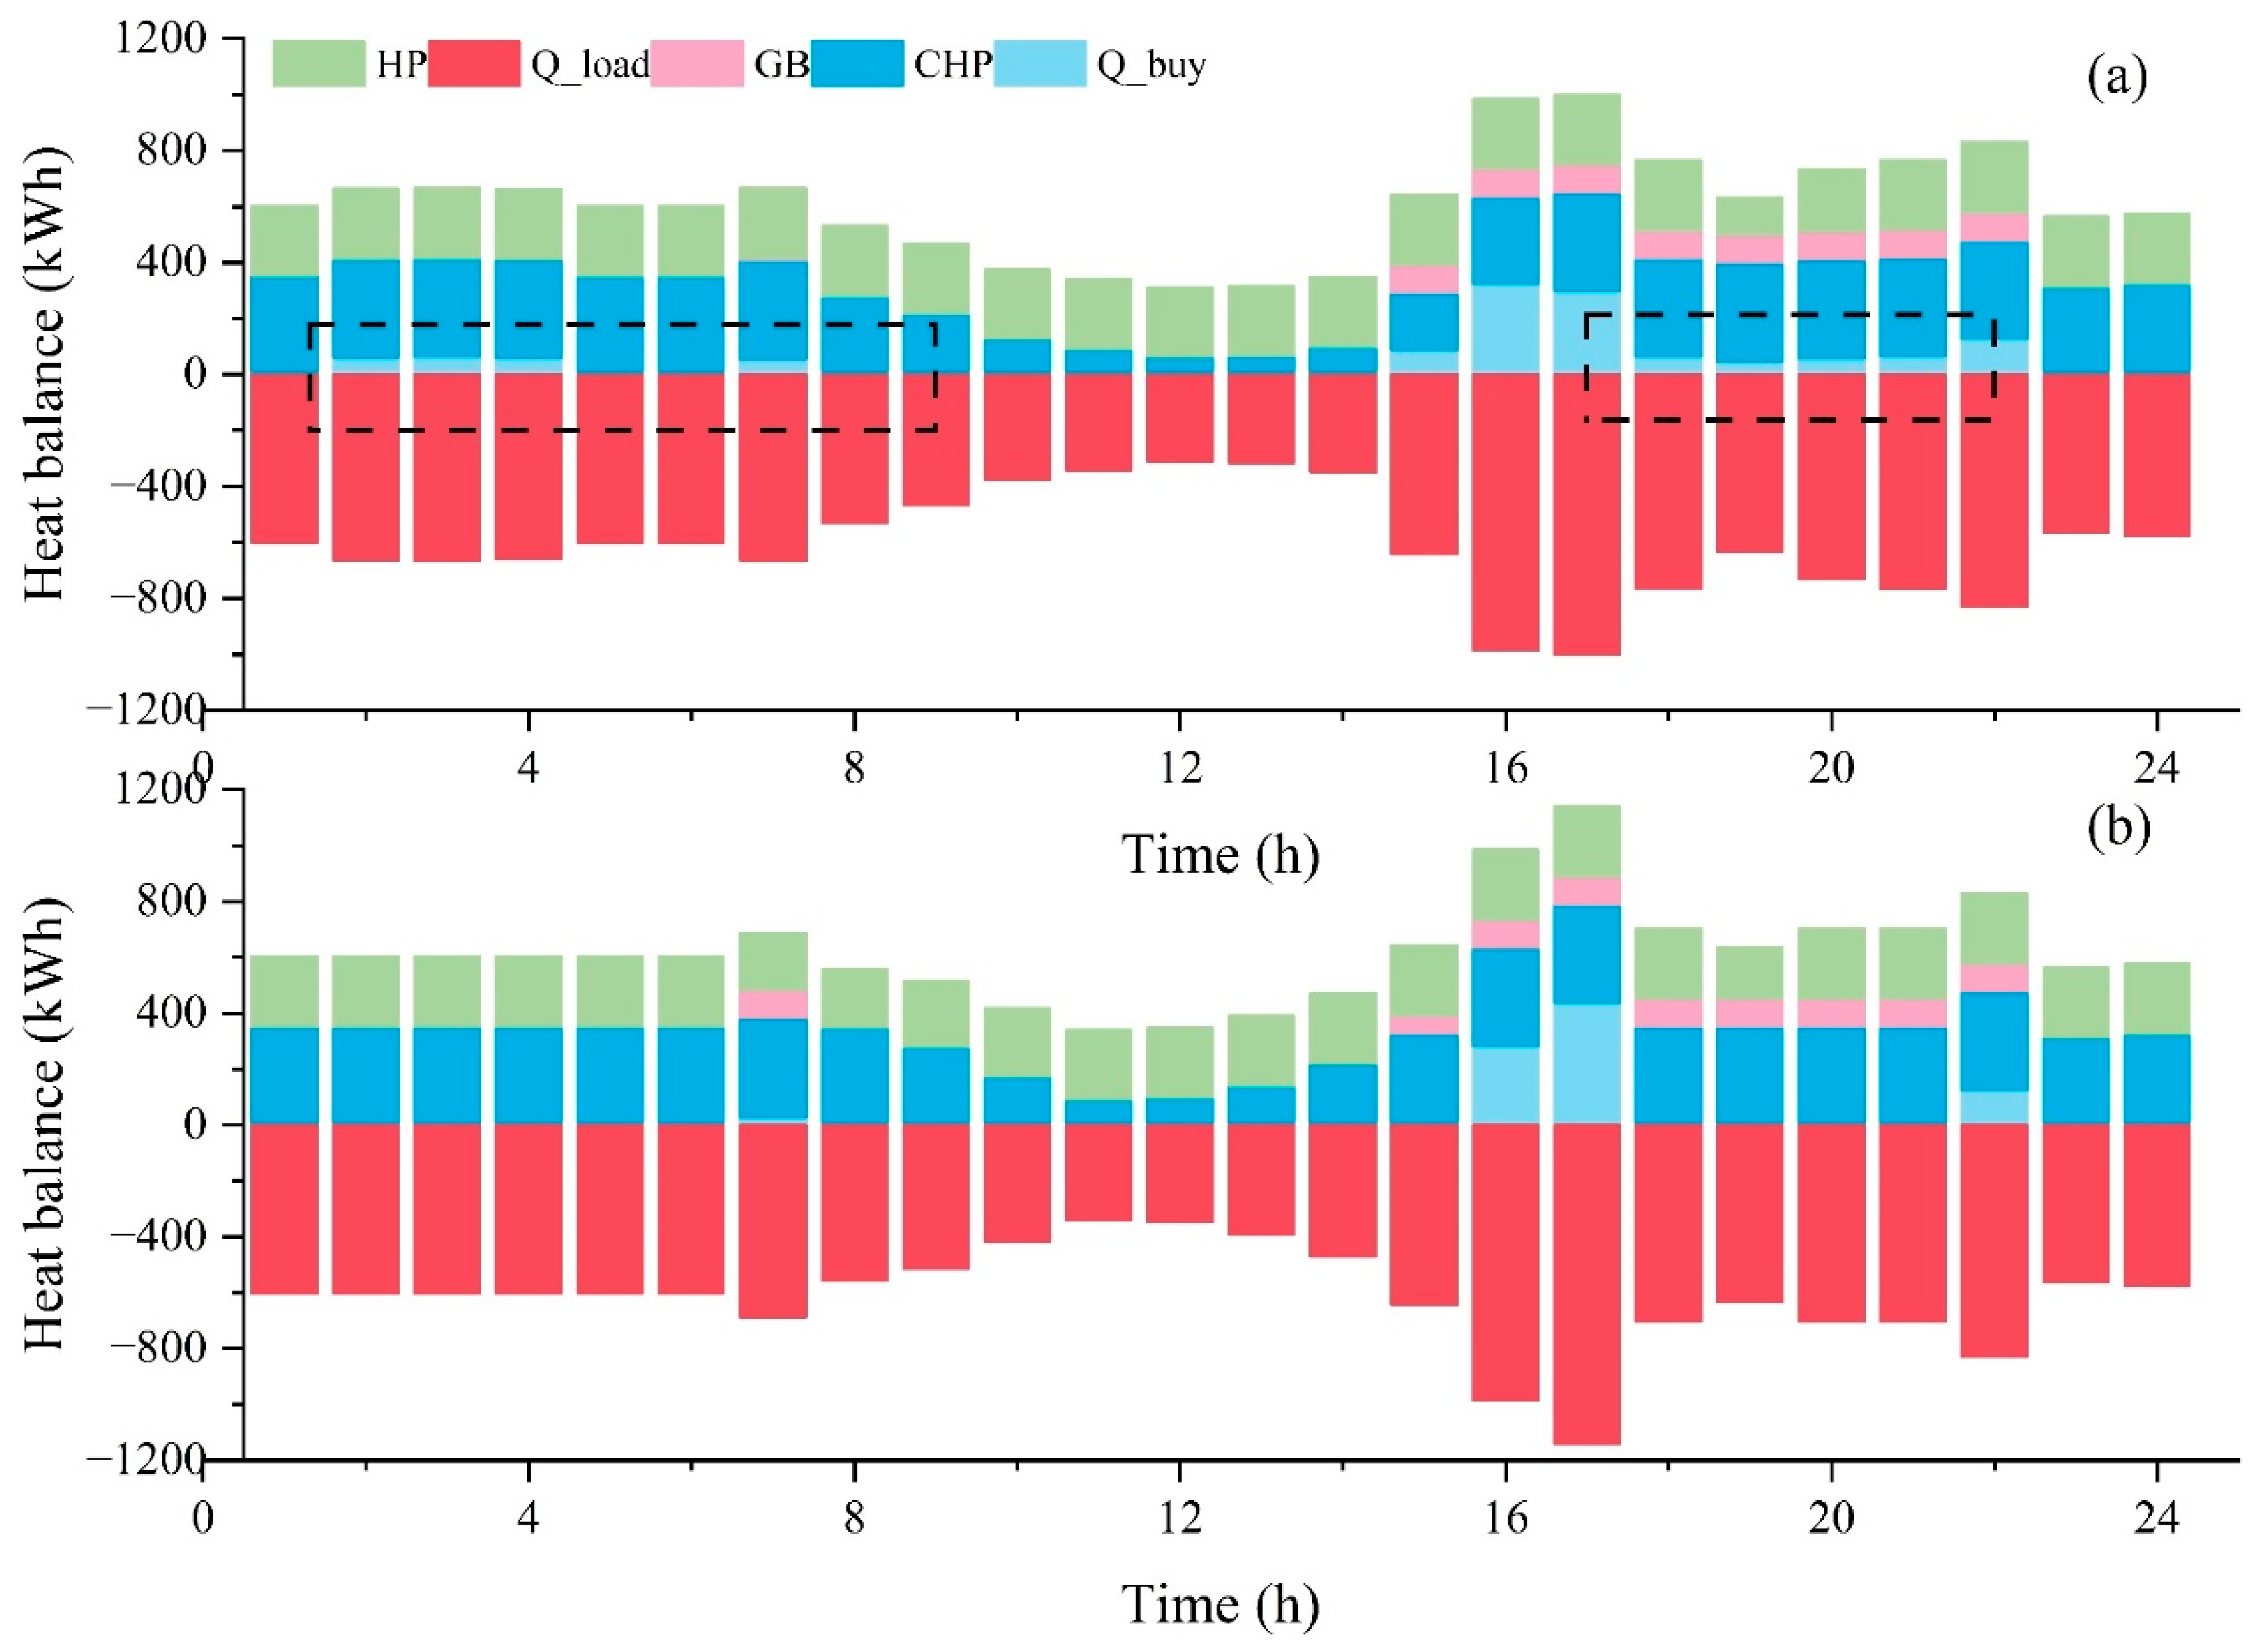
4.3. Scheduling Result Analysis

Table 3 shows the comparison of the scheduling costs for the IESs in different scenarios, where scenario 1 and scenario 3 represent energy-scheduling strategies for IESs that do not consider and consider multiple uncertainties, respectively. After considering various uncertainties, the scheduling process of the IESs will explore the worst-case scenarios of the photovoltaic output and load demand and carry out energy optimization scheduling. This scheduling strategy is helpful for achieving more robust economical scheduling in IESs compared to optimization scheduling based solely on prediction scenarios (scenario 1).
Specifically, considering various uncertainties, the energy cost of the IESs has been reduced from 7091.03 RMB to 6489.18 RMB, and the system’s carbon emissions have also been reduced from 6165.57 kg to 5732.54 kg, achieving a cost savings of 8.49% and a carbon-emission reduction of 7.02%. This not only demonstrates the importance of considering multiple uncertainties in the low-carbon economic operation of IESs in practical operations but also proves the potential of robust scheduling strategies in improving the economic and environmental benefits of IESs. In addition, compared with scenario 2, after implementing the demand response (DR), the IES also achieved a cost savings of 100.6 RMB and a carbon reduction of 218.92 kg. This indicates the positive impact of the demand response in the scheduling of IESs. By flexibly adjusting load demand to adapt to energy production and consumption characteristics, IESs can operate more efficiently and further reduce costs and increase efficiency.
Overall, the above results demonstrate the importance of considering multiple uncertainties, adopting robust scheduling strategies, and implementing DR measures in the operation of IESs to improve their economic and operational efficiency, providing strong support for the sustainable development of IESs.

4.4. Sensitivity Analysis

(1) Carbon tax price analysis
Table 4 shows the IES costs and carbon emissions under different carbon taxes. As the carbon tax gradually increases from 0 RMB/t to 250 RMB/t, the cost of the IESs shows a significant upward trend. Specifically, when the carbon tax price is 0 RMB/t, the cost is 5896.60 RMB; when the carbon tax price increases to 250 RMB/t, the cost increases to 7344.22 RMB, an increase of about 24.55%. This indicates that changes in carbon tax prices have a sensitive impact on costs. Meanwhile, observing the data on carbon emissions, it can be seen that with the increase in the carbon tax prices, the carbon emissions of the IESs show a gradual downward trend from the initial 6154.73 kg to 5699.87 kg. Moreover, raising the carbon tax by 150 RMB/t does not lead to any further reduction in the IESs’ emissions, implying that the systems’ internal scheduling flexibility has been fully exploited. Beyond this point, additional tax hikes yield no emission gains. Thus, setting the carbon tax at an appropriate level is critical; it ensures emissions are curtailed efficiently while avoiding unnecessary cost burdens. In summary, the sensitivity analysis of carbon tax prices shows that increasing carbon tax prices can significantly increase the cost burden of enterprises, thereby incentivizing them to reduce carbon emissions. The positive correlation between cost increases and emission reduction reflects that carbon tax policies can effectively promote the low-carbon operation of IESs.
(2) Uncertain budget analysis
Figure 7 shows the worst-case scenarios for renewable-energy output and energy demand under different uncertainty budgets. Since the PV output is zero at night, we assumed its uncertainty budget would be only half that of the other factors. In the subsequent analyses, all uncertainty budgets refer to those of the non-PV factors. As the budget rises from 6 to 24, renewable-energy output drops significantly while energy demand increases markedly.
Table 5 lists the energy cost and carbon emissions of the IESs under various budget scenarios. As the budget increases, the IESs’ scheduling strategies become ever more resilient against uncertainty and the systems’ robustness improves—yet both the energy costs and carbon emissions climb significantly.

5. Conclusions

This article proposes a two-stage robust optimization scheduling framework that considers demand response, aiming to solve the economic operation problem of IESs in uncertain environments. In Stage I, we have optimized under deterministic scenarios; in Stage II, we have refined the solution against worst-case output and load fluctuations. By iterating between these two stages and using a column-and-constraint generation algorithm, the system’s optimal economic operation has been achieved. Numerical simulations have verified the effectiveness and superiority of the proposed method. The results show that after fully accounting for various uncertainties, the system’s energy cost fell from RMB 7091.03 to RMB 6489.18 (an 8.49% saving), while the carbon emissions dropped from 6165.57 kg to 5732.54 kg (a 7.02% reduction). This demonstrates that our approach can effectively handle renewable-energy and load uncertainties, improve IES energy utilization and flexibility, and promote demand-side management—thereby reducing scheduling costs and risks. However, sensitivity analysis has indicated that setting an appropriate carbon tax and uncertainty budget is crucial to achieving robust, low-carbon operation without incurring excessive costs.
In actual operation, IESs can utilize the proposed robust energy dispatch framework to proactively adjust the energy consumption of internal equipment, thereby reducing real-time dispatch risks and improving overall system reliability.
Although the above framework can achieve low-carbon, robust, and economical operation of IESs, some research limitations remain. First, under extreme weather conditions or during power outages, energy-optimization scheduling for IESs becomes significantly more complex, and simple robust-optimization methods are no longer sufficient to address the challenges of such scenarios. Second, as IESs continue to evolve rapidly, the benefits derived from energy interactions among multiple systems cannot be ignored, and how to achieve robust, collaborative optimization across these systems requires further investigation. Therefore, in future work, we will study resilient scheduling for interconnected systems under extreme climate conditions to ensure stable and cost-effective operation of IESs.

Author Contributions

Conceptualization, Y.Z., J.T. and Z.G.; Methodology, Y.Z.; Software, Y.Z.; Validation, Y.Z.; Investigation, Y.Z. and J.T.; Data curation, Y.Z.; Writing—original draft, Y.Z. and J.T.; Writing—review & editing, Y.Z., J.T., Z.G., Q.F. and S.J.; Project administration, J.T.; Funding acquisition, J.T. All authors have read and agreed to the published version of the manuscript.

Funding

This research was funded by the State Power Investment Corporation Sichuan Company Science and Technology Project, grant number XNNY-WW-KJ-2023-03. The APC was funded by the State Power Investment Corporation Sichuan Company.

Data Availability Statement

Data will be made available on request.

Conflicts of Interest

The authors declare that they have no known competing financial interests or personal relationships that could have appeared to influence the work reported in this paper.

References

  1. Cao, D.; Hu, W.H.; Zhao, J.B.; Zhang, G.Z.; Zhang, B.; Liu, Z.; Chen, Z.; Blaabjerg, F. Reinforcement Learning and Its Applications in Modern Power and Energy Systems: A Review. J. Mod. Power Syst. Clean Energy 2020, 8, 1029–1042. (In English) [Google Scholar] [CrossRef]
  2. Cao, D.; Hu, J.X.; Liu, Y.; Hu, W.H. Decentralized Graphical-Representation-Enabled Multi-Agent Deep Reinforcement Learning for Robust Control of Cyber-Physical Systems. IEEE Trans. Reliab. 2024, 73, 1710–1720. (In English) [Google Scholar] [CrossRef]
  3. Zhao, P.F.; Cao, D.; Hu, W.H.; Huang, Y.H.; Hao, M.; Huang, Q.; Chen, Z. Geometric Loss-Enabled Complex Neural Network for Multi-Energy Load Forecasting in Integrated Energy Systems. IEEE Trans. Power Syst. 2024, 39, 5659–5671. [Google Scholar] [CrossRef]
  4. Wang, J.; Wen, Y.; Wu, K.; Ding, S.; Liu, Y.; Tian, H.; Zhang, J.; Wang, L.; Cao, Q.; Zhang, Y. Optimization study of wind, solar, hydro and hydrogen storage based on improved multi-objective particle swarm optimization. J. Energy Storage 2024, 93, 112298. [Google Scholar] [CrossRef]
  5. Zhang, X.; Liu, Y.; Zhan, Y.; Yan, R.; Mei, J.; Fu, A.; Jiao, F.; Zeng, R. Multi-scenario optimization and performance evaluation of integrated energy system considering co-scheduling of EVs and stationary energy storage. Renew. Energy 2024, 237, 121927. [Google Scholar] [CrossRef]
  6. Wang, Z.-H.; Ren, X.-Y.; Cui, H.-J.; Wang, W.-Q.; Liu, J.; He, Z.-F. A multi-stage two-layer stochastic design model for integrated energy systems considering multiple uncertainties. Energy 2024, 304, 131729. [Google Scholar] [CrossRef]
  7. Wang, M.; Wang, M.; Wang, R.; Zhao, Q.; Zheng, X.; Gao, H. Optimization scheduling for low-carbon operation of building integrated energy systems considering source-load uncertainty and user comfort. Energy Build. 2024, 318, 114423. [Google Scholar] [CrossRef]
  8. Li, H.; Lu, X.; Zhou, K.; Shao, Z. Distributionally robust optimal dispatching method for integrated energy system with concentrating solar power plant. Renew. Energy 2024, 229, 120792. [Google Scholar] [CrossRef]
  9. Cao, D.; Zhao, J.B.; Hu, J.X.; Pei, Y.S.; Huang, Q.; Chen, Z.; Hu, W.H. Physics-Informed Graphical Representation-Enabled Deep Reinforcement Learning for Robust Distribution System Voltage Control. IEEE Trans. Smart Grid 2024, 15, 233–246. [Google Scholar] [CrossRef]
  10. Kumar, J.; Hussain, K.; Kannan, S. Positive vs negative economic impacts of tourism development: A review of economic impact studies. In Proceedings of the 21st Asia Pacific Tourism Association Annual Conference, Kuala Lumpur, Malaysia, 14–17 May 2015; pp. 14–17. [Google Scholar]
  11. Kumar, J.; Hussain, K. A review of assessing the economic impact of business tourism: Issues and approaches. Int. J. Hosp. Tour. Syst. 2014, 7, 49–55. [Google Scholar]
  12. Qian, J.; Guo, Y.; Wu, D.; Liu, A.; Han, Z.; Liu, Z.; Zhang, S.; Yang, X. Research on multi-time scale optimization of integrated energy system based on multiple energy storage. J. Energy Storage 2024, 102, 113892. [Google Scholar] [CrossRef]
  13. Wang, J.; Wen, J.; Wang, J.; Yang, B.; Jiang, L. Coordinated scheduling of wind-solar-hydrogen-battery storage system for techno-economic-environmental optimization of hydrogen production. Energy Convers. Manag. 2024, 314, 118695. [Google Scholar] [CrossRef]
  14. Ma, Y.; Zhang, T.; Deng, L.; Song, Z.; Li, T. Research on investment selection of park-level integrated energy system considering electricity-heat-cooling-storage based on matter element extension. Energy 2024, 304, 132054. [Google Scholar] [CrossRef]
  15. Jia, B.; Li, F.; Sun, B. Knowledge-network-embedded deep reinforcement learning: An innovative way to high-efficiently develop an energy management strategy for the integrated energy system with renewable energy sources and multiple energy storage systems. Energy 2024, 301, 131604. [Google Scholar] [CrossRef]
  16. Zhu, X.; Hu, M.; Xue, J.; Li, Y.; Han, Z.; Gao, X.; Wang, Y.; Bao, L. Research on multi-time scale integrated energy scheduling optimization considering carbon constraints. Energy 2024, 302, 131776. [Google Scholar] [CrossRef]
  17. Yan, N.; Zhao, Z.; Li, X.; Yang, J. Multi-time scales low-carbon economic dispatch of integrated energy system considering hydrogen and electricity complementary energy storage. J. Energy Storage 2024, 104, 114514. [Google Scholar] [CrossRef]
  18. Ye, S.; Wang, J.; Yin, Z.; Kang, J.; Ma, Z. Optimization of a solar-driven community integrated energy system based on dynamic hybrid hydrogen-electric energy storage strategy. J. Energy Storage 2024, 101, 113917. [Google Scholar] [CrossRef]
  19. Chen, X.; Yang, L.; Dong, W.; Yang, Q. Net-zero carbon emission oriented Bi-level optimal capacity planning of integrated energy system considering carbon capture and hydrogen facilities. Renew. Energy 2024, 237, 121624. [Google Scholar] [CrossRef]
  20. Dong, F.; Wang, J.; Xu, H.; Zhang, X. A robust real-time energy scheduling strategy of integrated energy system based on multi-step interval prediction of uncertainties. Energy 2024, 300, 131639. [Google Scholar] [CrossRef]
  21. Kumar, J.; Arora, M.; Bayram, G.E. Research, Innovation, and Industry Impacts of the Metaverse; IGI Global: Hershey, PA, USA, 2024. [Google Scholar]
  22. Silva, C.A.M.; Bessa, R.J. Carbon-aware dynamic tariff design for electric vehicle charging stations with explainable stochastic optimization. Appl. Energy 2025, 389, 125674. [Google Scholar] [CrossRef]
  23. Fan, J.; Yan, R.; He, Y.; Zhang, J.; Zhao, W.; Liu, M.; An, S.; Ma, Q. Stochastic optimization of combined energy and computation task scheduling strategies of hybrid system with multi-energy storage system and data center. Renew. Energy 2025, 242, 122466. [Google Scholar] [CrossRef]
  24. Yan, Y.; Huang, C.; Guan, J.; Zhang, Q.; Cai, Y.; Wang, W. Stochastic optimization of solar-based distributed energy system: An error-based scenario with a day-ahead and real-time dynamic scheduling approach. Appl. Energy 2024, 363, 123099. [Google Scholar] [CrossRef]
  25. Dong, X.-J.; Shen, J.-N.; Ma, Z.-F.; He, Y.-J. Stochastic optimization of integrated electric vehicle charging stations under photovoltaic uncertainty and battery power constraints. Energy 2025, 314, 134163. [Google Scholar] [CrossRef]
  26. Duan, F.; Bu, X. Stochastic optimization of a hybrid photovoltaic/fuel cell/parking lot system incorporating cloud model. Renew. Energy 2024, 237, 121727. [Google Scholar] [CrossRef]
  27. Zhang, S.; Hu, W.; Du, J.; Cao, X.; Bai, C.; Liu, W.; Wang, D.; Chen, Z. Hierarchical distributionally robust scheduling strategy for distributed energy systems in the energy-sharing environment. Appl. Energy 2025, 388, 125639. [Google Scholar] [CrossRef]
  28. Prome, S.A.; Ragavan, N.A.; Islam, M.R.; Asirvatham, D.; Jegathesan, A.J. Deception detection using machine learning (ML) and deep learning (DL) techniques: A systematic review. Nat. Lang. Process. J. 2024, 6, 100057. [Google Scholar] [CrossRef]
  29. Cao, D.; Hu, W.H.; Zhao, J.B.; Huang, Q.; Chen, Z.; Blaabjerg, F. A Multi-Agent Deep Reinforcement Learning Based Voltage Regulation Using Coordinated PV Inverters. IEEE Trans. Power Syst. 2020, 35, 4120–4123. [Google Scholar] [CrossRef]
  30. Zhao, P.F.; Hu, W.H.; Cao, D.; Huang, R.; Wu, X.W.; Huang, Q.; Chen, Z. Causal Mechanism-Enabled Zero-Label Learning for Power Generation Forecasting of Newly-Built PV Sites. IEEE Trans. Sustain. Energy 2025, 16, 392–406. [Google Scholar] [CrossRef]
  31. Emrani, A.; Berrada, A.; Bakhouya, M. Optimal sizing and deployment of gravity energy storage system in hybrid PV-Wind power plant. Renew. Energy 2022, 183, 12–27. [Google Scholar] [CrossRef]
  32. Cui, J.; Zhu, Z.; Qu, G.; Wang, Y.; Li, R. Demand-side shared energy storage pricing strategy based on stackelberg-Nash game. Int. J. Electr. Power Energy Syst. 2025, 164, 110387. [Google Scholar] [CrossRef]
  33. Hua, Z.; Li, J.; Zhou, B.; Or, S.W.; Chan, K.W.; Meng, Y. Game-theoretic multi-energy trading framework for strategic biogas-solar renewable energy provider with heterogeneous consumers. Energy 2022, 260, 125018. [Google Scholar] [CrossRef]
  34. Xu, X.; Wang, B.; Shi, M.; Li, G.; Zhang, Y.; Wang, Q.; Liu, D. Research on hydrogen storage system configuration and optimization in regional integrated energy systems considering electric-gas-heat-hydrogen integrated demand response. Int. J. Hydrogen Energy 2025, 135, 86–103. [Google Scholar] [CrossRef]
  35. Li, Y.; Wang, J.; Cao, Y. Multi-objective distributed robust cooperative optimization model of multiple integrated energy systems considering uncertainty of renewable energy and participation of electric vehicles. Sustain. Cities Soc. 2024, 104, 105308. [Google Scholar] [CrossRef]
  36. Wu, Z.; Kang, J.; Mosteiro-Romero, M.; Bartolini, A.; Ng, T.S.; Su, B. A distributionally robust optimization model for building-integrated photovoltaic system expansion planning under demand and irradiance uncertainties. Appl. Energy 2024, 372, 123740. [Google Scholar] [CrossRef]
  37. Zdraveski, V.; Todorovski, M. A robust optimization model for Optimal Feeder Routing and Battery Storage Systems design. Appl. Energy 2024, 374, 123978. [Google Scholar] [CrossRef]
  38. Li, L.; Cao, X.; Zhang, S. Shared energy storage system for prosumers in a community: Investment decision, economic operation, and benefits allocation under a cost-effective way. J. Energy Storage 2022, 50, 104710. [Google Scholar] [CrossRef]
  39. Xiong, K.; Hu, W.; Cao, D.; Zhang, G.; Chen, Z.; Blaabjerg, F. A novel two-level deep reinforcement learning enabled game approach for incentive-based distributed voltage regulation with participation of autonomous photovoltaic inverters. Energy 2025, 324, 135934. [Google Scholar] [CrossRef]
  40. Wang, H.; Huang, J. Incentivizing energy trading for interconnected microgrids. IEEE Trans. Smart Grid 2016, 9, 2647–2657. [Google Scholar] [CrossRef]
  41. Zhang, S.; Hu, W.; Du, J.; Bai, C.; Liu, W.; Chen, Z. Low-carbon optimal operation of distributed energy systems in the context of electricity supply restriction and carbon tax policy: A fully decentralized energy dispatch strategy. J. Clean. Prod. 2023, 396, 136511. [Google Scholar] [CrossRef]
  42. Kong, X.; Xiao, J.; Liu, D.; Wu, J.; Wang, C.; Shen, Y. Robust stochastic optimal dispatching method of multi-energy virtual power plant considering multiple uncertainties. Appl. Energy 2020, 279, 115707. [Google Scholar] [CrossRef]
  43. Xiong, Z.; Zhang, D.; Wang, Y. Optimal operation of integrated energy systems considering energy trading and integrated demand response. Energy Rep. 2024, 11, 3307–3316. [Google Scholar] [CrossRef]
  44. Li, L.; Yu, S. Optimal management of multi-stakeholder distributed energy systems in low-carbon communities considering demand response resources and carbon tax. Sustain. Cities Soc. 2020, 61, 102230. [Google Scholar] [CrossRef]
Figure 1. IES structure.
Processes 13 01906 g001
Figure 2. Renewable-energy output and load forecasting curve.
Processes 13 01906 g002
Figure 3. Renewable energy output and load offset for the worst-case scenarios: (a) PV generation; (b) WT generation; (c) Electricity demand; (d) Heat demand.
Processes 13 01906 g003
Figure 4. IES electricity supply-and-demand balance under different scenarios: (a) deterministic scenario; (b) robust optimization scenario.
Processes 13 01906 g004
Figure 5. IES heat supply-and-demand balance under different scenarios: (a) deterministic scenario; (b) robust optimization scenario.
Processes 13 01906 g005
Figure 6. Electricity demand in different scenarios: (a) electricity demand; (b) heat demand.
Processes 13 01906 g006
Figure 7. Worst-case scenarios for different uncertainty budget levels: (a) PV generation; (b) WT generation; (c) Electricity demand; (d) Heat demand.
Processes 13 01906 g007
Table 1. Installed capacities of various distributed energy sources in IESs.
CHP (kW)GB (kW)HP (kW)
IES250100150
Table 2. External electricity/heat price data.
Time SlotElectricity/Heat Price (RMB/kWh)
Electricity pricePeak (6:00–10:00, 13:00–17:00)1.10
Plain (10:00–13:00, 17:00–22:00)0.77
Valley (0:00–6:00, 22:00–24:00)0.44
Heat pricePeak (9:00–12:00, 17:00–21:00)0.45
Plain (6:00–9:00, 12:00–17:00)0.39
Valley (0:00–6:00, 21:00–24:00)0.33
Table 3. IES costs and carbon emissions in different scenarios.
Scenario 1Scenario 2Scenario 3
Cost (RMB)7091.036589.786489.18
Carbon emissions (kg)6165.575951.465732.54
Table 4. IES costs and carbon emissions with different carbon taxes.
Carbon Tax (RMB/t)050100150200250
Cost (RMB)5896.606202.556489.186774.237059.237344.22
Carbon emissions (kg)6154.735732.545732.545699.875699.875699.87
Table 5. Energy cost and carbon emissions of IESs under different uncertain budget scenarios.
Uncertain Budget61224
Cost (RMB)5956.466489.187232.33
Carbon emission (kg)5184.105732.546687.13
Disclaimer/Publisher’s Note: The statements, opinions and data contained in all publications are solely those of the individual author(s) and contributor(s) and not of MDPI and/or the editor(s). MDPI and/or the editor(s) disclaim responsibility for any injury to people or property resulting from any ideas, methods, instructions or products referred to in the content.

