Article

Process Optimization of Ultrasonic-Assisted Extraction and Resin Purification of Flavonoids from Eucommia ulmoides Leaves and Their Antioxidant Properties In Vitro

1
Anhui Chengqingtang National Pharmaceutical Co., Ltd., Bozhou 236800, China
2
Department of Biological and Food Engineering, Bozhou University, Bozhou 236800, China
*
Authors to whom correspondence should be addressed.
Processes 2025, 13(6), 1905; https://doi.org/10.3390/pr13061905
Submission received: 13 May 2025 / Revised: 1 June 2025 / Accepted: 13 June 2025 / Published: 16 June 2025

Abstract

:
In this study, an orthogonal array design was employed to optimize total flavonoid extraction conditions. The results showed that the optimal conditions were an ethanol concentration of 70%, an ultrasonic power of 250 W, a solid–liquid ratio of 1:30 g/mL, and an ultrasonic time of 25 min. Under these optimal extraction conditions, the total flavonoid yield was 169.3 mg/g plant material. The purification effects of LX-38, LX-60, LS-46, LS-306, XDA-8, AB-8, and D101 macroporous resins on the total flavonoids of Eucommia ulmoides leaves were also investigated. The parameters of the process using XDA-8 macroporous resin for the purification of the crude extract of total flavonoids from Eucommia ulmoides leaves were investigated. The adsorption conditions of the XDA-8 resin consisted of an initial sample concentration of 2.0 mg/mL, a sample pH value of 5.0, an adsorption flow rate of 1.5 mL/min, and a temperature of 25 °C. The desorption conditions of the XDA-8 resin consisted of 60% ethanol used as a desorption solution and a 2.0 mL/min desorption flow rate of the eluent. The total flavonoids from the Eucommia ulmoides leaves were purified under these conditions, and, afterward, the flavonoid content was 51.5%. The main components of the purified flavonoids from the Eucommia ulmoides leaves were isolated using high-performance liquid chromatography (HPLC), and they included chlorogenic acid, rutin, isoquercetin, kaempferol-3-O-rutinoside, quercetin 3-rhamnoside, hyperoside, and quercetin. The antioxidant activities were measured, and those of the purified total flavonoids from the Eucommia ulmoides leaves were higher than those of dibutylhydroxytoluene (BHT) and lower than those of ascorbic acid (Vc). Additionally, the purified total flavonoids from the Eucommia ulmoides leaves exhibited significant antioxidant activities.

1. Introduction

Eucommia (Eucommia ulmoides Oliv.) is a deciduous tree belonging to the family Eucommiaceae [1]. The bark of Eucommia ulmoides refers to the dried bark of Eucommia, which contains flavonoids, alkaloids, lignans, phenols, polysaccharides, cyclic enol ether terpenes, and other active ingredients [2,3]. These components are known for having effects such as strengthening the muscles and bones, tonifying the liver and kidneys, and tranquilizing the fetus [4,5,6]. As a result, Eucommia bark is widely used as a traditional Chinese medicine (TCM) in Chinese medicine clinics. Eucommia bark has been widely developed and applied to date. However, Eucommia bark resources are lacking because of the long time required for growth [7]. Moreover, the large amount of Eucommia bark herbs used will inevitably lead to the destruction of resources. Eucommia ulmoides leaves are abundant, easily available, and renewable resources. There is little difference in the active components and pharmacological effects of Eucommia ulmoides leaves and its bark [8,9]. Additionally, the flavonoid concentration in Eucommia ulmoides leaves is even higher than in the bark [10]. However, Eucommia ulmoides leaves and their flavonoids have not been developed or used as deeply or comprehensively as Eucommia bark. Extracting and utilizing Eucommia ulmoides leaf flavonoids can not only solve the problem of the insufficient traditional medicinal sources of Eucommia bark but also enable the application of natural Eucommia ulmoides leaf flavonoids to various fields. As Eucommia ulmoides leaves and their flavonoid extracts have various potent biological activities, they can serve as good raw materials and additives for health care products, and they can be used to develop functional products with high nutritional and health care value.
There are many extraction methods for flavonoids, among which the traditional extraction methods are maceration and thermal reflux extraction [11]. Although these methods are simple and easy to implement, they are time-consuming, have low yields, and leave solvent residues [12,13]. In contrast, ultrasound-assisted extraction methods offer many advantages, including being more efficient, economical, and sustainable. Ultrasound-assisted extraction generates powerful micro-jets and shock waves, which disrupt the cellular structure and enhance the release and solubilization of flavonoids. Additionally, the efficiency of flavonoid extraction is increased, while the damage to the environment is effectively reduced. Meanwhile, ultrasound-assisted extraction also accelerates the leaching of bioactive compounds, improves extraction efficiency, and reduces resource waste [14,15,16]. To date, ultrasound-assisted extraction has been used by researchers and scholars for the extraction and separation of flavonoids from Oxalis corniculata [16], Sophorae tonkinensis Radix et Rhizoma [17], Hibiscus sabdariffa calyces [18], and peanut leaves [19]. Studies have shown that ultrasound-assisted extraction can significantly disrupt the cellular organization of natural product raw materials. However, few studies have used ultrasound-assisted extraction method, and few have investigated the antioxidant activity of Eucommia ulmoides leaves flavonoid extracts. Therefore, it is important to examine the effects of ultrasound-assisted extraction factor variables on the extraction efficiency of flavonoids and the antioxidant activity of Eucommia ulmoides leaves flavonoid extracts. Due to the rising demand for natural antioxidants in food and other industries, efficient extraction and purification methods for plant-based flavonoids are essential. Among various macroporous resins, XDA-8 has shown superior selectivity and adsorption capacities, making it well suited for flavonoid separation and purification. In this research, flavonoids from Eucommia ulmoides leaves were efficiently extracted and purified using ultrasound-assisted extraction and XDA-8 resin. Different from previous studies conducted by other researchers [1,2,9], Eucommia ulmoides leaves, which are renewable resources, were selected to carry out this study, the ultrasound-assisted extraction method was used to improve the flavonoid extraction rate, and the XDA-8 resin purification method was used to improve the flavonoid extraction rate in the extracts. The findings provide essential insights for the future utilization of these compounds in nutraceuticals and medicinal products.
We systematically investigated the ultrasound-assisted extraction and subsequent XDA-8 resin purification of flavonoids from Eucommia ulmoides leaves. The antioxidant activities of the purified total flavonoids from Eucommia ulmoides leaves were evaluated in vitro. The aim of this study was to obtain purified total flavonoids from Eucommia ulmoides leaves with a high extraction rate, high purity, and good antioxidant properties.

2. Materials and Methods

2.1. Materials and Chemical Reagents

Eucommia ulmoides leaves were provided by Anhui Chengqingtang National Pharmaceutical Co., Ltd. (Bozhou, China) and obtained though the Bozhou Chinese Medicine Exchange, Anhui province. Rutin standard and DPPH were purchased from Sigma-Aldrich (Merck & Co., Inc., St. Louis, MO, USA). Chlorogenic acid, rutin, isoquercetin, kaempferol-3-O-rutinoside, quercetin 3-rhamnoside, hyperoside, and quercetin standards were purchased from China National Standard Pharmaceutical Co., Ltd. (Shanghai, China). Seven types of macroporous resins, namely, LX-38, LX-60, LS-46, LS-306, XDA-8, AB-8, and D101, were purchased from Sunresin New Materials Co., Ltd. (Xi’an, Shaanxi, China).

2.2. Optimization of Extraction Conditions of Total Flavonoids from Eucommia ulmoides Leaves

The ultrasound-assisted extraction process is primarily influenced by factors such as the ethanol concentration, ultrasonic power, solid-to-liquid ratio, and ultrasonic time [20,21,22,23,24]. In this study, the ethanol concentration (A), ultrasonic power (B), solid-to-liquid ratio (C), and ultrasonic time (D) were systematically investigated, and the optimal process conditions were determined using an orthogonal array design The independent variable levels and orthogonal experimental results are shown in Table 1, and analysis of variance (ANOVA) results are presented in Table 2.

2.3. Adsorption and Desorption Tests

Resin adsorption tests were conducted according to the methodology described by Su et al., with specific modifications [1]. A 250 mL stoppered flask was charged with 10.0 g of pretreated resin, to which 100 mL of sample solution (initial total flavonoid concentration: 3.0 mg/mL) was introduced under controlled conditions. The flask was maintained under continuous-shaking conditions (180 rpm and 25 °C) for 24 h. The adsorption capacities (A) of the seven types of resins were calculated using the following equation:
A = m 0 m 1 m 0 × 100 %
Here, A is the adsorption ratio (%), m0 is the initial total flavonoid content of the sample solution before adsorption (mg), and m1 is the total flavonoid content of the sample solution after adsorption (mg).
Following the adsorption phase using the macroporous resin, the eluent was collected. The resins were then desorbed under the following conditions: the desorption solution was 60% ethanol, the volume of the desorption solution was 100 mL, the shaking speed was 180 rpm, the shaking temperature was 25 °C, the shaking time was 24 h, and the resins were protected from light. The desorption capacities (D) of the seven types of resins were as follows:
D = m 2 m 0 m 1 × 100 %
Here, D is the desorption ratio (%), m0 is the initial total flavonoid content before adsorption (mg), m1 is the total flavonoid content after adsorption (mg), and m2 is the total flavonoid content after desorption (mg).

2.4. Flavonoids Purification Process

The sample solutions were adjusted to different pH values (4.0, 4.5, 5.0, 5.5, and 6.0). For each test, different solution concentrations (2.0, 3.0, and 4.0 mg/mL) were used, with a volume of 100 mL. To investigate the relationships between the adsorption capacity, pH value, and sample concentration, experiments were carried out. Next, 100 mL of 3.0 mg/mL sample solution was subjected to adsorption. After the resin was fully adsorbed, 200 mL of different concentrations (50%, 60%, and 70% (v/v)) of ethanol solutions were used to desorb the fully adsorbed resin after washing with distilled water. Furthermore, to determine the effect of the sample solution flow rate on the XDA-8 resin adsorption ratio, experiments were conducted using flow rates of 1.5, 2.0, and 2.5 mL/min. For these tests, the sample concentration was kept at 3.0 mg/mL, and the sample volume was kept at 200 mL. After completing the XDA-8 resin adsorption test, the effect of the flow rate on the XDA-8 resin desorption ratio was determined by applying the elute solution at different flow rates (1.5, 2.0, and 2.5 mL/min), with an elute solution of 60% ethanol.

2.5. Determination of Total Flavonoid Content

To determine the total flavonoid content, the colorimetric method reported by Nguyen Tram Anh et al. was employed, with modifications [25]. The sample solution (0.5 mL) was first pipetted. Subsequently, 95% ethanol (1 mL), 1 M potassium acetate (0.1 mL), and 10% aluminum chloride solution (0.1 mL) were added in sequence. The reaction mixture was finally brought to 5 mL with distilled water. After 30 min of reaction in the dark, absorbance was recorded at 415 nm with a UV1900 UV–Vis spectrophotometer (Shanghai Lengguang Technology Co., Ltd., Shanghai, China). A series of rutin standard solutions were prepared, with concentrations ranging from 10 to 50 mg/L (10, 20, 30, 40, and 50 mg/L). The calibration curve was determined as y = 0.0231x − 0.0052, R2 = 0.9986, where x is the total flavonoid concentration, and y is the sample’s absorbance.

2.6. Analysis of Antioxidant Activity of Total Flavonoids

2.6.1. Total Flavonoid Sample Preparation

The crude extract was obtained from Eucommia ulmoides leaves. XDA-8 resin chromatography was employed to purify the crude extract, yielding total flavonoids. These were subsequently dissolved in 95% ethanol to generate sample solutions at 0.1, 0.2, 0.3, 0.4, and 0.5 mg/mL concentrations, with Vc and BHT prepared at corresponding concentrations as reference controls.

2.6.2. DPPH Radical Scavenging Activity

The scavenging activity of the purified total flavonoids on the DPPH free radical was evaluated using the colorimetric method reported by Xu et al., with specific modifications [26]. We used Vc and BHT at concentrations consistent with those of the samples used as positive controls. The scavenging activity of DPPH was calculated as follows:
D P P H   ·   S c a v e n g i n g   c a p a b i l i t y ( % ) = 1 A m A n A 0 × 100 %
Here, Am is the sample absorbance with DPPH, An is the sample absorbance without DPPH, and A0 is the absorbance of DPPH.

2.6.3. Determination of Reducing Power

The reducing power of the purified total flavonoids was evaluated using the method reported by Xu et al., with specific modifications [27,28]. A reaction mixture containing sample solution (1.0 mL), phosphate buffer (pH 6.6, 1.0 mL), and 1% potassium ferricyanide (1.0 mL) was incubated for 30 min at 50 °C under light-avoidance conditions. Proteins were precipitated by adding 10% trichloroacetic acid (1.0 mL), followed by thorough mixing and centrifugation (4000 rpm, 5 min). For absorbance measurement at 700 nm (UV1900 UV–Vis spectrophotometer), a mixture was prepared using 0.5 mL of the supernatant, 0.5 mL of 0.1% (w/v) ferric chloride solution, and 4.0 mL distilled water. Throughout our test, distilled water was used as a blank group.

2.6.4. Hydroxyl Radical Scavenging Activity

The scavenging activity of the purified total flavonoids on hydroxyl free radicals was evaluated using the method reported by Wang et al., with specific modifications [29]. A reaction mixture was prepared in a test tube by combining 2.0 mL of sample solution with 2.0 mL of 9 mmol/L FeSO4, 2.0 mL of 9 mmol/L salicylic acid in ethanol, and 2.0 mL of 8.8 mmol/L H2O2 solution. After thorough shaking, the mixture was incubated for 30 min at 25 °C. Absorbance was subsequently measured at 510 nm using a UV1900 UV–Vis spectrophotometer (Shanghai Lengguang Technology Co., Ltd., Shanghai, China). The scavenging activity on hydroxyl radicals was calculated as follows:
H y d r o x y l   r a d i c a l   S c a v e n g i n g   c a p a b i l i t y ( % ) = 1 A m A n A 0 × 100 %
Here, Am is the absorbance of the test sample, An is the absorbance of the sample without H2O2, and A0 is the absorbance of the solution without the sample.

2.6.5. Scavenging Activity on Superoxide Anion Radical

The scavenging activity of the purified total flavonoids on the superoxide anion free radical was determined using the method reported by Liang et al., with specific modifications [30]. The sample solution (2.0 mL) and Tris-HCl buffer (pH 8.2, 4.5 mL) were vortexed in a test tube and thermally equilibrated at 25 °C for 15 min. Then, 0.2 mL of 2.0 mmol/L o-Benzenetriol solution was added to the test tube, and the mixture was incubated for another 5 min at 25 °C after thorough mixing. Finally, the reaction was terminated with 0.2 mL of 8.0 mmol/L HCl, and the absorbance was immediately measured at 320 nm (UV1900 UV–Vis spectrophotometer). The scavenging capability on superoxide anion radicals was calculated as follows:
S u p e r o x i d e   a n i o n   r a d i c a l   S c a v e n g i n g   c a p a b i l i t y ( % ) = 1 A m A n A 0 × 100 %
Here, Am is the test sample, An is the sample without the o-Benzenetriol solution, and A0 is the solution without the sample.

2.6.6. ABTS Radical Scavenging Activity

The ability of the purified total flavonoids to scavenge ABTS free radicals was examined using the method reported by Xu et al., with specific modifications [27]. An ABTS solution containing potassium persulfate was prepared by mixing 7 mmol/L ABTS solution and 2.45 nmol/L K2S2O8 solution at a 1:1 (v/v) ratio, refrigerating the mixture at 4 °C in the dark for 12 h, and then diluting it with an appropriate volume of anhydrous ethanol. The sample solution and the prepared ABTS solution were mixed at a 1:4 (v/v) ratio and left to stand for 30 min, and then the absorbance was measured at 734 nm (UV1900 UV–Vis spectrophotometer). The scavenging activity on ABTS free radicals was calculated as follows:
A B T S   r a d i c a l   S c a v e n g i n g   c a p a b i l i t y ( % ) = 1 A m A n A 0 × 100 %
Here, Am is the sample absorbance with ABTS, An is the sample absorbance with anhydrous ethanol, and A0 is the ethanol absorbance with ABTS.

2.7. HPLC Analysis of the Purified Total Flavonoids

The purified total flavonoids were determined using the HPLC method described by Xing et al. [31], with specific modifications. An HPLC analysis was performed on an Agilent 1260 system (Santa Clara, CA, USA) (detector: Agilent 1200) using a Dikmac C18 column (250 × 4.5 mm, 5 μm) with 2.0 μL injections to characterize the purified total flavonoids. The gradient elution was used for elution: 0~12 min, 10% acetonitrile and 90% aqueous phosphoric acid solution (0.1%); 12~18 min, 20% acetonitrile and 80% aqueous phosphoric acid solution (0.1%); 18~30 min, 30% acetonitrile and 80% aqueous phosphoric acid solution (0.1%); 30~38 min, 40% acetonitrile and 60% aqueous phosphoric acid solution (0.1%); 38~43 min, 50% acetonitrile and 50% aqueous phosphoric acid solution (0.1%); 43~45 min, 30% acetonitrile and 70% aqueous phosphoric acid solution (0.1%); and 45~50 min, 10% acetonitrile and 90% aqueous phosphoric acid solution (0.1%). Additionally, a flow rate of 1.0 mL/min was used. The detection wavelength was set to 360 nm, and the detection temperature was set to 40 °C. The standard solution was prepared separately by precisely weighing a standard of 1.00 mg chlorogenic acid, 1.02 mg rutin, 0.98 mg isoquercetin, 0.99 mg quercetin-3-rhamnoside, 1.02 mg hyperoside, 0.97 mg quercetin, and 1.00 mg kaempferol-3-O-rutinoside and diluting with methanol in a 10mL volumetric flask. The standard solutions and the purified total flavonoid sample were measured under chromatographic conditions.

2.8. Statistical Analysis

All data are expressed as mean ± standard error (SE). A statistical analysis was performed using SPSS Statistics v.26.0. All test operations were performed in three replicates. Mean comparisons were carried out using an analysis of variance (ANOVA). Statistical significance was considered at p < 0.05.

3. Results and Analyses

3.1. Optimization of Ultrasonic-Assisted Extraction for Total Flavonoids

As shown in Table 1, the ultrasonic power had a more significant effect than the other three factors. The order of influence of the different factors on the yield of the total flavonoids from the Eucommia ulmoides leaves was as follows: ultrasonic power > ethanol concentration > solid-to-liquid ratio > ultrasonic time. The analysis of variance (ANOVA) results are presented in Table 2. The maximum flavonoid yield (169.3 mg/g plant material) was achieved with the following optimized ultrasonic parameters: a 70% ethanol concentration, 250 W ultrasonic power, 1:30 g/mL solid-to-liquid ratio, and 25 min extraction time. All test operations were carried out in three replicates. Yang et al. [32] used the ethanol extraction method to extract flavonoids, and the optimized extraction rate was 1.55%, which is lower than that of the ultrasonic-assisted extraction method. Therefore, this method can effectively improve the extraction rate. However, when this method was used to extract flavonoids from Amomum villosum Lour. raw material [14], the yield of flavonoids was 82.22 mg/g plant material. Therefore, the ultrasonic-assisted extraction method is more advantageous for the extraction of total flavonoids from Eucommia ulmoides leaves. The optimal ethanol concentration was 70%, likely because an appropriate ethanol concentration increases the solution’s permeability to the material, thereby improving the yield of the total flavonoids [33]. Ultrasound has strong mechanical, thermal, and cavitation effects. Ultrasonic treatment destroys the cell walls of Eucommia leaves, improving the yield of total flavonoids. However, an excessive ultrasound power or a prolonged ultrasound time can lead to structural changes in the flavonoids [34]. We determined that a 250 W ultrasonic power and a 25 min duration provided optimal extraction efficiency for flavonoids from Eucommia ulmoides leaves. The results showed that the antioxidant capacity of the total flavonoids increased with the increasing mass concentration of the total flavonoids [35]. Therefore, we carried out further antioxidant studies on the total flavonoids that had the highest extraction rates.

3.2. Purification of Total Flavonoids from Eucommia ulmoides Leaves Using Macroporous Resins

3.2.1. Resin Selection

As can be seen in Table 3, the order of the adsorption rate of total flavonoids using different resins was XDA-8 > AB-8 > LS-46 > D101 = LX-38 > LS-306 > LX-60, and the adsorption ratio of the XDA-8 resin (88.3%) was significantly higher than that of the other resins. Meanwhile, the desorption ratio (86.8%) of the XDA-8 resin was also the highest among the seven resins, and the order of the desorption rate of the total flavonoids using different resins was XDA-8 > AB-8 > LS-306 > LX-38 > LX-60 > LS-46 > D101. With its large surface area and continuous pore size, XDA-8 resin selectively adsorbs the total flavonoids of Eucommia ulmoides leaves through hydrogen bonding, van der Waals forces, and its porous structure, and it exhibits good static adsorption kinetics for flavonoids from ethyl acetate and n-butanol fractions. It is more suitable for experimental research and industrial production than other large-pore adsorption resins [36]. XDA-8 resin is a weakly polar macroporous adsorbent resin, and its selective adsorption of substances is mainly based on the principle of similar phase solubility, molecular polarity, molecular size, and hydrophobic interactions. It has a selective adsorption effect on flavonoids. However, inorganic salts, some amino acids, and large-molecular-weight proteins and polysaccharides cannot be adsorbed by XDA-8 resin, and these components will actually be reduced when XDA-8 resin is used to purify flavonoids.

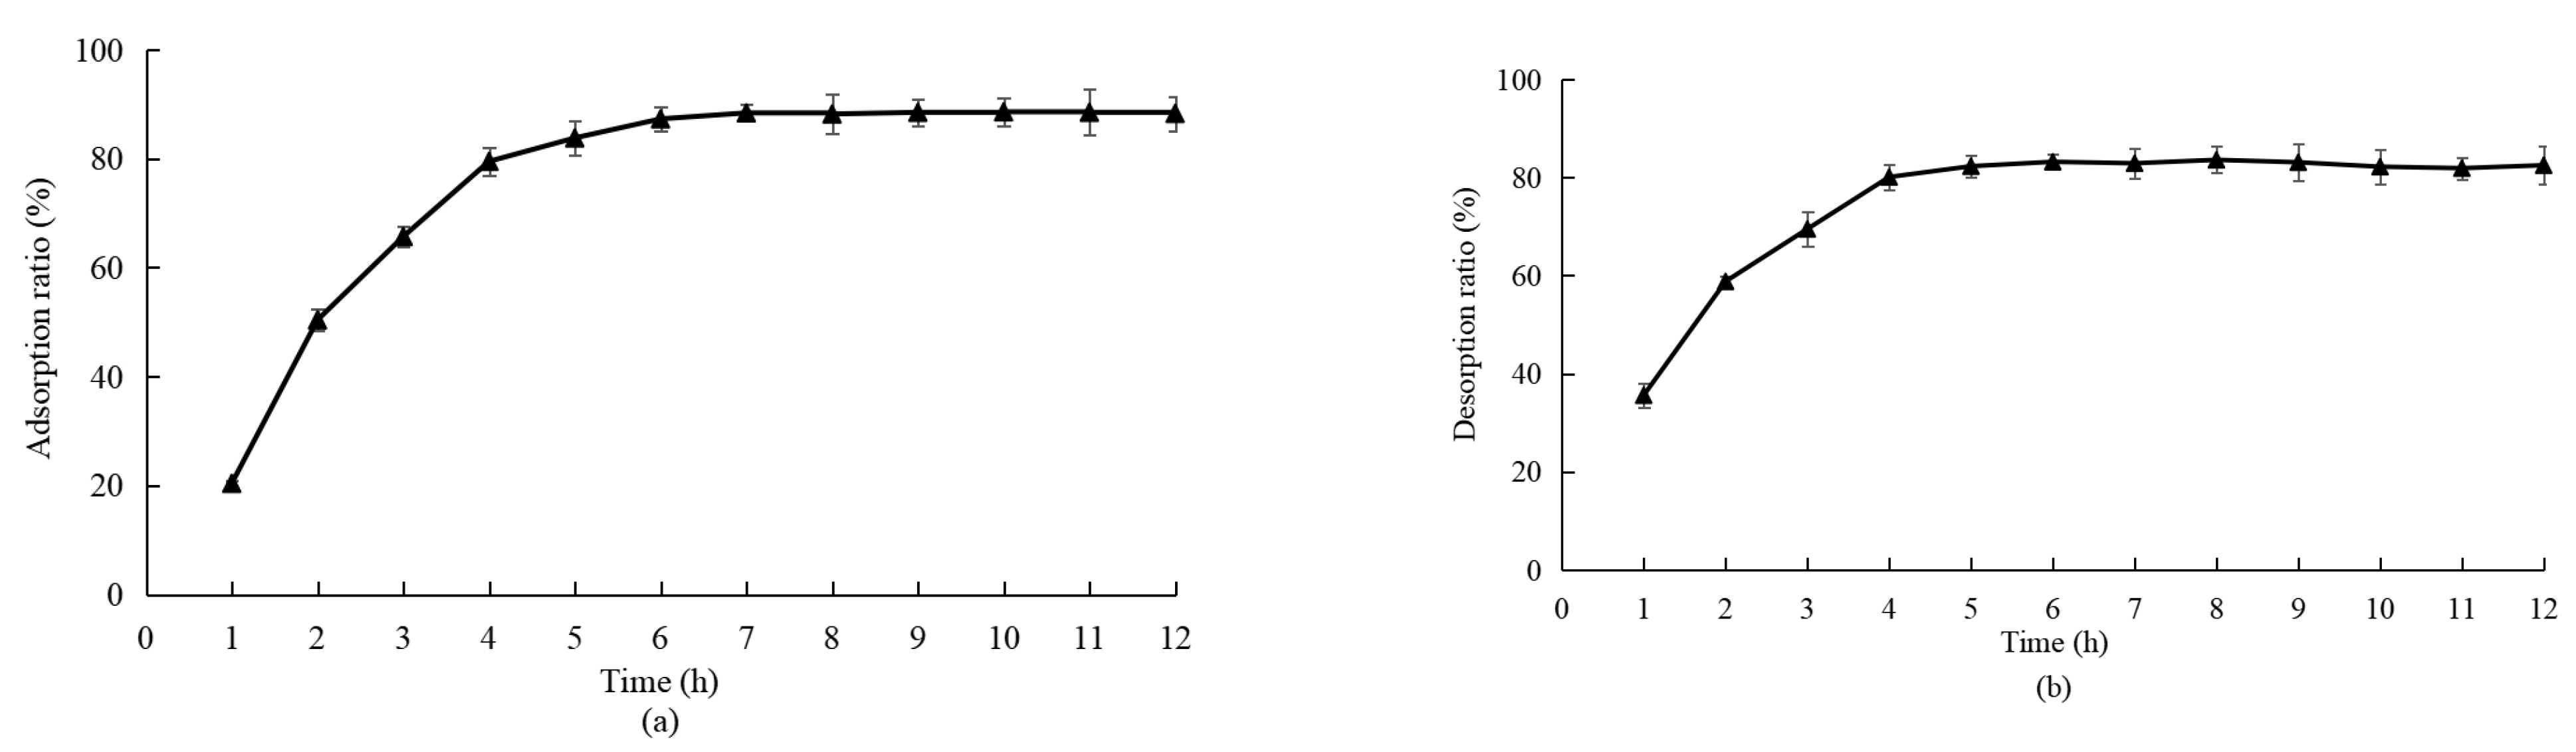
3.2.2. Adsorption and Desorption of XDA-8 Resin on Total Flavonoids

In Figure 1a, we observed that, when the adsorption time was 1 h, the XDA-8 resin adsorption ratio on the total flavonoids of the Eucommia ulmoides leaves was 20.4%; when the adsorption time reached 5 h, the adsorption ratio increased to 82.3%. With a further extension of the adsorption time, the XDA-8 resin adsorption ratio on the total flavonoids of the Eucommia ulmoides leaves remained essentially stable, indicating that adsorption was complete. The adsorption ratio of the total flavonoids showed little change when the adsorption time was further increased [37]. Considering the operational time and efficiency for industrial production, the optimal adsorption time was determined to be 5 h.
In Figure 1b, we observed that, when the desorption time was 1 h, the desorption ratio of the XDA-8 resin on the total flavonoids of the Eucommia ulmoides leaves was 35.6%; when the desorption time reached 4 h, the desorption ratio increased to 80.1%; and the highest desorption ratio (83.6%) was observed at 8 h. With a further extension of the desorption time, the desorption ratio of the XDA-8 resin on the total flavonoids of the Eucommia ulmoides leaves remained essentially stable, indicating that desorption was nearly complete. Considering the operation time and efficiency for industrial production, the optimal desorption time was determined to be 5 h.

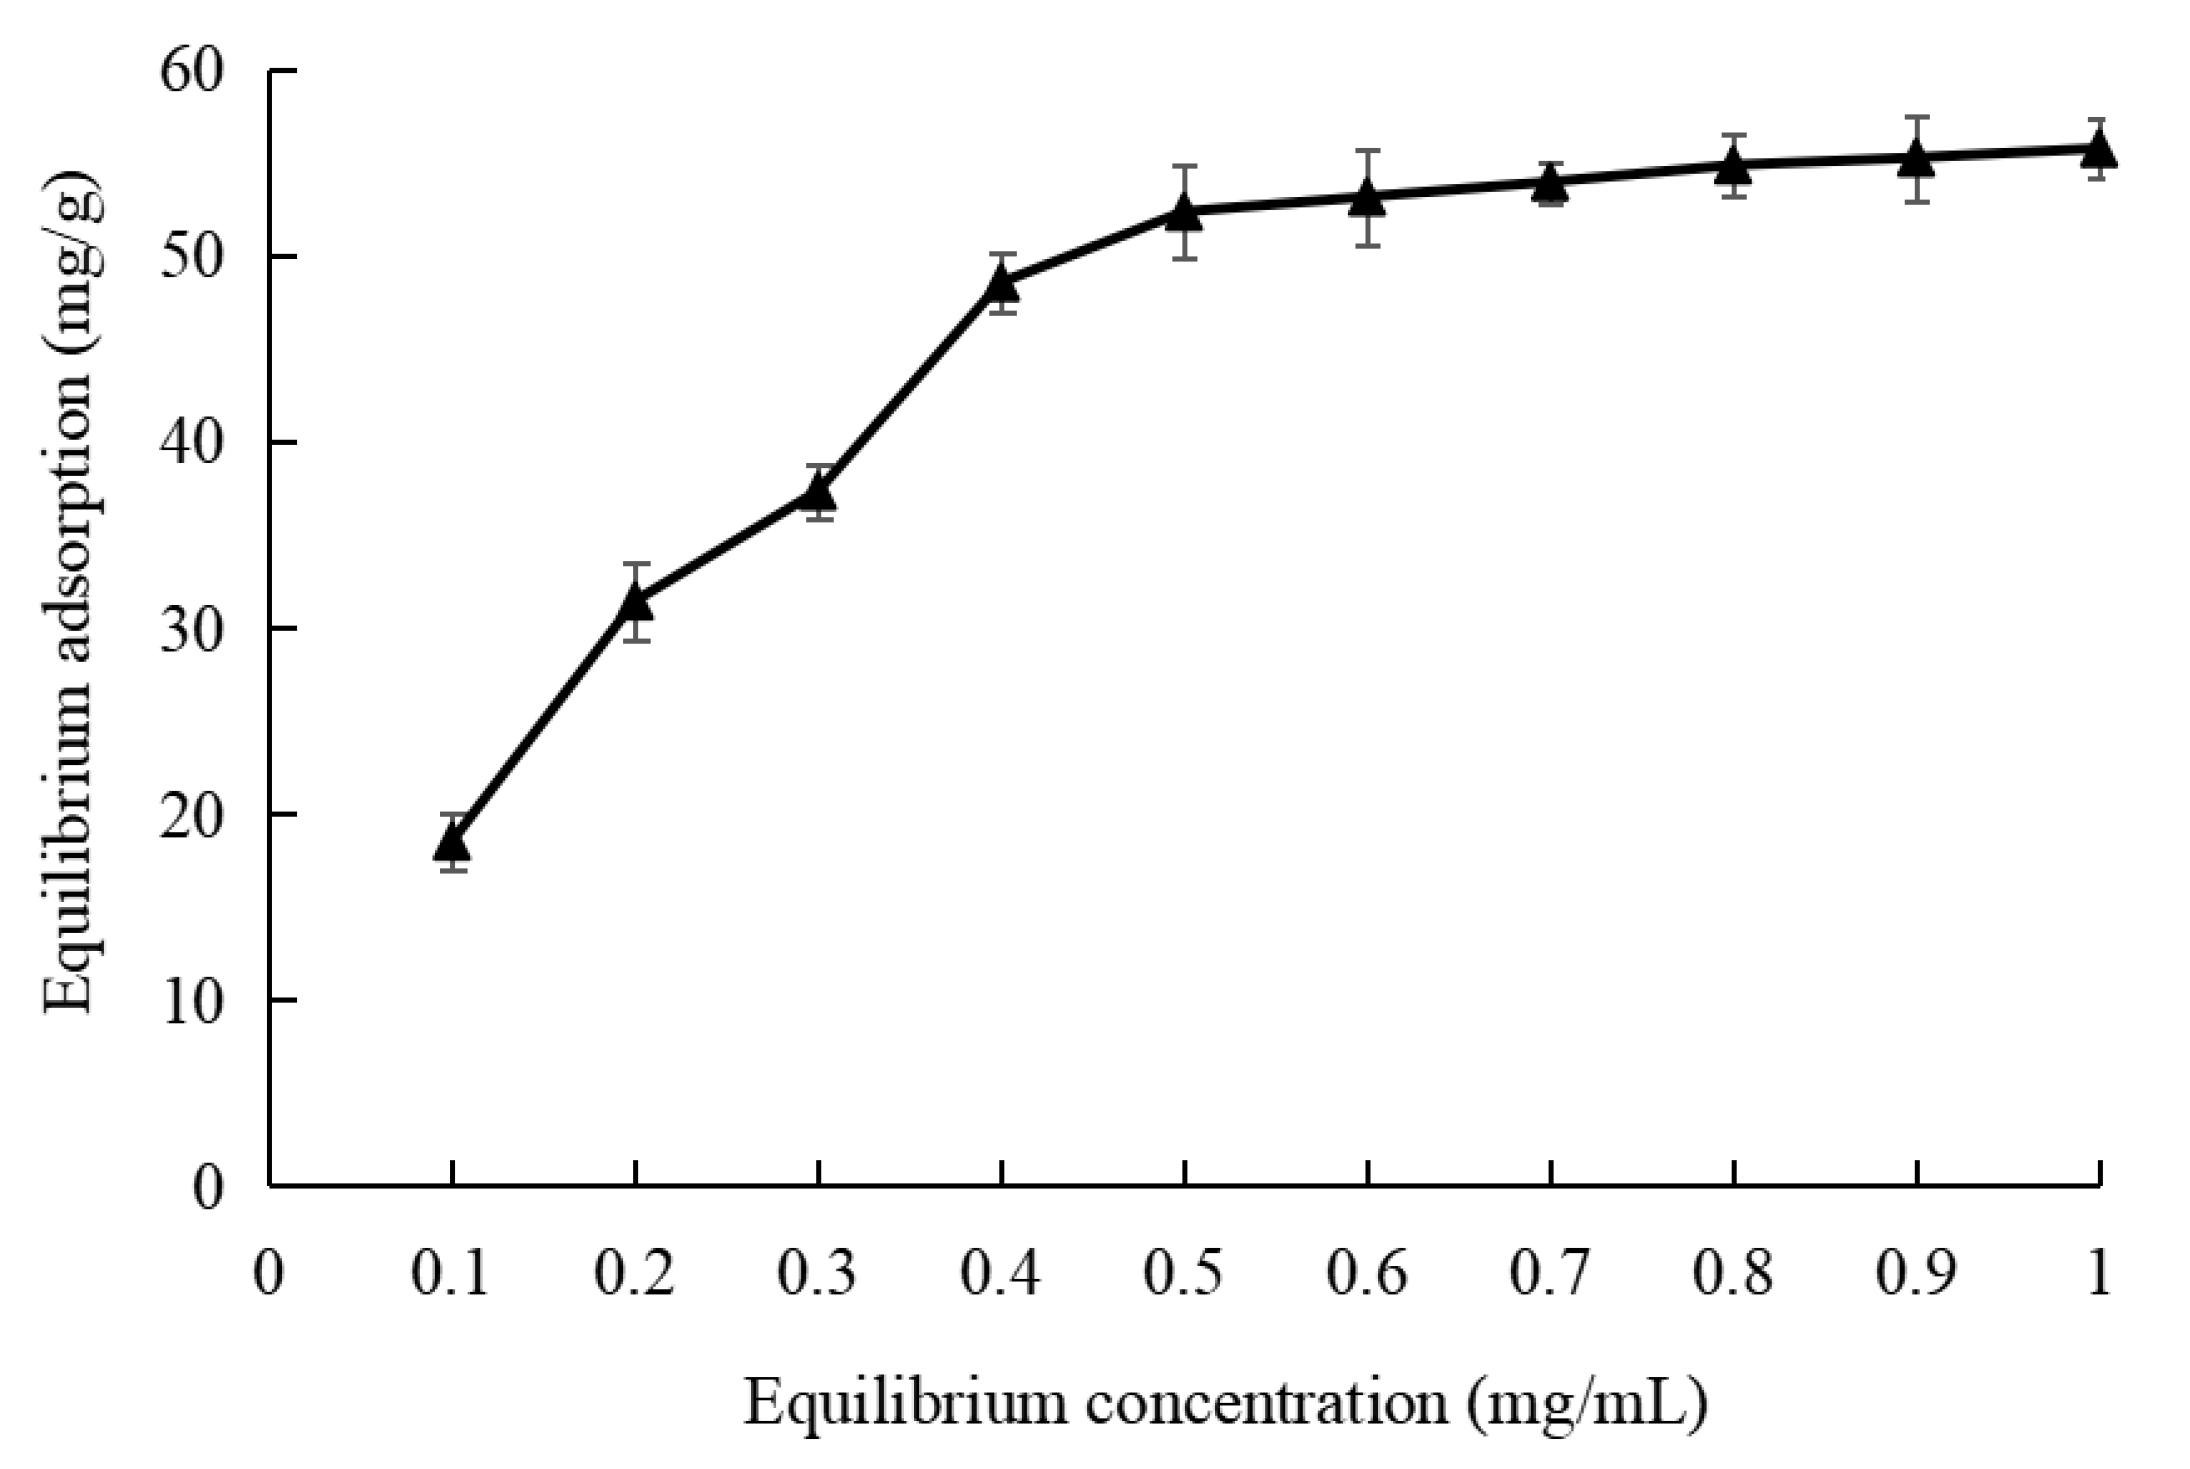
3.2.3. Adsorption Isotherms of XDA-8 Resin

Within certain temperature ranges, the adsorption capacities decreased as the temperature increased [38], indicating that the adsorption process was an endothermic process [39]. Therefore, a temperature of 25 °C was selected for the following experiments. In Figure 2, we observed that the equilibrium adsorption of the XDA-8 resin on the total flavonoids increased rapidly when the concentration was lower than 0.5 mg/mL. When the equilibrium concentration reached 0.5 mg/mL, the equilibrium adsorption was 52.3 mg/g. With further increases in the equilibrium concentration, the equilibrium adsorption did not show any significant further increase. When the equilibrium concentration reached 1.0 mg/mL, the equilibrium adsorption reached 55.7mg/g.

3.3. Purification of Flavonoids Using XDA-8 Resin

3.3.1. Effect of Flow Rate on Adsorption Ratio

As can be seen in Figure 3a, the XDA-8 resin exhibited lower adsorption ratios under accelerated sample flow conditions. Although a slower flow rate resulted in better adsorption, an excessively slow flow rate reduced the adsorption efficiency overall [40]. When the flow rate of the sample solution was ≤1.5 mL/min, the adsorption ratio of the total flavonoids from the Eucommia ulmoides leaves decreased slightly with an increasing flow rate. As the flow rates exceeded 1.5 mL/min, the adsorption kinetics showed marked deterioration (Fig. X). Consequently, a rate of 1.5 mL/min was selected as the optimum operational condition for both adsorption performance and time efficiency.

3.3.2. Effect of Solution pH on Adsorption Ratio

The pH value of the sample solution influences the XDA-8 resin adsorption ratio, and it impacts the affinity between the resin and the solutes [41]. As can be seen in Figure 3b, the adsorption ratio of the sample solution increased at pH values between 4.0 and 5.0, and then it slowly decreased between 5.0 and 6.0, with the highest adsorption ratio observed at a pH of 5.0. Changes in the pH of the solution affected the charge state and ionization degree of the flavonoid molecules, thereby altering the adsorption efficacy of the XDA-8 resin. These results indicate that, in a weakly acidic environment, the flavonoid molecules were more likely to form hydrogen bonding interactions with the resin due to the acidity of their phenolic hydroxyl structures, thereby enhancing the resin’s adsorption capacity. When the pH of the solution is higher than 5.0, the phenolic hydroxyl groups in total flavonoids dissociate to H+, making the flavonoids prone to decomposition and structural changes, which decreases the adsorption ratio [41,42]. Thus, we selected a solution pH of 5.0 for further research.

3.3.3. Effect of Sample Concentration on Adsorption Ratio

The adsorption of the XDA-8 resin was found to depend on the sample concentration, as shown in Figure 3c. It could be observed that the adsorption ratio decreased with increasing sample concentration; thus, they exhibited an inverse relationship. While adsorption decreased gradually below 2.0 mg/mL (remaining at 88.2% at this point), exceeding 3.0 mg/mL triggered premature leakage, resulting in its sharp decline. At low concentrations, the adsorption ratio initially increased with sample concentration through the generation of additional adsorption sites for flavonoid retention. At higher sample concentrations, however, substantial impurity adsorption occurred, along with total flavonoid adsorption. The resulting competition for active sites on the XDA-8 resin lowered its capacity to adsorb flavonoids [43].

3.3.4. Effect of Desorption Solution on Desorption Ratio and Flavonoid Purity

As shown in Figure 3d, the ethanol concentration increased from 40% to 80%, and the desorption ratio on the XDA-8 resin increased at ethanol concentrations between 40% and 70% but decreased at those between 70% and 80%. The total flavonoids adsorbed onto the macroporous resin through hydrogen bonding, and, within a certain range, higher ethanol concentrations led to better elution effects. The decrease in the desorption ratio when the ethanol concentration exceeded 70% was caused by the increased presence of impurities at high ethanol concentrations, which interfered with the effective desorption of flavonoids [44]. The highest desorption ratio, 87.4%, was observed at an ethanol concentration of 70%. However, when the ethanol concentration was 60%, the purity of the total flavonoids peaked at 51.5%, and it decreased with either a decrease or an increase in the ethanol concentration. Different types of macroporous adsorbent resins have been used for the purification of flavonoids. AB-8 was also used for the purification of flavonoids [9], achieving a purity of 42.6%; thus, the purification effect of AB-8 is not as good as that of XDA-8.

3.3.5. Effect of Eluent Flow Rate on Desorption Ratio

As shown in Figure 3e, when the eluent flow rate increased, the desorption ratio of flavonoids on the XDA-8 resin gradually decreased. The desorption ratio remained essentially stable when the eluent flow rate was higher than 1.0 mL/min and lower than 2.0 mL/min. A critical flow rate of 2.0 mL/min was observed, with rapid deterioration in desorption yield at higher velocities. This may be because the eluent exited the column before the total flavonoids were fully eluted. Hence, we selected 2.0 mL/min as the optimal condition, and it was used in subsequent assays.

3.4. Determination of Antioxidant Activities

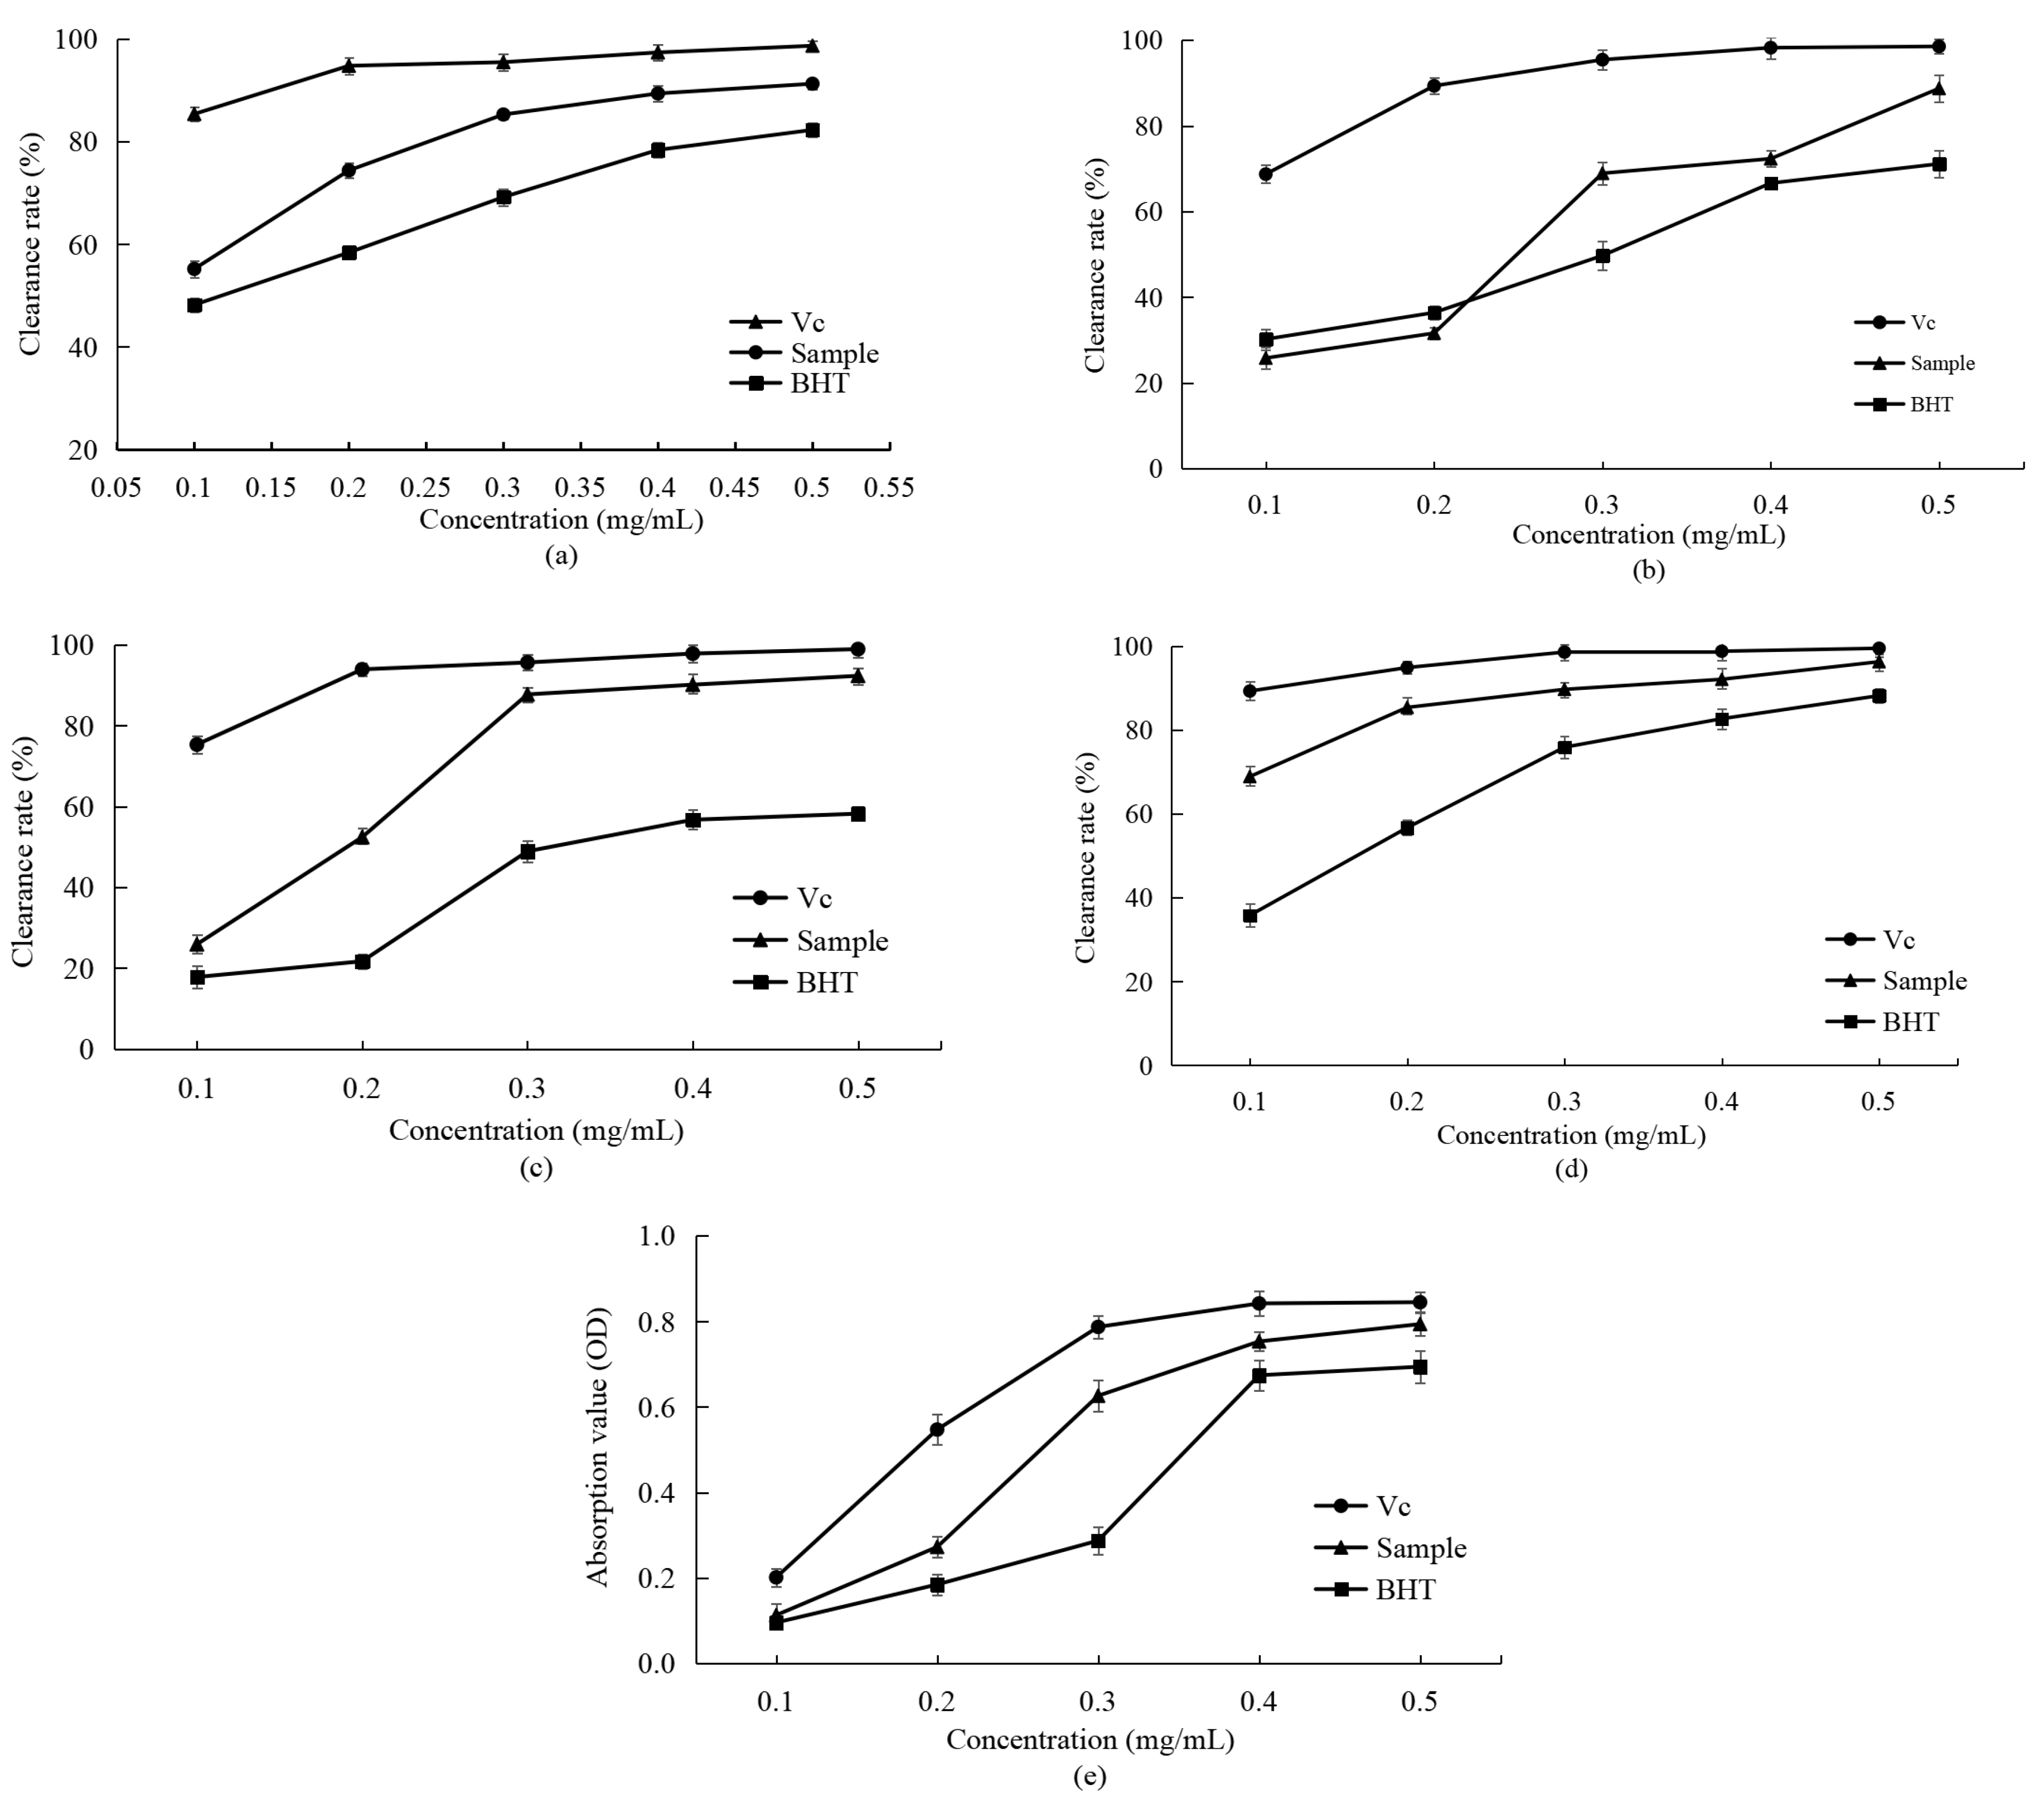
3.4.1. Determination of Scavenging Activity on DPPH Radical

The DPPH free radical is a stable chromogenic compound widely used to determine antioxidant activities [45]. The scavenging effect of the purified total flavonoids from the Eucommia ulmoides leaves on DPPH radicals was determined, with Vc and BHT used as positive controls. The results showed in Figure 4a, the DPPH scavenging ability of the components was ranked as follows: Vc > total flavonoids > BHT. We observed a DPPH radical scavenging rate of 95.5% with vitamin C at 0.3 mg/mL, compared to that of 85.3% with total flavonoids and 69.2% with BHT. Moreover, the DPPH radical scavenging rate increased with an increasing concentration of total flavonoids, indicating that the scavenging effect was concentration-dependent [46]. Total flavonoids contain phenolic hydroxyl groups, and each phenolic hydroxyl group can directly transfer an electron to DPPH radicals [26]; thus, the total flavonoids can effectively scavenge DPPH radicals. Additionally, DPPH radicals are scavenged according to the following reaction equation: -OH + DPPH· → -O· + DPPH-H.

3.4.2. Determination of Scavenging Activity on Hydroxyl Radicals

The scavenging effect of the purified total flavonoids from the Eucommia ulmoides leaves on hydroxyl radicals was determined. As shown in Figure 4b, the antioxidant activity of the total flavonoids and controls increased with an increasing mass concentration when it was higher than 0.1 and lower than 0.5 mg/mL. At a sample mass concentration of 0.3 mg/mL, the total flavonoids exhibited a hydroxyl radical scavenging rate of 68.9%, ranking between Vc (95.4%) and BHT (49.7%). Interestingly, when the sample concentration exceeded 0.3 mg/mL, the scavenging ability of the total flavonoids surpassed that of BHT. Overall, these findings reveal a clear dose–response relationship for the total flavonoids: increasing their mass concentration from 0.1 mg/mL to 0.5 mg/mL led to a substantial increase in the hydroxyl radical scavenging rate from 25.8% to 88.7% [47]. The potent hydroxyl radical scavenging observed in the total flavonoids suggests superior antioxidant functionality compared to synthetic analogs. The flavonoids contain a variety of components, such as chlorogenic acid, rutin, isoquercetin, kaempferol-3-O-rutinoside, quercetin 3-rhamnoside, hyperoside, and quercetin. Additionally, all of these components contain multiple phenolic hydroxyl groups in their structures. The ability of flavonoids to scavenge hydroxyl radicals is directly related to their structure and the number of hydroxyl groups within it: the higher the number of hydroxyl groups in the structure of flavonoids [48], the better their hydroxyl radical scavenging ability.

3.4.3. Determination of Scavenging Activity on Superoxide Radical

As can be seen in Figure 4c, the superoxide radical scavenging rate of Vc increased gradually with increasing concentration, reaching 98.9% at a concentration of 0.50 mg/mL. The superoxide radical scavenging rate of the flavonoids also increased with an increasing sample concentration within the tested range, reaching 87.7% at 0.3 mg/mL. These findings indicate that the total flavonoids have a significant superoxide radical scavenging capacity, consistent with the findings of Xu et al. [49]. The scavenging activity of th flavonoids on the superoxide radical is related to their hydroxyl groups. The total flavonoids can directly scavenge free radicals by providing hydrogen atoms, and the hydroxyl group in the B-ring structure of the total flavonoids is the most important factor in scavenging reactive oxygen species (ROS) [50]. Additionally, superoxide radicals are scavenged according to the following reaction equation: 2O2· + 2H+ = H2O2 + -O2.

3.4.4. Determination of Scavenging Activity on ABTS Radicals

ABTS radical scavenging occurs through the reaction of ABTS with potassium persulfate, producing blue-green ABTS cation radicals that are scavenged when antioxidants are added, allowing for the antioxidant capacity of the samples to be assessed based on this change. Moreover, the scavenging activity on ABTS radicals is widely used to measure the antioxidant activity of biological materials [51]. As shown in Figure 4d, the ABST radical scavenging rates of Vc, total flavonoids, and BHT gradually increased with increasing concentration. At equivalent concentrations, the ABTS radical scavenging capacity decreased in the following order: Vc > total flavonoids > BHT. The hydroxyl groups in the flavonoids provide hydrogen and electron donors to achieve scavenging effects directly on free radicals [26], and the total flavonoids exhibit a strong scavenging effect on ABTS radicals. Additionally, ABTS radicals are scavenged according to the following reaction equation: -OH + ABTS·+ → O· + ABTS + H+.

3.4.5. Determination of Reducing Power

The reducing power of a sample can reflect the antioxidant activity of biological materials. Flavonoids contain polyhydroxy compounds that provide hydrogen atoms and exhibit antioxidant capacity [52]. Additionally, the reducing power of the purified total flavonoids from Eucommia ulmoides leaves was compared with that of Vc and BHT. As shown in Figure 4e, the concentrations of Vc, total flavonoids, and BHT showed good linear relationships with the reducing power when the sample concentrations increased from 0.1 to 0.5 mg/mL. The absorbance values of the total flavonoids remained essentially stable when the concentration exceeded 0.4 mg/mL. The total flavonoids from the Eucommia ulmoides leaves demonstrated antioxidant capacity. Both the hydroxyl and carbonyl structures in total flavonoids can form high-affinity complexes with iron ions to form inert iron complexes [53], which can act as free radical scavengers.

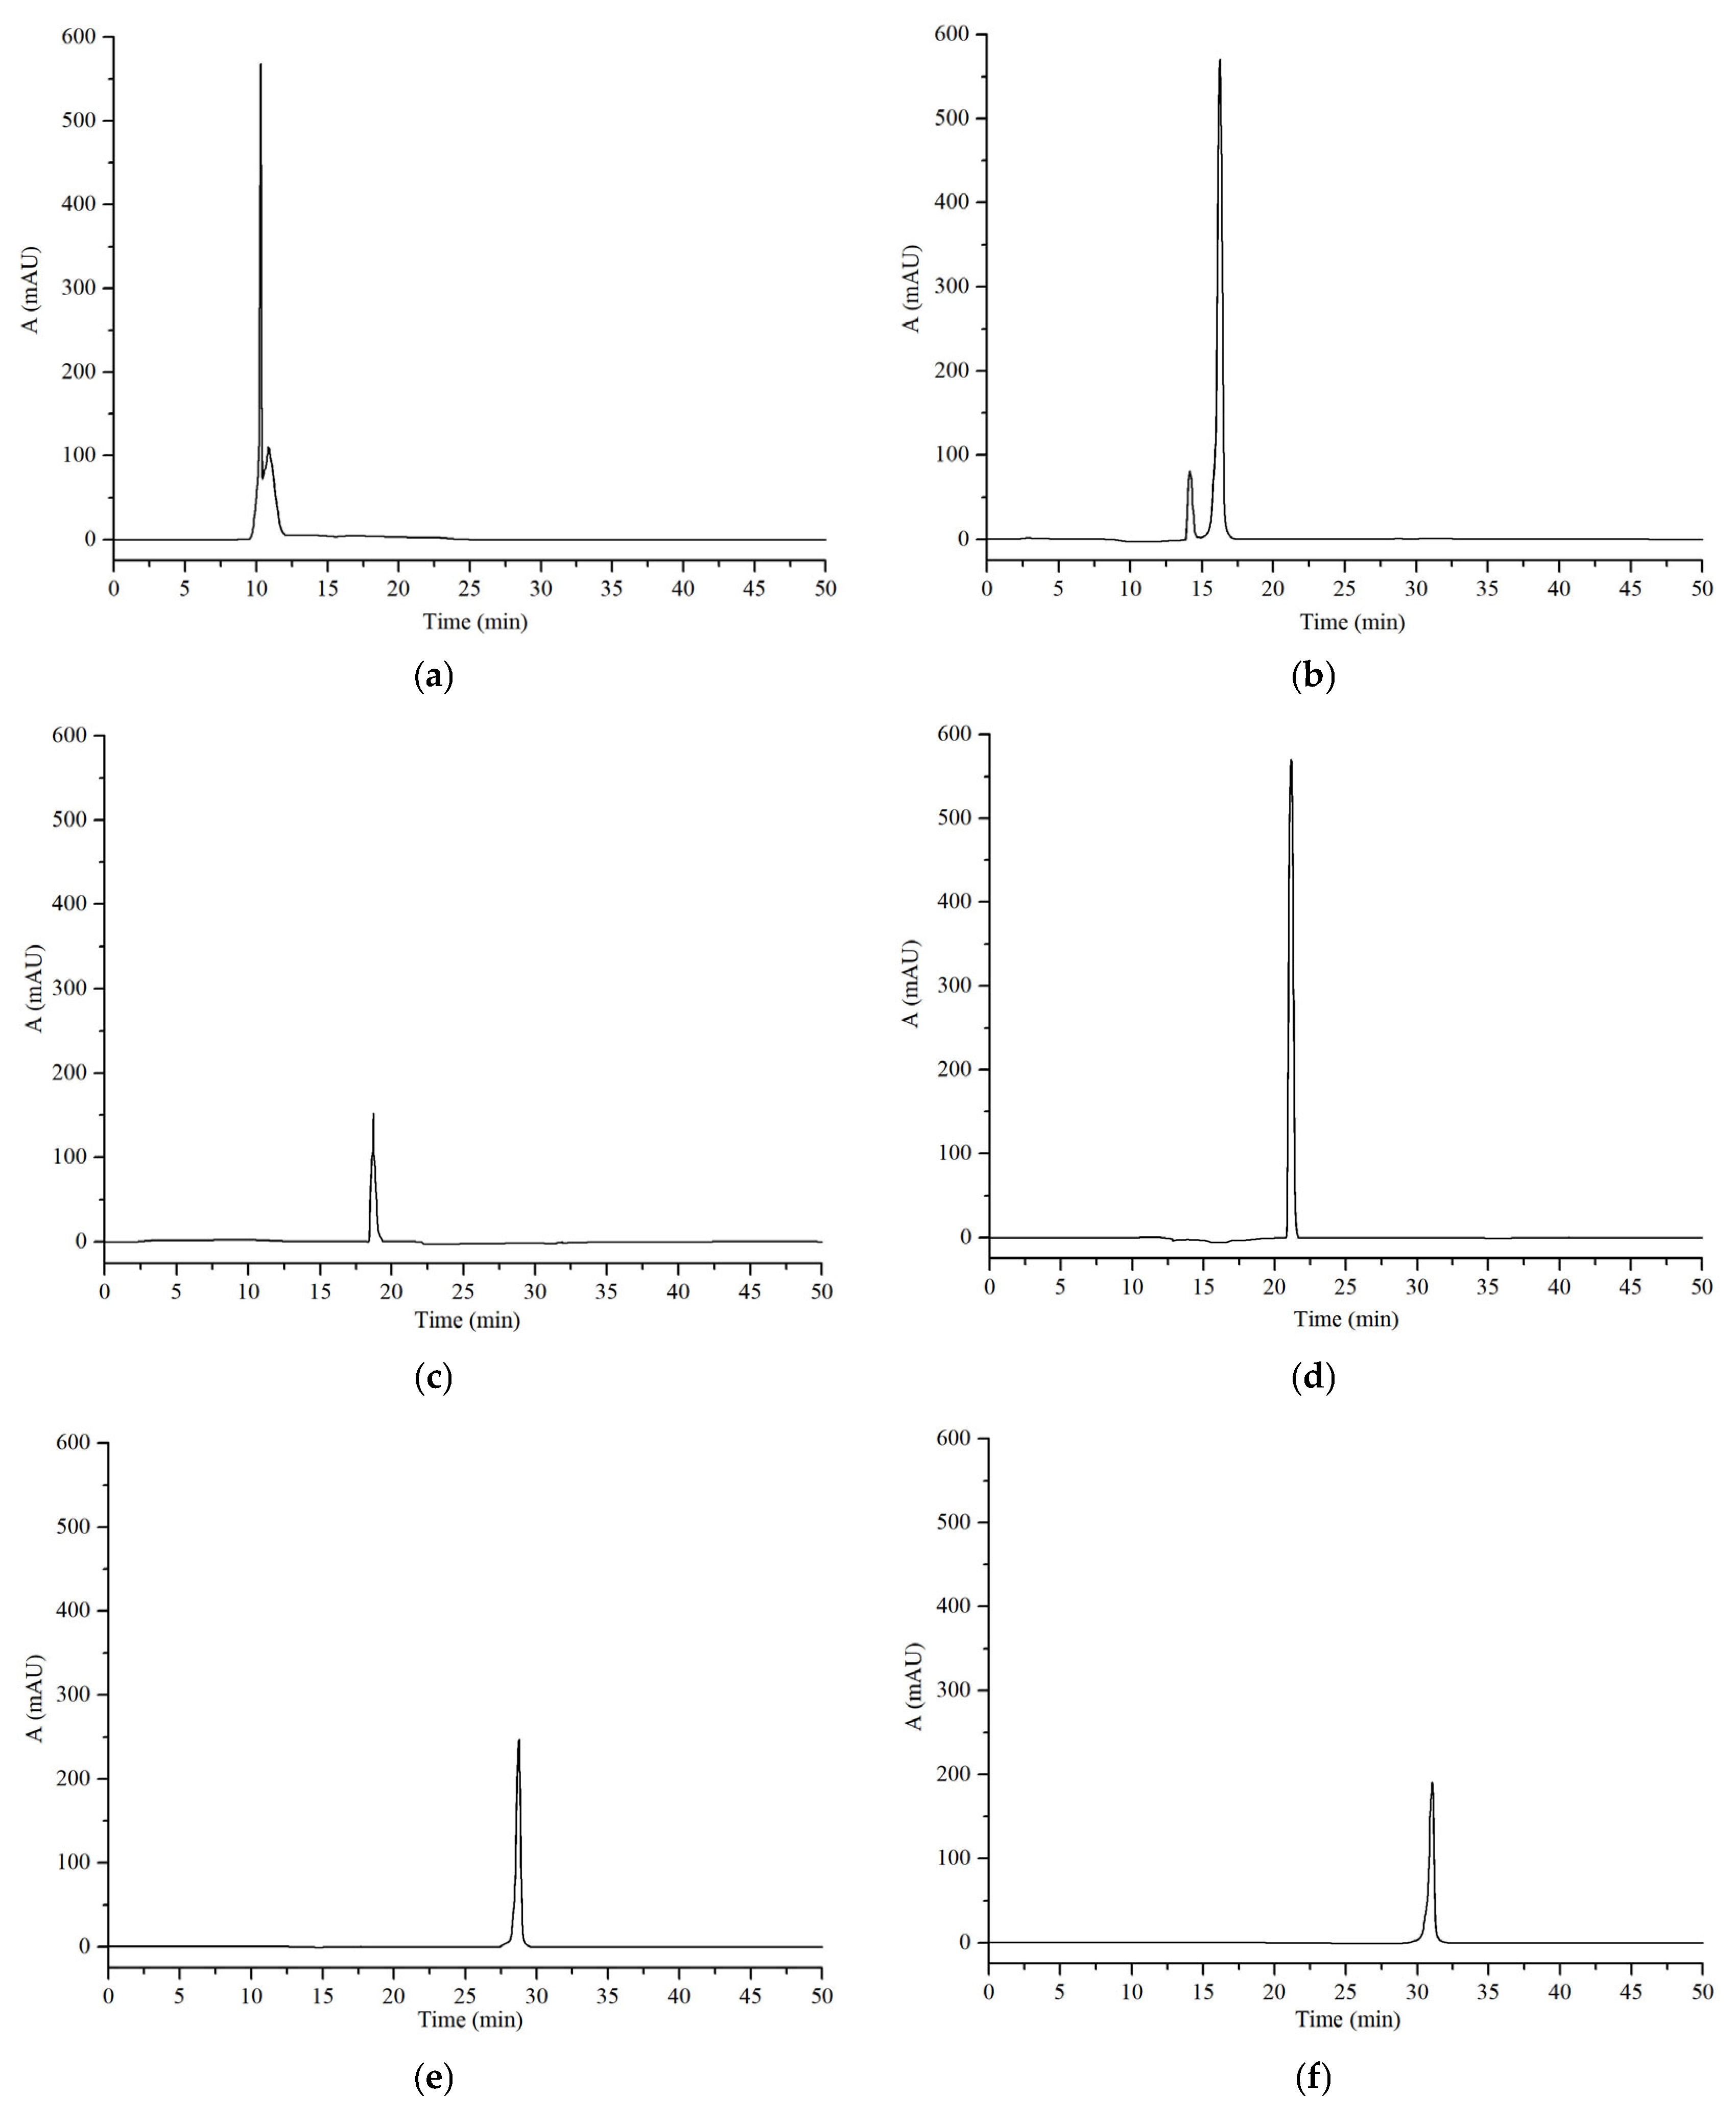
3.5. HPLC Analysis of the Purified Total Flavonoids

As can be seen in Figure 5, the peak times of the chlorogenic acid, rutin, isoquercetin, kaempferol-3-O-rutinoside, quercetin 3-rhamnoside, hyperoside, and quercetin standards were 10.317 min, 16.315 min, 18.687 min, 21.162 min, 28.769 min, 31.060 min, and 38.912 min, respectively. We isolated seven known compounds from the samples using HPLC, and peak 4 was chlorogenic acid, peak 7 was rutin, peak 8 was isoquercetin, peak 9 was kaempferol-3-O-rutinoside, peak 12 was quercetin 3-rhamnoside, peak 13 was hyperoside, and peak 14 was quercetin. Meanwhile, some of the compounds were not identified. Therefore, in further studies, we aim to clarify the components of the total flavonoids using liquid chromatography–mass spectrometry (LC-MS) and liquid secondary mass spectrometry (LC-MS-MS).
In Table 4, it can be seen that the standard curve at a certain concentration had a good linear relation, and the major compounds in the purified total flavonoids of Eucommia ulmoides leaves were 269.536 mg/g extract of chlorogenic acid, 25.217 mg/g extract of rutin, 67.023 mg/g extract of isoquercetin, 38.988 mg/g extract of kaempferol-3-O-rutinoside, 19.659 mg/g extract of quercetin 3-rhamnoside, 5.609 mg/g extract of hyperoside, and 12.338 mg/g extract of quercetin. Therefore, the influencing factors should be fully considered when Eucommia ulmoides leaves and their extracts are applied in the food and pharmaceutical industries.

4. Conclusions

In this study, we employed ultrasonic-assisted extraction to obtain total flavonoids from Eucommia ulmoides leaves, followed by purification using XDA-8 macroporous adsorbent resin. This established a green and economical method for extracting and purifying these flavonoids. A purity of 51.5% was achieved for the flavonoids. The predominant components of the flavonoids from Eucommia ulmoides leaves were identified as chlorogenic acid, rutin, isoquercetin, kaempferol-3-O-rutinoside, quercetin 3-rhamnoside, hyperoside, and quercetin, all of which exhibit significant antioxidant activity, making them promising natural antioxidant sources.
The ultrasonic-assisted extraction and XDA-8 resin purification of total flavonoids from Eucommia ulmoides leaves offer advantages such as mild conditions, simple operation, and high efficiency. The total flavonoids obtained demonstrated promising antioxidant activity. Subsequent research can explore the feasibility of scaling up this extraction and purification process. Not only do the proposed ultrasonic-assisted extraction and XDA-8 resin purification of total flavonoids from Eucommia ulmoides leaves provide theoretical support for the study of green and efficient extraction and purification methods, but they also demonstrate the potential application value of Eucommia ulmoides leaves in the medicine and food fields. Furthermore, they will be further investigated in the future to promote the production and application of Eucommia ulmoides leaves in the medicine and health fields.

Author Contributions

J.L.: conceptualization, methodology, validation, writing—original draft, funding acquisition, and data curation; L.T.: software, formal analysis, and methodology; J.W.: writing—review and editing, supervision, project administration. All authors have read and agreed to the published version of the manuscript.

Funding

This publication was supported by the National (China) Old Medicine Worker Inheritance Workshop project (grant number (2024)255).

Informed Consent Statement

Not applicable.

Data Availability Statement

All of the data here discussed and presented are available in the relative references here cited and listed.

Acknowledgments

The authors are grateful for the support of National (China) Old Medicine Worker Inheritance Workshop.

Conflicts of Interest

Authors Jia Li and Lingling Tang are employed by Anhui Chengqingtang National Pharmaceutical Co., Ltd. The remaining authors declare that the research was conducted in the absence of any commercial or financial relationships that could be construed as a potential conflict of interest.

References

  1. Su, J.J.; Huang, L.Q.; Li, C.Y.; Zhou, X.Q.; He, J. Study on isolation and purification of Eucommia ulmoides leaves flavonoids by two-column method. Appl. Chem. Ind. 2023, 52, 2972–2975+2980. [Google Scholar] [CrossRef]
  2. Huang, D.; Zhu, J.; Zhang, L.; Ge, X.; Ren, M.; Liang, H. Dietary supplementation with Eucommia ulmoides leaf extract improved the intestinal antioxidant capacity, immune response, and disease resistance against Streptococcus agalactiae in genetically im-proved farmed Tilapia (GIFT; Oreochromis niloticus). Antioxidants 2022, 9, 1800. [Google Scholar] [CrossRef] [PubMed]
  3. Leea, G.H.; Leea, H.Y.; Choia, M.K.; Choib, A.H.; Shinb, T.S.; Chae, H.J. Eucommia ulmoides leaf (EUL) extract enhances NO production in ox-LDL-treated human endothelial cells. Biomed. Pharmacother. 2018, 97, 1164–1172. [Google Scholar] [CrossRef] [PubMed]
  4. Bao, L.; Sun, Y.L.; Wang, J.M.; Li, W.B.; Liu, J.; Li, T.Y.; Liu, Z.Q. A review of “plant gold” Eucommia ulmoides Oliv.: A medici-nal and food homologous plant with economic value and prospect. Heliyon 2023, 10, e24851. [Google Scholar] [CrossRef]
  5. Zhang, F.; Xie, Y.F.; Wang, Z.; Zhuang, W.B.; Wang, T.; Li, N.W. Comparative study on the spatiotemporal variation of four chemical components in different Eucommia ulmoides cultivars. Microchem. J. 2025, 208, 112583. [Google Scholar] [CrossRef]
  6. Ma, L.; Meng, N.; Liu, B.; Wang, C.; Chai, X.; Huang, S.; Yu, H.; Wang, Y. Quantitative analysis and stability study on iridoid glyco-sides from seed meal of Eucommia ulmoides oliver. Molecules 2022, 27, 5924. [Google Scholar] [CrossRef]
  7. Tang, F.R.; Zhang, Z.L.; Zuo, Y.M.; Chen, L.Y.; Luo, J.; Liu, R.H.; Li, Y.Y. Chemical Components of Flavonoids of Eucommiae Folium. Chin. J. Exp. Tradit. Med. Formulae 2014, 5, 90–92. [Google Scholar]
  8. Li, J. Research Progress in the Extraction Methods and Bioactivity of Flavonoids from Eucommia ulmoides leaves. Sci. Technol. Food Ind. 2019, 7, 346–350. [Google Scholar] [CrossRef]
  9. Fu, G.M.; Luo, Y.F.; Zhang, Y.N.; Wan, Y.; Chai, J.X.; Chen, Y.H.; Wu, X.F.; Chen, J.F. Using Macroporous Resin for Enriching and Purifying Total Flavonoids from the Crude Extract of Eucommia ulmoides Oliv. Leaves Food Sci. 2010, 14, 67–70. [Google Scholar]
  10. Yuan, F.J.; Sun, Y.H.; Hamulati, H.; Wang, X.T.; He, J.H.; Mao, Y. Effects of the Different Elutions of Hyssopus cuspidatus on Smooth Muscle Contraction of Isolated Tracheal in Guinea Pigs. China Pharm. 2017, 13, 1787–1790. [Google Scholar]
  11. Pham, N.T.M.; Nguyen, T.T.; Nguyen, D.K.; Vo, N.M.; Nguyen, M.T.T.; Ngo, L.H.T.; Tran, L.C. Optimization of the extraction protocol to uptake the flavonoid content from jamaican cherry (Muntingia calabura L.) leaves extract as a source for an antifun-gal bioproduct development. Biocatal. Agric. Biotechnol. 2025, 64, 103520. [Google Scholar] [CrossRef]
  12. Li, Y.M.; Zhang, Q.; Fang, Q.; Zhu, H.; Zong, X.L.; Gao, X.; Shi, Y.; Qin, K.M. A novel ultrasound-assisted enzyme extraction method of total flavonoids from Viticis Fructus and processed Viticis Fructus: Comparison of in vitro antioxidant activity. Ultrason. Sonochem. 2024, 110, 107045. [Google Scholar] [CrossRef]
  13. Yang, W.; Huang, G. Extraction methods and activities of natural glucans. Trends Food Sci. Technol. 2021, 112, 50–57. [Google Scholar] [CrossRef]
  14. Peng, Z.J.; Wang, Y.C.; Li, W.F.; Zhan, B.J.F.; Zhu, L.P.; Yang, D.P.; Li, G.; Zhang, L.X.; Zhao, Z.M. Ultrasonic-assisted extraction of flavonoids from Amomum villosum Lour. Using natural deep eutectic solvent: Process optimization, comparison, identification, and bioactivity. Ultrason. Sonochem. 2025, 116, 107304. [Google Scholar] [CrossRef]
  15. Shen, L.; Pang, S.; Zhong, M.; Sun, Y.; Qayum, A.; Liu, Y.; Rashid, A.; Xu, B.; Liang, Q.; Ma, H.; et al. A comprehensive review of ultrasonic assisted extraction (UAE) for bioactive components: Principles, advantages, equipment, and combined technologies. Ultrason. Sonochem. 2023, 101, 106646. [Google Scholar] [CrossRef]
  16. Jiang, D.Z.; Yu, D.P.; Zeng, M.; Liu, W.B.; Li, D.L.; Liu, K.Y. Optimization of ultrasonic-assisted extraction of total flavonoids from Oxalis corniculata by a hybrid response surface methodology-artificial neural network-genetic algorithm (RSM-ANN-GA) approach, coupled with an assessment of antioxidant activities. RSC Adv. 2024, 14, 39069–39080. [Google Scholar] [CrossRef] [PubMed]
  17. Luo, J.W.; Yang, Z.M.; Huang, X.H.; Cai, J.Y.; Zhong, H.Y. Efficient and green ultrasonic-assisted extraction of flavonoids from Sophorae Tonkinensis Radix Et Rhizoma using deep eutectic solvent: Optimization and extraction mechanism. Ind. Crops Prod. 2025, 226, 120738. [Google Scholar] [CrossRef]
  18. Pinela, J.; Prieto, M.A.; Pereira, E.; Jabeur, I.; Barreiro, M.F.; Barros, L.; Ferreira, I.C.F.R. Optimization of heat and ultra-sound-assisted extraction of anthocyanins from Hibiscus sabdariffa calyces for natural food colorants. Food Chem. 2019, 275, 309–321. [Google Scholar] [CrossRef]
  19. Cheng, Y.; Zhao, H.; Cui, L.; Hussain, H.; Nadolnik, L.; Zhang, Z.; Zhao, Y.; Qin, X.; Li, J.; Park, J.H.; et al. Ultrasonic-assisted extraction of flavonoids from peanut leave and stem using deep eutectic solvents and its molecular mechanism. Food Chem. 2024, 434, 137497. [Google Scholar] [CrossRef]
  20. Wang, T.T.; Liu, X.R.; Jia, J.; Zhang, L.L. Optimization of extraction process of total flavonoids from Eucommia ulmoides leaves by ultrasonic-assisted enzymatic method. Feed Res. 2022, 17, 69–74. [Google Scholar] [CrossRef]
  21. Kobus, Z.; Pecyna, A.; Buczaj, A.; Krzywicka, M.; Przywara, A.; Nadulski, R. Optimization of the Ultrasound-Assisted Extraction of Bioactive Compounds from Cannabis sativa L. Leaves and Inflorescences Using Response Surface Methodology. Appl. Sci. 2022, 12, 6747. [Google Scholar] [CrossRef]
  22. Agarwal, C.; Máthé, K.; Hofmann, T.; Csóka, L. Ultrasound-Assisted Extraction of Cannabinoids from Cannabis sativa L. Opti-mized by Response Surface Methodology. J. Food Sci. 2018, 83, 700–710. [Google Scholar] [CrossRef]
  23. Deng, Y.L.; Tang, S.; Wang, M.C.; Yang, P.P. Semi Bionic Extraction and Ultrasonic-Assisted Semi Bionic Extraction of Flavonoids from Eucommia ulmoides. J. Jishou Univ. (Nat. Sci. Ed.) 2017, 38, 66–70. [Google Scholar]
  24. Hao, J.; Wang, Z.; Jia, Y.; Sun, L.; Fu, Z.; Zhao, M.; Li, Y.; Yuan, N.; Cong, B.; Zhao, L.; et al. Optimization of ultrasonic-assisted extraction of flavonoids from Lactuca indica L. cv. Mengzao and their antioxidant properties. Front. Nutr. 2023, 10, 1065662. [Google Scholar] [CrossRef] [PubMed]
  25. Nguyen Tram Anh, M.; Van Hung, P.; Thi Lan Phi, N. Optimized Conditions for Flavonoid Extraction from Pomelo Peel By-products under Enzyme- And Ultrasound-Assisted Extraction Using Response Surface Methodology. J. Food Qual. 2021, 1, 6666381. [Google Scholar] [CrossRef]
  26. Xu, X.M.; Zhang, D.D.; Liu, X.H.; Zheng, R.; Jiang, T.Q. Ultrasonic-Assisted Extraction and Antioxidant Evaluation of Resveratrol from Peanut Sprouts. Processes 2024, 12, 2295. [Google Scholar] [CrossRef]
  27. Xu, L.Y.; Zhao, Y.; Wang, Y.; Guo, R.X.; Wang, P.; Zhang, L.; Zhang, H.; Zhai, Y.X.; Liu, Y.N. Optimization of Ultra-sound-Assisted Extraction of Roselle Flavonoids by Deep Eutectic Solvent and Its Antioxidant Activity. Sci. Technol. Food Ind. 2024, 12, 1–19. [Google Scholar] [CrossRef]
  28. Irshad, M.; Zafaryab, M.; Singh, M.; Rizvi, M.M. Comparative Analysis of the Antioxidant Activity of Cassia fistula Extracts. Int. J. Med. Chem. 2012, 9, 157125. [Google Scholar] [CrossRef]
  29. Wang, Y.N.; Huang, S.; Yin, Y.Y.; Wei, H.L.; Tao, J. Extraction and study on antioxidant activity analysis of total flavonoids from hawthorn leaf health food. J. Food Saf. Qual. 2024, 15, 89–98. [Google Scholar] [CrossRef]
  30. Jiang, L.C.; Zhang, Y.J.; Jiang, D.Y.; Fu, D.Y.; Zhao, X.Y. Response surface optimization of ultrasonic-microwave synergistic extraction of flavonoids from Actinidia arguta stems and analysis of antioxidant activity. J. Sichuan Univ. (Nat. Sci. Ed.) 2024, 61, 1–9. [Google Scholar] [CrossRef]
  31. Xing, Y.H.; Yang, C.H.; Huang, Z.Z.; Peng, X.J. Establishment of HPLC characteristic map of fructus choerospondiatis and de-termination of four flavonoid components. Hubei Agric. Sci. 2025, 64, 144–155. [Google Scholar] [CrossRef]
  32. Yang, H.T.; Liu, J.H. Study on optimizing extraction technology of total flavonoids in Eucommia ulmoides olive leaves through orthogonal regression design. Sci. Technol. Food Ind. 2009, 30, 248–250. [Google Scholar] [CrossRef]
  33. Vongsak, B.; Sithisarn, P.; Mangmool, S.; Thongpraditchote, S.; Wongkrajang, Y.; Gritsanapan, W. Maximizing Total Phenolics, Total Flavonoids Contents and Antioxidant Activity of Moringa oleifera Leaf Extract by the Appropriate Extraction Method. Ind. Crop. Prod. 2013, 44, 566–571. [Google Scholar] [CrossRef]
  34. Yang, F.Y.; Wan, L.; Chen, J.Y.; Shao, J.L.; Lan, S.S. Optimization of ultrasonic assisted ethanol extraction for total flavonoids from buckwheat hust. Food Mach. 2015, 31, 234–238. [Google Scholar] [CrossRef]
  35. Hou, X.L.; Wang, J. Optimization of Extraction Process of Flavonoids from Citrus Peel by the Response Surface Method and its Antioxidant Activity. Farm Prod. Process. 2024, 24, 47–51. [Google Scholar] [CrossRef]
  36. Song, M.L.; Tao, J.Y.; Yang, J.; Hu, T.J. Study on Separation and Purification of Total Flavonoids from Polygonum hydropiper Linn. by Macroporous Resin. Chin. J. Inf. TCM 2018, 25, 74–78. [Google Scholar] [CrossRef]
  37. Yan, H.J.; Han, Y.B. Study on Bioactivity Mechanism of Total Flavonoids and Total Polyphenols in Apple Cider Vinegar. China Condiment 2022, 47, 77–80. [Google Scholar] [CrossRef]
  38. Weng, Y.Y.; Wu, C.Y.; Xu, Y. Optimization of Decompressing Extraction Process and Purification by Macroporous Resin of Total Flavonoids from Kapok Bark and antioxidant activity of the Extract. Shanxi Chem. Ind. 2025, 231, 1–5. [Google Scholar] [CrossRef]
  39. Ma, T.T.; Sun, X.Y.; Tian, C.R.; Luo, J.Y.; Zheng, C.P.; Zhan, J.C. Enrichment and purification of polyphenol extract from Sphallerocarus gracilis stems and leaves and in vitro evaluation of DNA Damage-Protective activity and inhibitory effects of α-amylase and α-glucosidase. Molecules 2015, 20, 21442–21457. [Google Scholar] [CrossRef]
  40. Ferraro, V.; Cruz, I.B.; Jorge, R.F.; Pintaclo, M.E.; Castro, M.E. Effects of physical parameters onto adsorption of the borderline amino acids glycine, lysine, taurine, and tryptophan upon amberlite XAD16 resin. J. Chem. Eng. Data 2013, 58, 707–717. [Google Scholar] [CrossRef]
  41. Chen, Y.L.; Chen, S.X.; Zhu, J.; Li, B.H.; Li, R.C.; Hou, H.L.; Liu, K.H.; Li, J.F. Extraction, Purification Technology of Flavonoids from Chestnut Flowers and Comparison of Antioxidant Activity Before and After Purification. Food Sci. Technol. 2025, 50, 207–216. [Google Scholar] [CrossRef]
  42. Wang, P.F.; Sheng, Z.L.; Han, Q.; Zhao, Y.L.; Cheng, G.D.; Li, Y.H. Enrichment and purification of total flavonoids from Flos Populi extracts with macroporous resins and evaluation of antioxidant activities in vitro. J. Chromatogr. B 2014, 945, 68–74. [Google Scholar] [CrossRef]
  43. Xi, L.H.; Mu, T.H.; Sun, H.N. Preparative purification of polyphenols from sweet potato (Iponoea batatas L.) leaves by AB-8 macroporous resins. Food Chem. 2015, 172, 166–174. [Google Scholar] [CrossRef]
  44. Feng, C.W.; Kang, S.H.; Lu, L.N.; Li, J.; Yang, X.J.; Zhang, L.B. Purification of Total Flavonoids from Eucalyptus smith Leaf with Macroporous Resin and Analysis of Its Antioxidant and Nitrosation Inhibitory Activities. Sci. Technol. Food Ind. 2025, 4, 1–11. [Google Scholar] [CrossRef]
  45. Yan, J.W.; Zeng, H.; Chen, W.J.; Zheng, S.; Luo, J.L.; Jiang, H.F.; Yang, B.R.; Farag, M.A.; Lou, H.Q.; Song, L.L.; et al. Effects of tree age on flavonoids and antioxidant activity in Torreya grandis nuts via integrated metabolome and transcriptome analyses. Food Front. 2023, 4, 358–367. [Google Scholar] [CrossRef]
  46. Akbar, A.; Soekamto, N.H.; Firdaus; Bahrun. Total Phenolics and Flavonoids Level of n-Hexane, Ethyl Acetate and Methanol Extracts of Sargassum sp. along with Their Antioxidant Activity by DPPH Method. AIP Conf. Proc. 2022, 2638, 060009. [Google Scholar] [CrossRef]
  47. Li, N.; Wu, X.; Yin, Q.; Dong, Z.; Zheng, L.; Qian, Y.; Sun, Y.; Chen, Z.; Zhai, K. Extraction, Identification, and Antioxidant Activity of Flavonoids from Hylotelephium spectabile (Boreau) H. Ohba. Foods 2024, 13, 2652. [Google Scholar] [CrossRef]
  48. Tao, Y.P.; Zhang, H.W.; Wang, Y. Revealing and predicting the relationship between the molecular structure and antioxidant activity of flavonoids. LWT 2023, 174, 114433. [Google Scholar] [CrossRef]
  49. Xu, X.L.; Dai, G.Q.; Wei, H.F.; Yu, J. Optimization of Aqueous Two-phase Extraction Technology of Total Flavonoids from Lonicera japonica Thunb. Leaves and Its Antioxidant Activity. Sci. Technol. Food Ind. 2023, 44, 242–248. [Google Scholar] [CrossRef]
  50. Yoshimi, S.; Risako, N.; Naru, K. Resveratrol analogues like piceatannol are potent antioxidants as quantitatively demonstrated through the high scavenging ability against reactive oxygen species and methyl radical. Bioorg. Med. Chem. Lett. 2017, 23, 5203–5206. [Google Scholar] [CrossRef]
  51. Ilyasov, I.R.; Beloborodov, V.L.; Selivanova, I.A.; Terekhov, R.P. ABTS/PP Decolorization Assay of Antioxidant Capacity Reaction Pathways. Int. J. Mol. Sci. 2020, 21, 1131. [Google Scholar] [CrossRef] [PubMed]
  52. Chen, X.; Liu, C.; Deng, J.; Xia, T.; Zhang, X.; Xue, S.; Song, M.K.; Olatunji, O.J. Schisandrin B ameliorates adjuvant-induced arthritis in rats via modulation of inflammatory mediators, oxidative stress, and HIF-1α/VEGF pathway. J. Pharm. Pharmacol. 2024, 76, 681–690. [Google Scholar] [CrossRef] [PubMed]
  53. Kejík, Z.; Kaplánek, R.; Masařík, M.; Babula, P.; Matkowski, A.; Filipenský, P.; Veselá, K.; Gburek, J.; Sýkora, D.; Martásek, P.; et al. Iron complexes of flavonoids-antioxidant capacity and beyond. Int. J. Mol. Sci. 2021, 22, 646. [Google Scholar] [CrossRef] [PubMed]
Figure 1. (a) Adsorption ratio curve of XDA-8 resin over 12 h; (b) desorption ratio curve of XDA-8 resin over 12 h.
Processes 13 01905 g001
Figure 2. Adsorption isotherm curve of XDA-8 resin for total flavonoids.
Processes 13 01905 g002
Figure 3. Purification process of flavonoids using XDA-8 resin. Note: (a) The effect of flow rate on adsorption ratio; (b) the effect of pH on adsorption ratio; (c) the effect of sample concentration on adsorption ratio; (d) the effect of desorption solution on desorption ratio and flavonoid purity; (e) the effect of eluent flow rate on desorption ratio.
Processes 13 01905 g003aProcesses 13 01905 g003b
Figure 4. Antioxidant activity of the purified total flavonoids. Note: (a) DPPH scavenging activity; (b) hydroxyl radical scavenging activity; (c) superoxide radical scavenging activity; (d) ABTS scavenging activity; (e) reducing power of purified total flavonoids.
Processes 13 01905 g004
Figure 5. HPLC chromatograms: (a) chlorogenic acid standard; (b) rutin standard; (c) isoquercetin standard; (d) kaempferol-3-O-rutinoside standard; (e) quercetin 3-rhamnoside standard; (f) hyperoside standard; (g) quercetin standard; (h) HPLC chromatogram of the sample.
Processes 13 01905 g005aProcesses 13 01905 g005b
Table 1. Results of orthogonal experiments.
RunA/Ethanol ConcentrationB/Ultrasonic PowerC/Solid-to-Liquid RatioD/Ultrasonic TimeResponse (mg/g Plant Material)
11 (50%)1 (200 W)1 (1:25 g/mL)1 (20 min)152.4151.3151.9
212 (250 W)2 (1:30 g/mL)2 (25 min)161.5162.3163.4
313 (300 W)3 (1:35 g/mL)3 (30 min)123.5123.5124.1
42 (60%)123159.8159.9159.1
52231166.3165.7166.8
62312126.5128.1126.7
73 (70%)132 163.3163.3162.9
83213163.6163.2162.9
93321127.5126.9127.9
K1438.0 474.6 442.2 445.6
K2453.0 491.9 449.4 452.7
K3453.8 378.2 453.1 446.5
k1146.0 158.2 147.4 148.5
k2151.0 164.0 149.8 150.9
k3151.3 126.1 151.0 148.8
R5.3 37.9 3.6 2.4
K1–K3 are the summed responses per level; k1–k3 are the averaged responses per level; and R is the extreme variance. All test operations were carried out in three replicates.
Table 2. ANOVA results.
Source of VariationSum of Squares (SS)DFMean Square (MS)FSignificance
(p)
A159.167279.584237.432p < 0.001**
B7503.73623751.86811,193.419p < 0.001**
C61.850230.92592.262p < 0.001**
D29.654214.82744.235p < 0.001**
Error E6.033180.335
** indicates a highly significant difference (p < 0.01).
Table 3. Selection of different resins.
Resin NameMass Concentration Before Adsorption (mg/mL)Mass Concentration After Adsorption (mg/mL)Mass Concentration After Desorption (mg/mL)Adsorption Ratio (%)Desorption Ratio (%)
LX-383.00.81.673.3 ± 1.5 d 72.7 ± 2.5 c
LX-603.01.01.466.7 ± 2.9 e70.0 ± 2.6 c
LS-463.00.71.676.7 ± 1.3 c 69.6 ± 1.2 d
LS-3063.00.91.770.0 ± 3.2 e 81.0 ± 2.1 b
XDA-83.00.42.386.7 ± 1.2 a88.5 ± 1.3 a
AB-83.00.91.870.0 ± 2.1 b 85.7 ± 1.5 b
D1013.00.801.5 73.3 ± 1.7 d 68.2 ± 2.2 d
The different letters (a, b, c, d, e) in each of the columns indicate that the values are significantly different (p < 0.05). All test operations were carried out in three replicates.
Table 4. Contents of different components in sample.
CompoundChlorogenic AcidRutinIsoquercetinKaempferol-3-O-RutinosideQuercetin 3-RhamnosideHyperosideQuercetin
Regression equationY = 36,380X + 8317.5Y = 85,221X − 118,356Y = 75,336X −
63,523
Y = 86,233X −
58,116
Y = 652,523X −
18,697
Y = 6256.8X + 1698.5Y = 7989.6X − 1 213.3
Correlation coefficientR2 = 0.9995R2 = 0.9993R2 = 0.9995R2 = 0.9998R2 = 0.9996R2 = 0.9999R2 = 0.9992
Content (mg/g extract)269.536 ± 0.06925.217 ± 0.03567.023 ± 0.087 38.988 ± 0.05619.659 ± 0.033 5.609 ± 0.02612.338 ± 0.031
Disclaimer/Publisher’s Note: The statements, opinions and data contained in all publications are solely those of the individual author(s) and contributor(s) and not of MDPI and/or the editor(s). MDPI and/or the editor(s) disclaim responsibility for any injury to people or property resulting from any ideas, methods, instructions or products referred to in the content.

