1. Introduction
Reducing food waste has become a key priority for companies worldwide. Grapefruit (
Citrus paradisi), a member of the Rutaceae family, is a widely cultivated and consumed fruit. It accounts for 7% of global citrus production. According to data from the Food and Agriculture Organization of the United Nations (FAO), global production of grapefruit (
Citrus paradisi), combined with Asian grapefruit (Citrus maxima), reached 9.93 million tons in 2023. China led the way with 52% of total production, followed by Vietnam [
1,
2]. In industrial citrus processing processes, approximately 40% to 60% of the fruit’s fresh weight becomes waste, mainly peel, pulp, and seeds. Specifically, in the case of grapefruit, the peel represents approximately 36% to 40% of its fresh weight [
3]. This significant volume of waste represents an opportunity for valorization, for example, through the extraction of pectin, essential oils, or other bioactive compounds, thus contributing to the sustainability and reducing the environmental impact of the citrus industry [
3,
4].
The pectin market is experiencing robust growth driven by several key factors [
5]. First, there is an increasing demand for natural ingredients in the food and beverage industry, driving manufacturers to use pectin for its versatile functions as a gelling agent, stabilizer, and thickener, particularly in products such as jams, jellies, dairy products, and fruit-based drinks. At the same time, growing consumer health awareness is driving the adoption of pectin, which is derived from fruits such as citrus peel and apple pomace, as a natural and healthy ingredient. This is in line with the clean label trend. In addition, the pharmaceutical sector is increasingly using pectin in oral dosage forms such as tablets and capsules, taking advantage of its binding properties for controlled-release medications. Technological advances in extraction methods are improving the efficiency and yield of pectin production, making it more economically viable for manufacturers.
Currently, several strategies are available for extracting pectin. The most common method, regardless of the raw material used, involves acid extraction at temperatures below 100 °C, typically employing organic acids. The physicochemical properties of the extracted pectin are significantly influenced by the process conditions. Previous studies have identified temperature, extraction time, pH, solvent-to-solid ratio (S:S), and the type of acid used as the most critical factors affecting the yield and the chemical and functional properties of pectin [
6].
Establishing the relationship between raw material characteristics, process parameters, and final product attributes is essential for optimizing extraction. In this context, studying the process dynamics through kinetic modeling provides a solid conceptual foundation for understanding fundamental phenomena such as analyte–matrix interactions, reaction rates (including diffusion and desorption), and phase equilibrium.
Kinetic modeling has been extensively explored due to its potential to predict process performance and the bioactivity of the extracted pectin. In particular, both empirical models fitted to experimental data and mechanistic models (based on mass transfer mechanism) have been proposed to describe the extraction process.
Mechanistic models typically consider the hydrolysis of protopectin into pectin, followed by internal and external diffusion, as well as possible thermal or acid-induced degradation [
2]. For example, Sebaoui et al. [
7] applied the model proposed by Panchev et al. [
8] to simultaneously describe pectin extraction and degradation from lemon peels, assuming both phenomena occur in parallel. Raji and Kiani [
9], meanwhile, fitted experimental data on pectin extraction from melon peels using ultrasound and conventional heating to six empirical models: parabolic diffusion, power law, Weibull, Elovich, unsteady diffusion, and Peleg.
In another study, Liew et al. [
10] investigated the extraction of low-methoxyl pectin from grapefruit peels using subcritical water. They analyzed the kinetics using one-site and two-site desorption models, originally proposed by Kubátová and Hawthorne, respectively. Both models describe extraction as a process governed by intraparticle diffusion. Similarly, Misra et al. [
11] applied the Peleg model to describe the kinetics of pectin extraction from black carrot pulp using intermittent microwave, ultrasound, and conventional heating, due to the resemblance of the extraction curves to typical sorption curves.
Empirical models such as the Peleg model [
12] are developed by fitting mathematical equations directly to experimental data, without necessarily incorporating detailed representations of the physicochemical mechanisms involved. Although these models can yield strong statistical fits (e.g., high R
2 values, low root mean square error), their parameters do not represent physically meaningful quantities such as diffusion coefficients, equilibrium constants, or reaction rate constants.
Specifically, the Peleg model widely used in the literature to describe both absorption and extraction kinetics allows the prediction of system behavior. However, its constants (k1 and k2) lack intrinsic physical meaning and vary depending on the system and experimental conditions. This limitation restricts the model’s usefulness for process extrapolation or scale-up, as it does not enable a mechanistic understanding or direct control of key phenomena such as mass transfer or thermal degradation.
Therefore, while empirical models are useful for capturing experimental trends, they do not provide insight into the underlying causes of system behavior. Their applicability is ultimately constrained by the lack of physical significance of their parameters.
The aim of this study is to develop a kinetic model incorporating time-delay mechanisms to describe the staged release behavior of pectin. Grapefruit peels were used as the raw material, with extractions carried out at three temperatures (60, 70, and 90 °C). Three models are proposed to describe the step-like behavior observed in the experimental results of pectin extraction: a second-order linear model with time delay, a modified empirical Peleg model, and a modified logistic model. To identify the model parameters, a hybrid strategy is employed, combining a Monte Carlo algorithm with genetic algorithms [
13].
2. Materials and Methods
2.1. Material
Yellow grapefruit peels from the same batch, harvested in San Juan, Argentina, were used. The peels were cut and separated from the pulp. They were then dried in a vacuum oven at 70 °C for up to 48 h. The dried peels were ground and sieved (30 μm) to obtain grapefruit peel powder. All reagents and chemicals used in this study were of analytical grade.
2.2. Experimental Design
A Box–Behnken design with a total of 15 experimental runs, including 3 central points, was employed to identify the key variables in the pectin extraction process. The independent variables selected were extraction time, temperature, and pH, based on parameters commonly used in industrial pectin extraction, as shown in
Table 1. The response variable was the pectin yield percentage. The experimental design and statistical analysis were performed using Design Expert
® software, version 7.0 (Stat-Ease Inc., Minneapolis, MN, USA).
Table 2 shows the factorial analysis of variance (ANOVA) based on the Box–Behnken design was performed to evaluate the effects and interactions of temperature, extraction time, and pH on pectin yield. The results showed that both temperature and extraction time had a statistically significant effect (
p < 0.05), whereas pH did not show a significant impact within the studied range (
p = 0.0908). In addition, the interaction between temperature and time (BC) was also found to be significant.
The optimal combination of factor levels that maximized pectin yield within the studied experimental region was 90 °C, a 180 min extraction time, and a pH of 1.2.
Since temperature was the most influential factor and, at an industrial scale, its optimization directly impacts energy consumption and process sustainability, its effect was studied in greater detail. To this end, the optimal values of time and pH were fixed, and the modeling focused exclusively on the effect of temperature on pectin yield. This approach not only provides a deeper understanding of the process dynamics but also establishes a solid foundation for future strategies aimed at process intensification and energy efficiency.
2.3. Extraction Process
The extraction procedure was carried out following the methodology described by Bilraheem et al. [
14] with slight modifications. Grapefruit peels were dried in a vacuum oven at 70 °C and then immersed in a mild 0.1 M citric acid solution, adjusting the pH to 1.10. Pectin extraction was carried out in a thermostated reactor equipped with mechanical stirring. Experiments were conducted at 60, 70, and 90 °C for 180 min.
After pectin extraction, the solution was cooled to room temperature and filtered through muslin cloth. Then, 96% ethanol was added in a ratio of 1:1 v/v filtered, and the mixture was left to stand at 10 °C for 24 h to allow pectin precipitation. The resulting precipitate was collected, while the remaining supernatant was centrifuged at 2000 rpm for 15 min and subsequently filtered through a fast-flow paper filter. The entire pectin precipitate was washed twice with 96% ethanol and dried in a vacuum oven at 50 °C and −0.7 bar for 24 h. Finally, the dried solid was weighed to determine the extraction yield.
Figure 1 shows the results for the three temperature conditions tested and for each material.
2.4. Modeling
In the field of pectin production, as in most industrial processes, it is essential to develop a mathematical model that accurately represents the dynamics of the system under study. Although the literature reports several mechanistic models for pectin extraction in solid–liquid systems [
7,
8,
15], few studies specifically address the effect of temperature on the kinetics of pectin extraction.
The aim of this study is to evaluate the performance of three mathematical models to determine which best fits the experimental data obtained at three different temperatures (60, 70, and 90 °C). For this purpose, the following models are analyzed: (i) an empirical model based on the Peleg equation, with specific modifications for this study; (ii) a modified second-order linear model with time delay (SOPDT); and (iii) a logistic model, specifically adapted to the extraction kinetics observed in the system.
2.4.1. Modified Peleg Model
Peleg’s empirical model [
12] has been widely used to describe absorption and extraction processes, including pectin extraction. For example, Wai et al. [
16] determined that this model was the most suitable for describing the kinetics of pectin extraction from pitahaya peels, as it offered a significant fit to the experimental data compared to other empirical models. However, when a frequent sampling protocol is applied, it is observed that pectin release does not occur continuously, but in sequential stages, each with its own specific dynamics and a clearly defined onset time. To represent this progressive release, associated with the progress of chemical treatment over time, Peleg’s model can be modified by incorporating Heaviside functions, which allow the onset of each stage to be modeled within the overall extraction kinetics.
The empirical Peleg model is given by the following equation:
where
is the instantaneous percentage yield,
= P(0), t is time [min],
is the Peleg constant [min g/g dry], and
is the Peleg capacity constant [g/g dry].
The experimental data, as illustrated in
Figure 1, demonstrate that the kinetics of pectin extraction of grapefruit peels exhibit three distinct stages, irrespective of the working temperature. These stages are characterized by a rapid release, a subsequent plateau, and, finally, a gradual growth until the maximum amount of extracted product is reached.
In consideration of the system’s response under three distinct temperature conditions, it is proposed that each stage of the curve be modeled using the equation proposed by Peleg [
12], representing the increments for each stage. Thus, the mathematical equation is modified as follows:
where
is the percentage yield at each stage. Thus, Equation (2) is written as a superposition of the equations of each stage run in time.
where H(t) is the Heaviside function, defined as [
17]
where
,
are the pectin yields at each step, t is the time, t
01, t
02 are the time at which each stage occurs, and P
g is the total percentage yield of pectin achieved at the end of the process, using the modified Peleg model.
This model requires a set of parameters (, ) for each stage; that is, a total of six parameters are required for the entire process.
2.4.2. Modified Second-Order Linear Model with Time Delay
One of the main limitations of the modified Peleg model is the presence of abrupt transitions at the beginning of each stage, which generate maximum derivatives that do not accurately represent the real behavior of the system, where pectin release tends to start more gradually. To overcome this limitation, second-order linear models are proposed, as they more realistically capture the smooth transitions at the onset of each phase of the process.
In addition to providing a more faithful description of the extraction kinetics, these models offer the advantage of well-established tuning methods that allow for the direct estimation of model parameters from experimental data. The tuning formulas, available in Mollenkamp [
18] and numerous subsequent studies, provide reliable initial values that can be further refined using genetic algorithms, facilitating their practical implementation [
13,
19].
Considering these observations on the stepwise dynamics of the process, Montoro et al. [
20], in a previous study, developed a second-order linear model with time delay (SOPDT) for each of the phases shown in
Figure 1. In this approach, each stage is modeled as a sequence of subprocesses, each characterized by its own delay time and dynamic response, as detailed in Equations (4)–(6).
This study proposes the use of a single second-order model to describe the dynamics of all three stages, with the levels and onset times of each stage incorporated into the term Pmax, as shown in Equations (7) and (8). This approach differs from the previous work, where three separate second-order models were used—one for each stage—with different time constants.
It is worth noting that to describe the complete pectin extraction process using Equations (4)–(6), a total of six parameters are required, while the proposed model (Equation (8)) uses only two parameters.
where
are the first and second derivatives of pectin yield,
the pectin yield,
the maximum pectin yield at each stage where i
{1,2,3}, t
1 and t
2 correspond to system timing constants, and t
ret1, t
ret2, and t
ret3 are the times at which each stage begins.
2.4.3. Modified Logistic Model
The logistic model, commonly used in the analysis of cell growth processes, describes the evolution of a bioprocess from an initial inoculum to a maximum population concentration. Its versatility has established it as a useful tool in both biology and process engineering. In this study, this model is mathematically adapted to represent the evolution of pectin concentration during the extraction process, allowing the precise capture of the different phases of the phenomenon and a faithful reproduction of its dynamic behavior.
The logistic model equation is given by expression (9), which is widely used in process engineering due to its versatility and capacity to represent growth and transformation phenomena [
21]. Expression (10) shows the modification introduced to the original equation, incorporating delay times and additional parameters involved in the pectin release process.
where
where
,
, and
are the maximum pectin yields in each stage,
,
, and
are the times at which each stage begins,
is the first derivative of the pectin yield, and
is a function necessary to extend the logistic model to the different stages. That is, each of these stages requires this set of parameters.
2.5. Model Parameter Estimation
To determine the parameters that best fit the proposed models, a strategy originally developed by Fernández et al. [
13] was employed. This technique combines the Monte Carlo random search method with evolutionary algorithms, specifically genetic algorithms (GAs).
The Monte Carlo method is a numerical analysis technique based on the use of random number sequences to sample the values of probability variables within a given problem. In this context, the method is adapted to solve an optimization problem involving a set of model parameters. A defined number of simulations (N) is run to identify the iteration that minimizes the objective function, which in this case is defined as [
13]
where J is the squared error between the experimental pectin yield (P
exp) and the simulated yield (P
sim).
From a probabilistic perspective, the solution obtained is optimal within a predefined confidence interval, thus representing a suboptimal solution.
Genetic algorithms are evolutionary methods used to solve search and optimization problems. They are inspired by the genetic processes of living organisms. Over generations, populations evolve according to the principles of natural selection and the survival of the fittest.
In essence, a GA operates on a population of individuals, each representing a feasible solution to the given problem. Each individual is assigned a fitness score based on the quality of the solution it represents. Through genetic operations such as crossover and mutation, modified individuals form new generations, thereby evolving the system toward an optimal solution [
19,
22,
23].
Considering that the system parameters are real numbers with potentially large differences in order of magnitude, an indirect encoding approach is used. This encoding represents the relative variation or weighting of each parameter, which enhances the algorithm’s performance when parameter magnitudes vary significantly.
The selection of the most fit individuals for reproduction in each generation is carried out using elitist selection, where the best individual(s) are copied into the new population. Elitism helps preserve the best solution found and improves the algorithm’s performance.
For crossover, a single-point method is used: parent chromosomes are split at a randomly chosen point, and genetic material is exchanged such that one offspring receives genes from one parent up to the crossover point and the remainder from the other parent. The goal of crossover is to produce offspring with improved fitness relative to their parents.
Mutation is performed by randomly selecting a position in a chromosome and altering its value. The algorithm may be terminated either after reaching a predetermined number of iterations or once convergence is achieved (i.e., when no significant changes occur in the population).
The hybrid algorithm proposed in this study is characterized by the fact that the initial population for the genetic algorithm is generated using the Monte Carlo method, from which the best individuals are selected to initialize the evolutionary process.
3. Results and Discussion
Figure 1 shows the experimental pectin yield curves obtained at extraction temperatures of 60, 70, and 90 °C. At 60 and 70 °C, the extraction profiles virtually overlap throughout the entire time interval, suggesting that diffusion and solubilization mechanisms are not significantly enhanced between these two temperatures. However, a clear difference is observed at 90 °C, where pectin yield increases rapidly and reaches values approximately 50% higher than those obtained at lower temperatures after 180 min.
This higher extraction at 90 °C can be attributed to several temperature-dependent factors:
- -
Higher cell wall permeability: Higher temperatures promote the degradation of the plant cell wall structure, facilitating protopectin solubilization and mass transfer from pectin to the solvent phase.
- -
Acceleration of hydrolysis reactions: Temperature increases the acid-catalyzed hydrolysis of protopectin into soluble pectin, increasing its availability for extraction.
Quantitatively, the final yield at 90 °C exceeds 120%, while at 60 and 70 °C, it remains below 80%, confirming the conclusion that an increase in temperature from 70 to 90 °C results in a yield improvement of more than 50%. These results suggest that 90 °C is a threshold above which the system transitions from a diffusion-limited regime to one with enhanced reaction, which may be crucial for process intensification strategies.
3.1. Results of the Modified Peleg Model
The results obtained using Equation (3), corresponding to the modified Peleg model, are shown in
Figure 2, along with the experimental data for each temperature. The graphs obtained with the Peleg model show that the initial velocity is maximum at time zero after the start of the treatment.
This is because the Peleg model, like other empirical hyperbolic models, assumes that the extraction rate decreases with time. This is evidenced by the derivative of Equation (1): for a time, t = 0, the velocity is maximum and the denominator is minimum (only K1). Time (t) increases, causing a progressive decrease in the extraction rate.
Physically, this phenomenon can be interpreted by the fact that at the beginning of the process, there is a greater concentration gradient between the solid matrix (grapefruit peel) and the liquid medium, which favors a high mass transfer rate. The most easily accessible pectin (surface or weakly bound) dissolves rapidly in the early stages of the process.
Then, as extraction progresses, the concentration gradient decreases, and resistance to internal diffusion in the plant matrix increases, which explains the reduction in pectin extraction rate over time.
3.2. Results of the Modified Second-Order Linear Model with Time Delay (SOPDT)
Figure 3 shows the fit to experimental data using the SOPDT model, which provides a good approximation of pectin extraction kinetics and adequately reproduces the general observed trend. This model, unlike empirical approaches such as the modified Peleg model, integrates both the properties of the plant matrix and the extraction mechanism, allowing for a more coherent representation of the process.
Its structure based on successive stages makes it an innovative tool for describing pectin release. Rather than modeling the process using independent equations or purely empirical fits, the model considers a homogeneous system in which each release phase responds to the same time constant. This stepwise formulation not only facilitates the physical interpretation of the phenomenon but also simplifies parameter identification and practical implementation. While empirical models tend to smooth out transitions or fail to capture the release phases well, SOPDT successfully reflected the step-like behavior observed in experimental data. This step-like behavior is especially relevant when considering that pectic substances are not found free in the plant matrix, but rather bound to cellulose in the form of complexes such as pectocellulose. The separation of these compounds requires appropriate conditions, such as elevated temperatures, that favor the breaking of structural bonds and allow for the progressive release of pectin [
24].
The proposed model (SOPDT) not only accurately predicts the evolution of extraction but also aligns with the physicochemical fundamentals of the system, providing a solid basis for optimizing both process yield and efficiency.
3.3. Results of the Modified Logistic Model
The logistic model effectively adapts to pectin extraction kinetics.
Figure 4 shows that at 90 °C, the fit with the experimental data is accurate and reflects both the initial growth and stabilization in the final stage. At 70 °C, the model follows the data trend, although it exhibits small deviations at some intermediate points. At 60 °C, the model curve shows good overall agreement, although slight discrepancies with the experimental data are observed at certain times.
Overall, the modified logistic model adequately represents pectin extraction kinetics and shows a good correlation with the experimental data. However, improvements in the accuracy of the fit could be evaluated at certain time intervals, especially in the intermediate phase, where greater differences with the experimental data are observed, particularly between 50 and 120 min, with deviations reaching up to 3.2% at 70 °C and 3.5% at 60 °C. These discrepancies may be attributed to structural heterogeneities in the plant matrix or localized variations in mass transfer resistance, which are not fully captured by the symmetric nature of the logistic model. In contrast, in the asymptotic phase (after 130 min), the model shows improved agreement, with deviations falling below 1.5%.
3.4. Adjustment of Experimental Data
For the fitting of the three models, a hybrid methodology combining the Monte Carlo method with genetic algorithms was employed. The entire algorithm was implemented in MATLAB R2015. A total of 500 Monte Carlo simulations were performed, from which the best 50 results were selected, i.e., the parameter sets with the lowest fit index (Equation (13)).
These top 50 individuals were then used to initialize the genetic algorithm. First, the top 10 individuals were selected as “parents” and used to generate new individuals through mutation (20 individuals) and crossover (10 individuals). The remaining 10 individuals in the new generation were generated randomly. The algorithm converged after 30 generations.
Comparison of Model Fit
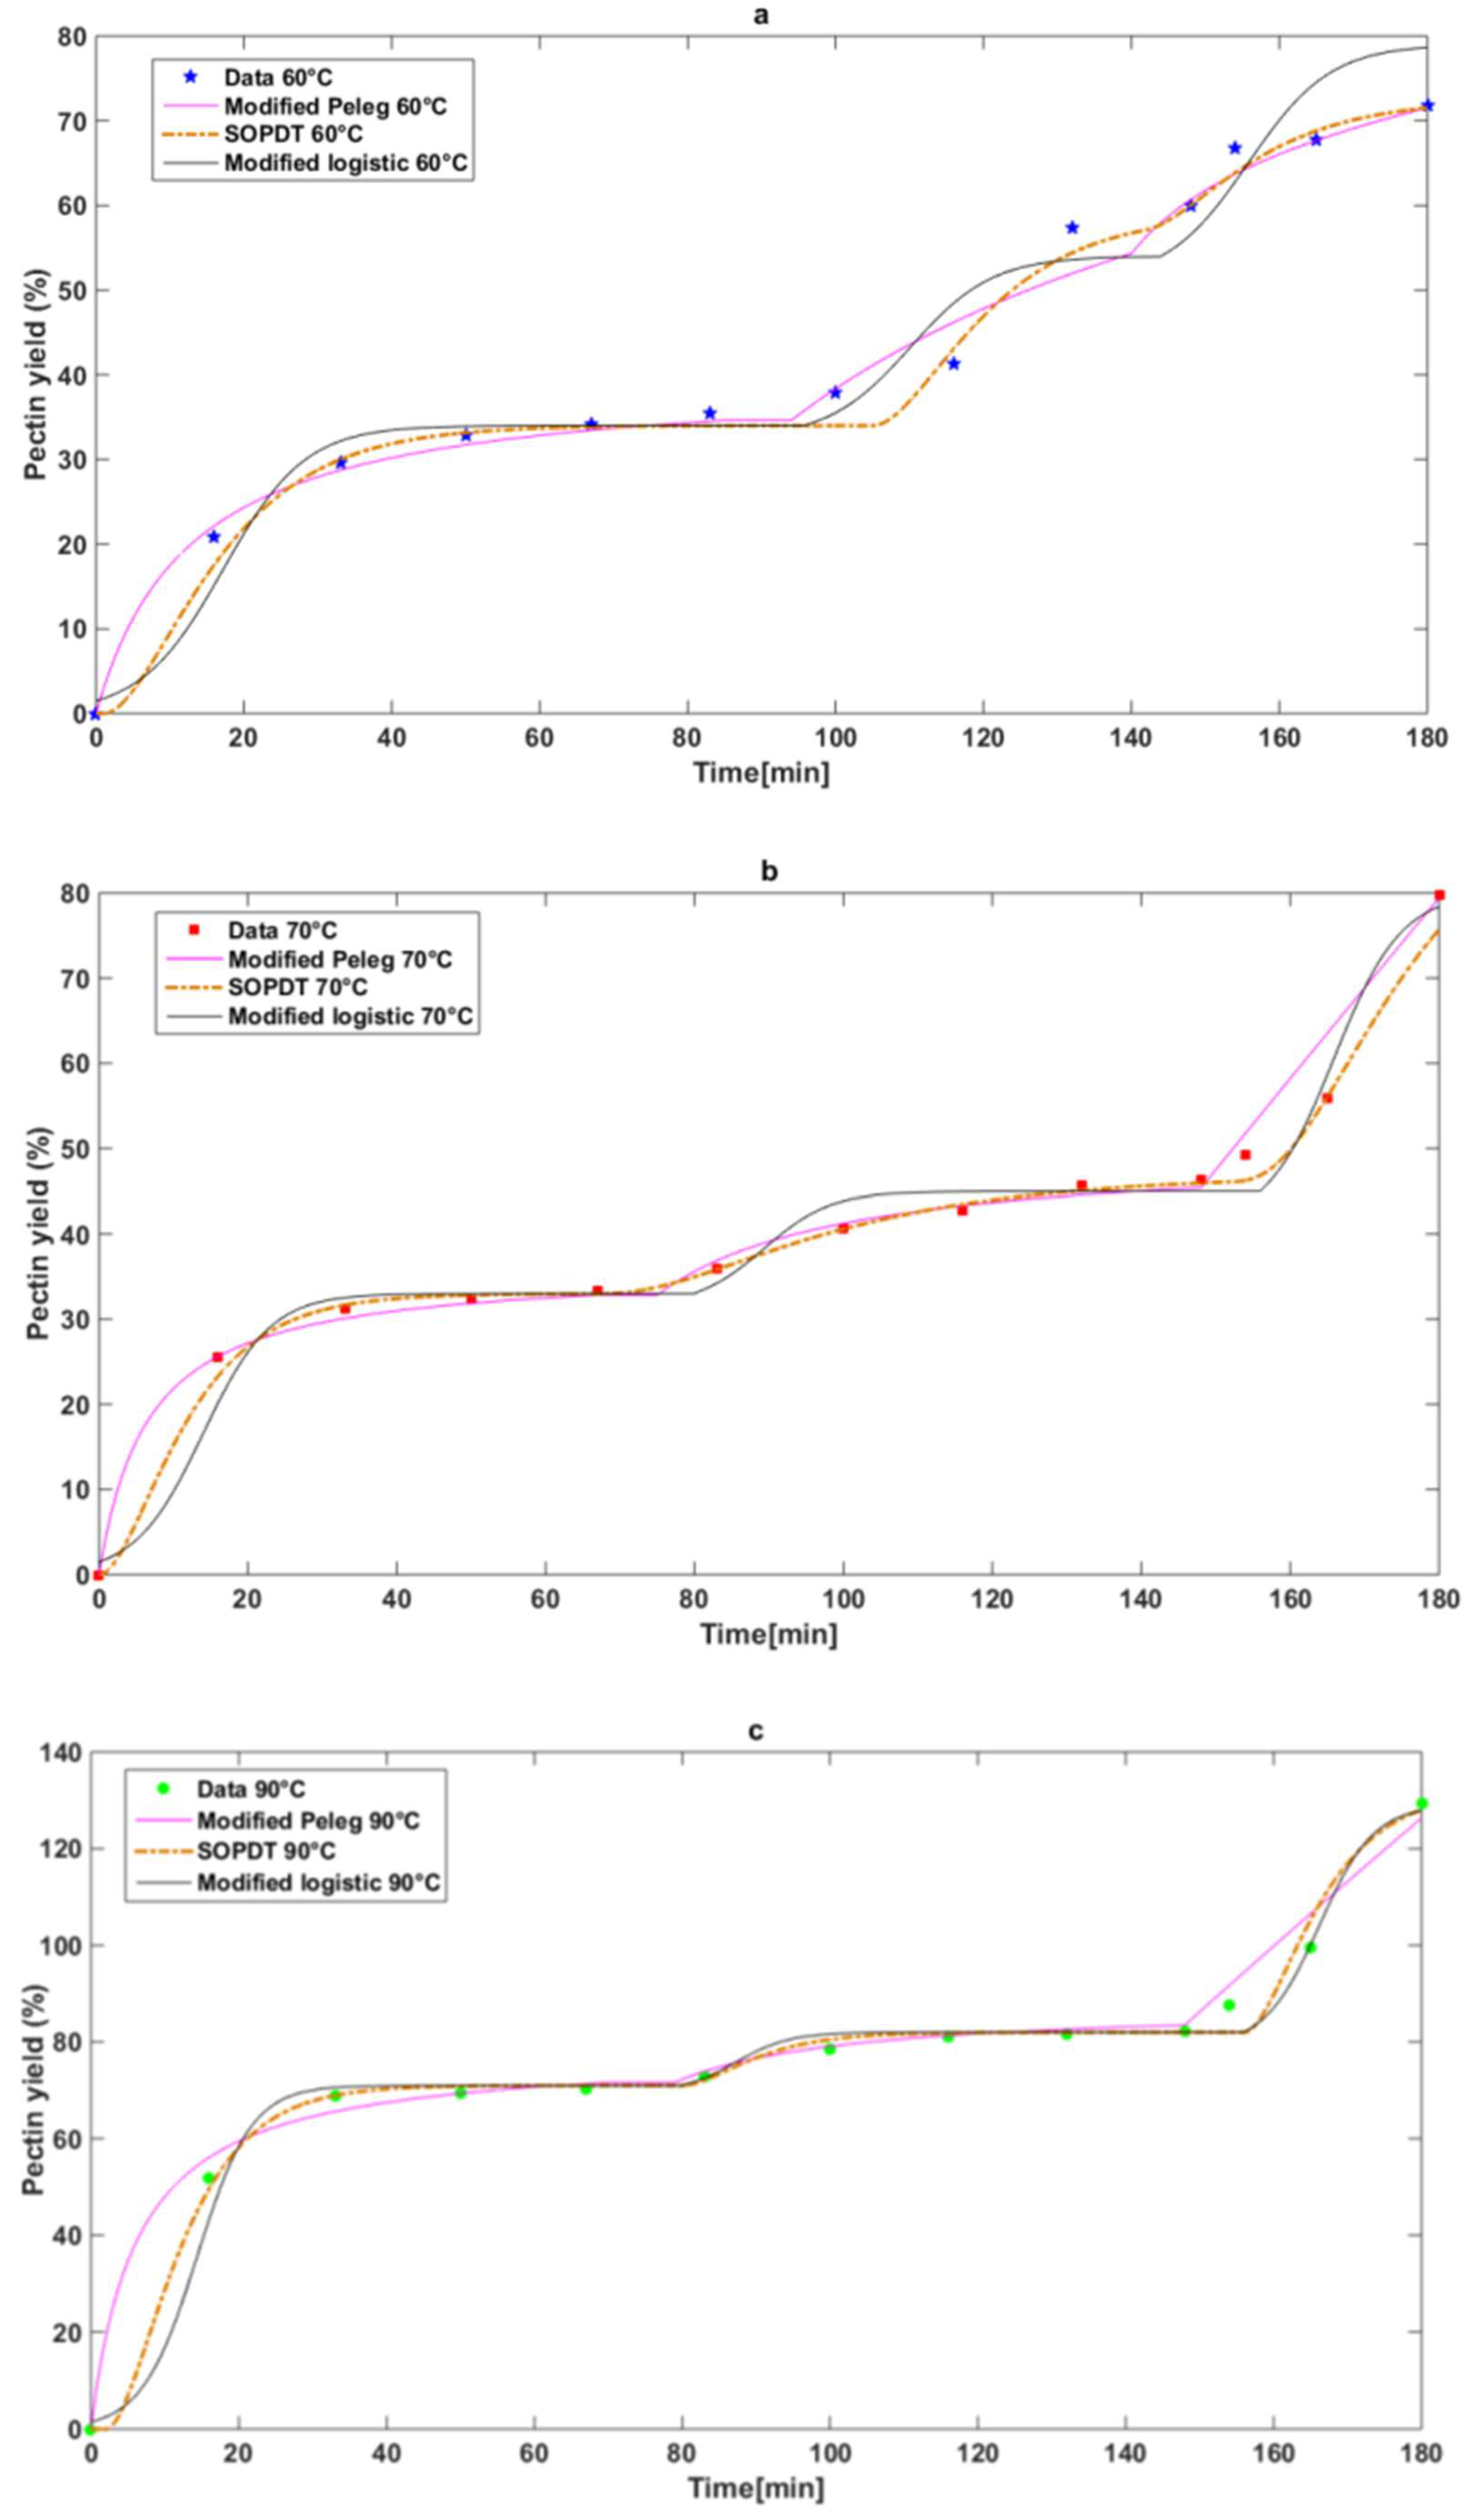
The fit to the experimental data for each model and for each temperature is shown in
Figure 5a–c. The values of the model parameters are presented in
Table 3.
To comparatively evaluate the fit of three mathematical models (Peleg, SOPDT, and Logistic) to experimental data from pectin extraction at three different temperatures (60 °C, 70 °C, and 90 °C), an analysis combining the squared error (J) according to Equation (13) and a one-way ANOVA was performed. The results of this analysis at each temperature are summarized in
Table 4.
In all cases, the p-values were greater than 0.05, indicating no statistically significant differences between the models at the 95% confidence level. In ANOVA, the F-statistic measures the ratio of variation between groups to the variation within groups, and the p-value indicates the probability that the observed differences occurred by chance. A high p-value (greater than 0.05) suggests that any differences between the model performances are not statistically significant. However, this test does not reflect the magnitude of the fit error, which was assessed by calculating the norm of the squared error for each model under the different experimental conditions.
The results show that the SOPDT model consistently yielded the lowest error rates at all analyzed temperatures (7.06, 5.63, and 8.71). While ANOVA did not indicate statistically significant differences, the quantitative analysis indicates that the SOPDT model provides a more reliable description of the pectin extraction kinetics.
Therefore, although all three models were statistically viable, the SOPDT model proposed in this work offers a better numerical fit, as well as a simpler and more efficient formulation, justifying its selection as the most representative model under the conditions studied.
Furthermore, another advantage of the SOPDT model is that it allows the entire extraction process to be described using a single equation with only two constants, which significantly simplifies both model formulation and parameter estimation. In contrast, the other models require a total of six constants to represent the entire process, which increases complexity and makes practical implementation difficult.
4. Conclusions
In this study, three mathematical models were evaluated to describe the kinetics of pectin extraction from grapefruit peels in an acidic medium at three different temperatures (60, 70, and 90 °C). A modified empirical Peleg model, a modified logistic model, and a second-order linear model with time delay (SOPDT), specifically designed for this process, were considered. The models were fitted using a hybrid methodology combining Monte Carlo simulations with genetic algorithms, allowing for efficient parameter optimization. The SOPDT model proposed in this work allows the entire process to be represented by a single equation with only two constants, while the remaining models require a total of six constants (two for each stage). The experimental results obtained indicate that the SOPDT model presents the best fit across the entire temperature range evaluated. These advantages over the other models position the SOPDT model as the most reliable alternative for describing pectin extraction kinetics from a dynamic perspective, with high potential for application in process control.
In conclusion, the SOPDT model assumes that pectin release occurs progressively through successive stages, each with a specific activation time. Therefore, the model not only offers a more accurate mathematical representation but is also based on the physicochemical principles of the system, providing a solid basis for optimizing the yield and efficiency of the extraction process.
These findings highlight the usefulness of the SOPDT model as an effective tool for predicting and optimizing pectin extraction and contribute to the development of more sustainable and efficient strategies for the valorization of agro-industrial waste.
In future work, the model developed in this research will be used to optimize the pectin production process, with the aim of minimizing energy consumption. In this sense, the adoption of a single second-order model to describe the different stages of the process, while maintaining constant characteristic times, is particularly suitable for facilitating the analysis and implementation of energy optimization strategies.


 ,
, 


