Article

Production Prediction Method for Deep Coalbed Fractured Wells Based on Multi-Task Machine Learning Model with Attention Mechanism

1
CNOOC Research Institute Ltd., Beijing 100028, China
2
Department of Petroleum Engineering, China University of Petroleum, Beijing 102249, China
*
Author to whom correspondence should be addressed.
Processes 2025, 13(6), 1787; https://doi.org/10.3390/pr13061787
Submission received: 3 April 2025 / Revised: 9 May 2025 / Accepted: 22 May 2025 / Published: 5 June 2025

Abstract

:
Deep coalbed methane (CBM) is rich in resources and is an important replacement resource for tight gas in China. Accurate prediction of post-fracture production and dynamic change characteristics of fractured wells of partial CBM is of great significance in predicting the final recovery rate. In terms of predicting time-series production, the problem one encounters is low prediction accuracy and poor generalisation ability under limited sample conditions. In this paper, we propose a hybrid deep neural network (AT-GRU-MTL) production prediction model based on the combination of an attention mechanism gated recurrent neural network (GRU) and multi-task learning (MTL), where the AT-GRU is responsible for capturing the nonlinear pattern of the production change, while introducing an MTL method that includes a cross-stitch network (CSN) and a weighted loss using homoskedasticity uncertainty to automatically determine the degree of sharing between multiple tasks and the weighting ratio of the total loss function. The model is applied to several typical deep CBM fracturing wells in China, and the accuracy of gas production prediction reaches 90%, while the accuracy of water production prediction is 68%. The experimental results show that, for the blocks with a very large difference in the order of magnitude of the gas and water production, it is very easy for a certain small order of magnitude to be suppressed from learning during the two-way multi-task learning process, which leads to deterioration of its prediction effect; at the same time, the adaptability of the model is evaluated, and it is found that the model is more advantageous for the wells that have been produced for approximately one year. Meanwhile, the evaluation of the model adaptability shows that the model is more dominant in the prediction of wells with production of about one and a half years. Based on the two test wells with shorter (380 days) and longer (709 days) spans, the results indicate that the model may have insufficient sensitivity to the sudden change of the ratio of gas to water and the failure of the dynamic generalisation of the matrix shrinkage–desorption coupling, and the introduction of physical constraints (such as bottomhole flow pressure, etc.) or the division of the data into the production stages may be attempted to deal with the case subsequently. The research results in this paper provide a theoretical basis for dynamic production prediction and analysis in oil and gas field sites.

1. Introduction

China’s medium and shallow coalbed methane has been commercially exploited, and two major coalbed methane industry bases have been built in Qingshui Basin and the eastern edge of Ordos Basin [1]. Deep coalbed methane (referred to as deep CBM) is rich in resources, and is an important replacement resource for tight gas in China. Since 2019, PetroChina has achieved a breakthrough in deep CBM in the Daning–Jixian block, submitting 76.2 billion cubic metres of proven geological reserves, and the daily production of deep CBM has reached 4 million cubic metres as of 21 September 2023. In 2022, PetroChina carried out a deep CBM appraisal in the Da Niu Di gas field In 2022, PetroChina carried out deep CBM evaluation in Da Niu Di gas field, and the horizontal well ‘Yang Coal 1HF’ gained a major breakthrough, with a daily production of 104,000 mcf, and achieved continuous and stable test mining. In 2022, the first deep CBM horizontal well ‘Deep Coal 1’ implemented in Linxing block gained a daily production of 60,000 mcf of high-yield industrial gas flow, which formally started the prelude to the exploration and development of deep CBM of CNOOC [2].
Post-pressure deep coalbed methane production prediction methods mainly include analytical methods, reservoir numerical simulation, decreasing production curves, and traditional statistical-based time-series prediction methods. The analytical method presupposes a large number of assumptions in advance to idealize the complex conditions, and the prediction accuracy is difficult to guarantee; the reservoir numerical simulation greatly relies on accurate geological models and input parameters, and the history fitting process is time-consuming and labour-intensive; the decreasing production curve is not applicable to fractured wells with short production time and frequent changes in production regimes; and the traditional time-sequence prediction method is based on the linear statistical method, which is unable to accurately capture the characteristics of the nonlinear and non-smooth changes in time-sequence production.
The time-series prediction problem can be divided into traditional time-series prediction methods based on statistics and deep learning methods based on convolutional neural networks. Traditional time-series prediction methods based on statistics and stochastic process theory have been successfully applied to dynamic production forecasting of oil and gas wells [3,4,5,6]. This class of methods is theoretically mature and simple to use, and it predicts the trend of production change in the future period by mining the relational features of the historical production data and current production data. Autoregressive model (AR), moving average model (MA), autoregressive moving average model (ARMA), and ARIMA are mature time-series forecasting methods. In 2010, Chen et al. [7] established a monthly production forecasting model for a single well based on ARIMA, which confirms that ARIMA can be used for time-series production capacity forecasting and has high accuracy in short-term forecasting; the following year, Wang et al. [8] combined ARIMA and fractal theory to establish a monthly production prediction model for coalbed methane wells; in 2014, Gupta et al. [9] applied ARIMA to establish a monthly production prediction model for a single well of shale gas wells and compared it with the Duong method, and the results showed that ARIMA could achieve prediction results with comparable accuracy to the Duong method; in the same year, Olominu et al. [10] based on ARIMA established a single-well cumulative production prediction model, and concluded that the prediction accuracy of ARIMA method was higher than that of Arps production decreasing method in the medium and long term.
With the development of artificial intelligence, the research on machine learning-assisted temporal capacity prediction has been continuously advanced. With the ability of ‘memory’ and flexible structure, recurrent neural network (RNN) and its variants such as long and short-term memory (LSTM) and gated recurrent unit (GRU) [11] are often used to solve multivariate time-series prediction problems. Deng [12] established an LSTM model for the cumulative gas production of a single well in a gas field considering only the production itself, and the comparison found that its prediction performance was much higher than that of ARIMA. Sun et al. [13] compared the prediction effect of LSTM model with tubing pressure as an exogenous variable with that of the Arps production decline analysis, and found that the LSTM model had a much smaller error. Lee et al. [14] established an LSTM model for shale gas that considered the effect of well shut-in time to shale gas LSTM monthly gas production prediction model, and pointed out that the prediction accuracy of the multivariate model considering well shut-in time was higher than that of the univariate model considering only production. Li (2023) [15] proposed a dynamic production prediction method based on bidirectional gated recurrent unit neural network (BiGRU) to address the problem that traditional production prediction methods cannot consider the influence of field operation, and the performance is better than that of the production decreasing curve analysis, the traditional time-series prediction method, recurrent neural network, and its unidirectional variant. Zhu (2022) [16] conducted a comparative analysis of four coalbed methane production capacity prediction models and revealed that the hybrid deep neural network prediction model, which integrates convolutional and gated recurrent units, exhibited superior predictive performance. Furthermore, this model facilitated the optimization of the production and recovery system. conducted a comparative analysis of four coalbed methane production capacity prediction models and revealed that the hybrid deep neural network prediction model, which integrates convolutional and gated recurrent units, exhibited superior predictive performance. Furthermore, this model facilitated the optimization of the production and recovery system. Gao (2022) [17] constructed a GRU-TGCN model to mine the time-series implicit information, and established the adjacency matrix and feature matrix based on the inter-well relationship graph and well gas production data, so as to adjust the network parameters for production. Liu (2022) [18] used the GRU-MLP network model to establish a physical constraints data-driven dynamic prediction model, optimized the model hyperparameters by genetic algorithm, and applied the model to two coalbed methane field multi-stage fractured horizontal wells in Linfen block of Ordos Basin and Qinshui Basin Daning well field; the prediction accuracy reached more than 90%.
Multi-step timing prediction has always been a research hotspot and difficulty in the field of timing prediction. In the petroleum industry, although it is still in its infancy, multi-step timing prediction has attracted the attention of more and more scholars. Lee et al. [14] used an iterative strategy to predict the monthly gas production of shale gas wells from the next 1 month to the next 20 months. Mohd Razak et al. [19] used an iterative strategy to achieve the monthly production prediction of the three phases, namely oil, gas, and water, for the next 6 months based on migration learning and LSTM. However, the study treated the multiphase production as a multivariate output of an LSTM model, ignoring the need for different neural network structures for different production volumes. Based on a hybrid model of convolutional neural network and RNN, Chaikine and Gates [20] used a direct strategy to predict the annual gas production and water content for the next 5 years; again, the two outputs were multivariate outputs of the same network, ignoring the different demands of different tasks on the structure of the model. Werneck et al. [21] used a multiple-input–multiple-output prediction strategy to achieve the future 30-day prediction of daily oil production and bottomhole flow pressure, again without considering the coupling between oil, gas, and water phases. Most of the above multi-step time-series prediction models are only for single phase, ignoring the interaction between oil, gas, and water during multiphase seepage, and the few multi-output models do not consider the different requirements of different production sequences on the neural network structure. In summary, the post-pressure dynamic yield prediction problem is complex, involving multivariate, multi-step, and multiphase time-series yield prediction, and the model structures and prediction strategies vary greatly in different application scenarios.
The first section of this paper introduces the attention mechanism and sharing module on the basis of the GRU model to consider the attention allocation and feature sharing of multi-task; the second section constructs the model framework diagram and arranges the pre-processing of the data; the third section configures the environment, and then normalises the data as well as constructs the time-series data by sliding window. In this paper, we choose MAE, RMSE, and R2 as the evaluation indexes, and following super-parameter optimisation to obtain the model, the next step is to compare the multi-task model. Finally, the preferred model will be subjected to adaptive analysis.

2. Yield Prediction Method Based on Multi-Task Machine Learning

2.1. Gated Recurrent Unit (GRU)

GRU is a variant of RNN, which adopts a ‘gated structure’ to solve the long-time sequence memory problem. Compared with LSTM, its structure is simpler, but can achieve the same prediction performance as LSTM. The structure of the GRU unit is shown in Figure 1, which consists of two gates, the update gate and the reset gate.
Among these structural elements, the update gate (rT) determines which input information is forgotten and updated, denoted as
r T = σ W r h T 1 , X T + b r
where Wr and br are the weight matrix and bias matrix of the update gate, respectively.
The reset gate (ZT) determines the degree of information forgetting, and its value ranges from 0 to 1, with the closer to 0 representing the higher degree of forgetting, which is mathematically expressed as
z T = σ W z h T 1 , X T + b z
where Wz and bz are the weight matrix and bias matrix of the reset gate, respectively.
After the input message passes through the update gate and reset gate, the candidate hiding state h ~ T at time step T is updated to
h ~ T = tanh ( W h [ h T 1 r T , X T ] + b h )
where Wh and bh are the weight and bias matrices of the cell’s hidden state, respectively, and is the Hadamard product.
Finally, the output hT at time step T is obtained as
h T = 1 z T h T 1 + z T h ~ T

2.2. Multi-Task Learning

Most of the current yield prediction models are single-task models, i.e., one model can only predict one target variable. If multiple target variables need to be predicted, multiple single-task models need to be built separately. This repetitive training and optimisation process is not only time-consuming and laborious, but also each model can only make use of limited single-task data. With limited samples, it is difficult for single-task models to accurately understand the true distribution of the data and learn the implicit knowledge behind the yield prediction problem, which can easily lead to overfitting and weak generalisation. In contrast, multi-task learning can more effectively improve prediction performance and computational efficiency.
Figure 2 compares single-task learning and multi-task learning. As shown in the figure, single-task learning trains models independently and ignores the correlation information between multiple tasks, while multi-task learning implements model training for multiple tasks simultaneously and improves model performance by making full use of shared representations in the training signals of multiple related tasks. In this paper, we define multi-task learning as follows: given m learning tasks Ti (i∈[1,m]), all of which, or some of which, are related but not identical, and by using the information embedded in the m tasks, multi-task learning is able to facilitate the knowledge learning of the Ti tasks.
It is clear from the definition that task relevance is one of the elements of multi-task learning. Tasks selected in multi-task learning should be interrelated so that all tasks can utilise the useful information contained in the tasks to improve performance, whereas irrelevant or weakly relevant tasks can confuse valuable knowledge and lead to a decrease in prediction performance. In fractured well capacity prediction, multi-task relevance judgements need to be made in the context of expertise background and understanding of the yield prediction task.
The working mechanism of multi-task learning to improve the generalisation ability of limited samples can be summarised for the following reasons [22]:
(1) From the perspective of data volume, multi-task learning pools samples from multiple tasks, increasing the amount of data available for model training and alleviating the limited sample problem to some extent;
(2) For finite samples with high-dimensional inputs, it is difficult for machine learning models to distinguish valuable features from noise, resulting in poor generalisation. In multi-task learning, other tasks can provide additional information to help the main task determine which features are useful, thus allowing the model to focus more on the truly critical features;
(3) Due to complex data structures and domain-specific non-linearities, it is difficult for some tasks to extract features efficiently, while for other tasks, features may be easily extracted. Multi-task learning can help one task learn features by ‘eavesdropping’ on another task. In other words, one task can learn the required features directly from another task, solving the problem of difficult feature extraction;
(4) By biasing the model towards features that are recognised by the majority of tasks, multi-task learning acts as a regulariser, thus reducing the risk of overfitting and improving resistance to noise.
Based on the above analysis, the problem of limited sample data and low generalisation performance can be alleviated by embedding the multi-task learning concept into the limited sample yield prediction model.

2.3. Shared Module Design

For a multi-task model, it is crucial and challenging to determine the partition structure of the model and the degree of sharing among multiple tasks, and which layers should be shared and which should be partitioned depends on the data and task situation. In this paper, we adopt the cross-stitch network style [23] to build a sharing module, which uses a linear combination of shared and task-specific representations of multiple tasks to connect a neural network of multiple tasks, and automatically determines the segmentation structure and the degree of sharing through end-to-end learning, which solves the problem that the structure of the model is difficult to determine manually. The core of the cross-stitch network is the cross-stitch unit, and its core idea is shown in Figure 3, where each task has its own independent network structure, and information sharing is achieved by adding a cross-stitch unit to connect the networks of different tasks between task layers.
Using two-task learning as an example, the cross-stitch unit can be described as
x ~ 1 i , j x ~ 2 i , j = α 11 α 12 α 21 α 22 x 1 i , j x 2 i , j
where x ~ 1 i , j and x ~ 2 i , j are the feature maps of task 1 and task 2 at (i, j), respectively; α represents the cross-stitch unit, and the smaller its value means the lower degree of sharing between tasks; when α = 0, the layer at (i, j) is a task-specific layer, the value of which can be used to determine the segmentation structure of the network and the degree of sharing; x 1 i , j and x 2 i , j are the feature maps of task 1 and task 2 after learning from the cross-stitch unit, respectively.
End-to-end learning is achieved by calculating the partial differential of the loss function L for Task 1 and Task 2 through Equations (6)–(8):
x ~ 1 i , j x ~ 2 i , j = α 11 α 12 α 21 α 22 x 1 i , j x 2 i , j
L α 12 = L x ~ 2 i , j x 1 i , j
L α 11 = L x ~ 1 i , j x 1 i , j

2.4. Design of the Loss Function

Multi-task learning makes predictions accurately and efficiently by optimising the losses of multiple tasks simultaneously, and the performance of the whole model is highly dependent on the relative weights of each loss. The traditional approach is to use the weighted linear sum of all task losses as the total loss, as shown in Equation (9), and the weights are typically taken as 1/m or fine-tuned, which makes it difficult to manually find the optimal relative weight values. In addition, the size of the loss varies from task to task, which may result in a particular task with large-scale loss dominating in minimising the loss, while other tasks fail to participate in the learning process, leading to insufficient training.
L t = i = 1 m w i L i
where L t is the total loss function of the multi-task model, L i and w i are the loss function and weight of the i-th task, respectively, and m is the number of tasks.
Based on the knowledge that the optimal weight of a task depends on the magnitude of task noise, this study introduces homoskedastic uncertainty [24] to measure the weight of a task in order to solve the problem of difficulty in determining the weight of multi-task loss. In Bayesian modelling, uncertainty can be divided into cognitive uncertainty and chance uncertainty. Cognitive uncertainty explains the uncertainty of the model parameters, which means that the model has a low confidence in the ‘unseen’ data due to the insufficient amount of training data, and the cognitive uncertainty can be eliminated by increasing the amount of training data. Incidental uncertainty refers to the noise inherent in the observations, which cannot be eliminated by increasing the amount of training data because the noise is random. Chance uncertainty can be further subdivided into heteroskedastic uncertainty, which is dependent on the input data, and homoskedastic uncertainty, which is dependent on the task. Heteroskedastic uncertainty is also known as task uncertainty, which is constant for the input data but varies across tasks, and hence this study utilises heteroskedastic uncertainty to maximise the Gaussian likelihood estimation.
For the regression problem, we can define a probabilistic model as follows:
p y f w x = Ν f w x , σ 2
where f w x represents the output of the neural network with weight w and input x, y is the observation, and N represents the normal distribution with scale parameter σ .
The logarithm can still be written as
log p y f w x 1 2 σ 2 y f w x 2 log σ
where L = y f w x 2 represents loss.
The multi-task Gaussian likelihood function with m tasks is
p y 1 , , y m f w x = p y 1 f w x p y m f w x
where y 1 , , y m are the observations for task 1, …, task m, respectively.
The regression multi-task total loss function is derived as
L t = log p ( y 1 , , y m | f w ( x ) ) i = 1 m ( 1 2 σ i 2 y i f w x 2 + log σ i ) = 1 2 i = 1 m ( 1 σ i 2 L i ( w ) + log σ i )
In applications, exp ( log σ 2 ) is often used instead of σ 2 because its value is more stable and division by zero can be avoided, so the total loss function can be rewritten as
L t = 1 2 i = 1 m [ exp ( log σ i 2 ) L i w + 1 log σ i 2 ]

2.5. Attention Mechanism (AT)

In neural network technology, the use of attention mechanisms has similarities with the brain’s information-processing model. The brain sifts and refines information to extract the valuable parts. For example, when people view a painting, they tend to focus their attention on the more prominent elements of the picture, such as sharp angles or vivid colours. The principle of the attention mechanism is similar in that it identifies data with high relevance to the target when the model is running and selectively focuses attention so that the model can concentrate on the most critical parts of the input data. The concept originated in the field of neuroscience and has since been introduced into machine learning models, particularly in the fields of natural language processing (NLP) and computer vision.
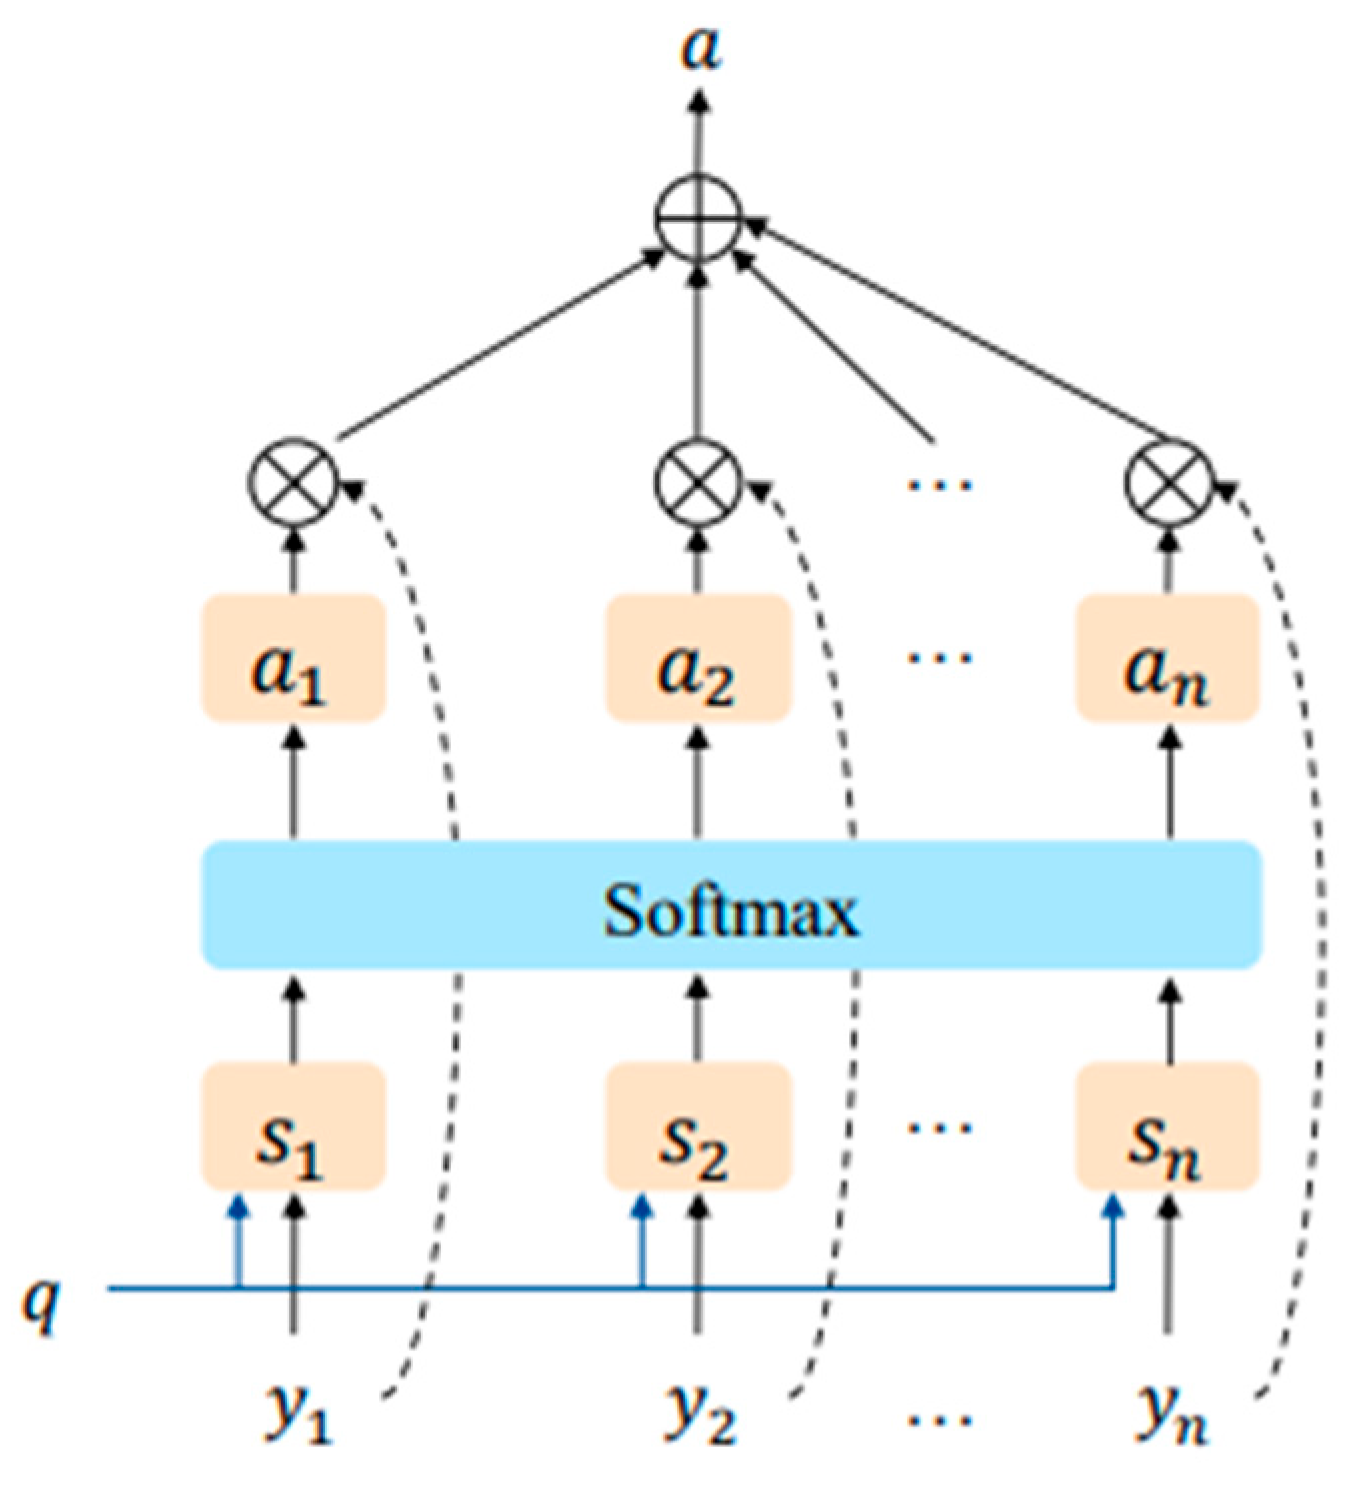
In deep learning models, the attention mechanism enables the model to dynamically assign different processing weights to different parts of the input sequence, as shown in Figure 4. This means that the model can take into account information from other elements in the sequence while processing one element, and can focus on different information depending on the task at hand. Attention models are widely used in a variety of fields such as natural language processing, image recognition, speech recognition, and so on.
The core idea of the attention mechanism is to represent the extent of the model’s attention to different parts of the input data by means of weights (or scores). These weights are usually computed in a learnable way to reflect the importance of different parts of the input for the task at hand. A mathematical model of an attention mechanism usually consists of the following steps:
(1) Calculate weights: for a given query and set of keys, calculate the similarity or correlation score between them.
e t = tanh W t h t + b h
(2) Normalisation: the scores are normalised using the softmax function to get the weights corresponding to each key.
α t = e x p e t t = 1 T e x p e t
(3) Weighted Summation: Weight and sum the corresponding values according to the weights to get the final attention output.
c = t = 1 T α t h t

2.6. Data Pre-Processing

2.6.1. Data Segmentation

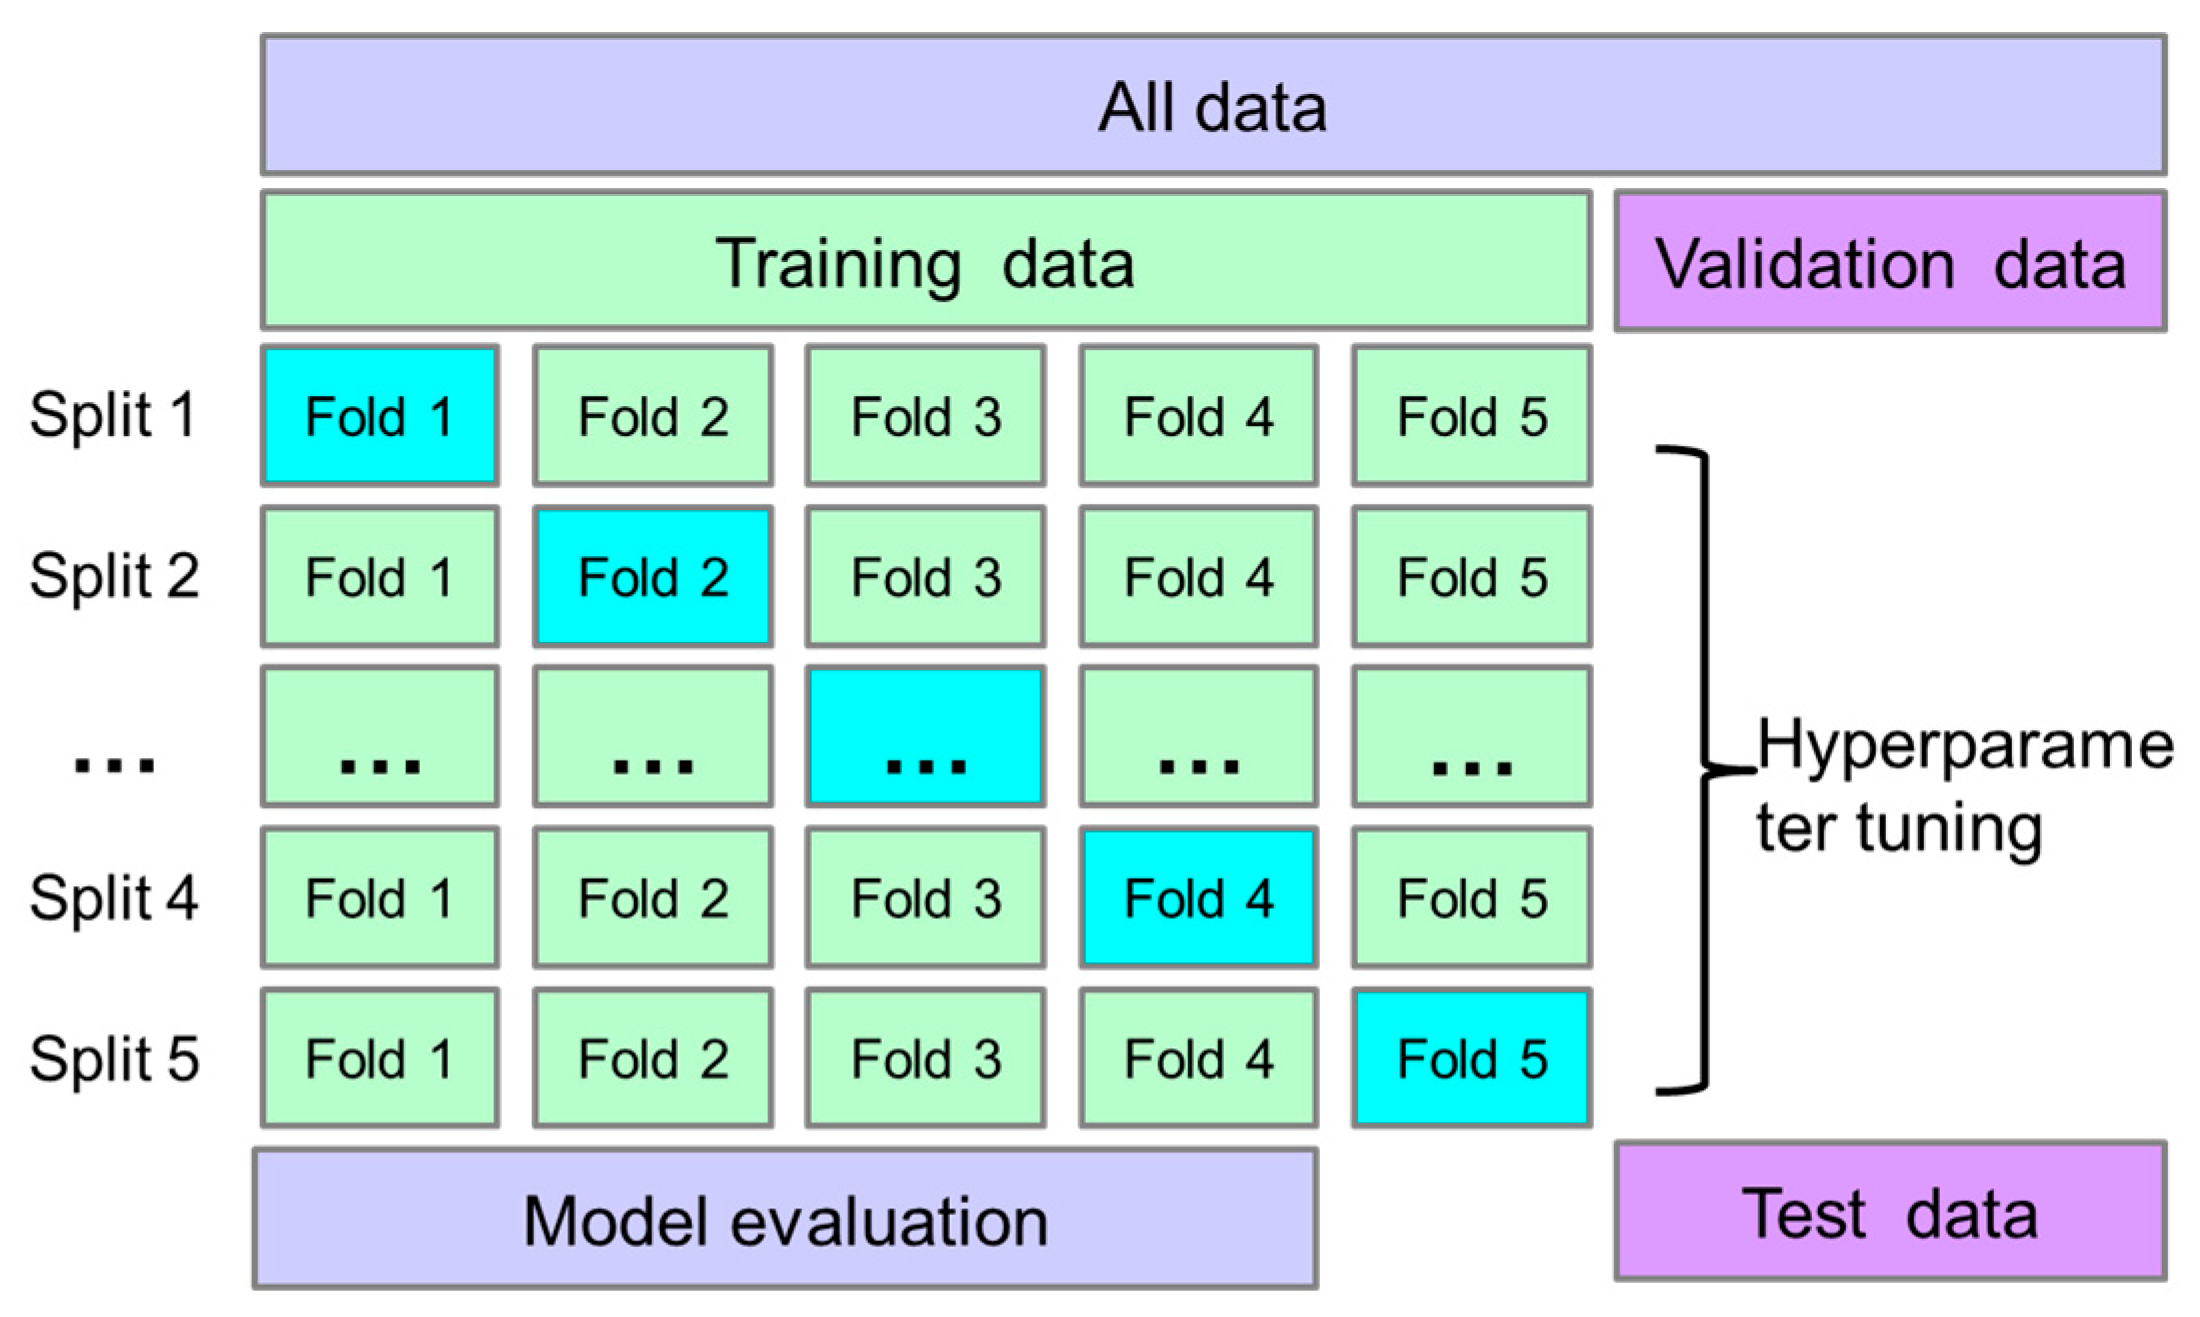
Dividing the dataset into training data, validation data, and test data according to a certain ratio is a commonly used method of dataset division. Among them, the training data are used to train the machine learning model; the validation data are used to check the training degree of the model during the training process, to avoid overfitting and underfitting, to determine the model with the best performance; and finally, the test data are used to evaluate the final effect of the model. It is worth noting that the test data are never involved in the training and optimisation process of the model, and are only used when the model is tested, so as to test the generalisation ability and application effect of the model on ‘unfamiliar’ data. For larger datasets, the proportionally drawn test data are representative enough of the distribution of the whole dataset to fairly evaluate the model performance, but for small and medium-sized datasets, the model may perform well on one randomly drawn test datum and poorly on another, making it difficult to fairly evaluate the model performance with unstable results.
The k-fold cross-validation is a more complex type of dataset partitioning method, which solves the problem to some extent, and Figure 5 shows the 5-fold cross validation. In this method, the dataset is divided into k subsets; one subset is selected as the test data without repetition each time; the remaining k-1 subsets are used as the training data; the training is repeated k times; and the mean of the model’s prediction error on the k test data is used as the final model error. In this method, all the samples in the training data necessarily have the opportunity to participate in model training and testing, which enables a fairer evaluation of the robustness and generalisation ability of the model.

2.6.2. Feature Scaling

Features in a dataset vary greatly in size, unit, and range, but many machine learning algorithms (e.g., neural networks) use the Euclidean distance between two samples in their calculations, which, if the data magnitude is not taken into account, results in features with a large scale being much more important than those with a small scale. Therefore, feature scaling is required before modelling to eliminate the data incidental magnitude so that different features have the same scale. Commonly used feature scaling methods include 0–1 normalisation and z-score normalisation, which are calculated as shown in Equations (18) and (19), respectively:
x ~ = x x m i n x m a x x m i n
x ~ = x x ¯ σ
where x represents a feature; x m i n , x m a x , x ¯ , and σ are the minimum, maximum, mean, and variance of the feature in the training set, respectively; and x ~ represents the scaled feature.
(3) Sliding window to construct timing training samples
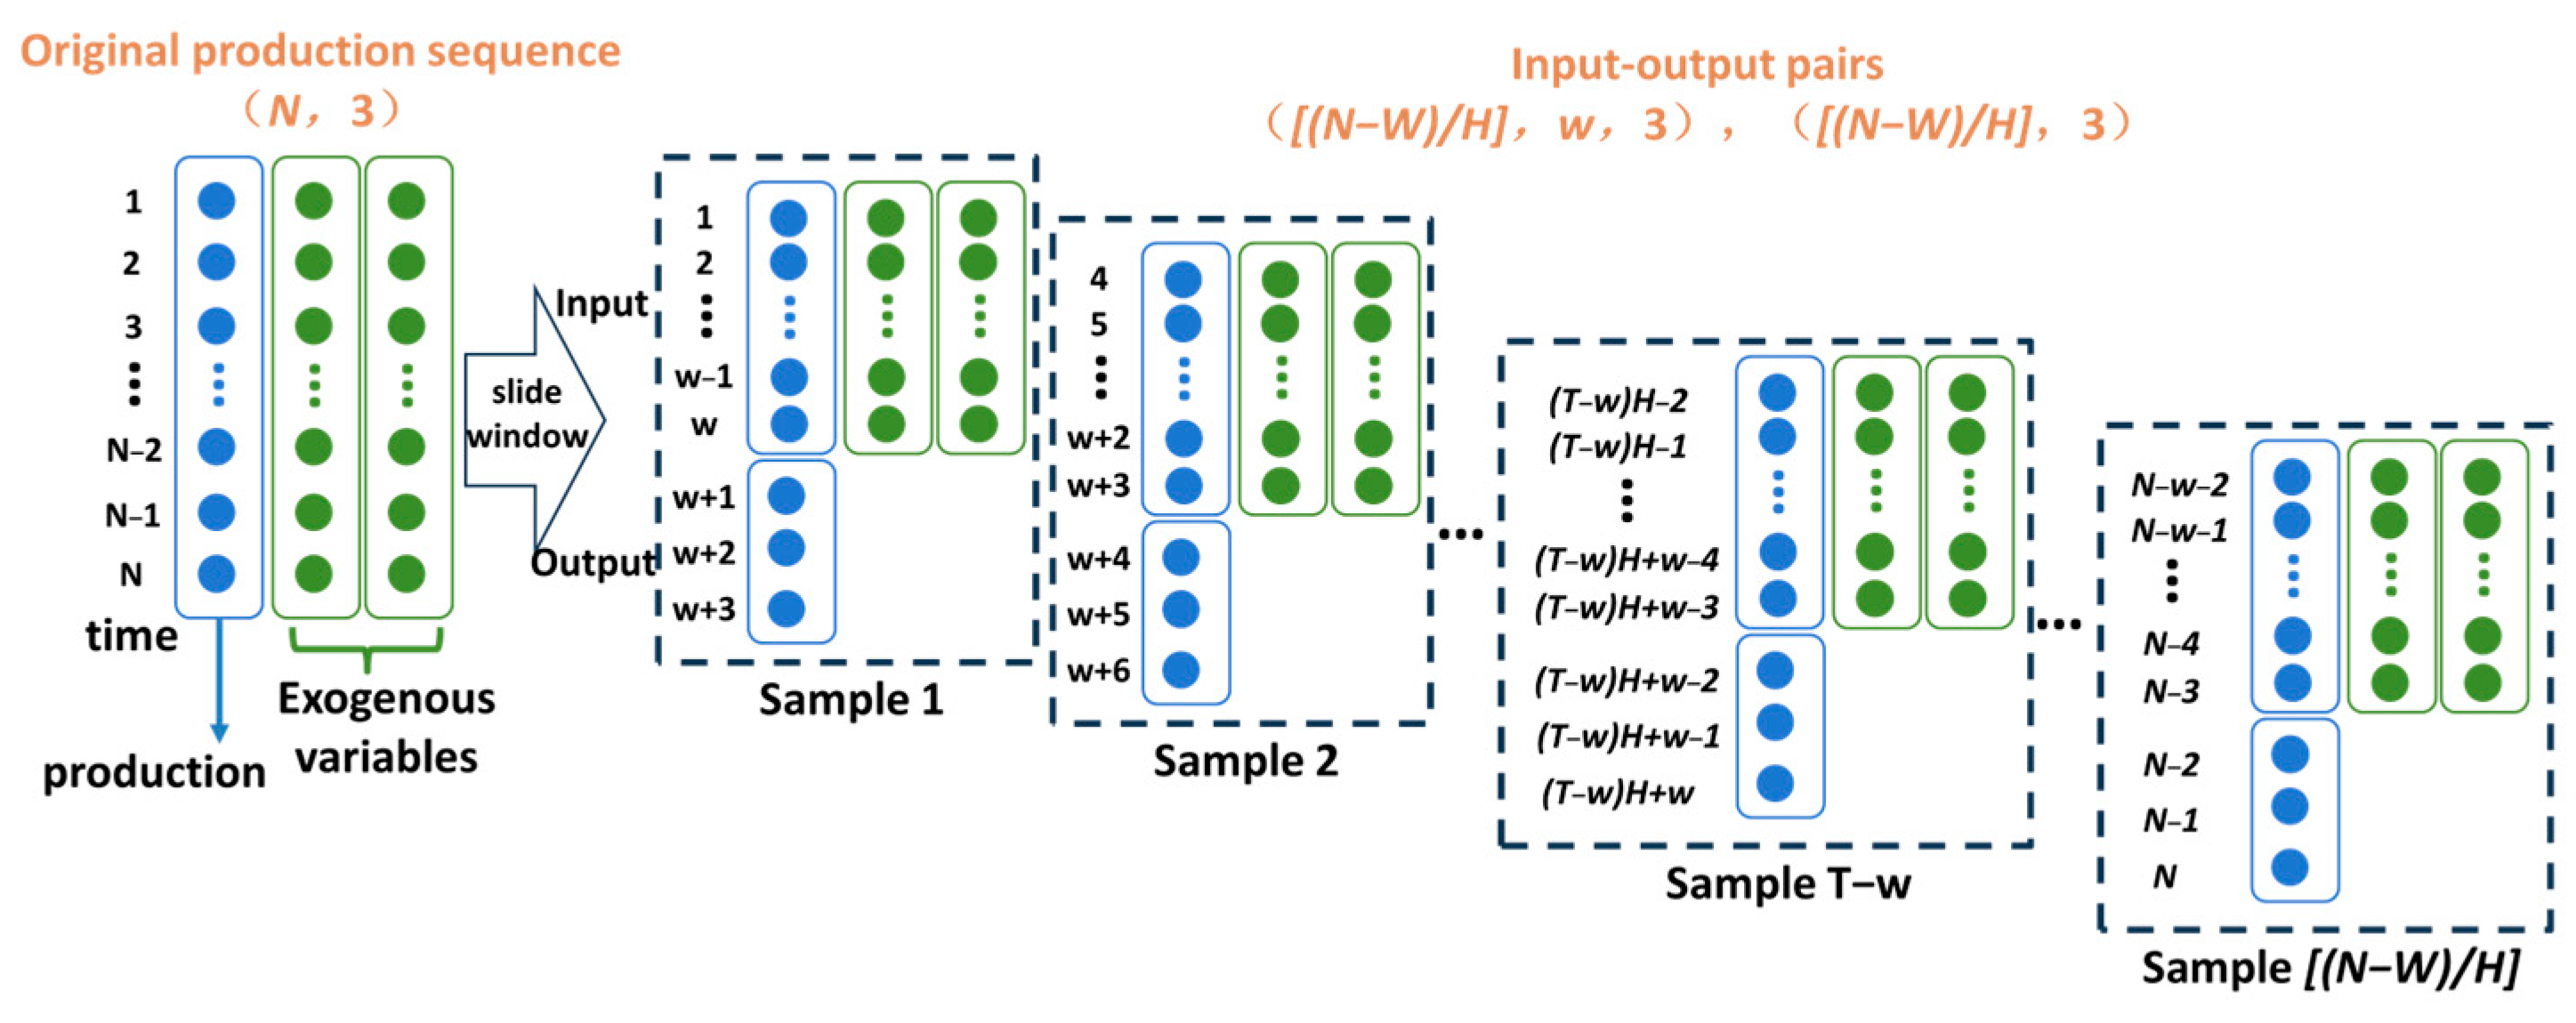
To accommodate the input requirements of the recurrent neural network, the time-series production data collected in the field needs to be converted into input–output pairs using a sliding window approach before it can be used to train the model. Taking single-step time-series prediction as an example, assume that the original production data includes three sequences of length N, one of which is the production sequence, and the other two are exogenous variable sequences, with a window size of w and a prediction step set to H, i.e., predicting the production for the next H days based on the production of the past w days and the data of the exogenous variables. The multi-step temporal sampling approach takes a sliding H-day-at-a-time approach to constructing samples, as shown in Figure 6. Construct the first sample of input–output pairs by taking the data from day 1 to day w as the input to the 1st sample and the production from day w + 1 to w + 3 as the output of the 1st sample. The sliding window slides down by H = 3 days, the data from day 4 to day w + 3 are used as input for the 2nd sample, and the production from day w + 4 to day w + 6 are the outputs of the 2nd sample, constructing the 2nd sample of input–output pairs, and the sliding window slides down by H days again. The process is repeated until the remaining data cannot form another sample. Up to this point, a multi-step input–output pair with input size ( N w H , w, 3) and output dimension ( N w H , 3) is constructed using a sliding window, with a total number of samples n = N w H , where · stands for upward rounding.

3. Results and Discussion

3.1. Experimental Environment

Currently, there are many frameworks developed in the field of deep learning, and the commonly used frameworks by researchers are Tensorflow, Keras, etc. In this paper, we choose to use Tensorflow as the theme framework for the model AT-GRU-MTL in our experiments. Tensorflow is a well-constructed neural network framework, and you can pay less attention to some details of the code when you are writing with Tensorflow, so that you can focus more on the algorithm itself.
In addition to the use of Python 3.7, some simple data processing was also conducting using Excel, Origin. In order to ensure the validity of the experimental results, all the experiments in this paper are run in the same environment; the specific environmental parameters as shown in Table 1.

3.2. Model Indicators

From the perspective of the final revenue of the oilfield, what is ultimately desired is that the daily prediction value can be close to the real value, i.e., the smaller the error between the prediction value and the real value, the better. Therefore, this paper sets three evaluation indexes: mean absolute error (MAE), root mean square error (RMSE), and absolute coefficient (R2).
For reference, the mean absolute error (MAE) is the average of the absolute errors between the predicted values and the true values; the root mean square error (RMSE) characterises the deviation between the predicted values and the observed values; and the absolute coefficient (R2) characterises the degree of agreement between the predicted values and the true values. The specific calculation formulas are shown in Equations (19)–(21):
M A E = 1 N i = 1 N y i f x i
R M S E = i = 1 N ( y i f ( x i ) ) 2 N
R 2 = 1 i = 1 N ( y i f ( x i ) ) 2 i = 1 N ( y i y ¯ ) 2
where N is the number of samples, y i is the true value of the target variable for the ith sample, f x i represents the predicted value of the model with input xi, and y ¯ is the mean value of the target variable for all samples.

3.3. Instance Validation

3.3.1. Inputs of Data

The AT-GRU-MTL model is proposed to be selected for production prediction, and the time-series data of deep CBM wells are collected, and the inputs are daily water production and daily gas production. The pre-processed data are divided into training set and test set according to the ratio of 8:2. That is, the data from eight wells were randomly selected and connected to form the training data used for model training, and two wells were divided into the test set to evaluate the model performance, in which 20% of the training set was used as the validation set to optimise the hyperparameters.

3.3.2. Hyperparameter Optimisation

In order to determine the optimal GRU-MTL model structure, hyperparameters—including the number of layers and neurons, activation function, and history window size—were optimised by means of a Bayesian optimisation algorithm. Consisting of multiple GRU layers and a fully connected layer, the GRU module for each task has different hyperparameters to accommodate yield variations in different phases. The GRU-MTL model was trained for 500 rounds, with 100 samples passed each time for training use. The history window is [5, 50], the prediction range is [5, 30], the range of GRU layers predicting gas (water) production is [1, 5], the range of the number of neurons in the GRU layers predicting gas (water) production is [10, 100], and the learning rate is l_r ∈ [0.0001, 0.01]; Adam is used as the optimiser.
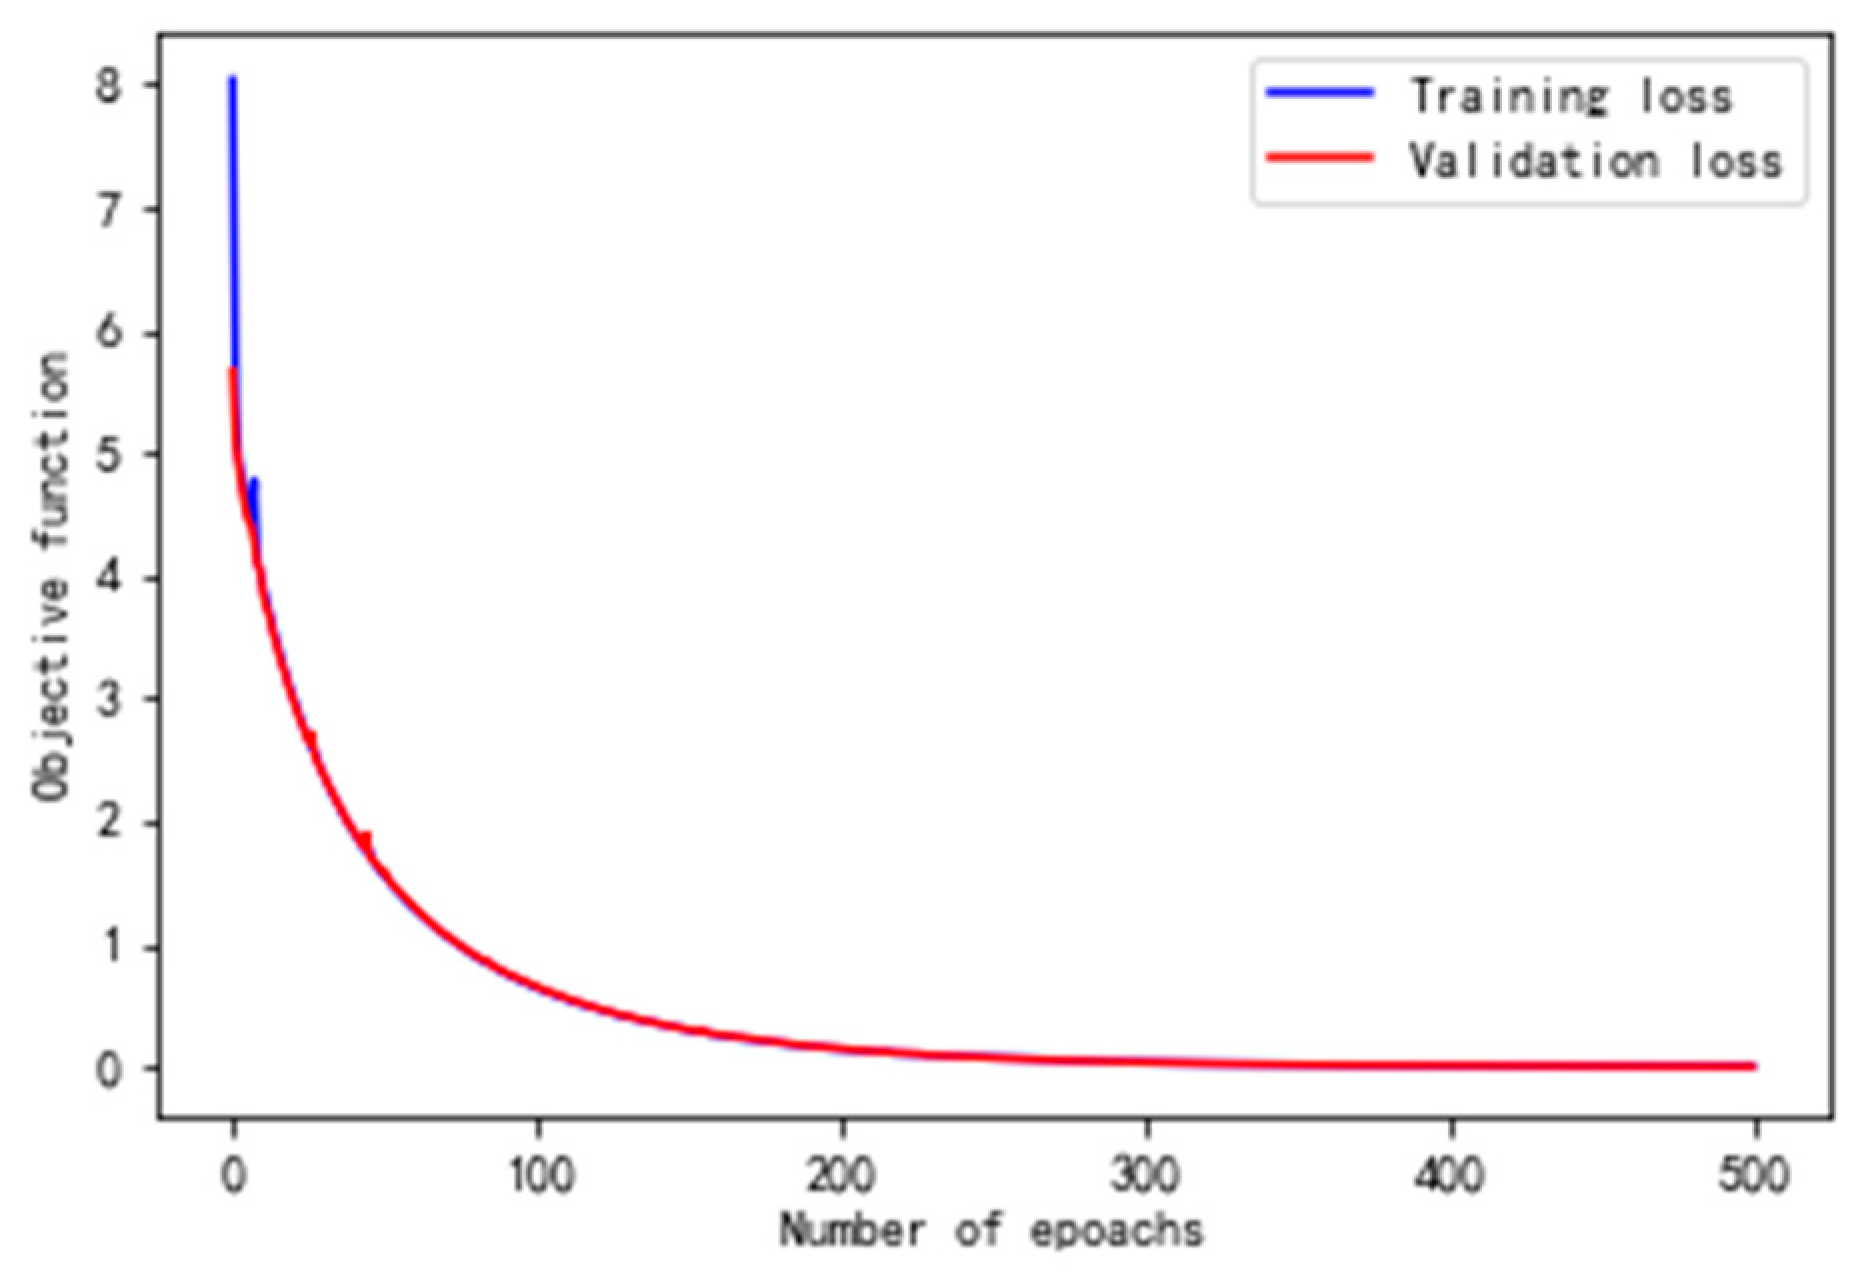
The combination of parameters from Table 2 obtained from the optimisation is substituted into the model, and the results of the change of loss function during the training process are shown in Figure 7. The vertical axis is the loss function of the AT-GRU-MTL model, and the horizontal axis is the training period of the model. The black line represents the training set, and the red line represents the validation set. With the longer and longer training time, the loss function of the training set and the validation set decreases gradually, and the gap between the two is more stable, which indicates that the model is well trained on this dataset, the convergence is within expectation, and there is no overfitting.

3.3.3. Comparison of the Effects of Different Multitasking Models

Wells A and B are test wells, and the AT-GRU-MTL model is trained on different numbers of samples and then predicted in the test wells to evaluate the effect of different numbers of training samples on the prediction effect of the model (Figure 8). The left vertical axis indicates the magnitude of the MAE and RMSE (bars), the right vertical axis indicates the magnitude of the R2 (red line), and the horizontal axis indicates the number of training samples. The left graph shows the effect on the prediction of the production volume, and the right graph shows the effect on the prediction of the production volume. The right figure shows the effect of water production prediction, which shows that with the increase of training samples, the MAE and RMSE of the AT-GRU-MT model gradually decrease, R2 gradually increases, and the prediction accuracy is greatly improved. From Figure 8, it can be seen that the prediction effect is improved by increasing the number of samples, and taking the gas and water production as the target.
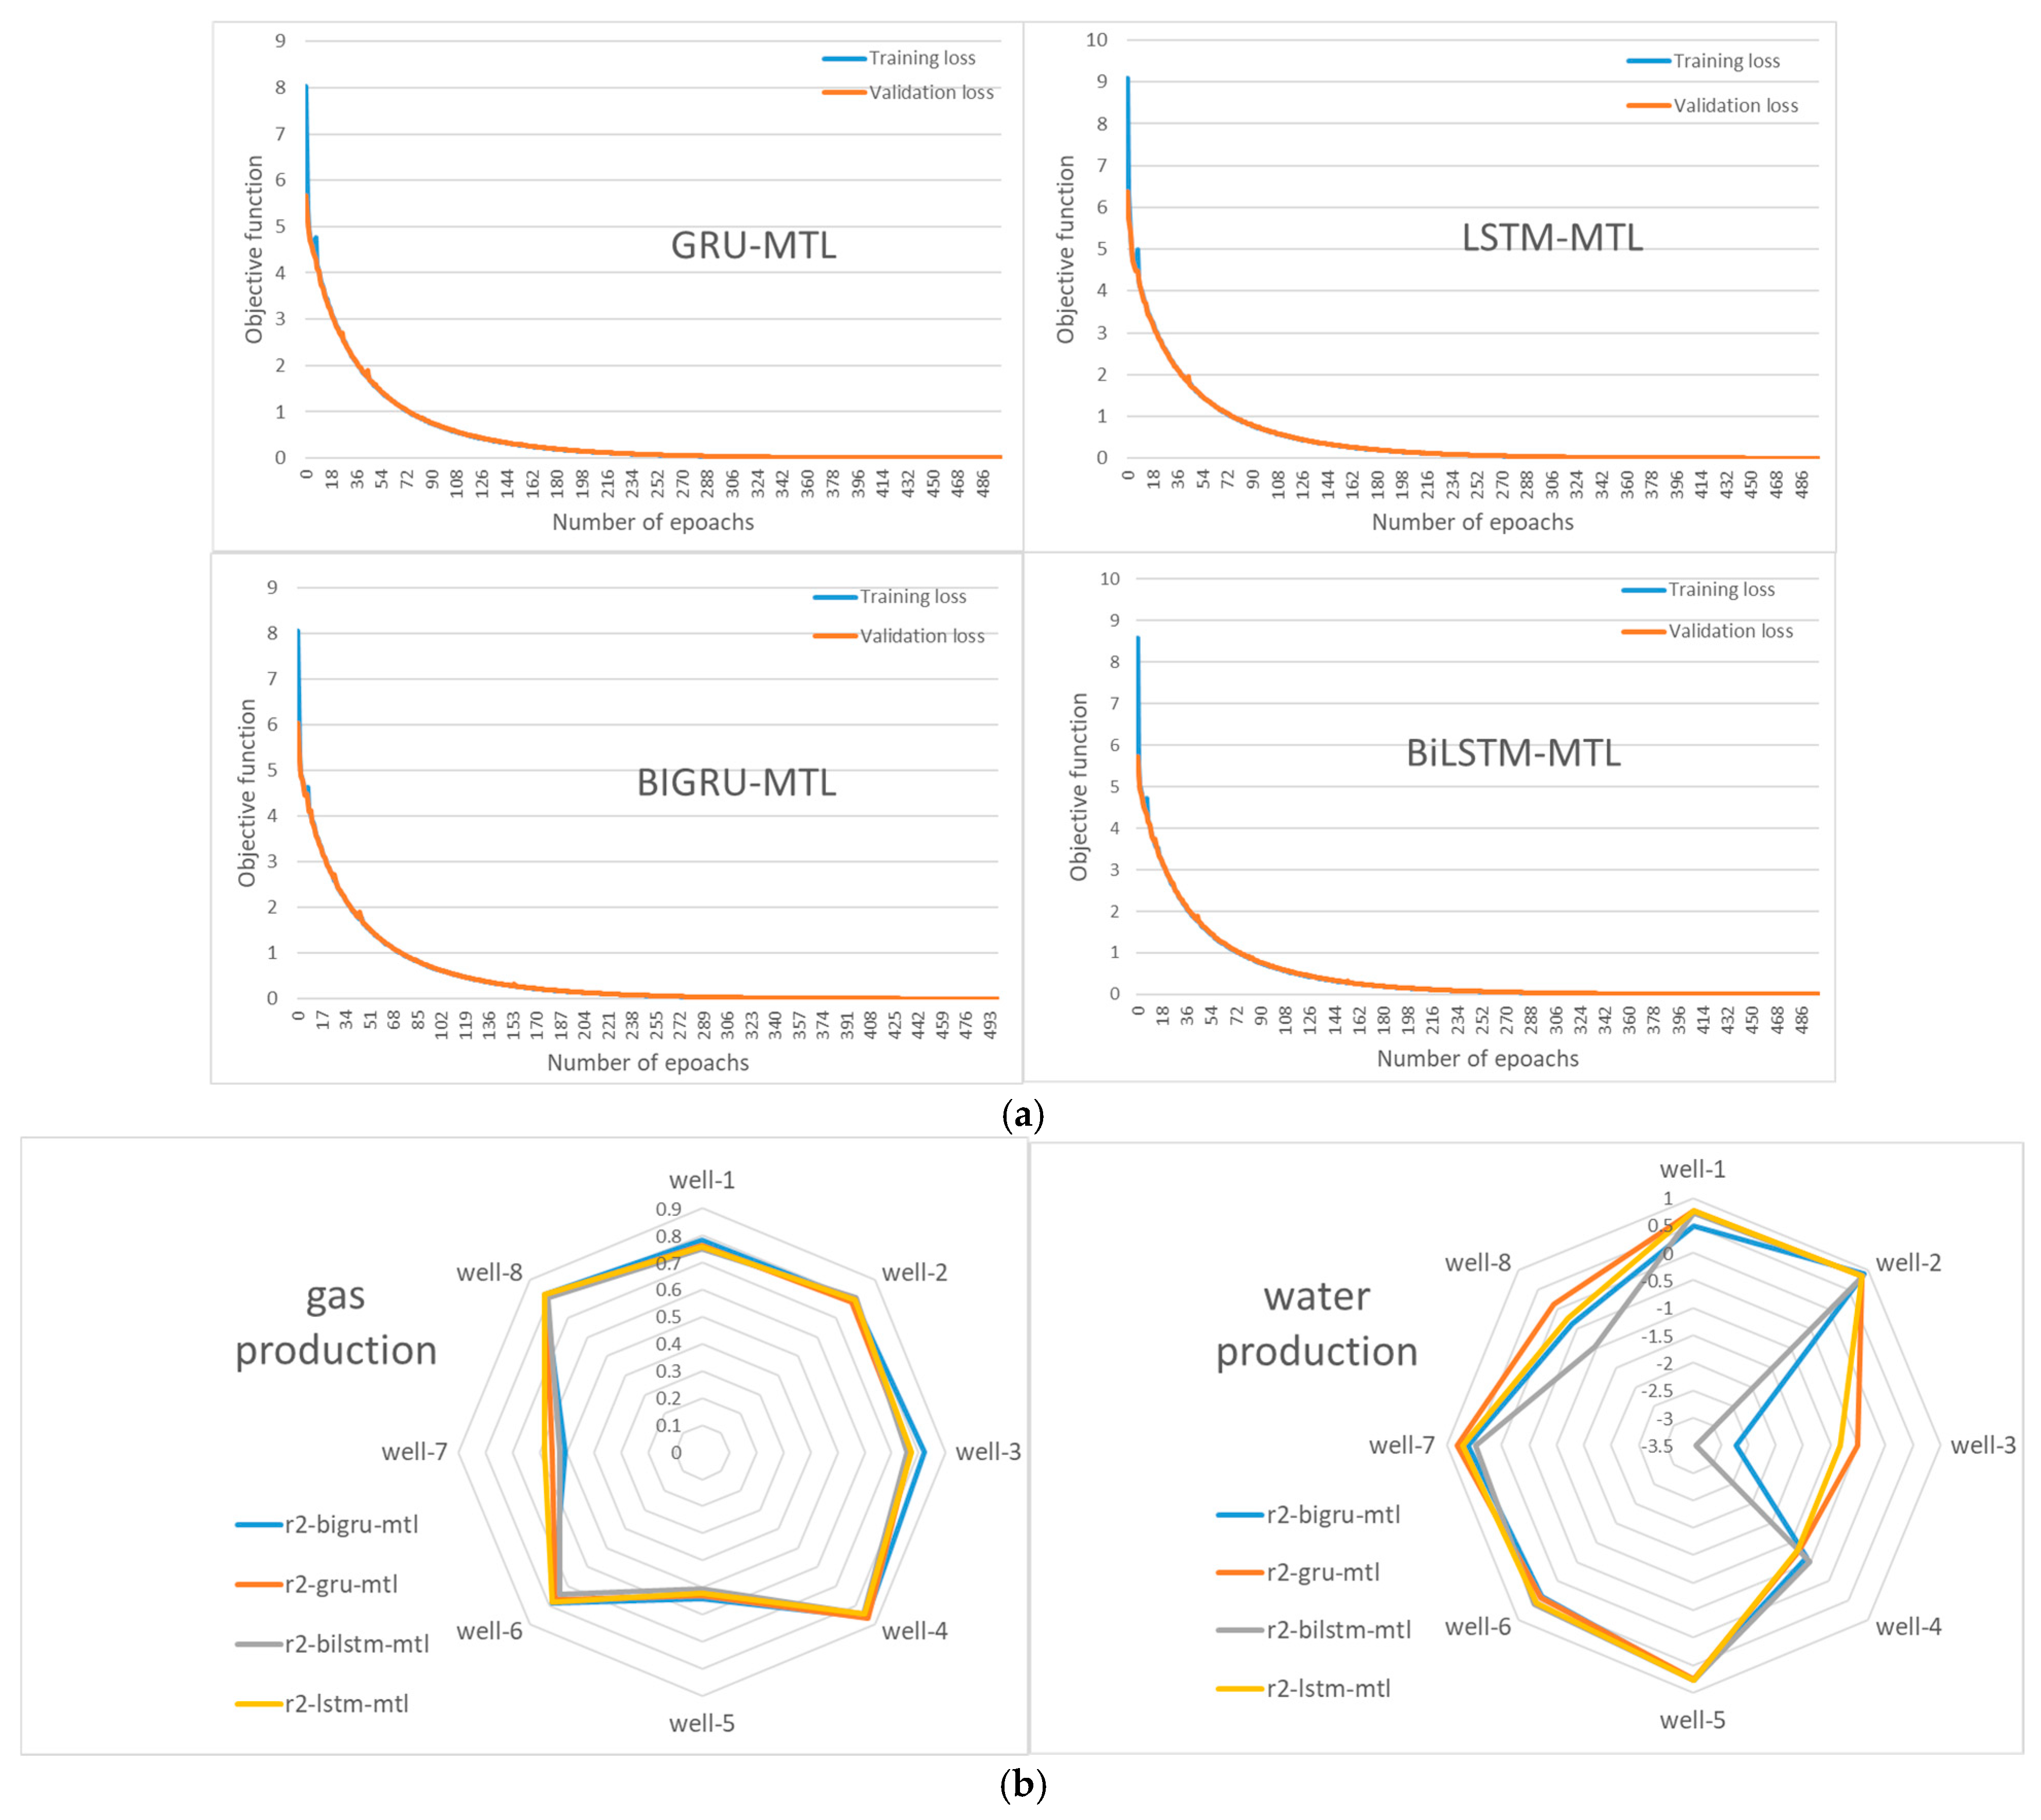
Figure 9a shows the learning effect of AT-LSTM-MTL, AT-GRU-MTL, AT-BiGRU-MTL, and AT-BiLSTM-MTL in the eight training wells. With the increase of training rounds, the model gradually learns the patterns and features of the data, the performance indexes are gradually improved, and the error of the training set gradually decreases and tends to converge; the validation set likewise decreases in error and tends to be stable, indicating that the model’s generalisation ability in unknown data is also better; the errors in the training set and validation set are extremely similar, and the four models show a good fit. Figure 9b shows the learning effect of the four models in each training well, and using R2 as an evaluation metric, the four multi-tasking model training performs well in terms of gas production, while the LSTM-MTL and GRU-MTL perform well in terms of gas production. LSTM-MTL and GRU-MTL outperform BiGRU-MTL and BiLSTM-MTL in water production. The latter’s poorer water production prediction stems from the order-of-magnitude difference of 20 to 215 times between the gas and water production data; the loss gradient of gas production is much larger than that of water production, and the model is more inclined to optimise the gas production prediction; in the bidirectional propagation, the error signals of water production prediction may be swamped by the gas production; in the two-way propagation, the error signal of water production prediction may be overwhelmed by gas production; in the network layer shared by water and gas production, there may be task conflicts, and inappropriate correlations are learnt, thus ‘suppressing’ the learning of water production, which is more advantageous than the one-way model.
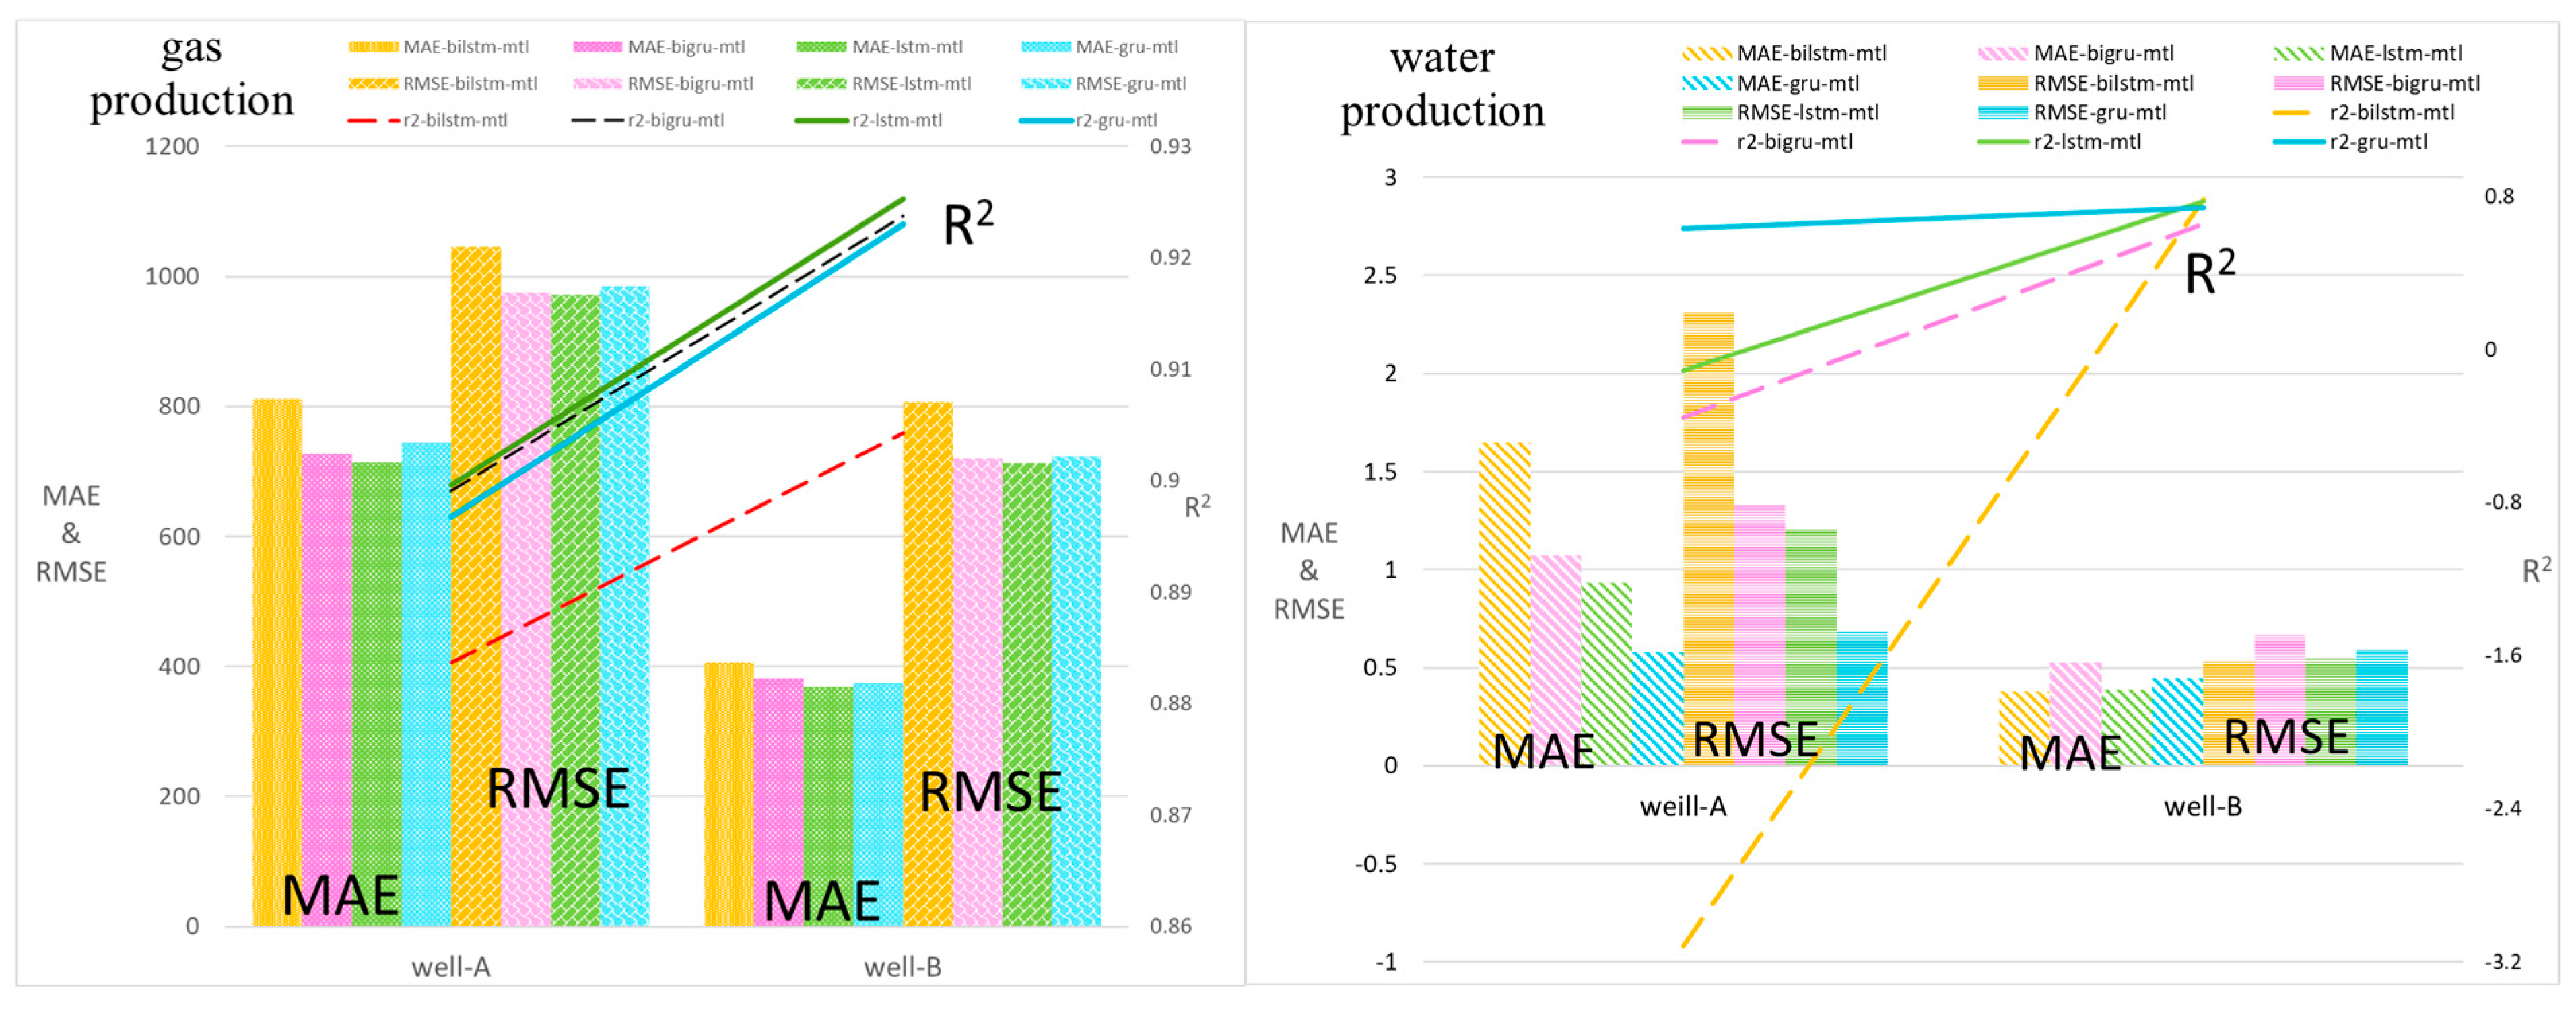
Figure 10 compares the prediction performance of AT-LSTM-MTL, AT-GRU-MTL, AT-BiGRU-MTL, and AT-BiLSTM-MTL models in test wells A and B. The left vertical axis indicates the magnitude of MAE and RMSE (bars), and the right vertical axis indicates the magnitude of R2 (straight line). The prediction of BiLSTM-MTL is inferior to that of the remaining three models in terms of gas production, and the production of water GRU-MTL has the best performance. In order to balance the two tasks of predicting gas production and water production, GRU-MTL is more advantageous. Figure 10 shows the comparison of the evaluation indexes of the four models, and Figure 11 shows the prediction curves of the two test wells A and B specifically, observing how much the error between the prediction curves and the real production curves is. (a) and (b) are the comparison of the real and predicted values of the gas production and water production of wells A and B, which correspond to the evaluation indexes of Figure 10: the BiLSTM-MTL gas production prediction performance is poor, and the GRU-MTL gas production prediction performance is the best.
Figure 12 compares the absolute coefficients (R2) of the four models LSTM-MTL, GRU-MTL, BiGRU-MTL, and BiLSTM-MTL on the dataset. Overall, the GRU-MTL model has a higher and narrower range, indicating that for wells with a very large difference in order of magnitude, the unidirectional multi-task model GRU-MTL is more capable of avoiding small order of magnitude data in the yield sequence of the learning suppression and effectively improves the accuracy. Table 3 quantitatively describes the overall prediction performance of the above models in the tasks, and the prediction effect of GRU-MTL on water production is greatly improved.

3.3.4. Adaptability of the Model to Wells

The test wells selected in the previous section produced for 467 and 533 days. The test wells producing for 380 and 709 days are selected in this section to compare the prediction performance of the GRU-MTL model for wells producing for more than one year and one-and-a-half years. Figure 13 shows that the R2 mean values of the wells with production lengths of 467 and 533 days in terms of gas production and water production are 0.91 and 0.69, and the R2 mean values of the wells with production lengths of 380 days and 709 days are 0.54 and 0.45 for gas and water production. The results show that the wells with production from 1 year to 1.5 years have better prediction performance.
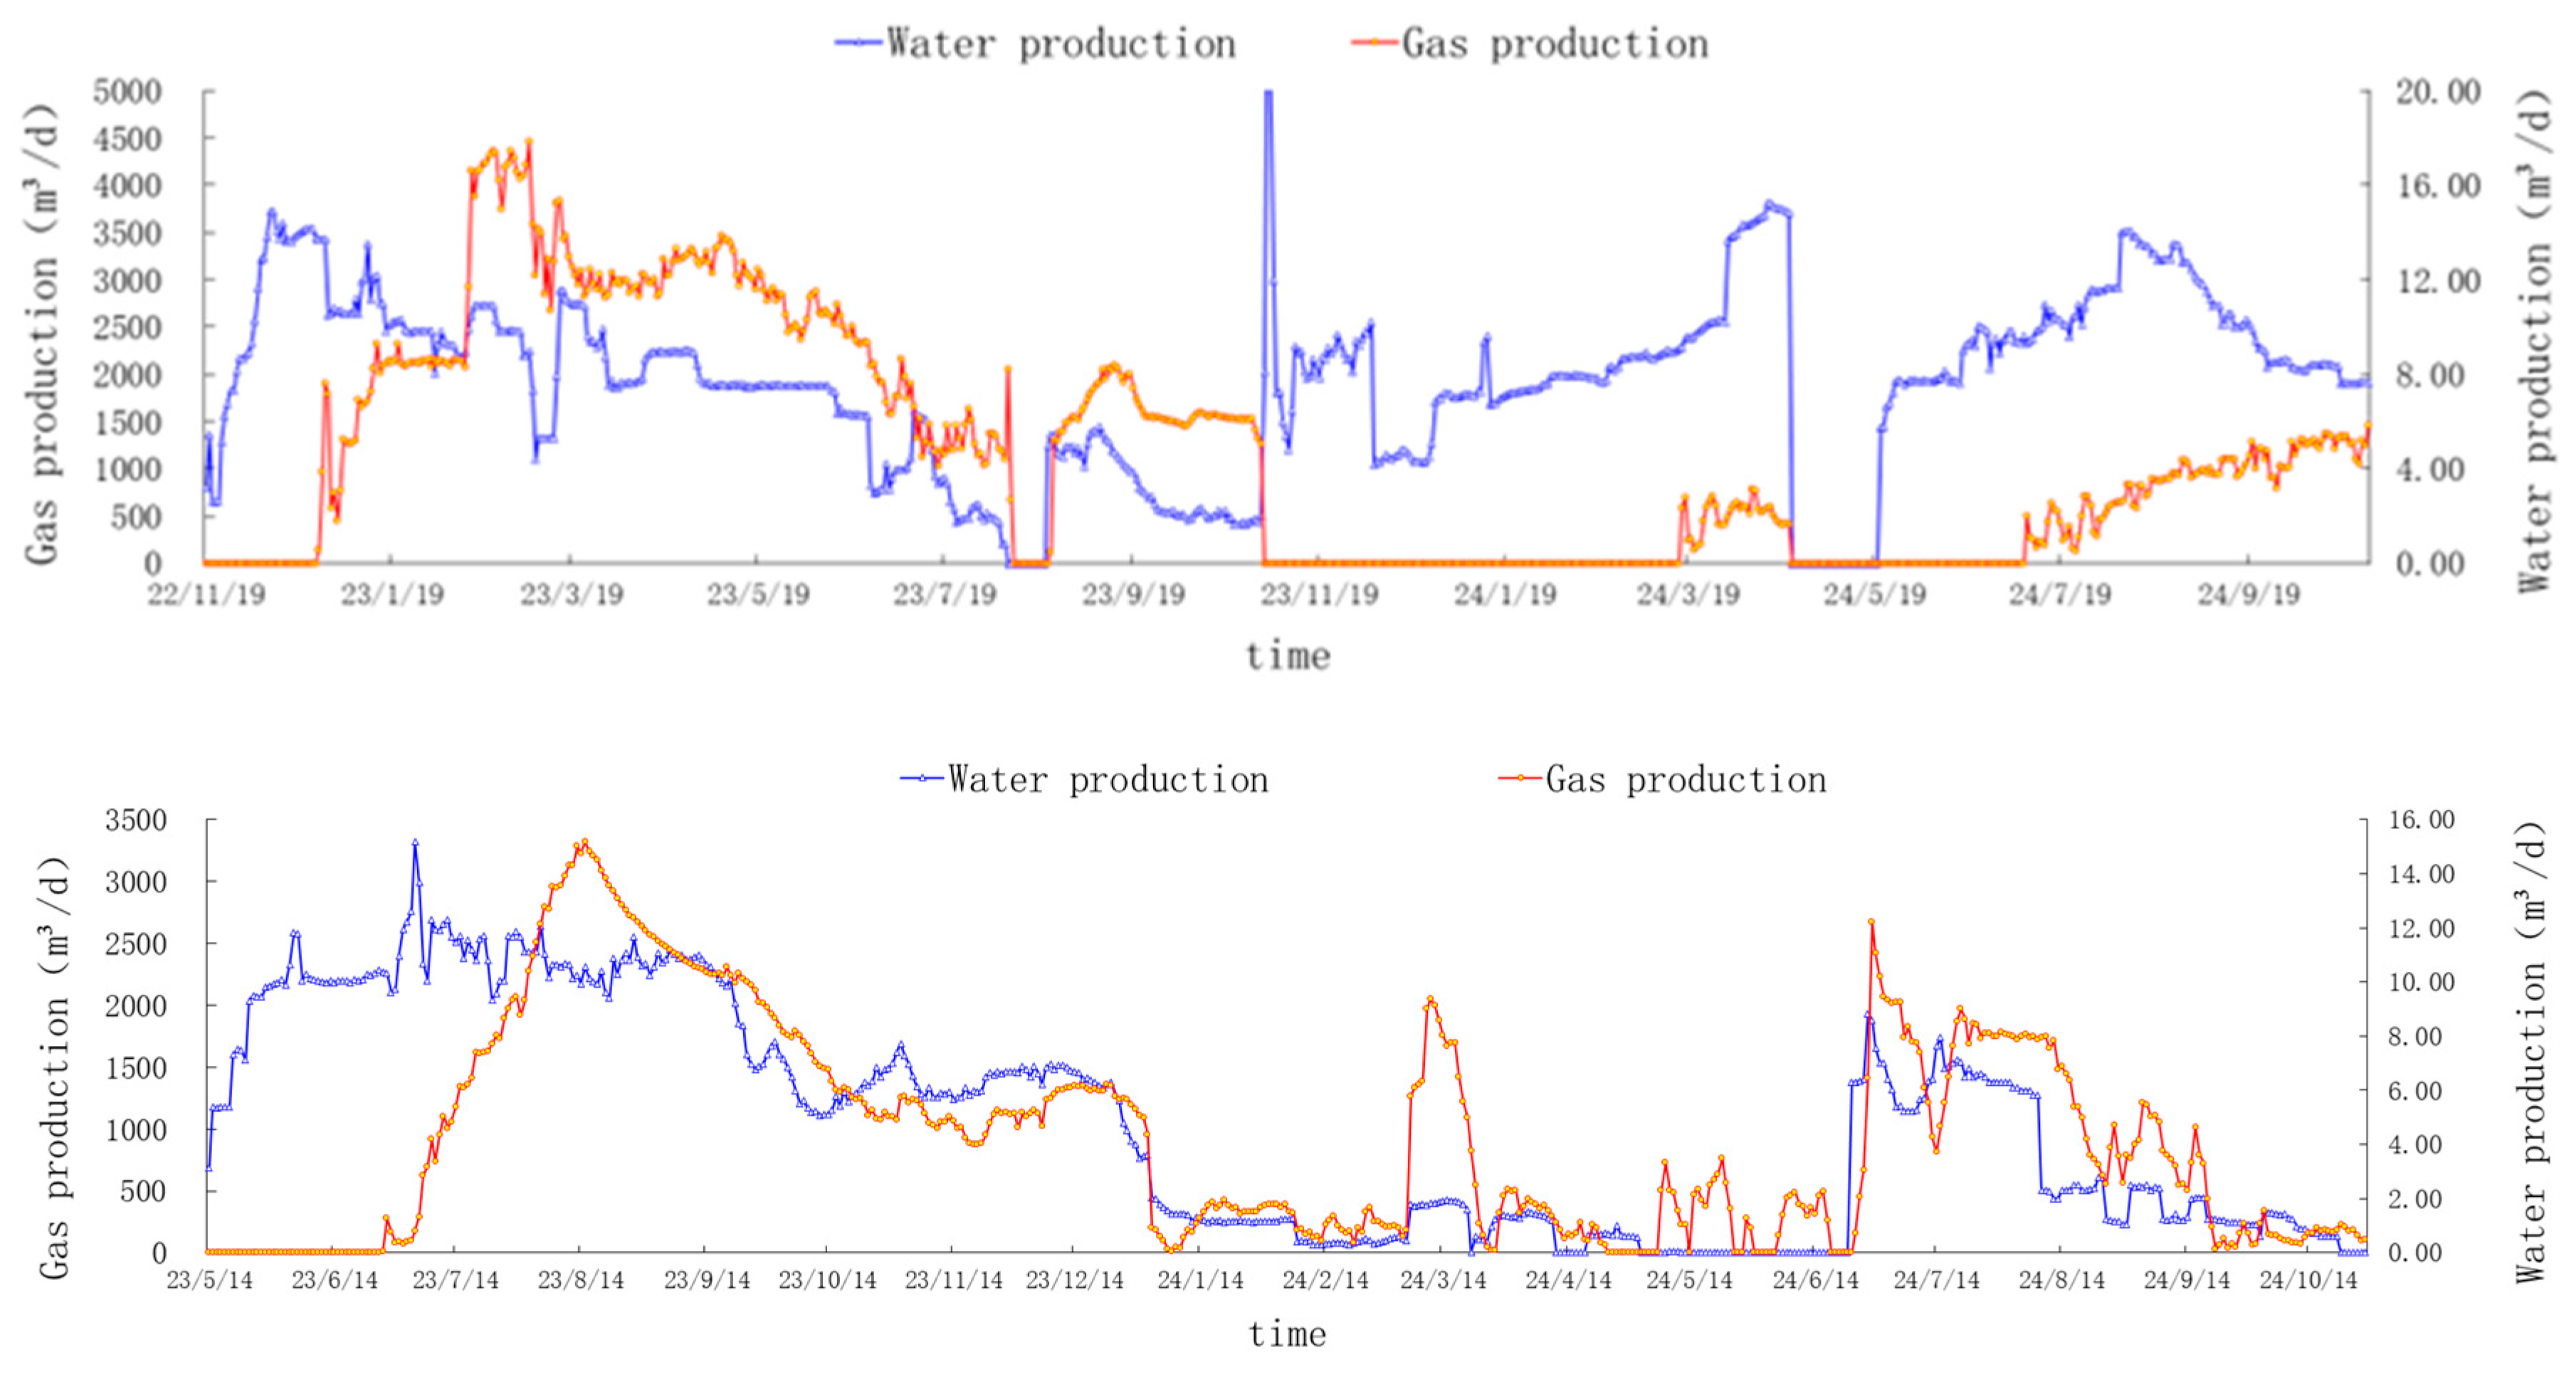
From Figure 14 drainage and extraction curves, it can be seen that the 709-day test wells enter the late stage of decreasing, reflecting the failure of the model’s generalisation to the dynamics of matrix contraction–desorption coupling. The low prediction accuracy may originate from the dynamically changing stress sensitivity coefficients and the intrusion of foreign water (water tampering from the neighbouring wells, etc.); 380-day test wells are in the middle stage of draining and depressurisation, and the two-phase flow of gas and water has not yet been stabilised, reflecting the model’s sensitivity to the sudden change of the ratio of gas and water. This reflects the sensitivity of the model to sudden changes in the gas–water ratio, which is insufficient; the physical characteristic constraints can be introduced to improve the prediction accuracy.

4. Conclusions

(1) The prediction performance of coalbed methane wells in Shenfu Linxing block is compared among four models, AT-LSTM-MTL, AT-GRU-MTL, AT-BiGRU-MTL, and AT-BiLSTM-MTL, and the R2 of the AT-GRU-MTL model for predicting gas and water production is 0.767 and 0.379, respectively, which takes into account the effect of the two, whereas the bi-directional model can easily suppress the effect of small-order-of-magnitude data learning.
(2) Based on the AT-GRU-MTL model, the applicability of coalbed methane wells with different production lengths is discussed, and the results show that wells producing for 1 year to 1.5 years have R2 mean values of 0.91 and 0.69 in predicted gas and water production, which are more adaptable to the model. Physical constraints or division of stage data should be introduced to enhance the effect for the wells with a shorter or excessively long span in the follow-up.

Author Contributions

Conceptualization, H.W.; Methodology, H.W., J.W., Y.Z. (Ying Zhu), X.X., G.W., S.Z., C.X. (Chengang Xian), N.L., C.X. (Cong Xiao) and Y.Z. (Ying Zhou); Software, J.W., X.X., Y.Z. (Ying Zhou) and L.Z.; Validation, J.W., C.X. (Chengang Xian), N.L., Y.Z. (Ying Zhou) and L.Z.; Formal analysis, G.W., C.X. (Chengang Xian), C.X. (Cong Xiao) and Y.Z. (Ying Zhou); Investigation, H.W., Y.Z. (Ying Zhu), X.X., S.Z., C.X. (Cong Xiao) and L.Z.; Resources, H.W., G.W., N.L. and L.Z.; Data curation, J.W., X.X. and N.L.; Writing—original draft, H.W., J.W., Y.Z. (Ying Zhu) G.W., C.X. (Chengang Xian), C.X. (Cong Xiao), Y.Z. (Ying Zhou) and L.Z.; Writing—review & editing, X.X. and N.L.; Visualization, Y.Z. (Ying Zhu); Supervision, X.X., S.Z. and C.X. (Chengang Xian); Project administration, S.Z. All authors have read and agreed to the published version of the manuscript.

Funding

This research was funded by China National Offshore Oil Corporation’s major scientific research project “Research on the Mechanism of Deep Coalbed Methane Storage in Linxing Shenfu and Key Technologies for Collaborative Development with Tight Gas” (No. KJGG2024-1007) and National Natural Science Foundation of China (No. 52304055).

Data Availability Statement

Data availability depends on the request.

Acknowledgments

The authors also the editors and reviewers for their critical comments, which is of great improvement to our manuscript.

Conflicts of Interest

The authors declare no conflicts of interest. Authors Heng Wen, Jianshu Wu, Ying Zhu, Xuesong Xing, Guangai Wu and Na Li were employed by the company CNOOC Research Institute Ltd., China. The remaining authors declare that the research was conducted in the absence of any commercial or financial relationships that could be construed as a potential conflict of interest.

References

  1. Men, X.; Lou, Y.; Wang, Y.; Wang, Y.; Wang, L. Effectiveness of The Development of China’s Coalbed Methane Industry Since The 13th Five-Year Plan and Suggestions. Nat. Gas Ind. 2022, 42, 173–178. [Google Scholar]
  2. Huang, Z.; Li, G.; Yang, R.; Li, G. Current Status and Development Trend of Coalbed Methane Development Technology in China. J. Coal 2022, 47, 3212–3238. [Google Scholar]
  3. Li, Y.; Xu, L.; Zhang, S.; Wu, J.; Bi, J.; Meng, S.; Tao, C. Differences in Gas-Bearing Systems of Deep Coal Seams and Development Countermeasures. J. Coal Sci. 2023, 48, 900–917. [Google Scholar]
  4. Tang, S.; Qian, Z.; Pan, Z.; Guo, Q.; Zhang, S. Evaluation of Geological Features for Deep Coalbed Methane Reservoirs in The Dacheng Salient, Jizhong Depression, China. Int. J. Coal Geol. 2014, 133, 60–71. [Google Scholar]
  5. Xu, F.; Wang, C.; Xiong, X.; Li, S.; Wang, Y.; Guo, G.; Yan, X.; Chen, G.; Wang, H. Deep Coalbed Methane Formation Mode and Key Technology Countermeasures--Taking the Eastern Edge of Ordos Basin as an Example. China Offshore Oil Gas 2022, 34, 30–42+262. [Google Scholar]
  6. Li, X.; Ma, X.; Xiao, F.; Xiao, C.; Wang, F.; Zhang, S. Multistep Ahead Multiphase Production Prediction of Fractured Wells Using Bidirectional Gated Recurrent Unit and Multitask Learning. SPE J. 2023, 28, 381–400. [Google Scholar] [CrossRef]
  7. Chen, W.; Shi, Q.; Cheng, D.; Wang, J. Application of ARIMA Model in The Study of Decreasing Production Law of Oil and Gas Fields. West China Sci. Technol. 2010, 9, 21–23, 59. [Google Scholar]
  8. Wang, Y.; Li, Z.; Liu, C. Coalbed Methane Production Forecast Based on Fractal and ARIMA. Nat. Gas Pet. 2011, 29, 45–48, 87. [Google Scholar]
  9. Gupta, S.; Fuehrer, F.; Jeyachandra, B.C. Production Forecasting in Unconventional Resources Using Data Mining and Time Series Analysis. In Proceedings of the SPE Canada Unconventional Resources Conference, Calgary, AB, Canada, 30 September–2 October 2014; p. D011S004R008. [Google Scholar]
  10. Olominu, O.; Sulaimon, A.A. Application of Time Series Analysis to Predict Reservoir Production Performance. In Proceedings of the SPE Nigeria Annual International Conference and Exhibition, Lagos, Nigeria, 5–7 August 2014; p. SPE-172395. [Google Scholar]
  11. Yang, L.; Wu, Y.; Wang, J.; Liu, Y. A Review of Recurrent Neural Network Research. Comput. Appl. 2018, 38, 1–6+26. [Google Scholar]
  12. Deng, R. Research on SD Gas Field Reserve and Production Prediction Algorithm Based on Machine Learning. Master’s Thesis, Chengdu University of Technology, Chengdu, China, 2019. [Google Scholar]
  13. Sun, J.; Ma, X.; Kazi, M. Comparison of Decline Curve Analysis Dca with Recursive Neural Networks Rnn for Production Forecast of Multiple Wells. In Proceedings of the SPE Western Regional Meeting, Garden Grove, CA, USA, 25 April 2018. [Google Scholar]
  14. Lee, K.; Lim, J.; Yoon, D.; Jung, H. Prediction of Shale-gas Production at Duvernay Formation Using Deep-learning Algorithm. SPE J. 2019, 24, 2423–2437. [Google Scholar] [CrossRef]
  15. Li, X. Data-Driven Production Prediction Method and Application Research on Fractured Horizontal Wells. Ph.D. Thesis, China University of Petroleum (Beijing), Beijing, China, 2023. [Google Scholar]
  16. Zhu, L. Research on Coalbed Methane Production Capacity Prediction and Optimisation of Discharge and Mining System Based on Deep Learning. Master’s Thesis, China University of Petroleum (Beijing), Beijing, China, 2022. [Google Scholar]
  17. Gao, Y. Research on Coalbed Methane Production Forecasting by Graph Neural Network Based on Spatio-Temporal Characteristics of Output Sequence. Master’s Thesis, China University of Mining and Technology, Xuzhou, China, 2022. [Google Scholar]
  18. Liu, W. Intelligent Prediction of Production Capacity of Coalbed Methane Hydraulic Fracturing Wells. Master’s Thesis, China University of Petroleum (Beijing), Beijing, China, 2022. [Google Scholar]
  19. Razak, S.M.; Cornelio, J.; Cho, Y.; Liu, H.-H.; Vaidya, R.; Jafarpour, B. Transfer Learning with Recurrent Neural Networks for Long-term Production Forecasting in Unconventional Reservoirs. SPE J. 2022, 27, 2425–2442. [Google Scholar] [CrossRef]
  20. Chaikine, I.A.; Gates, I.D. A Machine Learning Model for Predicting Multi-stage Horizontal Well Production. J. Pet. Sci. Eng. 2021, 198, 108133. [Google Scholar] [CrossRef]
  21. Werneck, R.; Prates, R.; Moura, R.; Gonçalves, M.M.; Castro, M.; Soriano-Vargas, A.; Júnior, P.R.M.; Hossain, M.M.; Zampieri, M.F.; Ferreira, A.; et al. Data-driven Deep-learning Forecasting for Oil Production and Pressure. J. Pet. Sci. Eng. 2022, 210, 109937. [Google Scholar] [CrossRef]
  22. Hu, G.; Zhao, Y.; Wang, L.; Li, T.; Tang, Z.; Guo, D. Application of Bp Neural Network Model in Productivity Prediction and Evaluation of Cbm Wells Fracturing. In Proceedings of the 6th Annual International Conference on Material Science and Engineering (ICMSE2018), Suzhou, China, 22–24 June 2018; IOP Publishing: Bristol, UK, 2018; p. 012070. [Google Scholar]
  23. Xue, Y.; Liao, X.J.; Carin, L.; Krishnapuram, B. Multi-Task Learning for Classification with Dirichlet Process Priors. J. Mach. Learn. Res. 2007, 8, 35–63. [Google Scholar]
  24. Misra, I.; Shrivastava, A.; Gupta, A.; Hebert, M. Cross-stitch Networks for Multi-task Learning. In Proceedings of the IEEE Conference on Computer Vision and Pattern Recognition (CVPR), Las Vegas, NV, USA, 27–30 June 2016; pp. 3994–4003. [Google Scholar]
Figure 1. GRU structure diagram.
Processes 13 01787 g001
Figure 2. Comparison between (a) single-task learning and (b) multi-task learning.
Processes 13 01787 g002
Figure 3. Cross-stitch unit schematic.
Processes 13 01787 g003
Figure 4. Schematic diagram of the structure of the attention mechanism.
Processes 13 01787 g004
Figure 5. k-fold cross validation dataset segmentation method (5-fold cross as an example).
Processes 13 01787 g005
Figure 6. Sliding window in multi-step timing prediction moves H units at a time.
Processes 13 01787 g006
Figure 7. Evolution of learning curve.
Processes 13 01787 g007
Figure 8. Comparison of GRU-MTL prediction performance with different training samples.
Processes 13 01787 g008
Figure 9. Learning effects of AT-LSTM-MTL, AT-GRU-MTL, AT-BiGRU-MTL, and AT-BiLSTM-MTL models. (a) Learning curves; (b) R2 comparison plot for training wells.
Processes 13 01787 g009
Figure 10. Predictive performance of AT-LSTM-MTL, AT-GRU-MTL, AT-BiGRU-MTL, and AT-BiLSTM-MTL on test wells.
Processes 13 01787 g010
Figure 11. Predicted results on test wells. (a) Well-A; (b) Well-B.
Processes 13 01787 g011
Figure 12. Predicted performance of the dataset ((left) gas production/(right) water production). The forks symbolise mean values, whilst the circles represent noisy data or anomalous extremes.
Processes 13 01787 g012
Figure 13. R2 comparison of GRU-MTL for wells with different production durations.
Processes 13 01787 g013
Figure 14. Production curve ((top) 708 days/(bottom) 380 days).
Processes 13 01787 g014
Table 1. Running environment parameters.
Parameter NameParameter
Operating systemWindows 10 64-bit
processorsIntel(R) Core (TM)i5-1035G1CPU
IDEAnaconda3
programming languagePython 3.7
Table 2. Optimal hyperparameters.
Model ParameterValueActivation Function
GRU layer feature number (gas)5/45Sigmoid
GRU layer feature number (water)2/100Relu
Number of features in shared layer5/100Relu
Window sizes (history/future)10/5/
Learning rate0.001/
Table 3. Mean comparison of predicted performance.
ModelMean Value of R2
Gas ProductionWater Production
bigru-mtl0.773−0.023
bilstm-mtl0.752−0.382
gru-mtl0.7670.379
lstm-mtl0.7700.243
Disclaimer/Publisher’s Note: The statements, opinions and data contained in all publications are solely those of the individual author(s) and contributor(s) and not of MDPI and/or the editor(s). MDPI and/or the editor(s) disclaim responsibility for any injury to people or property resulting from any ideas, methods, instructions or products referred to in the content.