1. Introduction
With the deepening of China’s coalbed methane exploration and development process, coalbed methane reserves have reached 2 × 10
8 m
3 [
1,
2,
3,
4]. At the same time, high-yield coalbed methane gas in the eastern margin of the Ordos Basin also marks a new stage of coalbed methane exploration and development in China [
5,
6,
7]. A large number of studies show that the pore fracture structure of the coal seam is a factor restricting the production of coalbed methane because pore fracture provides sufficient space for adsorbed gas and free gas. The adsorption space of adsorbed gas is provided by the specific surface area of the micropores in the coal reservoir. The channel in which the desorption of coalbed methane is transported to the outside of the wellbore is well provided by the developed face and end cut faces in the coal reservoir [
8,
9,
10]. Therefore, the pore fracture structure of the coal reservoir has become one of the factors restricting the production of coalbed methane.
At present, scholars have made a lot of achievements in the study of the pore fracture structure of coal reservoirs. The literature shows that representation methods of pore fracture structure include carbon dioxide adsorption, cryogenic liquid nitrogen adsorption, and high-pressure mercury intrusion test. High-pressure mercury intrusion is one of the important methods representing the pore structure of the seepage pore (>100 nm), which has the advantages of speed, simplicity, and wide test range [
11,
12,
13,
14,
15]. At the same time, due to the adsorption performance of nitrogen and carbon dioxide, the pore structure of 2~100 nm was mainly characterized by liquid nitrogen test. The pore structure of micropores (<2 nm) is mainly characterized by carbon dioxide adsorption [
16,
17,
18]. Based on the above experimental results, relevant scholars began to use fractal theory to quantitatively represent the heterogeneity of different pore sizes and pore volumes, and they discussed effective methods to affect the heterogeneity of pore volume and pore structure by combining coal grade, industrial composition, and mineral content. Relevant studies have shown that the fractal dimension value based on MIP has a significant correlation with
Ro.max and mineral components. The fractal dimension value based on liquid nitrogen test has a strong correlation with the pore volume of 2~50 nm [
19,
20,
21,
22]. The fractal dimension value based on CO
2 adsorption has a good correlation with the specific surface area and pore volume of micropores.
In summary, a lot of research has been conducted on the quantitative characterization of the heterogeneity of the pore fracture structure of coal reservoirs [
23,
24,
25,
26]. However, the study of the pore fracture structure of the middle and low rank coal in the Jurassic of Xinjiang is weaker. In particular, the constraints of pore fracture heterogeneity need to be discussed. At present, the influencing factors of pore fracture structure of coal reservoirs have been studied and discussed, but there are few studies on coalbed methane productivity under the constraints of pore fracture structure, which restricts the in-depth understanding of the impact of pore fracture structure on coalbed methane productivity.
Based on this, Coal seam 10 in the middle section of the Jurassic Tariqi region of the Kuqa mining area in Xinjiang has been chosen as the target coal seam for the research in this paper. In addition, carbon dioxide adsorption, cryogenic liquid nitrogen, and high-pressure mercury intrusion, as well as coal microscopic components, were used to measure the pore volumes of different pore sizes at different stages and quantitatively characterize them. By the theory of single weight and multiple fractal formations, the heterogeneity of the pore fracture structure of coal reservoir is expressed, and the influencing factors of the heterogeneity of the pore fracture structure and the pore volume are also discussed. Finally, taking the pore fracture structure of coal reservoir as a variable, the numerical model of coalbed methane emission and the production of the target coal seam in the study area was constructed. Coalbed methane production under different pore structure constraints was also discussed. This study can provide some theoretical reference for the study of coalbed methane emission and recovery in mining areas in Kuqa area of Xinjiang.
2. Geological Setting and Experiments Methods
2.1. Geological Setting
The coal sample was taken from the Middle Jurassic Tuliqike Formation, coal seam 10, in the A’ai mining area of Kuche city, Xinjiang. The mining area is located in the southern foothills of the Tianshan Mountains, at the northern edge of the Tarim Basin, in a region characterized by a gentle sloping terrain that is higher in the north and west and lower in the south and east. The exposed strata, from oldest to youngest, includes the Upper Triassic Huangshanjie Formation (T3hs), the Lower Jurassic Tuliqike Formation (Jlt), the Ahhe Formation (Jla), and the Quaternary (Q4) deposits. The Lower Jurassic Tuliqike Formation (Jlt) is composed of grayish-white and light gray-green coarse sandstone, medium sandstone, and conglomerate, with interbeds of gray and gray-green fine sandstone, siltstone, carbonaceous mudstone, and coal seams, as well as thin layers of siderite.
The study area is characterized as a southward-inclined monoclinal structure. The strata exhibit an east–west strike, with dip directions ranging from 175~20° and dip angles mostly between 9 and 13 degree, averaging approximately 10. The fault structures are poorly developed, and the structural type is classified as simple [
27,
28]. The middle section of Formation (J
1t
2) represents the primary coal-bearing section in the region, with an average stratal thickness of 123.66 m. This section contains seven coal seams, numbered 6 through 12, with an average total thickness of clean coal measuring 15.65 m and a coal coefficient of 12.58%. Among these, four seams are mineable or locally mineable, with an average total thickness of mineable coal seams amounting to 13.55 m. The details of the samples collected during this study are presented in
Table 1.
2.2. Experimental Methods
Samples collected are wrapped in plastic wrap and transported to the laboratory for preliminary testing and processing according to GB/T19222-2003 [
29]. The macroscopic coal rock types of the coal samples are analyzed in accordance with the Chinese national standard GB/T18023-2000 [
30]. Polished thin sections of 3 × 3 cm
2 are prepared according to GB/T 6948-1998 for microscopic component analysis [
31]. All samples are subjected to industrial analysis in compliance with GB/T 212-2001 [
1,
24,
32].
For MIP analysis, three to four samples were selected and subjected to thorough drying pretreatment at 105 °C to eliminate residual moisture while preserving the integrity of their native pore structures. The pore conditions were evaluated using an AutoPore IV 9500 fully automated mercury porosimeter, which controlled the mercury injection process across an extensive pressure spectrum ranging from 0 to 60,000 psia, and each pressure point balanced for at least 10 s to ensure data stability [
6,
8,
9].
The sample was powdered and sieved, and 5 g was taken for degassing pretreatment at 77 K. Nitrogen adsorption/desorption tests were conducted using the Micromeritics ASAP 2460 analyzer, with the relative pressure (P/P0) gradually increased to 1. The interval time at each equilibrium pressure was set to 10 s. The specific surface area was calculated based on the Brunauer–Emmett–Teller (BET) model, and the Barrett–Joyner–Halenda (BJH) model was used to analyze the pore volume and pore size distribution conditions of the mesoporous structure (2–100 nm) [
12,
13,
14].
Prior to the experiment, a representative sample (2–5 g) was weighed, pulverized, and sieved to a particle size fraction of 40–60 mesh. The prepared sample underwent drying and degassing pretreatment at 273.15 K to remove adsorbed contaminants. CO
2 adsorption isotherms were measured using an ASAP 2460 physical adsorption analyzer under relative pressures ranging from 0 to 0.1, with an equilibration interval of 10 s per pressure point. Pore volume and pore size distribution were derived using the Density Functional Theory (DFT) model. This test data are used to analyze the structural parameters of micro-pores (pore sizes less than 2–100 nm) [
16].
2.3. Fractal Theories
The Frenkel–Halsey–Hill (FHH) model is a used fractal model for analyzing liquid nitrogen (LN
2) adsorption data. Within this framework, the fractal dimension (D) is derived from the linear regression of adsorbed volume versus relative pressure. Based on low-pressure nitrogen gas adsorption (LPN
2 GA), this model quantifies pore heterogeneity across the mesopore range (2–100 nm). The fractal dimension is calculated using the following equation [
33]:
where
V represents the adsorbed volume corresponding to the equilibrium pressure
p, cm
3·g
−1;
Vm represents the adsorption volume of a monolayer of gas, cm
3·g
−1;
P0 is saturated vapor pressure, MPa;
C is a constant; A is the power-law exponent, whose value depends on the fractal dimension (
D) and the adsorption mechanism.
Based on the CO
2 adsorption test results, the non-uniformity of micropores (pore size is less than 2 nm) was investigated using the fractal model derived by. This equation can be expressed as follows [
34]:
where
Sr is the total specific surface area, m
2·g
−1;
Ds is the slope of this equation, dimensionless; r is the pore radius, nm; the surface fractal dimension
Ds = 2 +
C or
Ds = (
C − 3)/3.
Menger model demonstrates the strongest applicability among fractal models utilizing MIP data. This model indicates that the pore structure of coal reservoirs can be described using the Menger model. Based on the theoretical framework of this model, the relationship between
dVr/dr and r can be described as follows:
In Equation (3), r is the minimum pore radius (in nm) that mercury can enter under an intrusion pressure
p (in MPa).
Dm represents the volume fractal dimension of the pores, which is dimensionless. The relationship between mercury intrusion pressure and pore radius can be described by Equation (1). By combining Equations (2) and (3) can be derived.
In Equation (4), Vp represents the cumulative mercury intrusion at a specific pressure P, measured in mL/g. Dm = A + 4, where A is the slope of Equation (1). Dm is the pore fractal dimension.
Multifractal theory is an analytical method for quantifying the probability distribution of local features in research objects such as images, spectra, or datasets. It characterizes their statistical properties through the shapes and key parameters of the multifractal singularity spectrum and generalized dimension spectrum. The core step in this analysis involves defining the probability mass function pi(ε) to describe the normalized probability distribution of the variables under study. Based on the principles of the box-counting method, the dataset is divided into several sub-regions of scale ε, and its fractal characteristics are calculated. For detailed calculation procedures and parameter selection, refer to the series of studies by Zhang et al. [
35,
36,
37].
3. Results and Discussion
Table 1 indicates that the maximum mirror reflectance of this type of sample is 0.71–1.42, and the reflectance of the mirror mass group is 45.75–91.04. The content of shell substances in this type of samples is relatively low (except for S5, S10, and S11), indicating that the coal expansion period of the samples was mainly in a reducing environment. There are significant differences in the inert substances among the samples, with the maximum value being 75%, suggesting that there are differences in the coal-forming environment of No. 10 coal in this area. The literature shows that
Ro,max has an important influence on the pore-fracture structure. Therefore, with
Ro,max as the boundary of 1.08, this type of sample is divided into two parts for discussion.
3.1. Adsorption Pore Volume Distribution Heterogeneity
3.1.1. 0.4~2.0 nm
It can be known from
Section 2 that CO
2 adsorption can be used to characterize pore volume of micropores.
Figure 1 shows this type of sample. The maximum adsorption capacity of CO
2 is 2 to 14 cm
3·g
−1. The adsorption capacity of CO
2 in the coal sample with a high degree of evolution is higher than that in the weaker
Ro,max sample.
Figure 1b,d indicates that micro-pore distribution of this type of sample presents a distinct bidirectional state, with the main peak at approximately 0.6 nm and the secondary peak at approximately 0.85 nm. This suggests that the pore volumes of 0.6 nm and 0.8 nm account for the vast majority of the micropores of this type of samples. Overall,
Ro,max has a relatively obvious influence on micro-pore volume.
Based on
Section 2.3, a single fractal dimension calculation of the micro-pore distribution curve was carried out through Equation (2). The micro-pore size distribution curve of this type of sample shows obvious fractal characteristics. With
Ro,max as 0.6 nm, there is an obvious turning point, indicating that there are two completely different fractal characteristics in the micropores of this type of sample. The pore size ranges from 0.4 to 0.6 nm, and the maximum fractal dimension value of the sample is 3.385. The minimum is 2.22, the average is 2.689, the aperture is 0.6 to 1.1 nm, the maximum dimension of this type of sample is 2.796, the minimum is 2.717, and the average is 2.752 (
Figure 2).
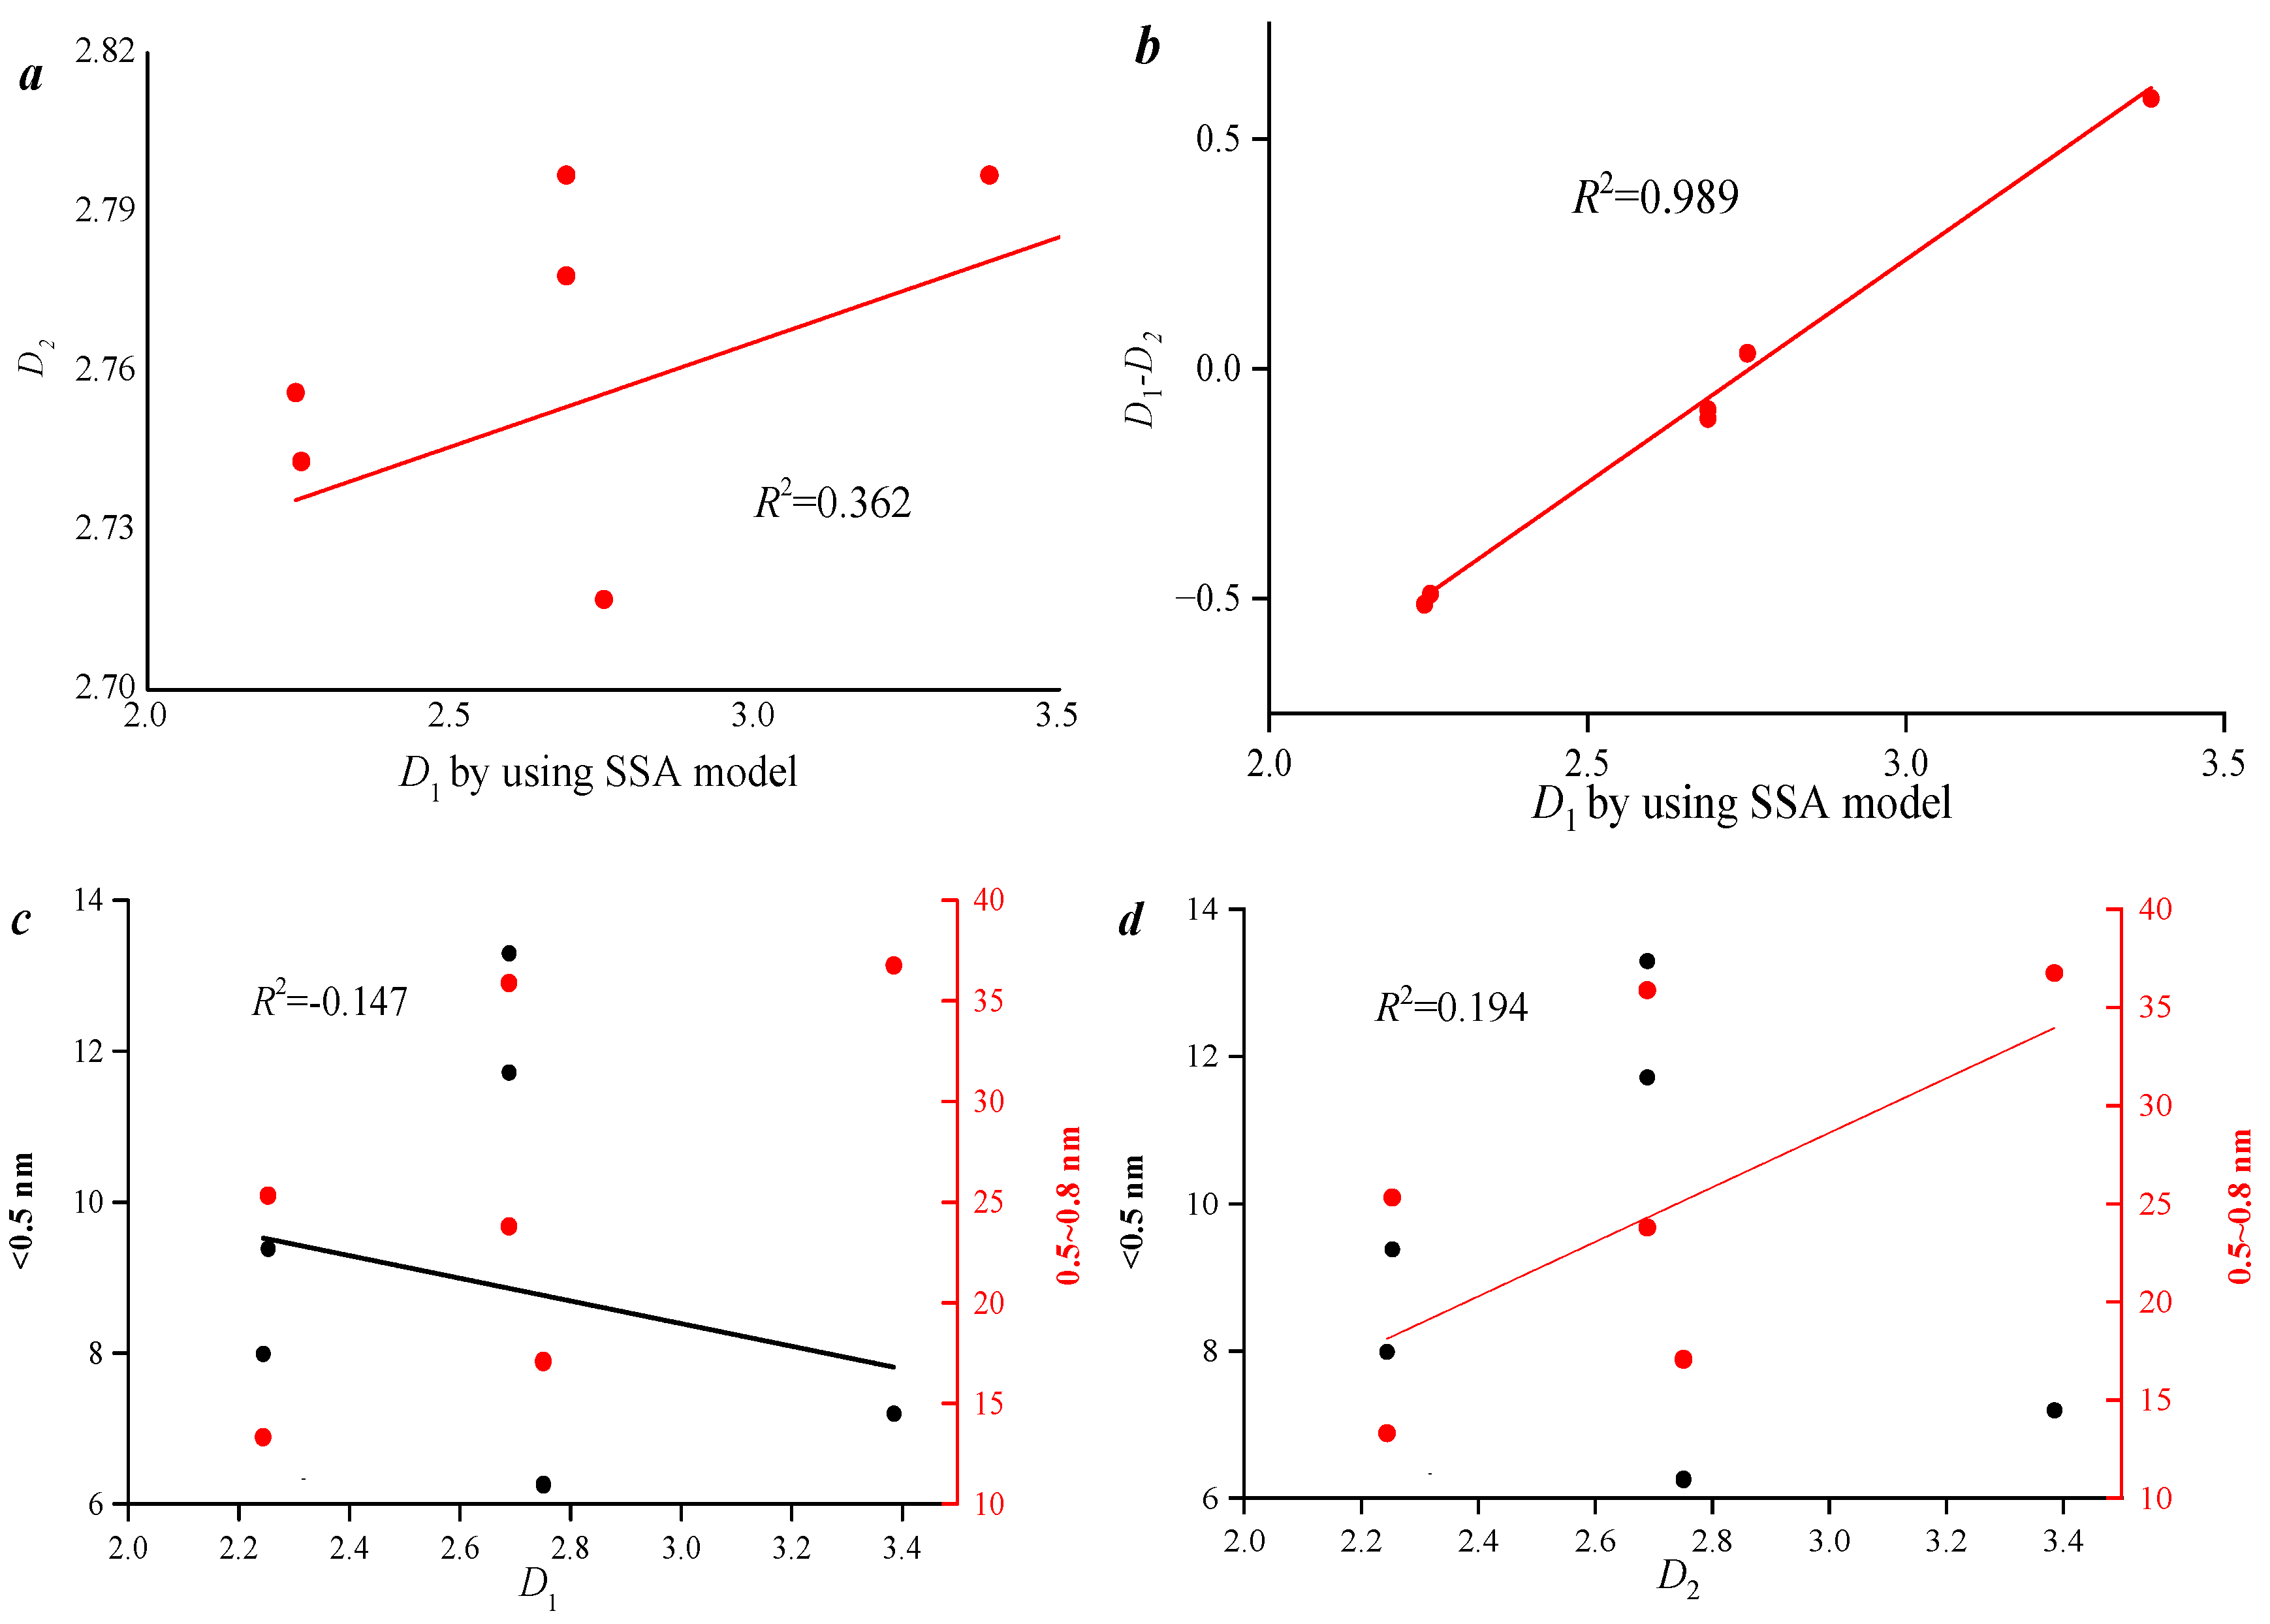
It is necessary to explore the correlation of fractal dimension values with different apertures.
Figure 3 shows that D
1 and D
2 have a weak correlation, and the difference between the two has a good linear relationship with the single fractal dimension, indicating that these two different fractal parameters are correlated.
Figure 3c indicates that there is no obvious relationship between the fractal dimension value and the pore volume, suggesting that the fractal dimension value is not affected by a single pore volume but is comprehensively influenced by other factors such as the reflectance of the mirror quality group and the microscopic composition.
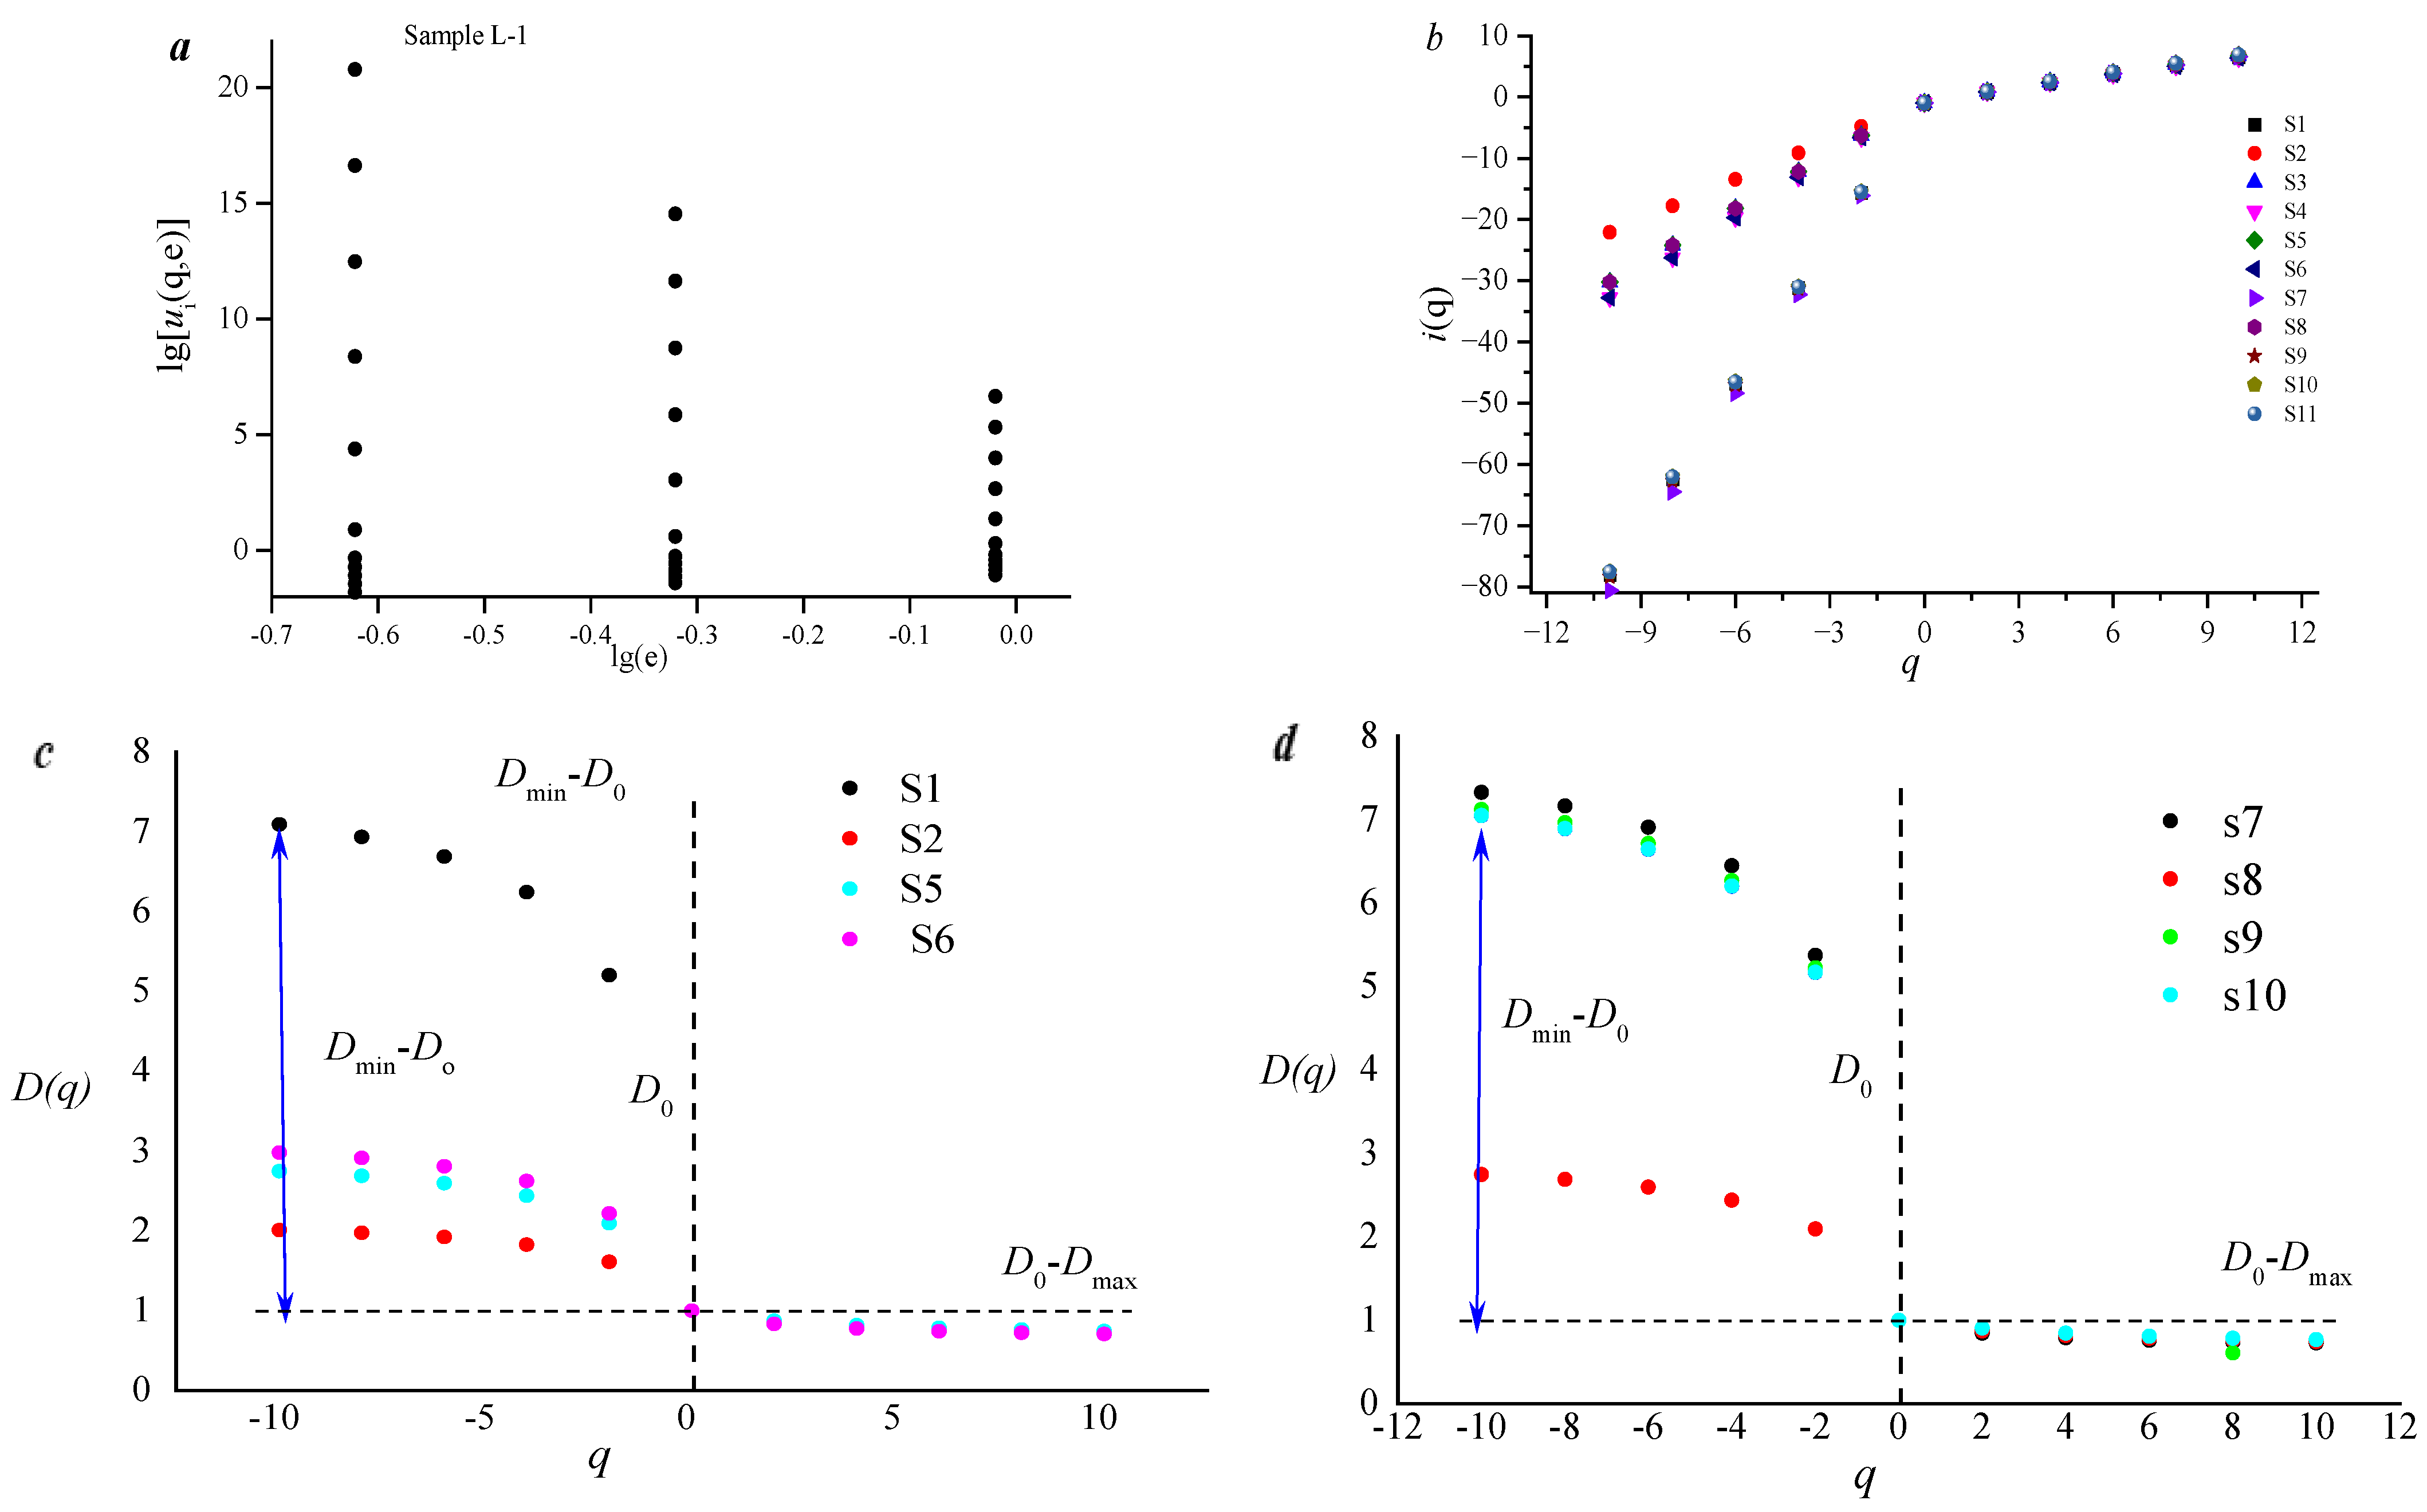
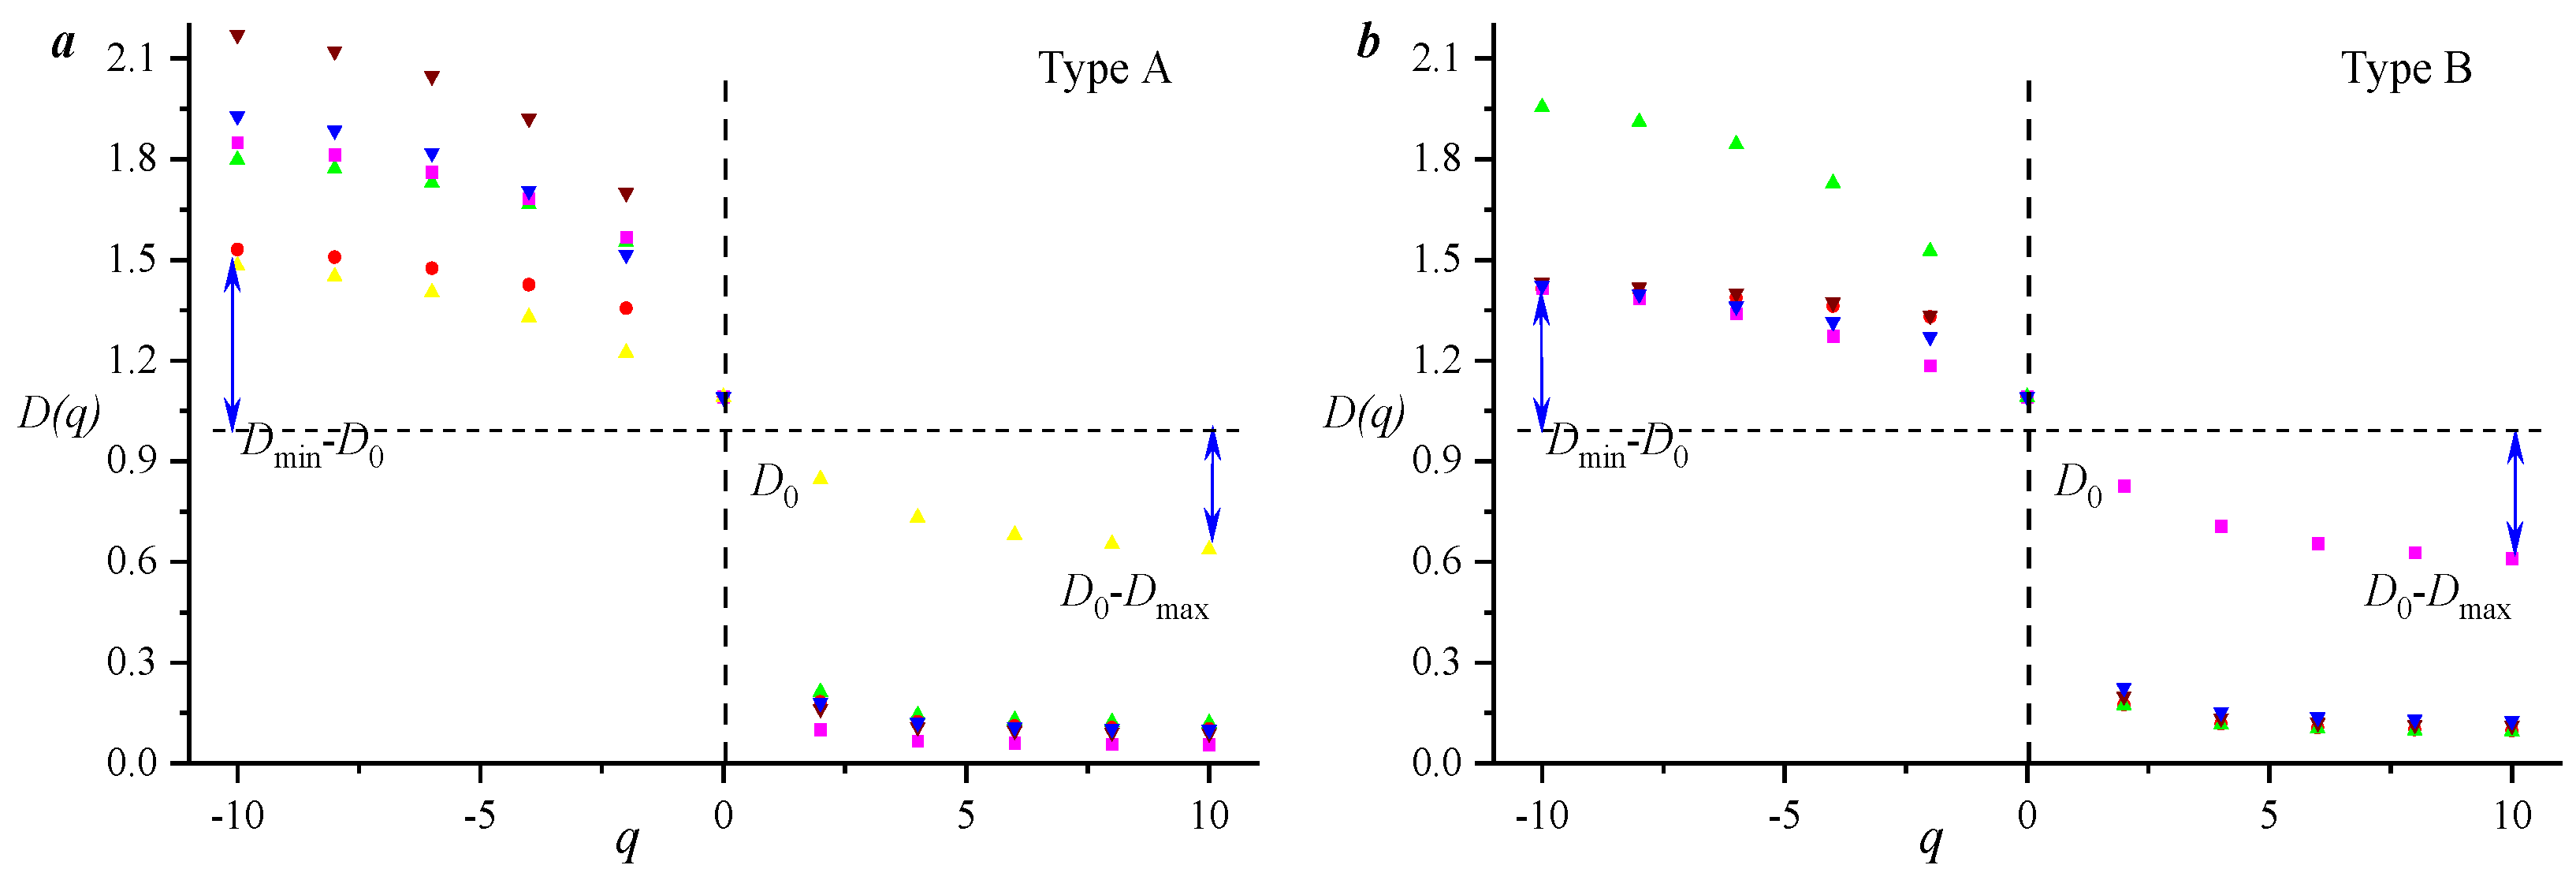
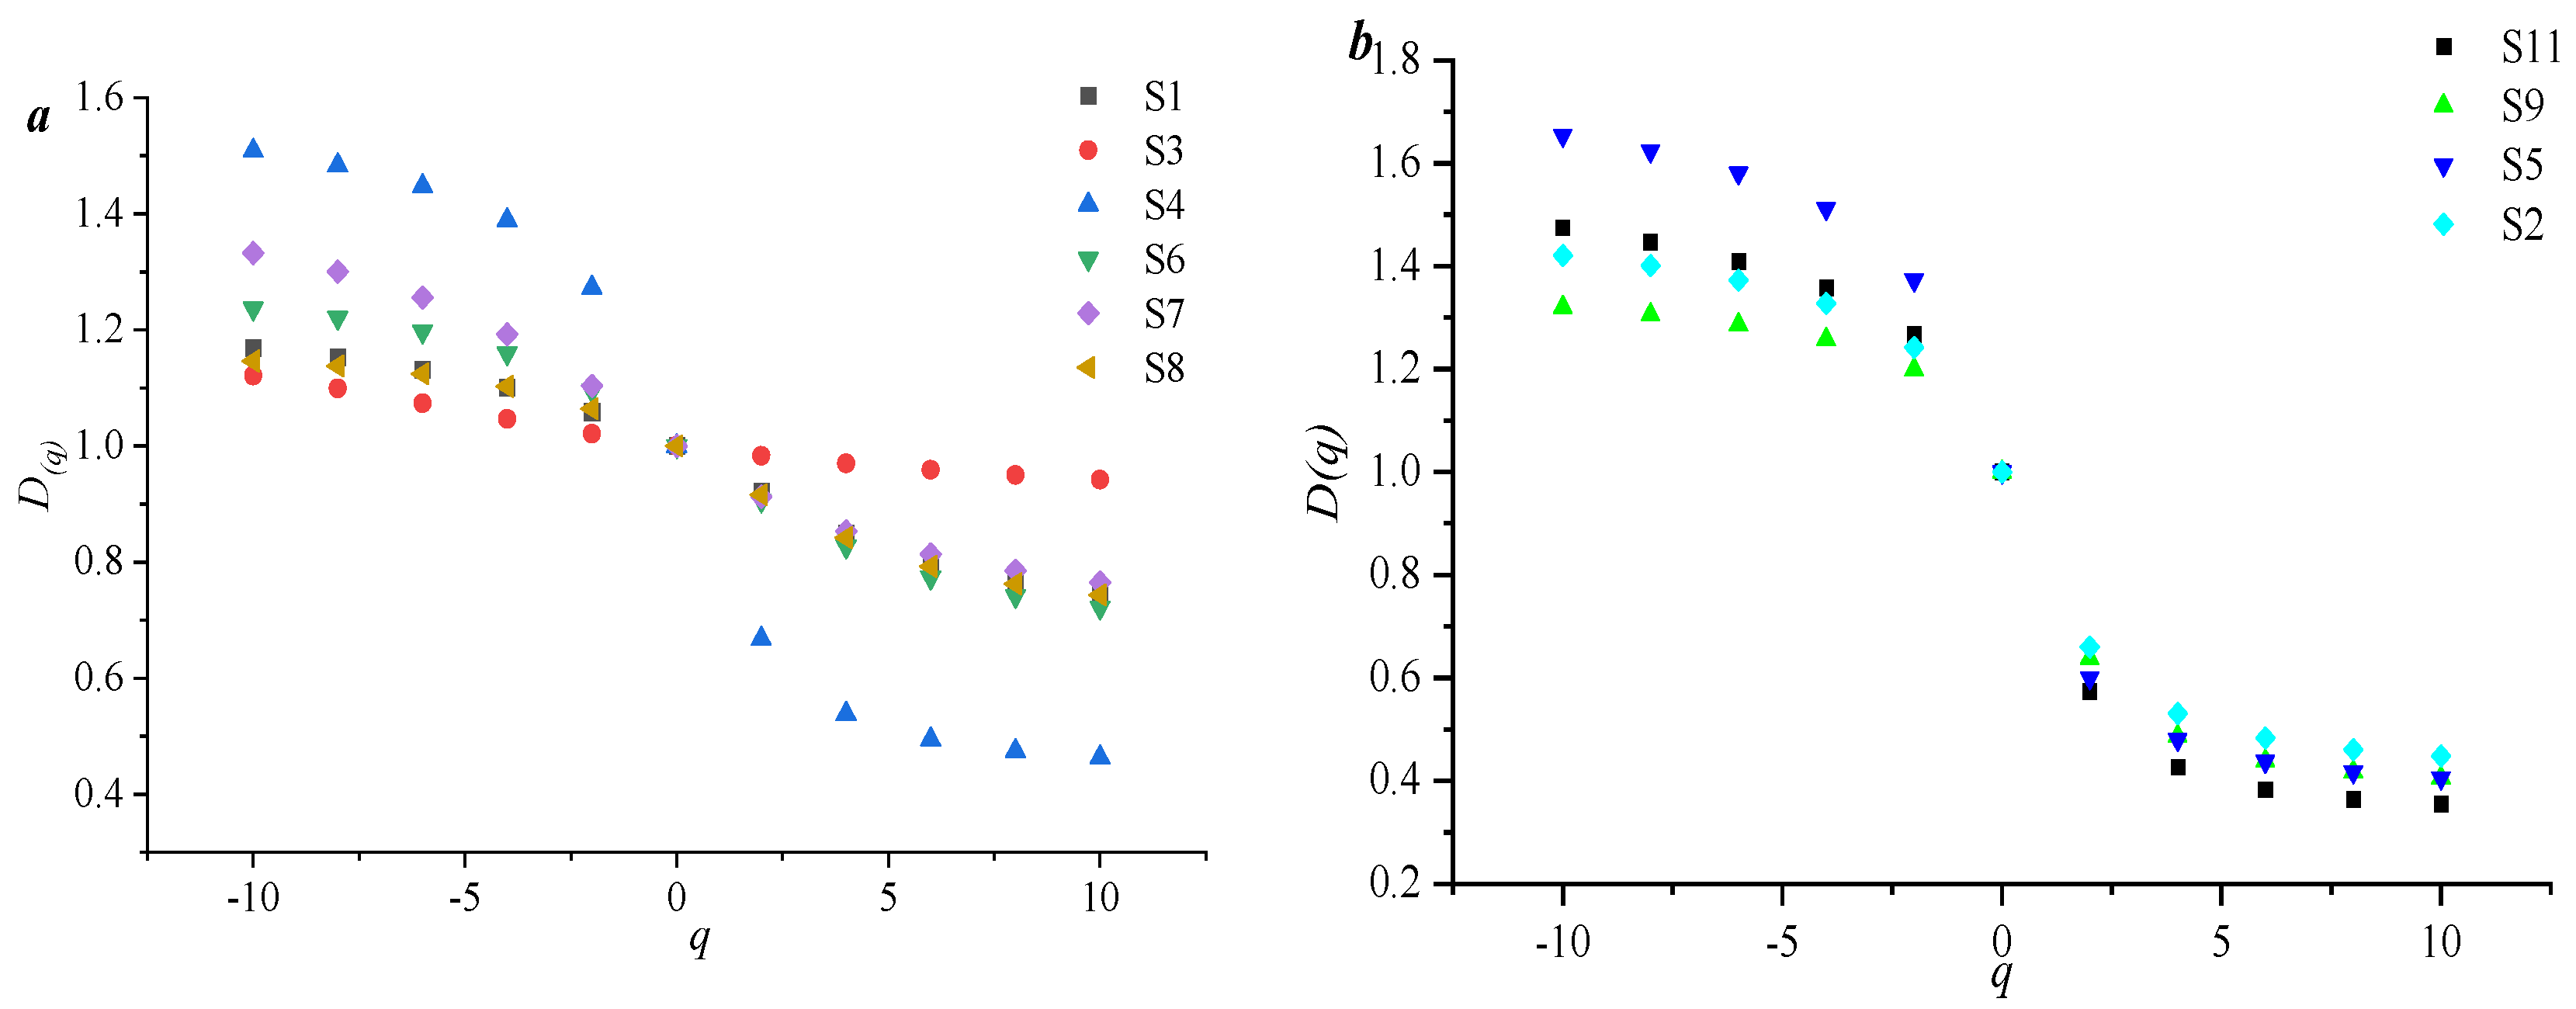
Figure 4a,b indicates that lg(e) and lgu[ui(q,e)] have a significant linear negative correlation, and q~i(q) shows an S-shaped pattern, suggesting that the micropore distribution curve of this type of sample exhibits multifractal characteristics.
Figure 4c,d show that the micropore fractal spectra present a distinct inverse S-shaped pattern. It indicates that the spectral width of the left peak (D
−10–D
0) is significantly larger than that of the right peak (D
0–D
10), which suggests that the heterogeneity in the low-value area of pore volume is much stronger than that in the high-value area of pore volume. The low-value area of pore volume (D
−10–D
0) is between 1.010 and 6.327. The heterogeneity of the low-value area of pore volume controls the heterogeneity of the entire microporous pore distribution, which emphasizes that in the quantitative characterization process of the heterogeneity of the microporous pore distribution, the low-value area of pore volume should be given particular attention.
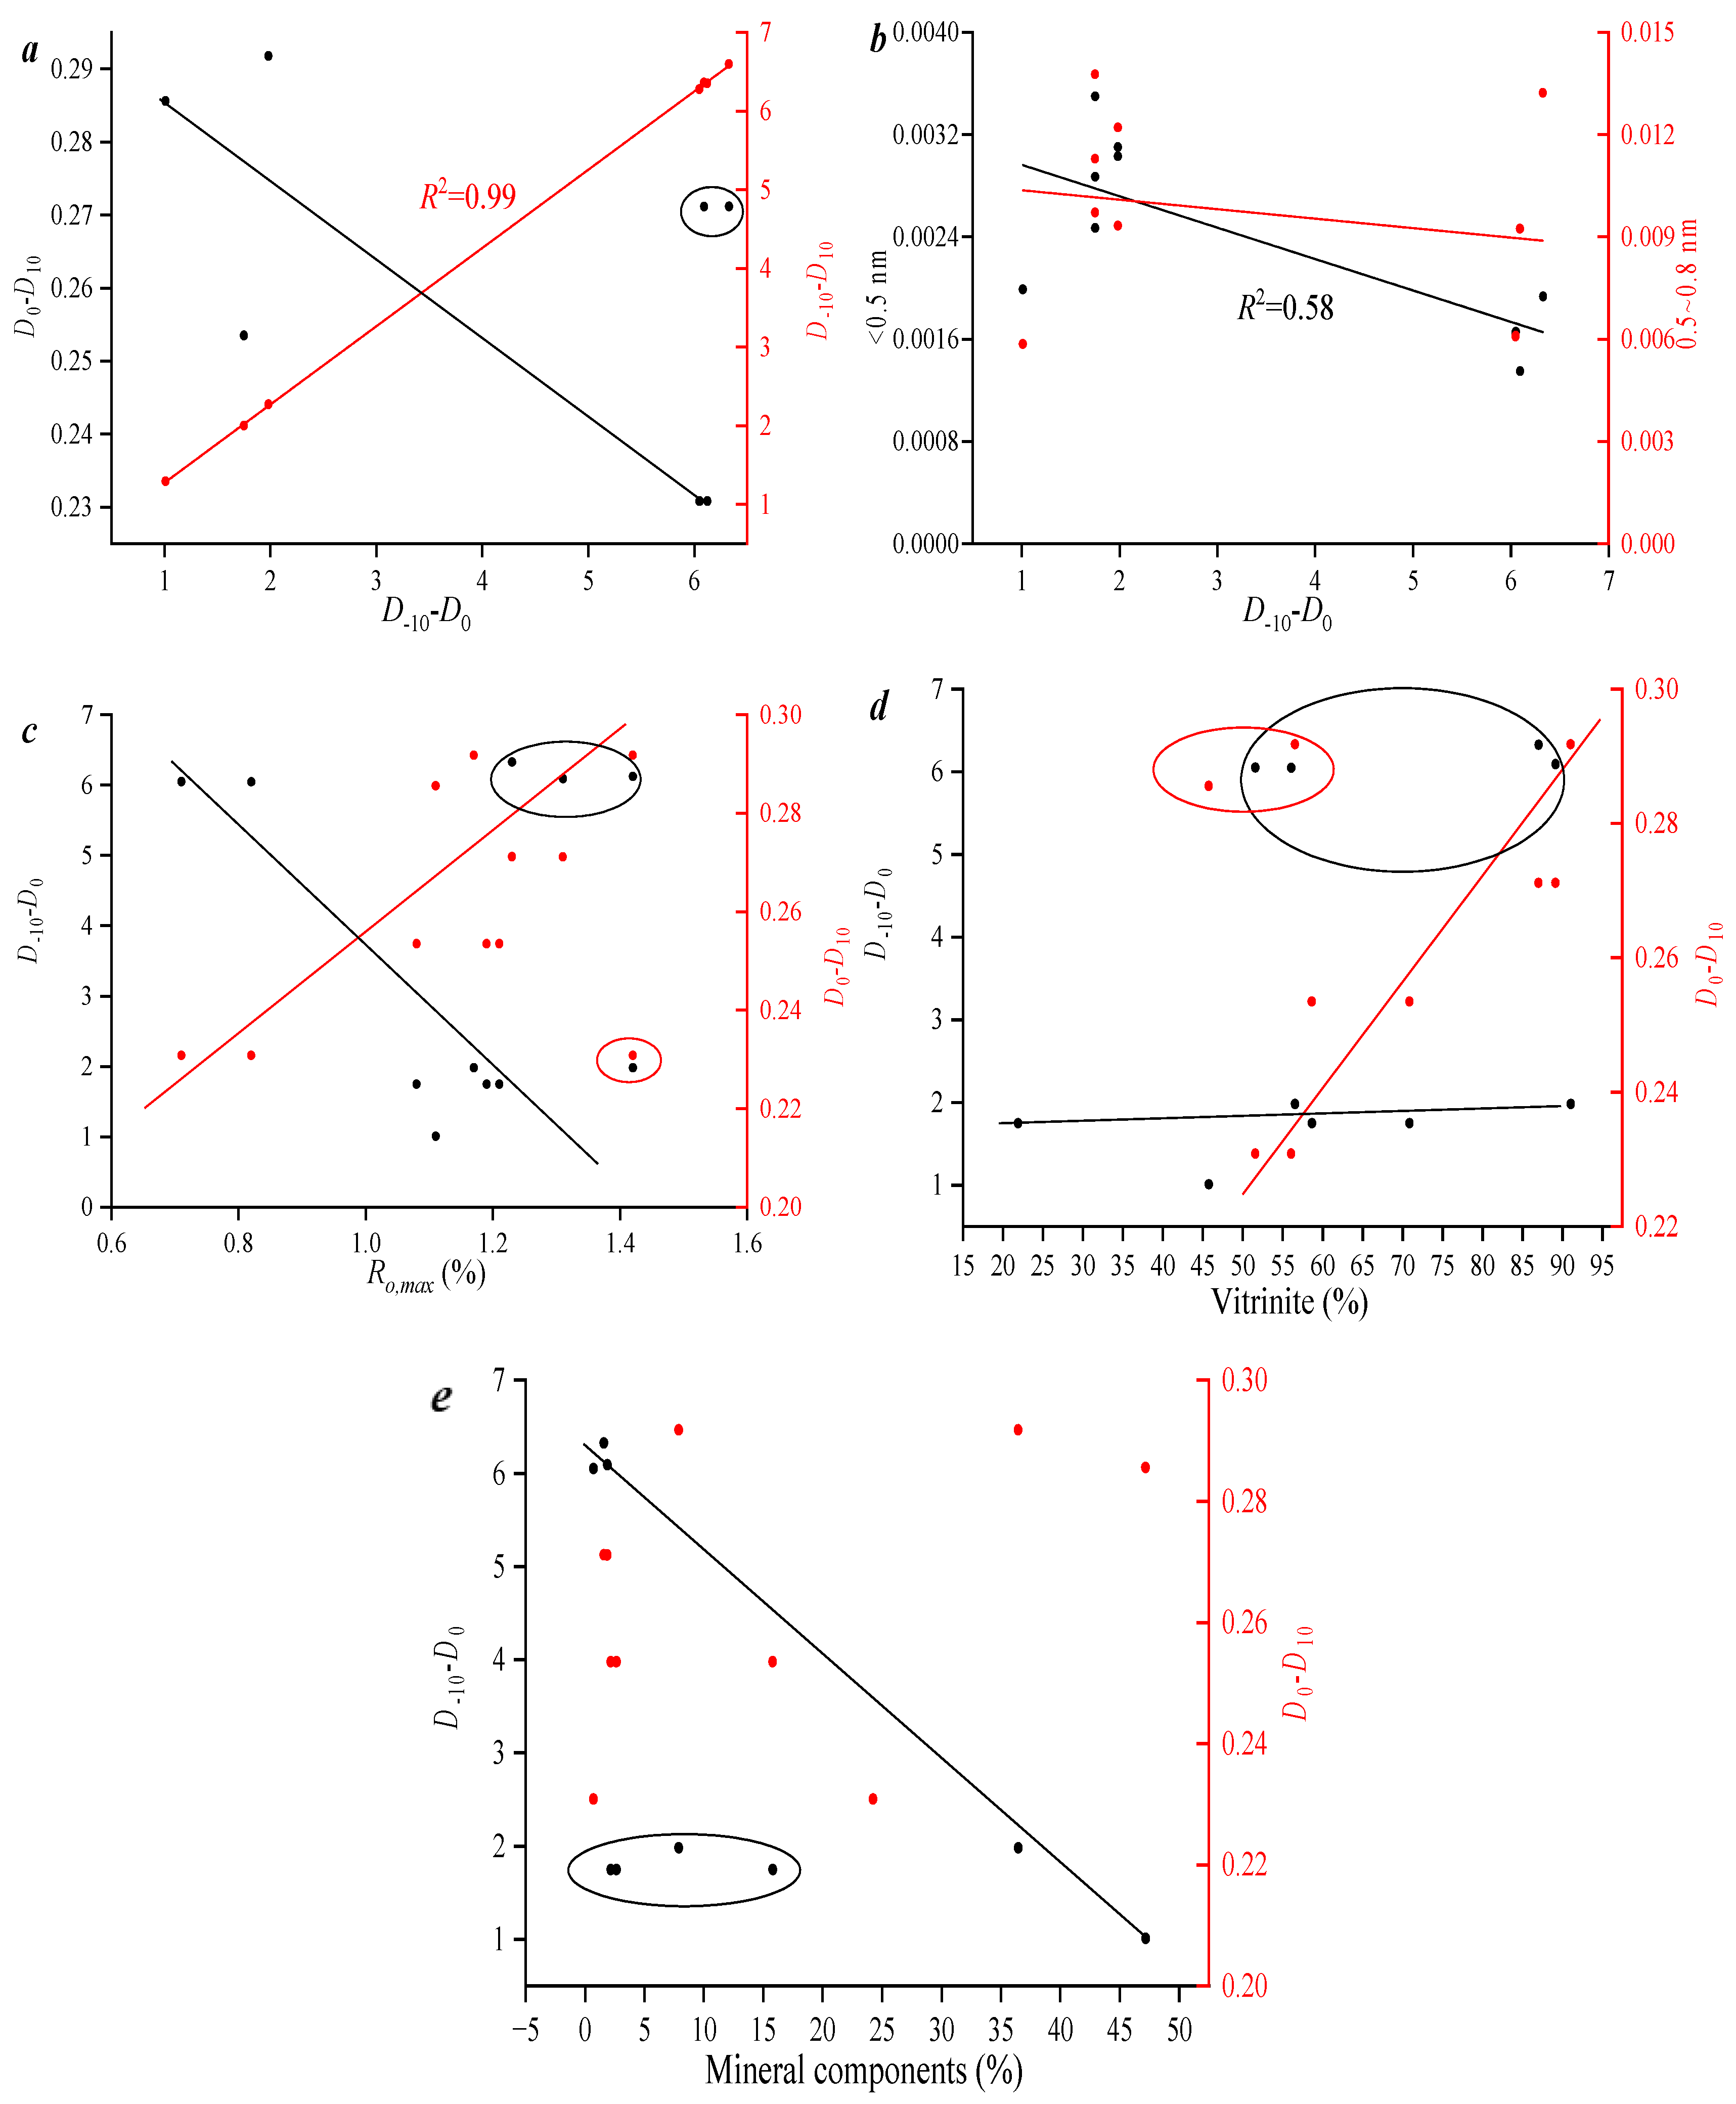
Exploring the influencing factors of the multifractal characteristics of micropores is of great significance for an in-depth understanding of the heterogeneity of pore structure.
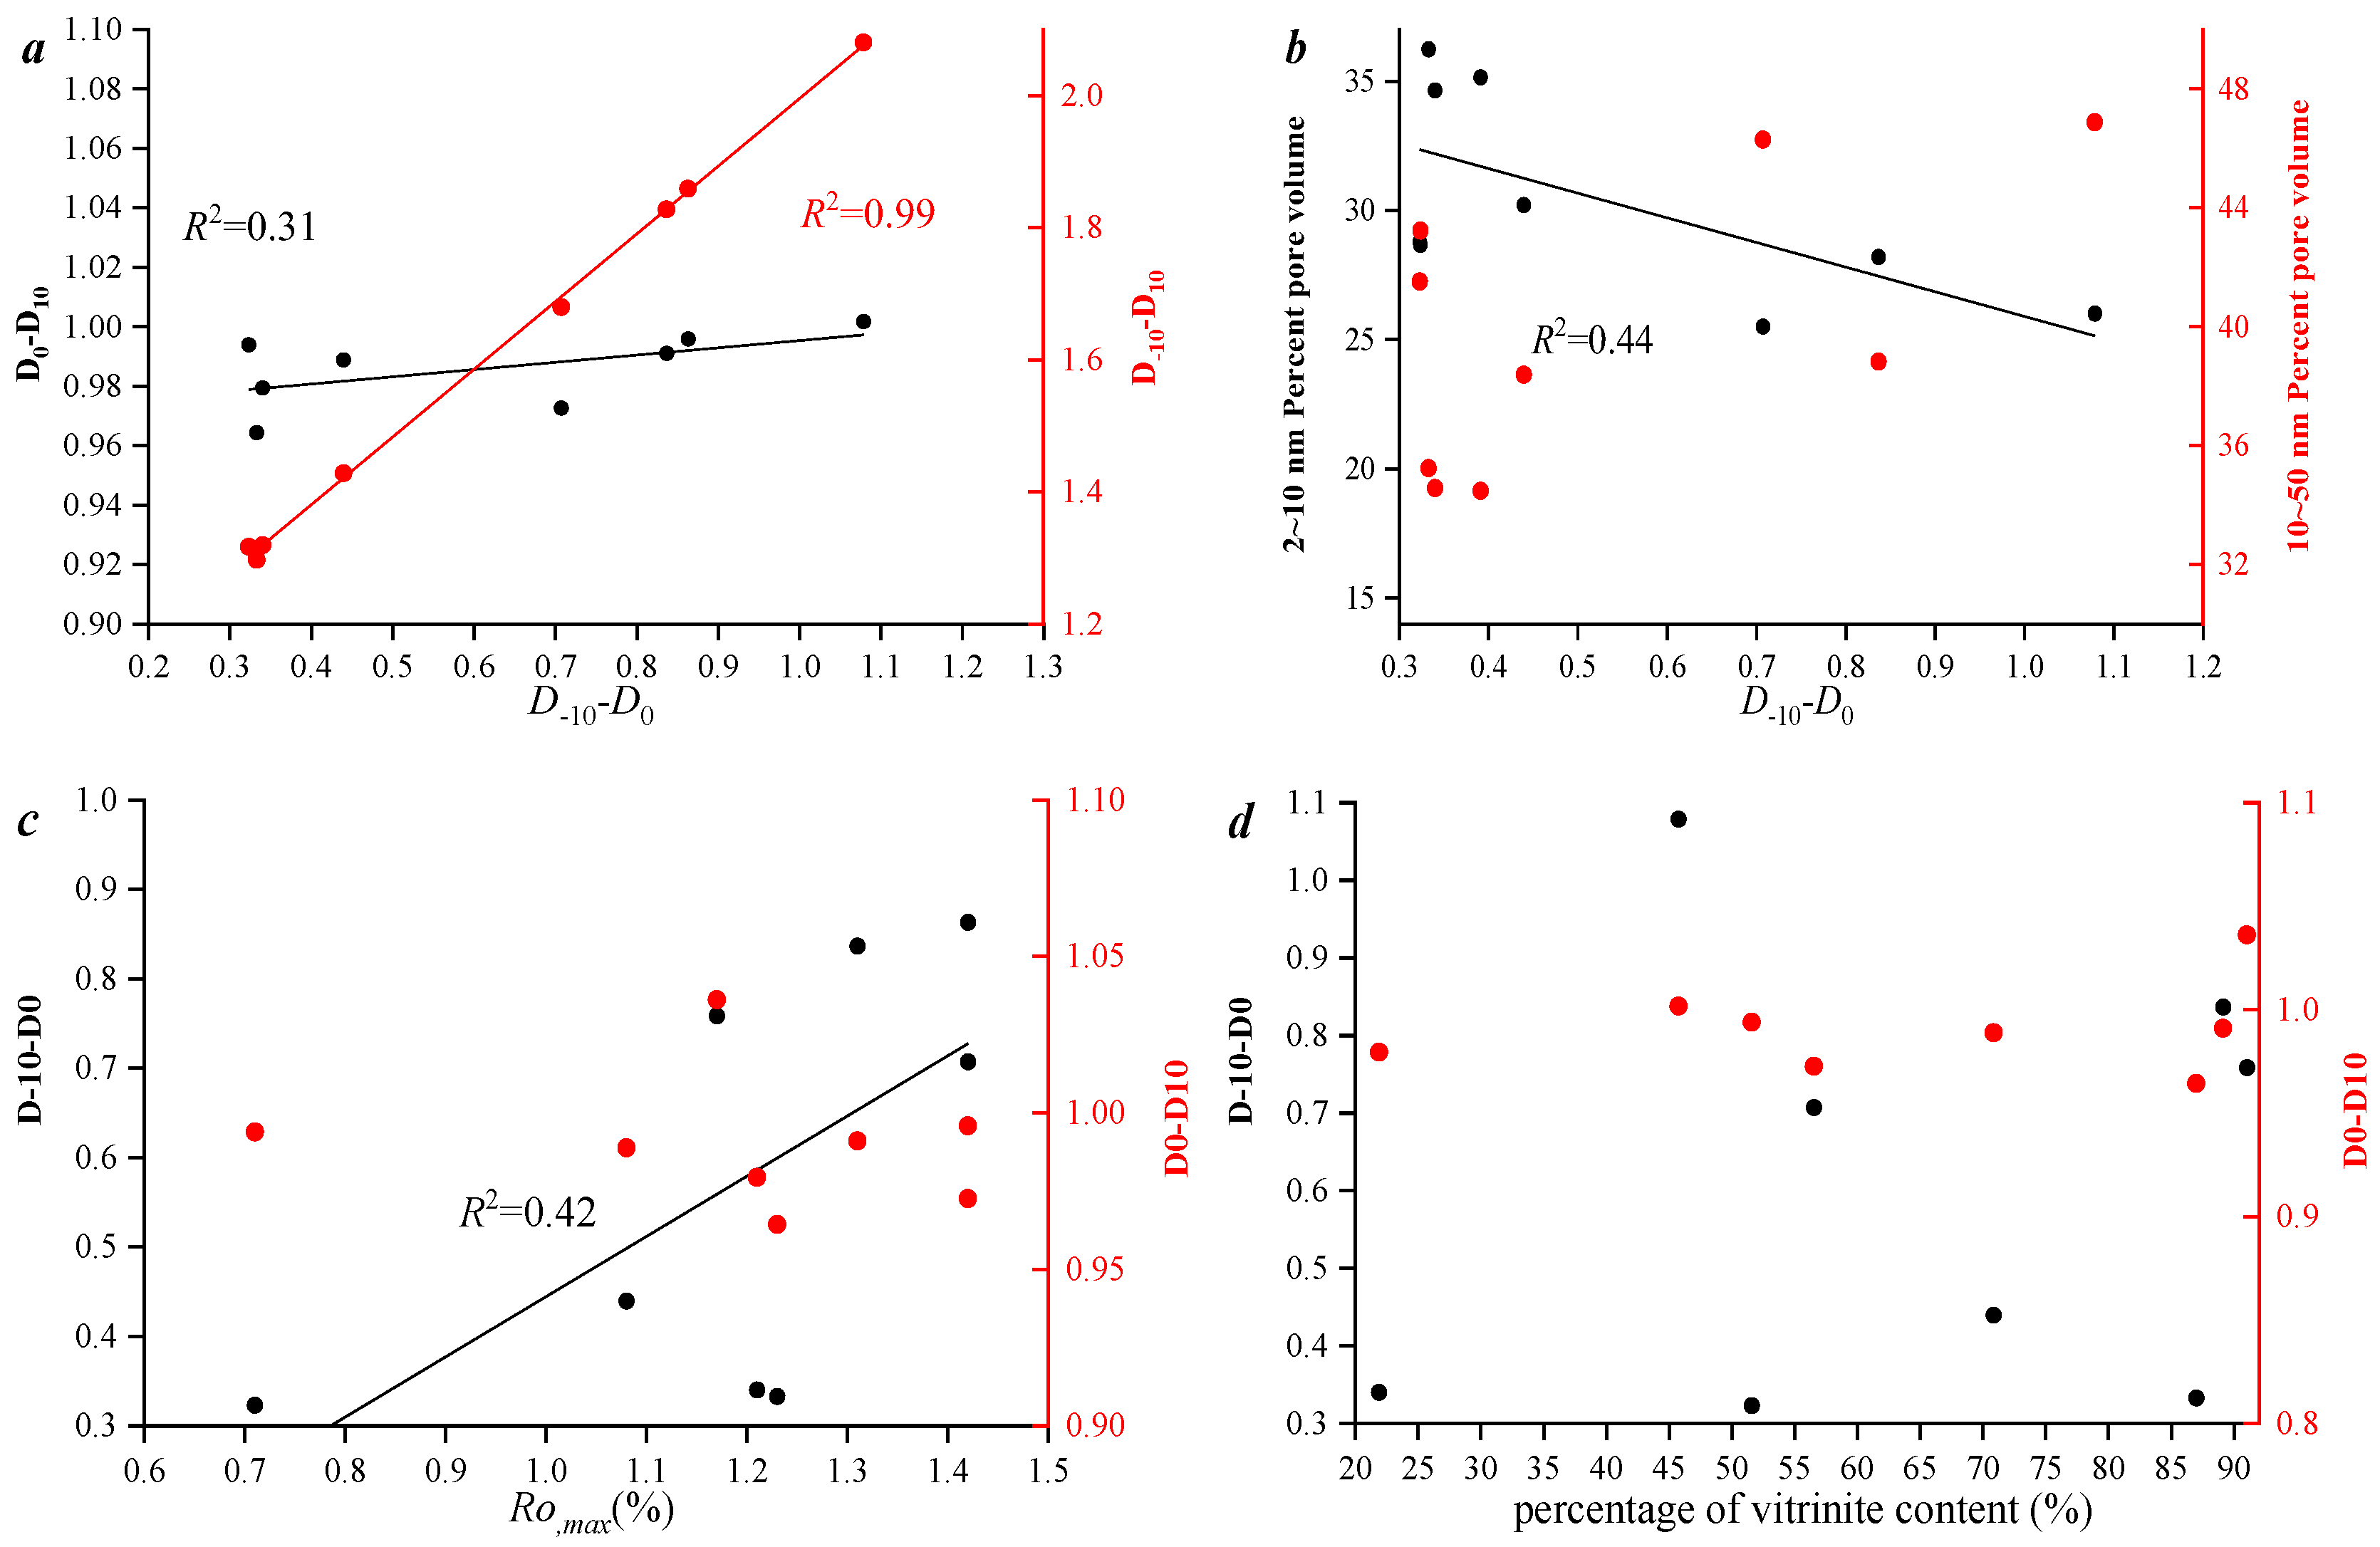
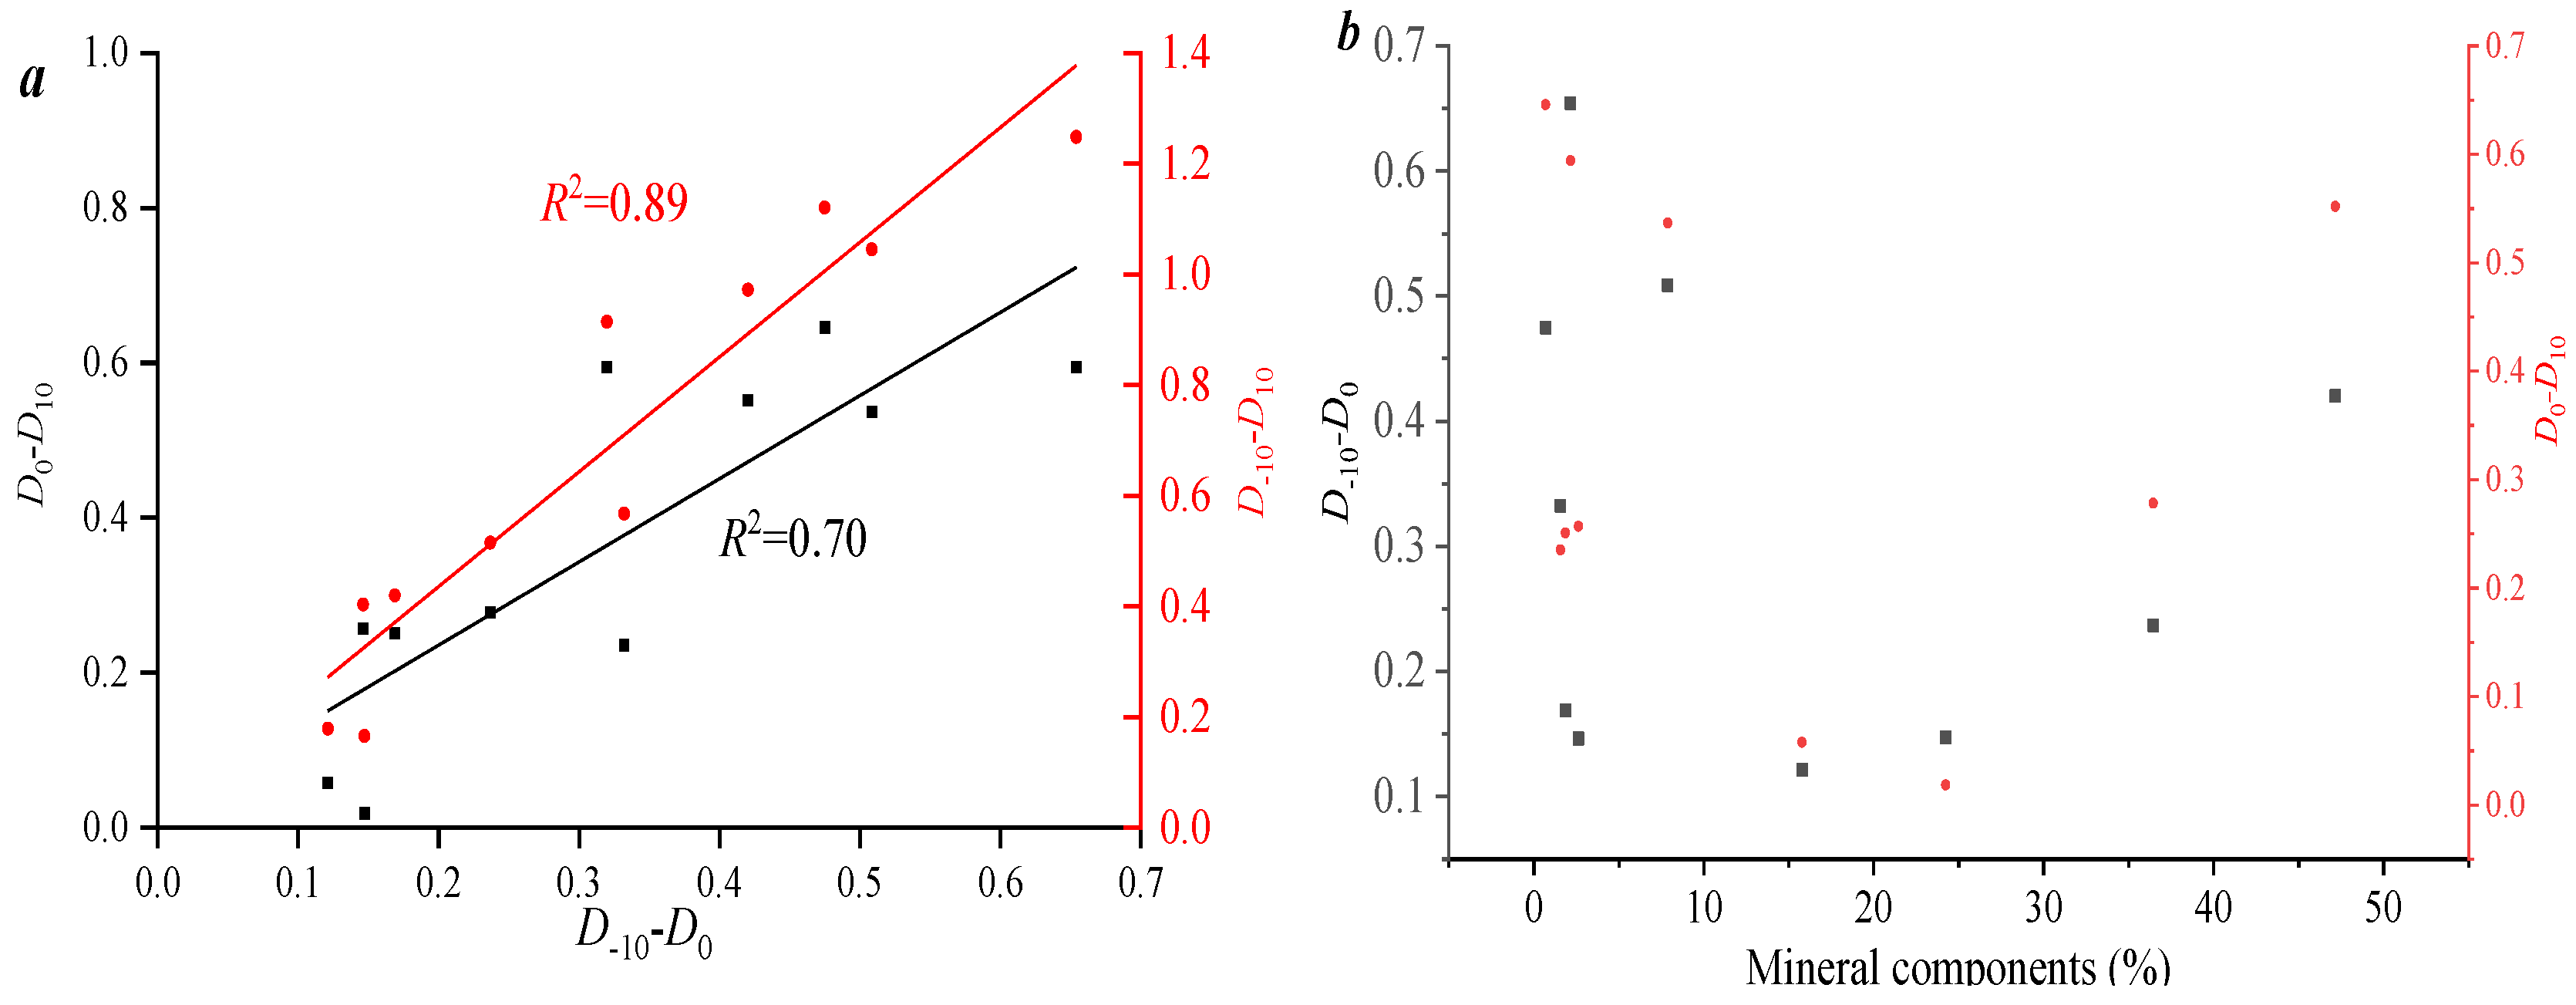
Figure 5a indicates that D
−10–D
0 has a strong positive correlation with D
−10–D
0. It is worth noting that the correlation between D
0–D
10 and D
−10 and D
0 is relatively weak. This fully demonstrates that there are significant differences in the fractal characteristics of the low-value pore area and the high-value pore area, and the two are independent.
Figure 5b shows that as the pore volume of micropores increases, the heterogeneity of the pore distribution in the low-value pore volume area (D
−10–D
0) gradually weakens. This indicates that the development characteristics of pore volume are one of the important factors affecting the multifractal characteristics of pores.
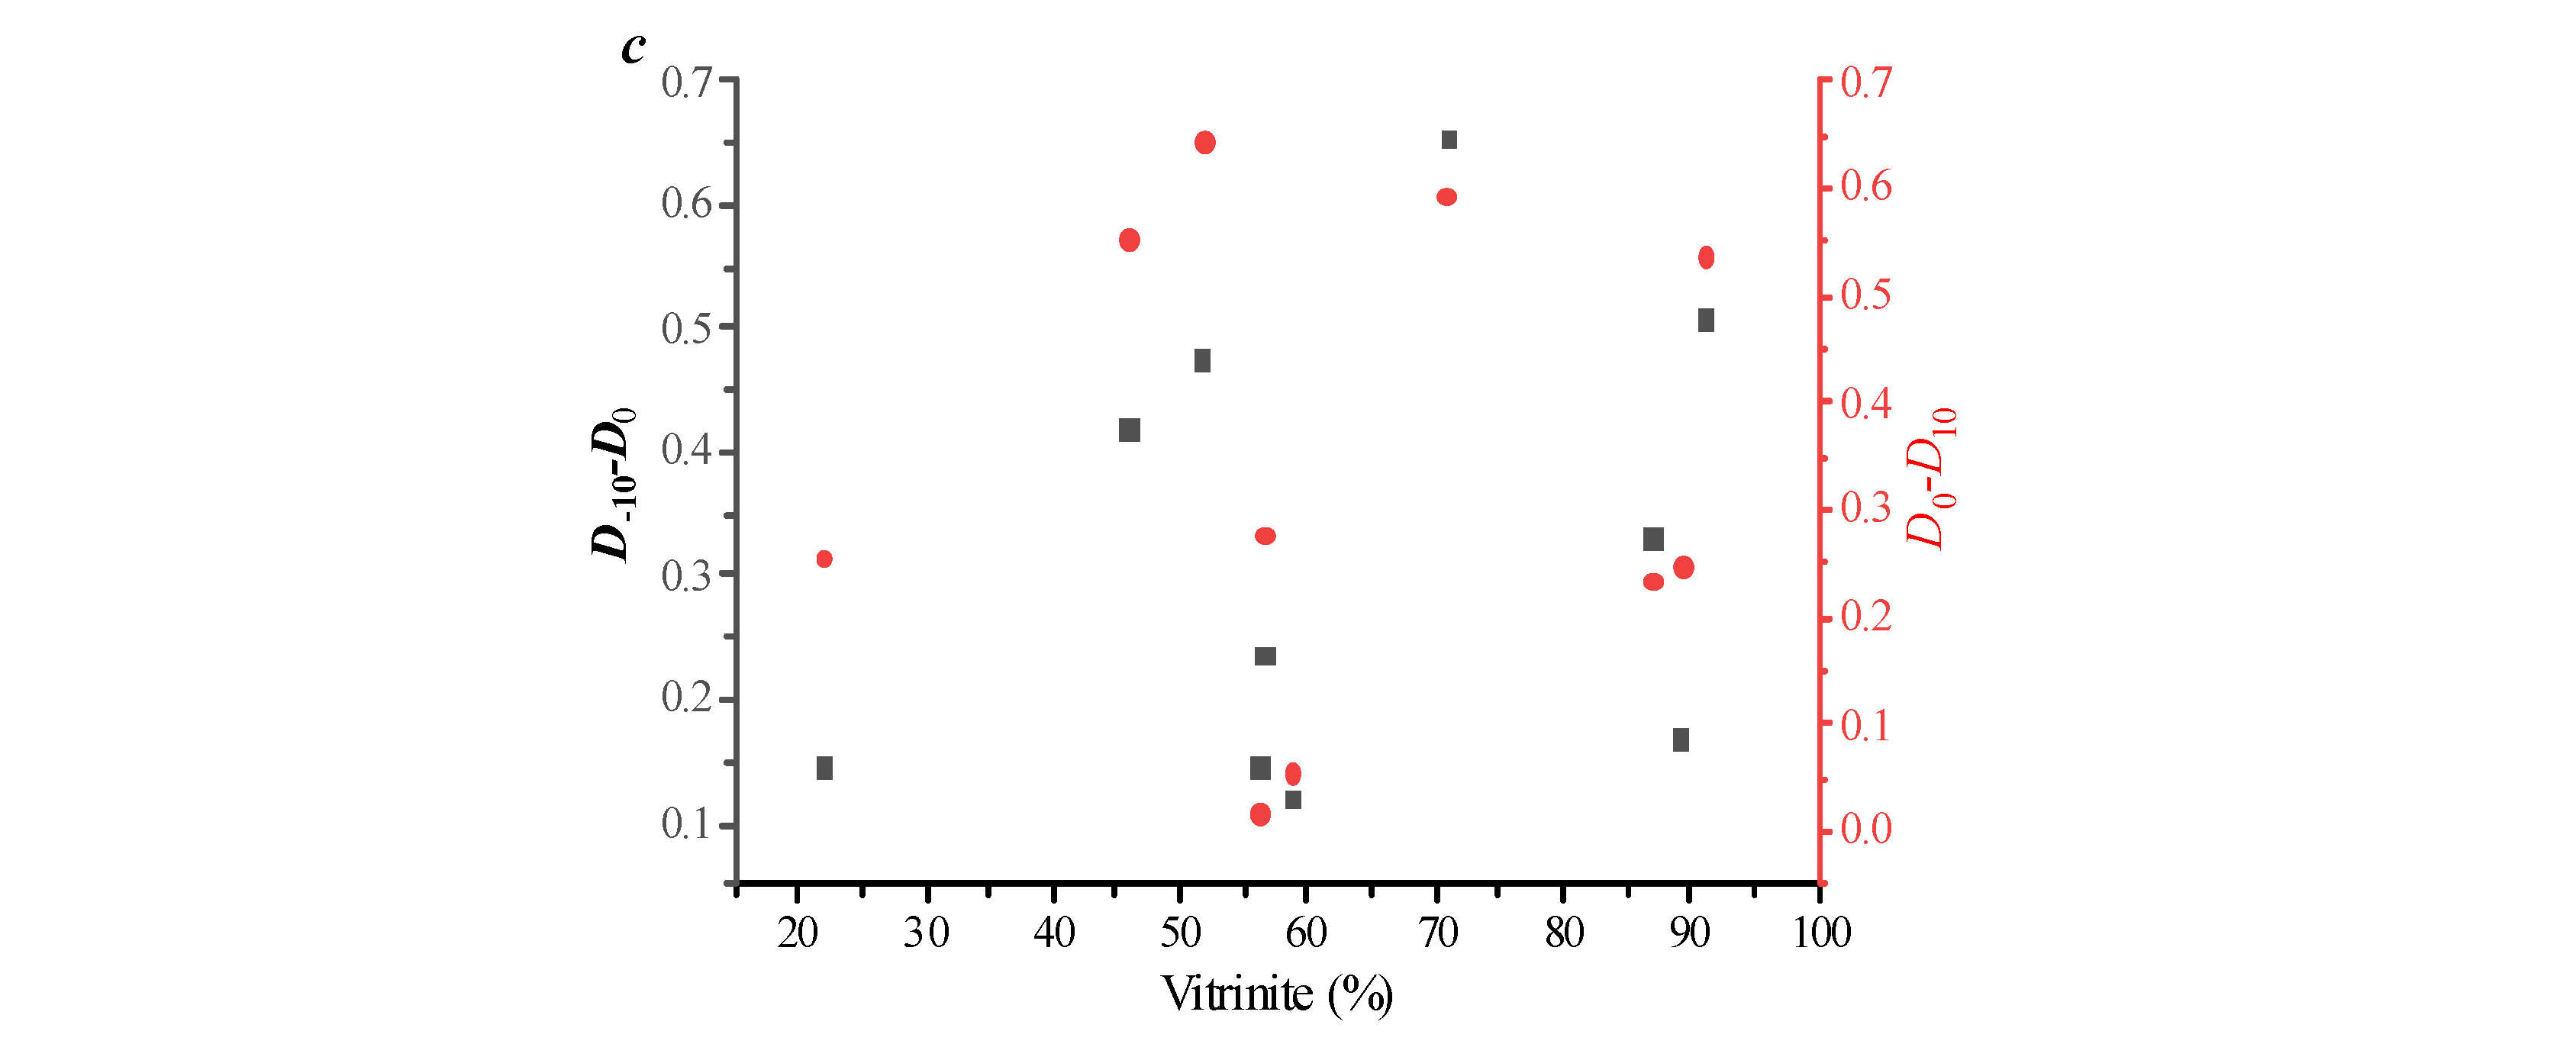
Figure 5c further shows that with the increase in Ro, the high-value area of pore volume (D
0–D
10) shows a significant increasing trend. This indicates that the net thermal evolution has controlled the development characteristics of the high-value area of pore volume. Different from
Figure 5c–e, both the content of the mirror material group and the mineral components have significant control effects on the heterogeneity of the distribution in the low-value area of the pore volume, which fully demonstrates the complexity of the multifractal characteristics.
3.1.2. 2~100 nm
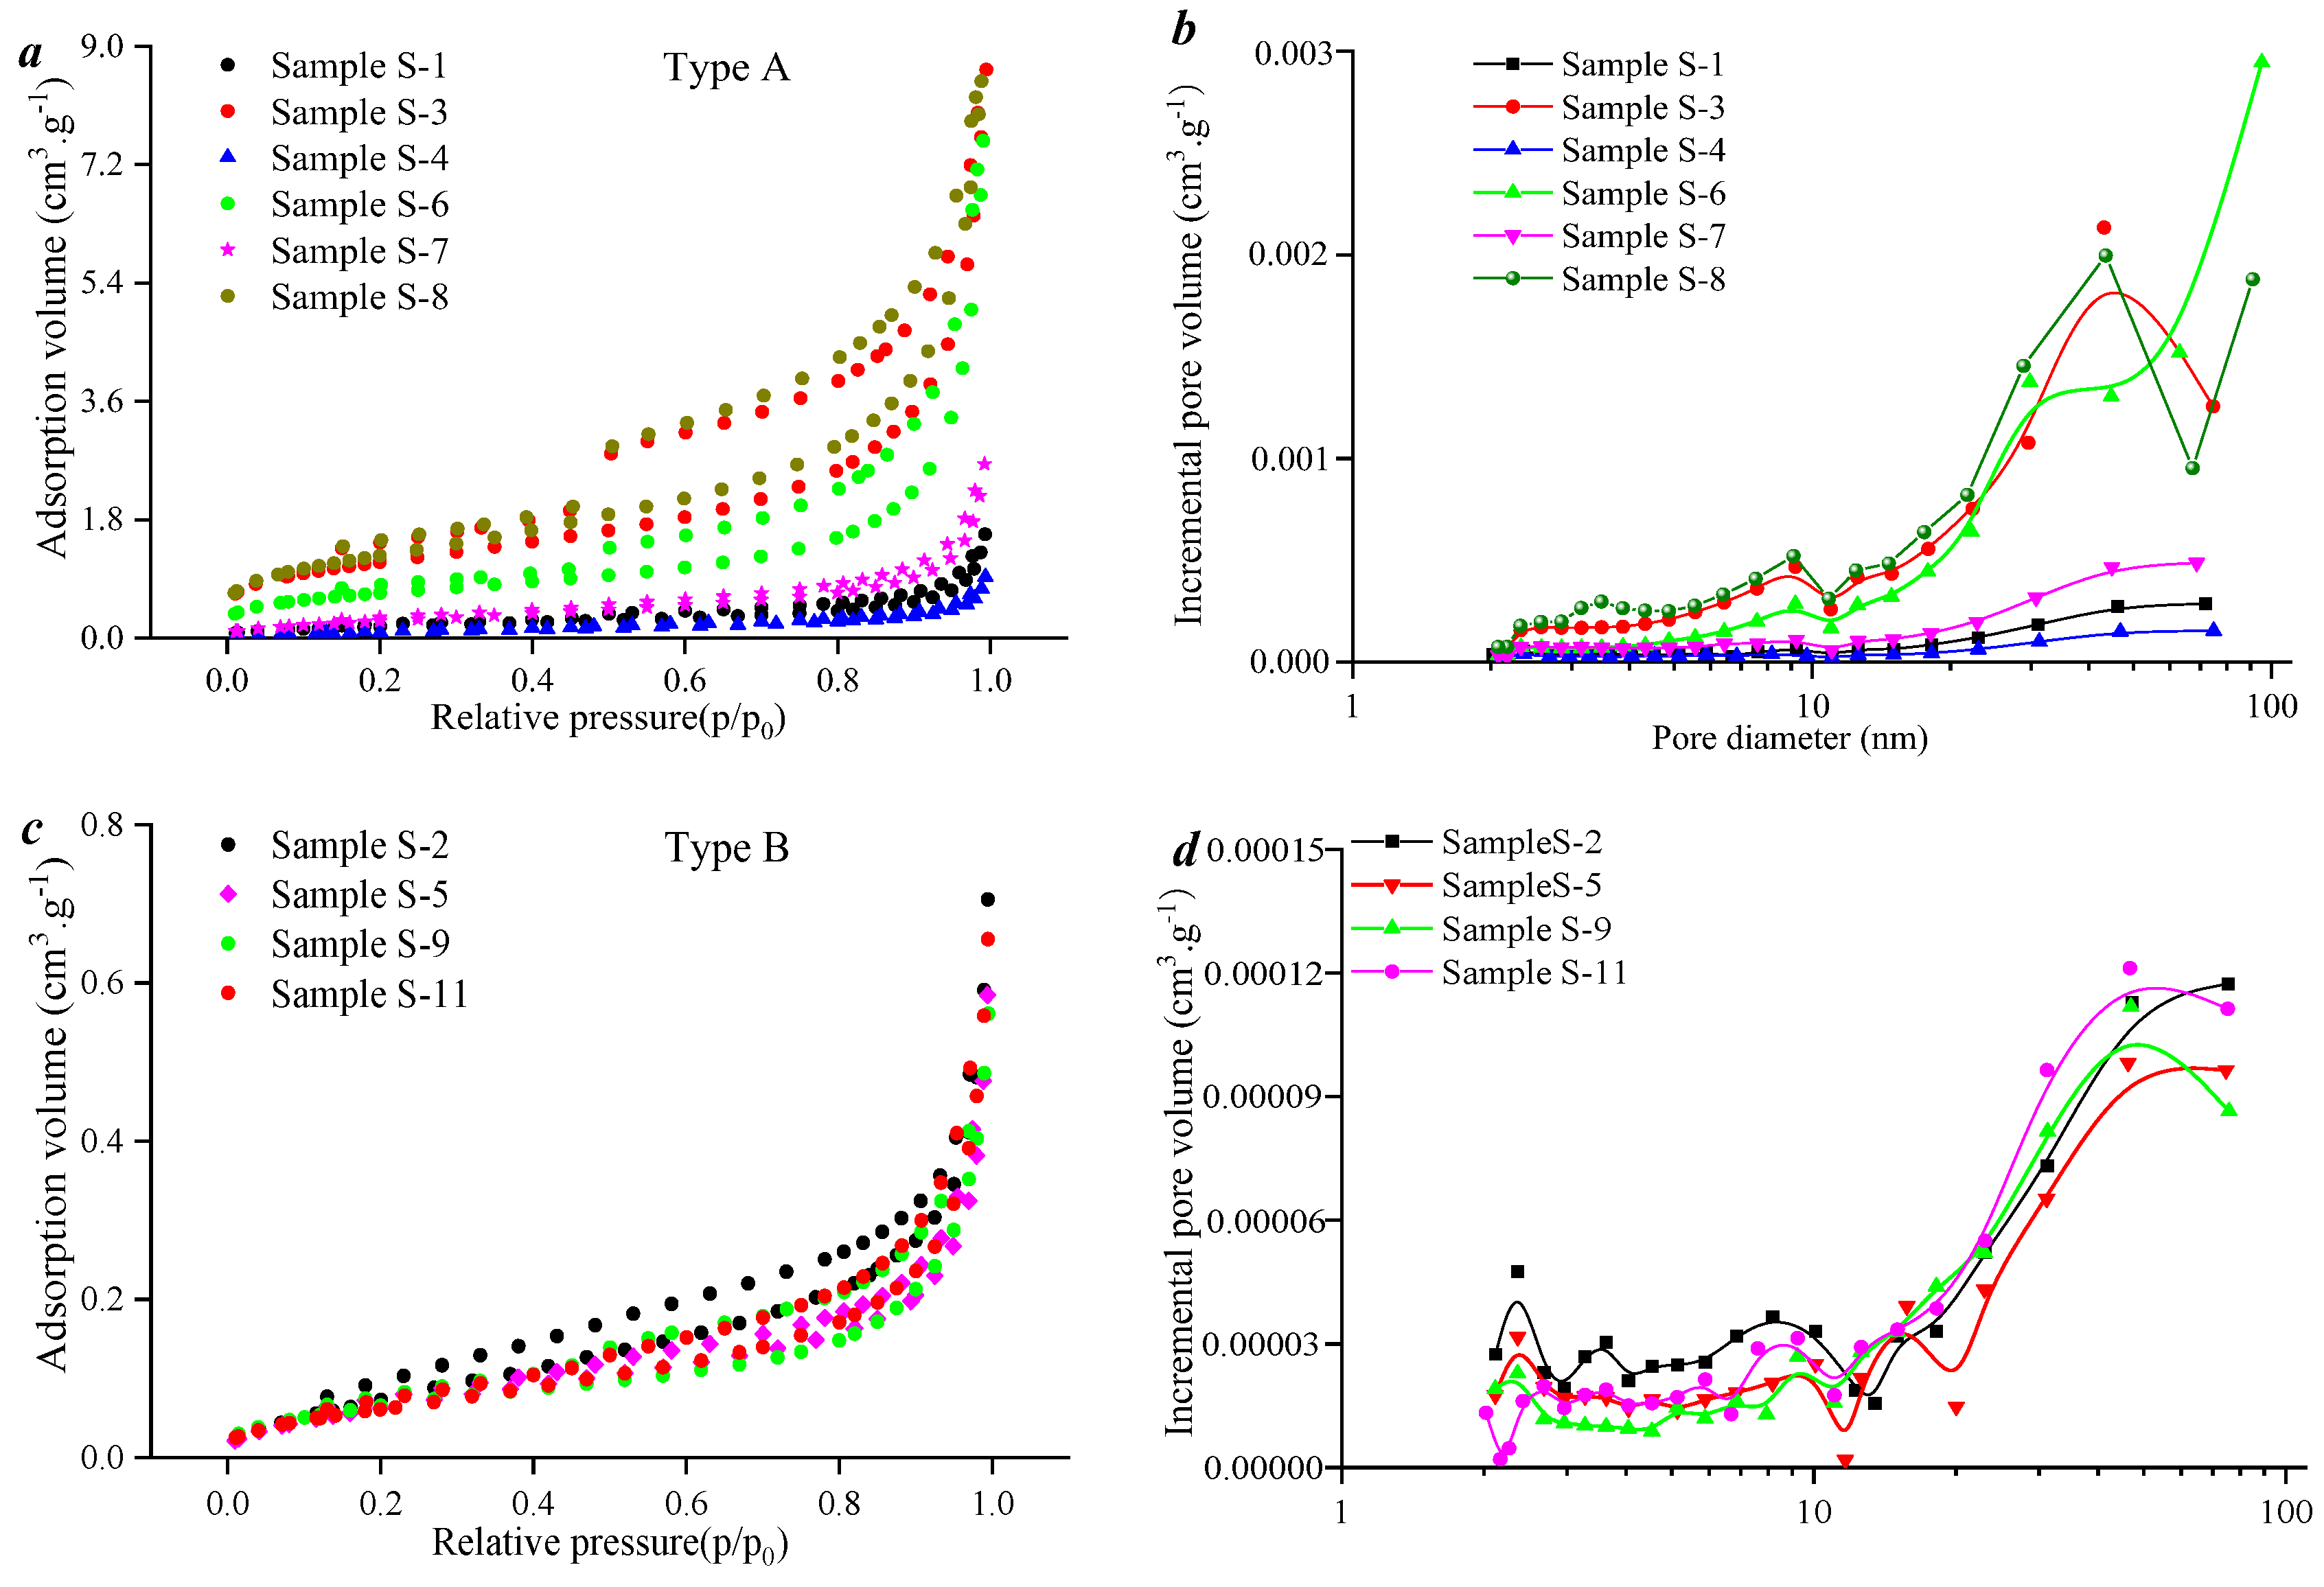
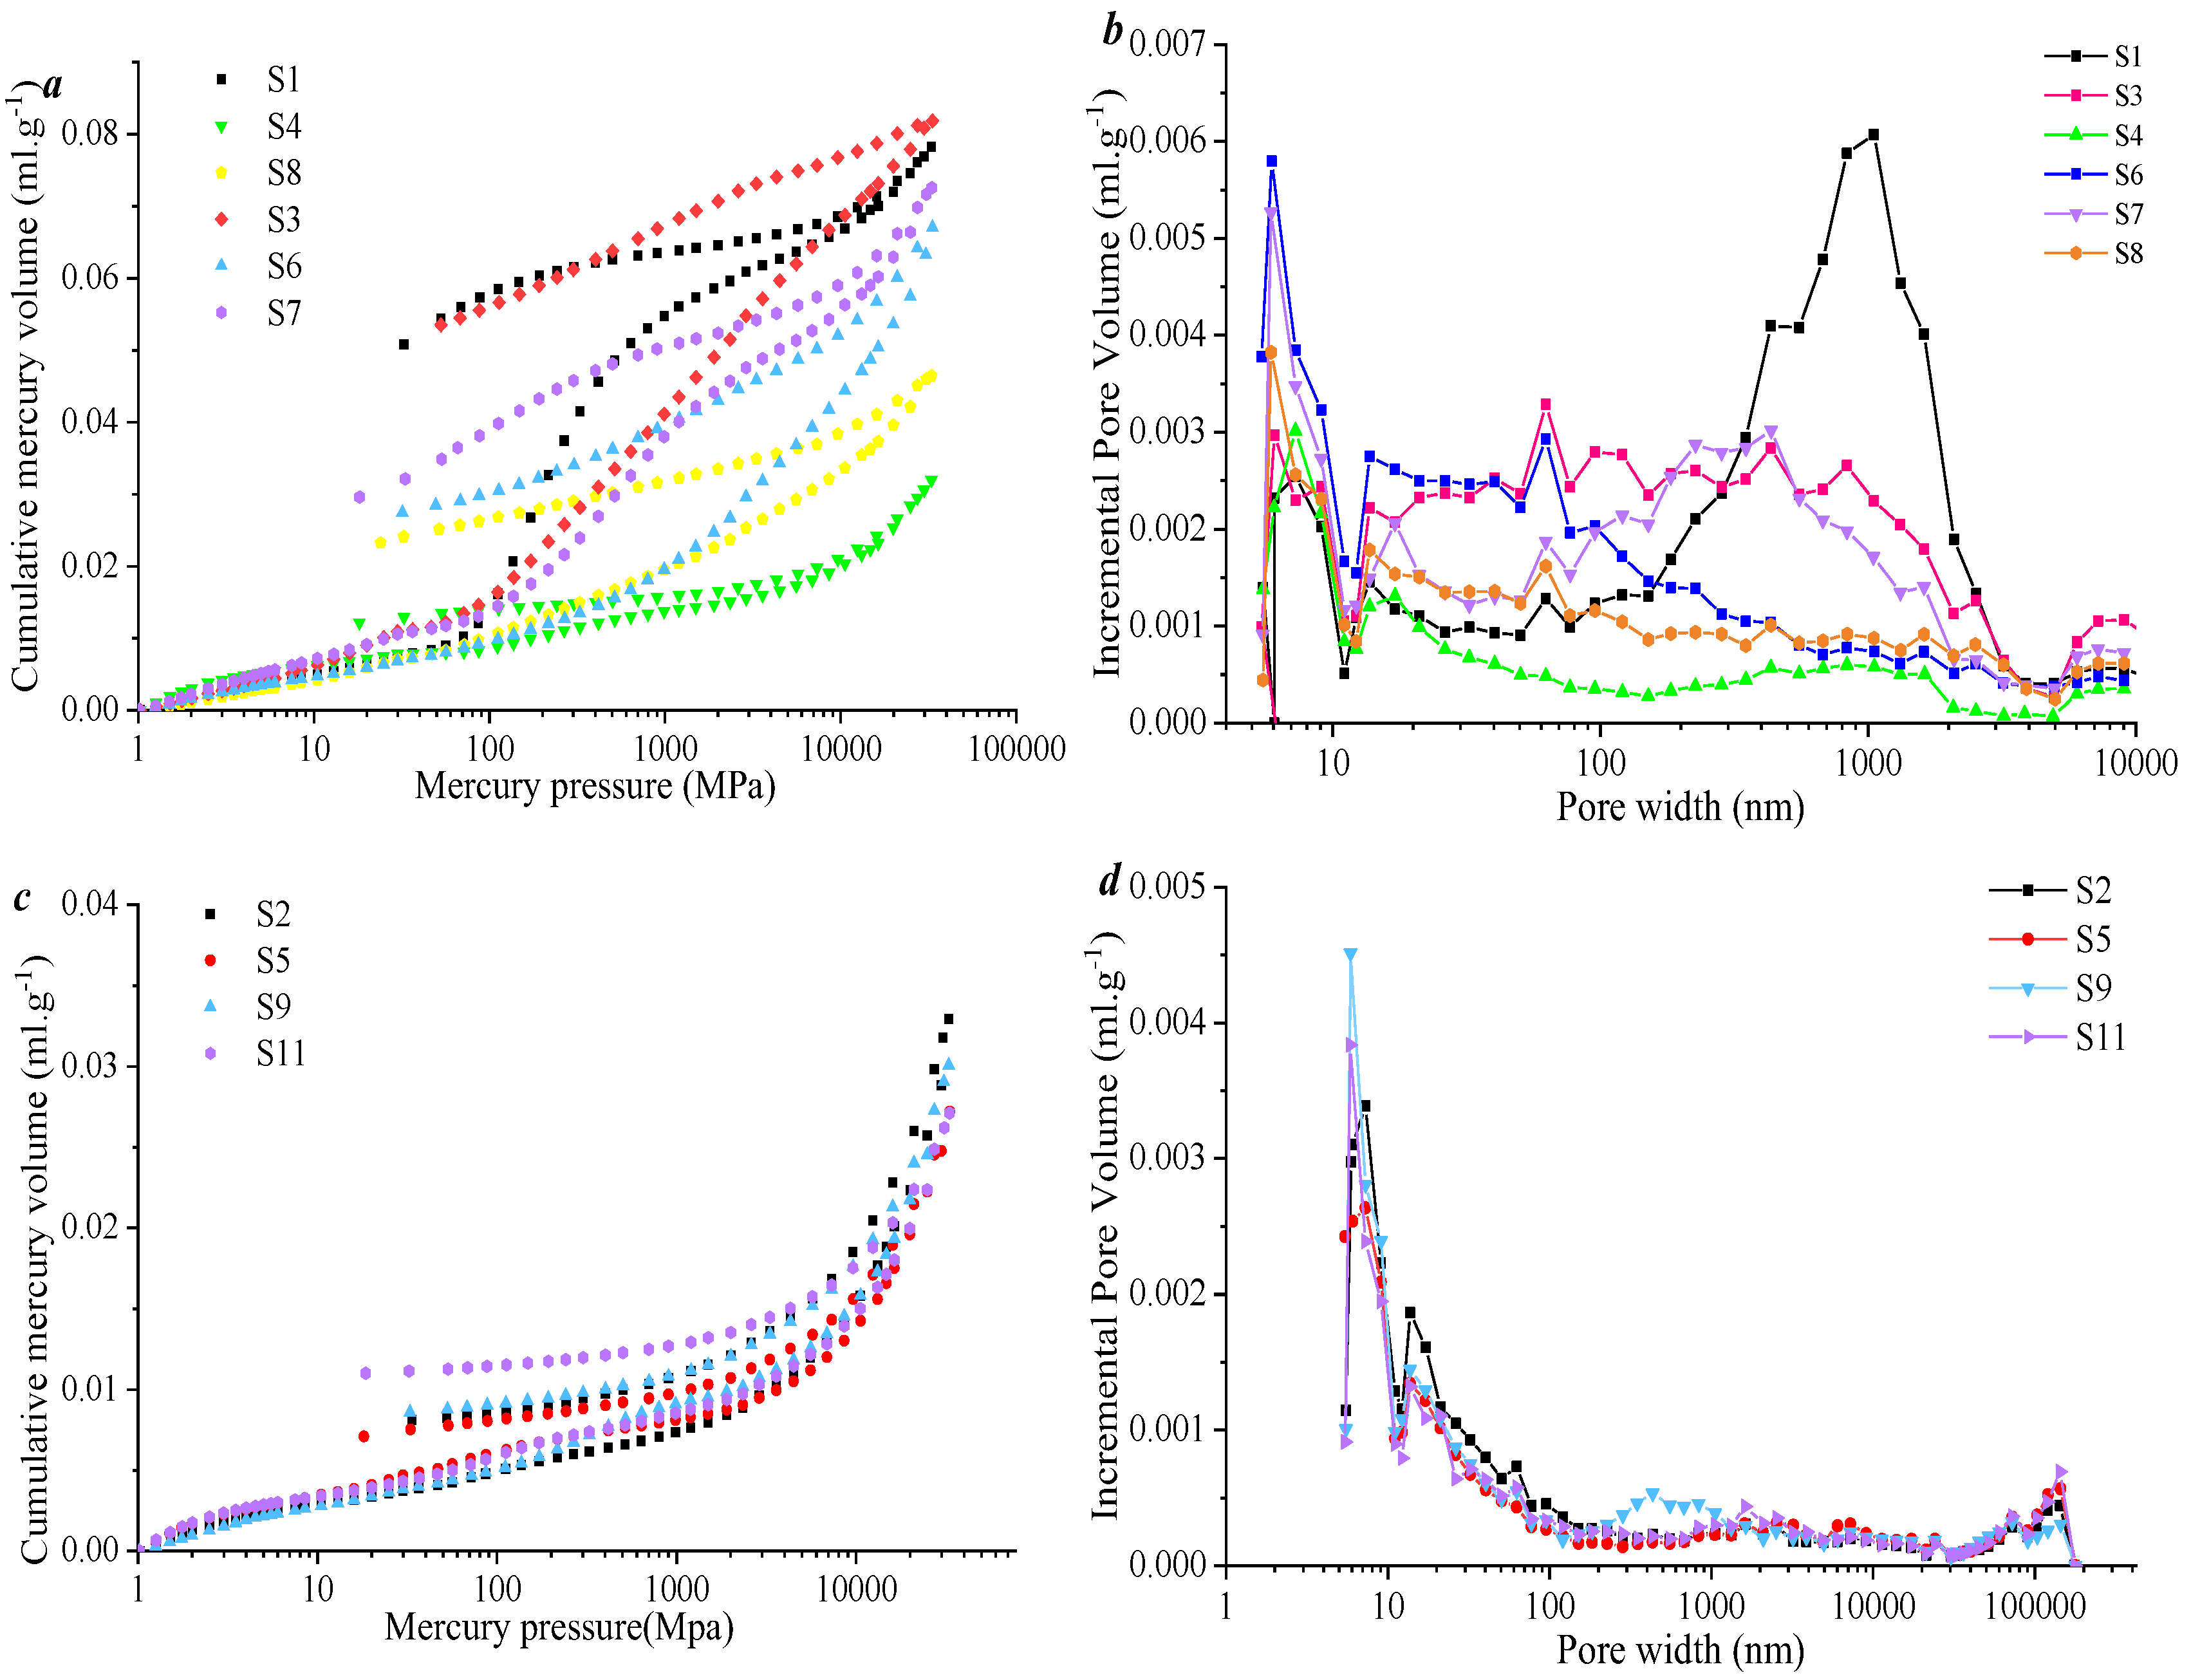
Section 2 shows that the liquid nitrogen test can characterize the pore volume as 2–100 nm. Based on this, the liquid nitrogen adsorption test was used to test the pore volume of such samples in the range of 2–100 nm. The results show that the adsorption and desorption curves among samples with different thermal evolution levels have differences. For low thermal evolution level samples (
Figure 6a), a distinct hysteresis loop was observed between adsorption and desorption curves (at relative pressure around 0.5), which indicates that the mesopores of these samples are ink bottle-shaped pores, and the pore connectivity is poor. In contrast, the adsorption–desorption curves of high thermal evolution coal samples (
Figure 6c) exhibit near coincidence, which indicates that the mesopores of these samples are mostly simple pores, such as parallel plates. This indicates that the pore connectivity is well, and that the pore development type is more single. The mesopore distribution curves reveal that the 10–100 nm pores are the main mesopores, accounting for 75% of the total mesoporous volume, with an average value of 0.0038 cm
3/g. In contrast, the 2–10 nm pore volume is not developed. The reason is that these samples are medium-to-low rank coals with lower thermal evolution levels.
Figure 7 shows that
Ro,max, industrial components, and macerals are not the main factors affecting the development of mesoporous pore volume, which also proves the complexity of mesopore development. Th relevant literature shows that with the increase in thermal evolution, the mesopore volume gradually decreases and increases. The turning point is usually around 2% of
Ro,max. The
Ro,max of the selected samples is less than 2%, which also leads to a more complex development of mesopores at this stage.
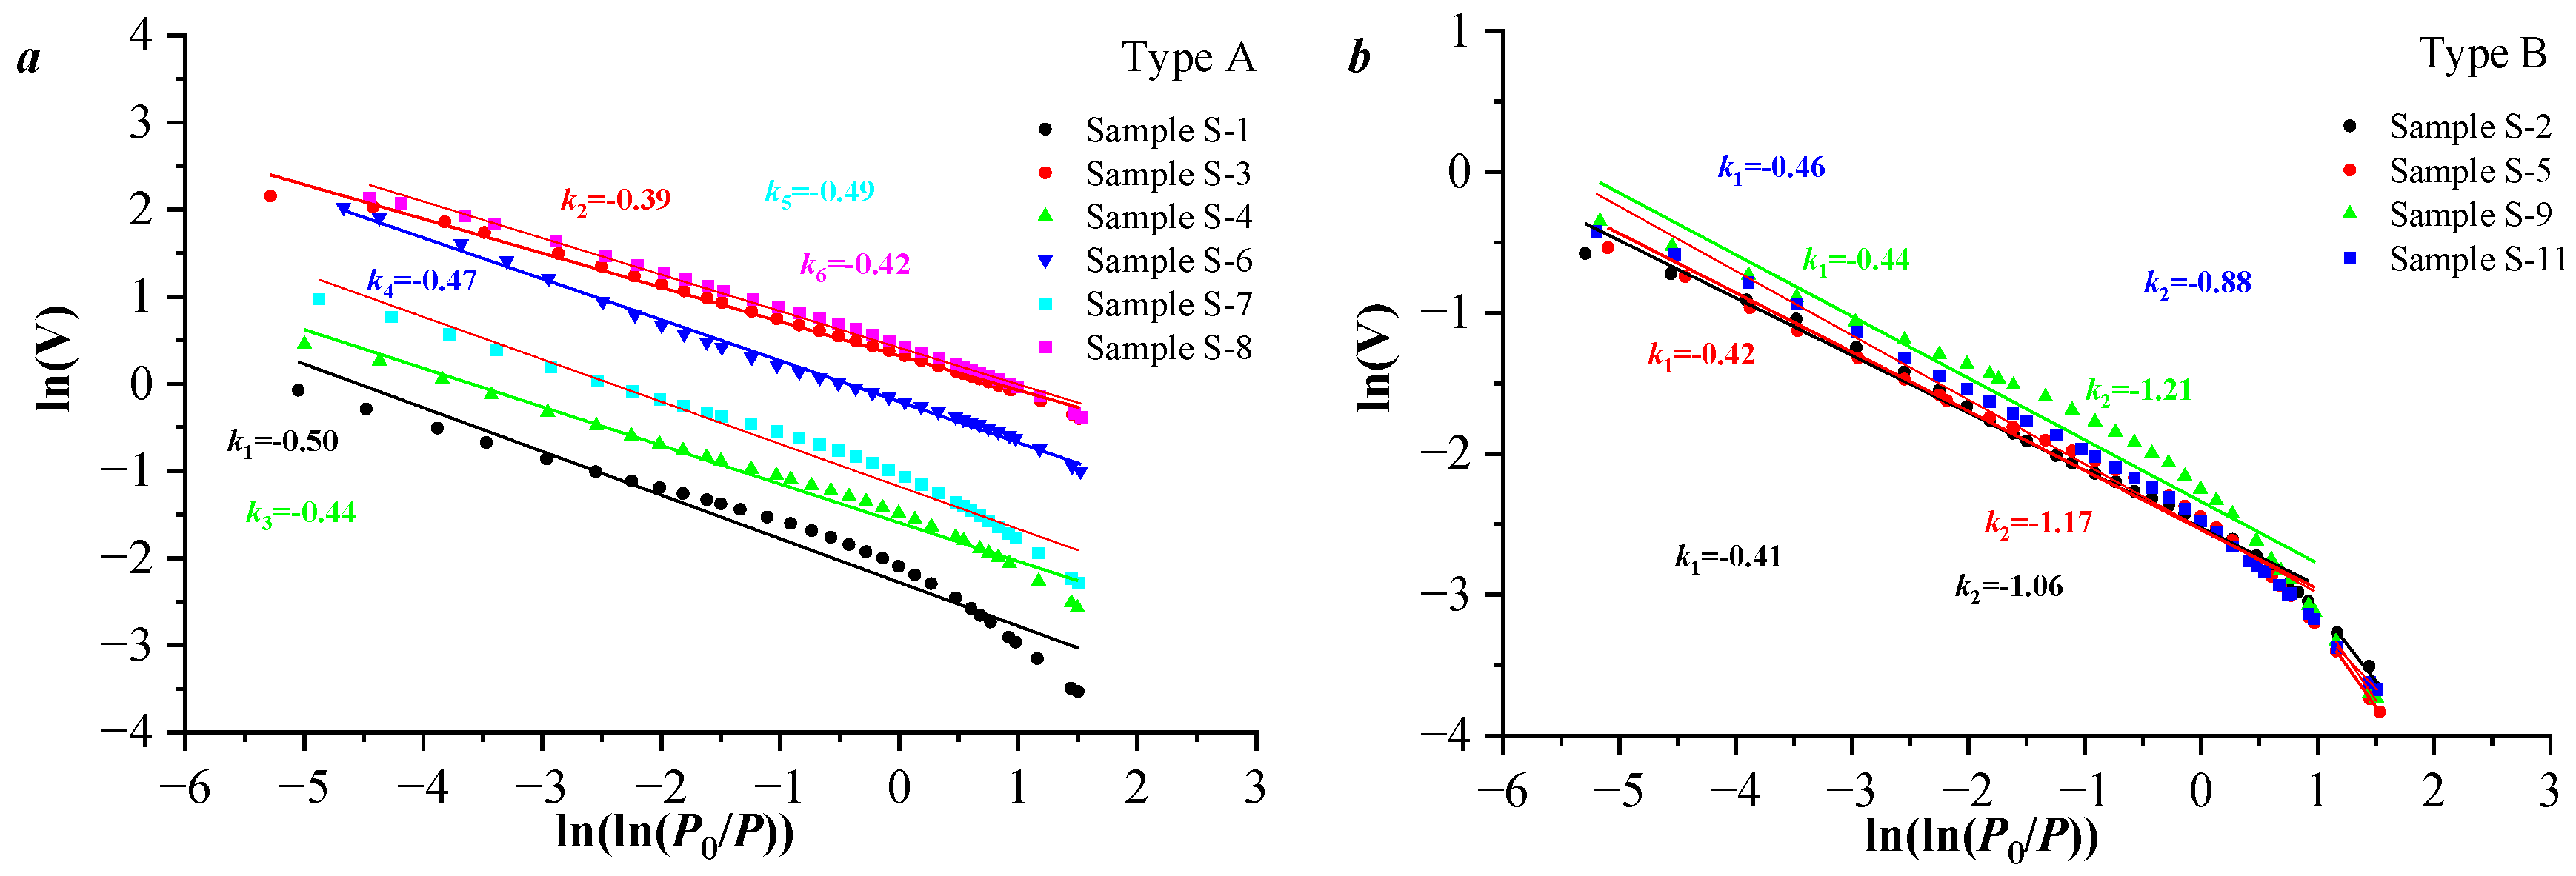
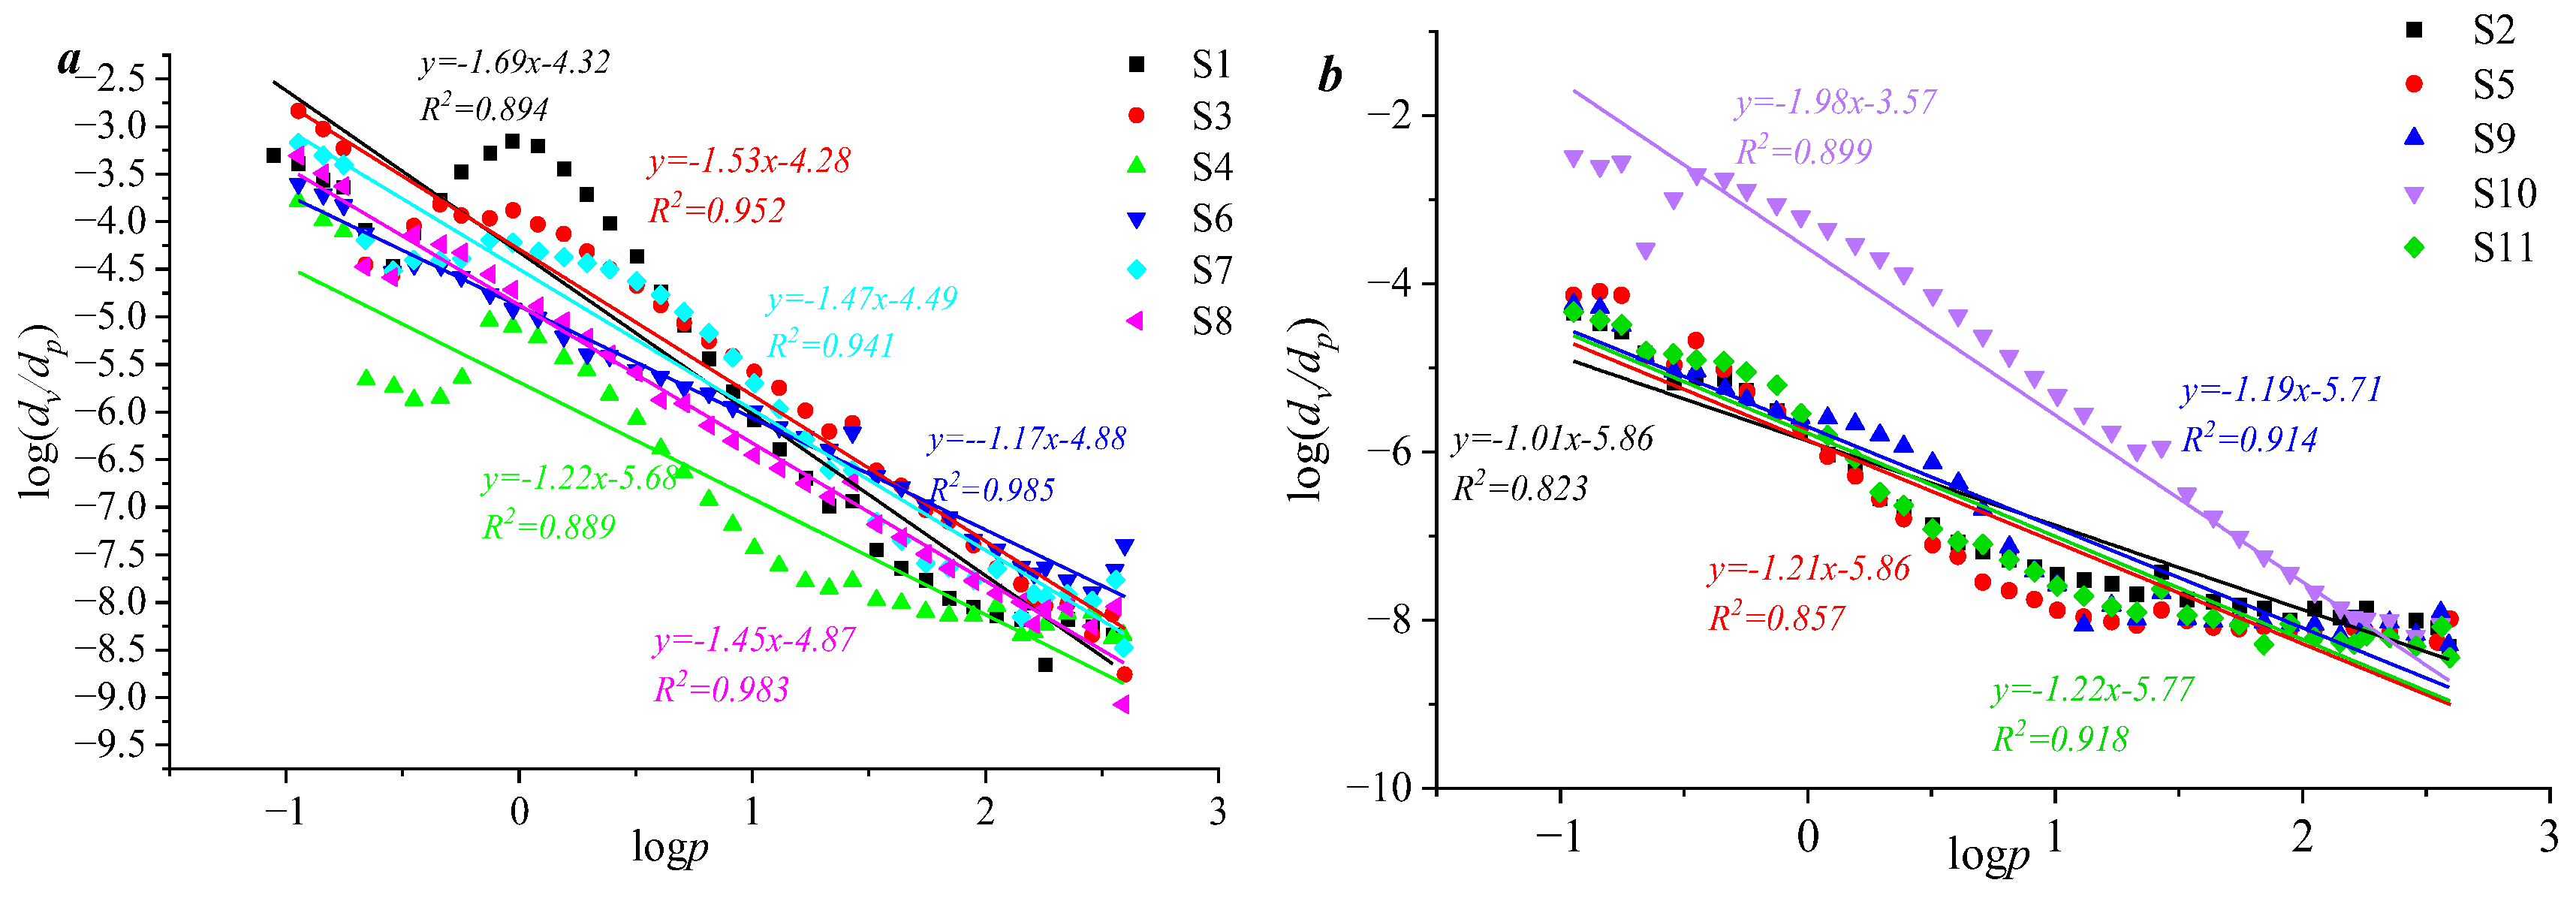
The mesoporous fractal curve of FHH model constructed by Equation (1) is shown in
Figure 8. The results show that there are differences in the mesoporous fractal curves of coal samples with different thermal evolution levels. Specifically, Type A samples exhibit mesoporous fractal curves as continuous segments, which indicates that their mesoporous pore size distribution demonstrates uniformity. The maturity of Type B samples is higher, and the sample classification curve can be divided into two sections with the relative pressure of 0.5 as the boundary. When the pore size is 4–100 nm, the maximum fractal dimension value of this type of sample is 2.59, and the minimum fractal dimension value is 2.54. When the pore size is less than 4 nm, the maximum fractal dimension is 2.12, and the minimum fractal dimension is 1.79. The result indicates that D
1 is greater than D
2, which also shows that the heterogeneity of a pore structure greater than 4 nm is much stronger than that of a pore structure less than 4 nm in these samples. Above all, the fractal curves of mesopores under different thermal evolution levels have differences, which also shows that the influence of thermal evolution levels on mesoporous volume is weaker, but its influence on the heterogeneity of mesoporous distribution is stronger.
Figure 9 shows that mesoporous fractal spectrum shows an inverse S-shape. It indicates that the spectral width of the left peak (D
−10–D
0) is significantly larger than that of the right peak (D
0–D
10), indicating that the heterogeneity in the low value area of pore volume is much stronger than that in the high value area of pore volume, and the range of the low value area of pore volume is 0.32–1.08. The heterogeneity of mesoporous pore distribution is dominated by the heterogeneity of the low pore volume area; thus, this area should be taken as the key analysis object in quantitative characterization.
Figure 10a shows a positive relationship between D
−10–D
0 and D
−10–D
10, while D
0–D
10 and D
−10–D
0 have a weak correlation, which also indicates that there are differences in fractal characteristics between low-value and high-value areas of pores. The two areas exhibit inherent independence.
Figure 10b shows that with the increase of 2–10 nm mesoporous pore volume, the heterogeneity of pore distribution in the low value area of pore volume (D
−10–D
0) gradually weakens. This further indicates that the development variation in pore volume is one of the important factors affecting the multifractal variation in pores.
Figure 10c indicates that the thermal evolution level has a positive correlation with D
−10–D
0 and D
0–D
10, which also shows that the heterogeneity of mesopore distribution is affected by the thermal evolution level.
3.2. Seepage Pore Distribution Heterogeneity
MIP mercury intrusion and extrusion curves are shown in
Figure 11, indicating that the mercury intrusion curves of the selected samples can be categorized into two types: parallel and double S-shaped. Samples of type A predominantly exhibit double S-shaped curves with distinct hysteresis loops, while samples of type B show parallel curves, suggesting that this category of samples develops parallel plate-like structures. Based on the mercury intrusion data, pore structure parameters corresponding to different samples were obtained (
Figure 11b,d). The results show that the total porosity of type A samples ranges from 0.012135 to 0.05274 cm
3·g
−1, which is higher than that of the type B samples (0.005265 to 0.007298 cm
3·g
−1). Additionally, the average total specific surface area of type A samples is higher than that of the type B samples.
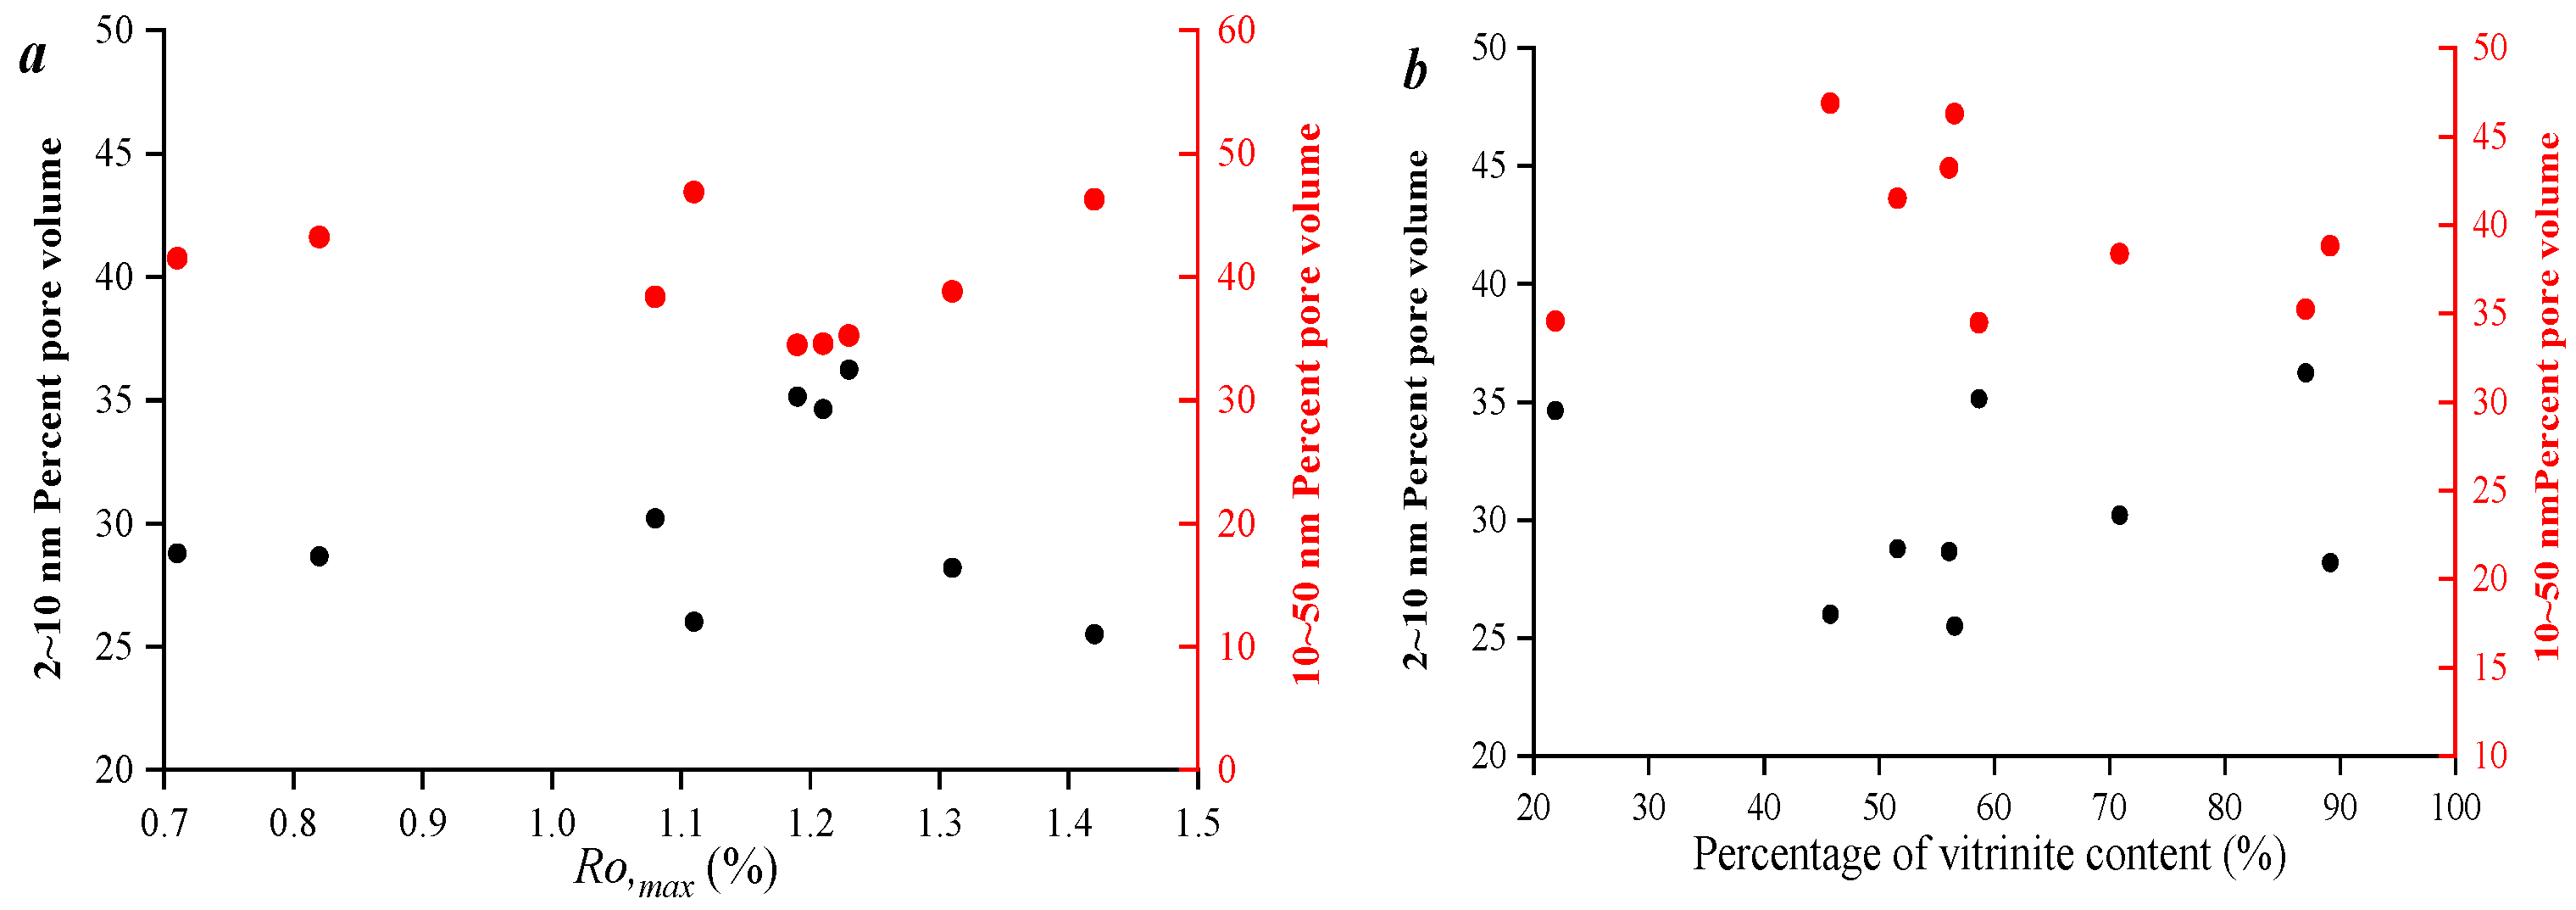
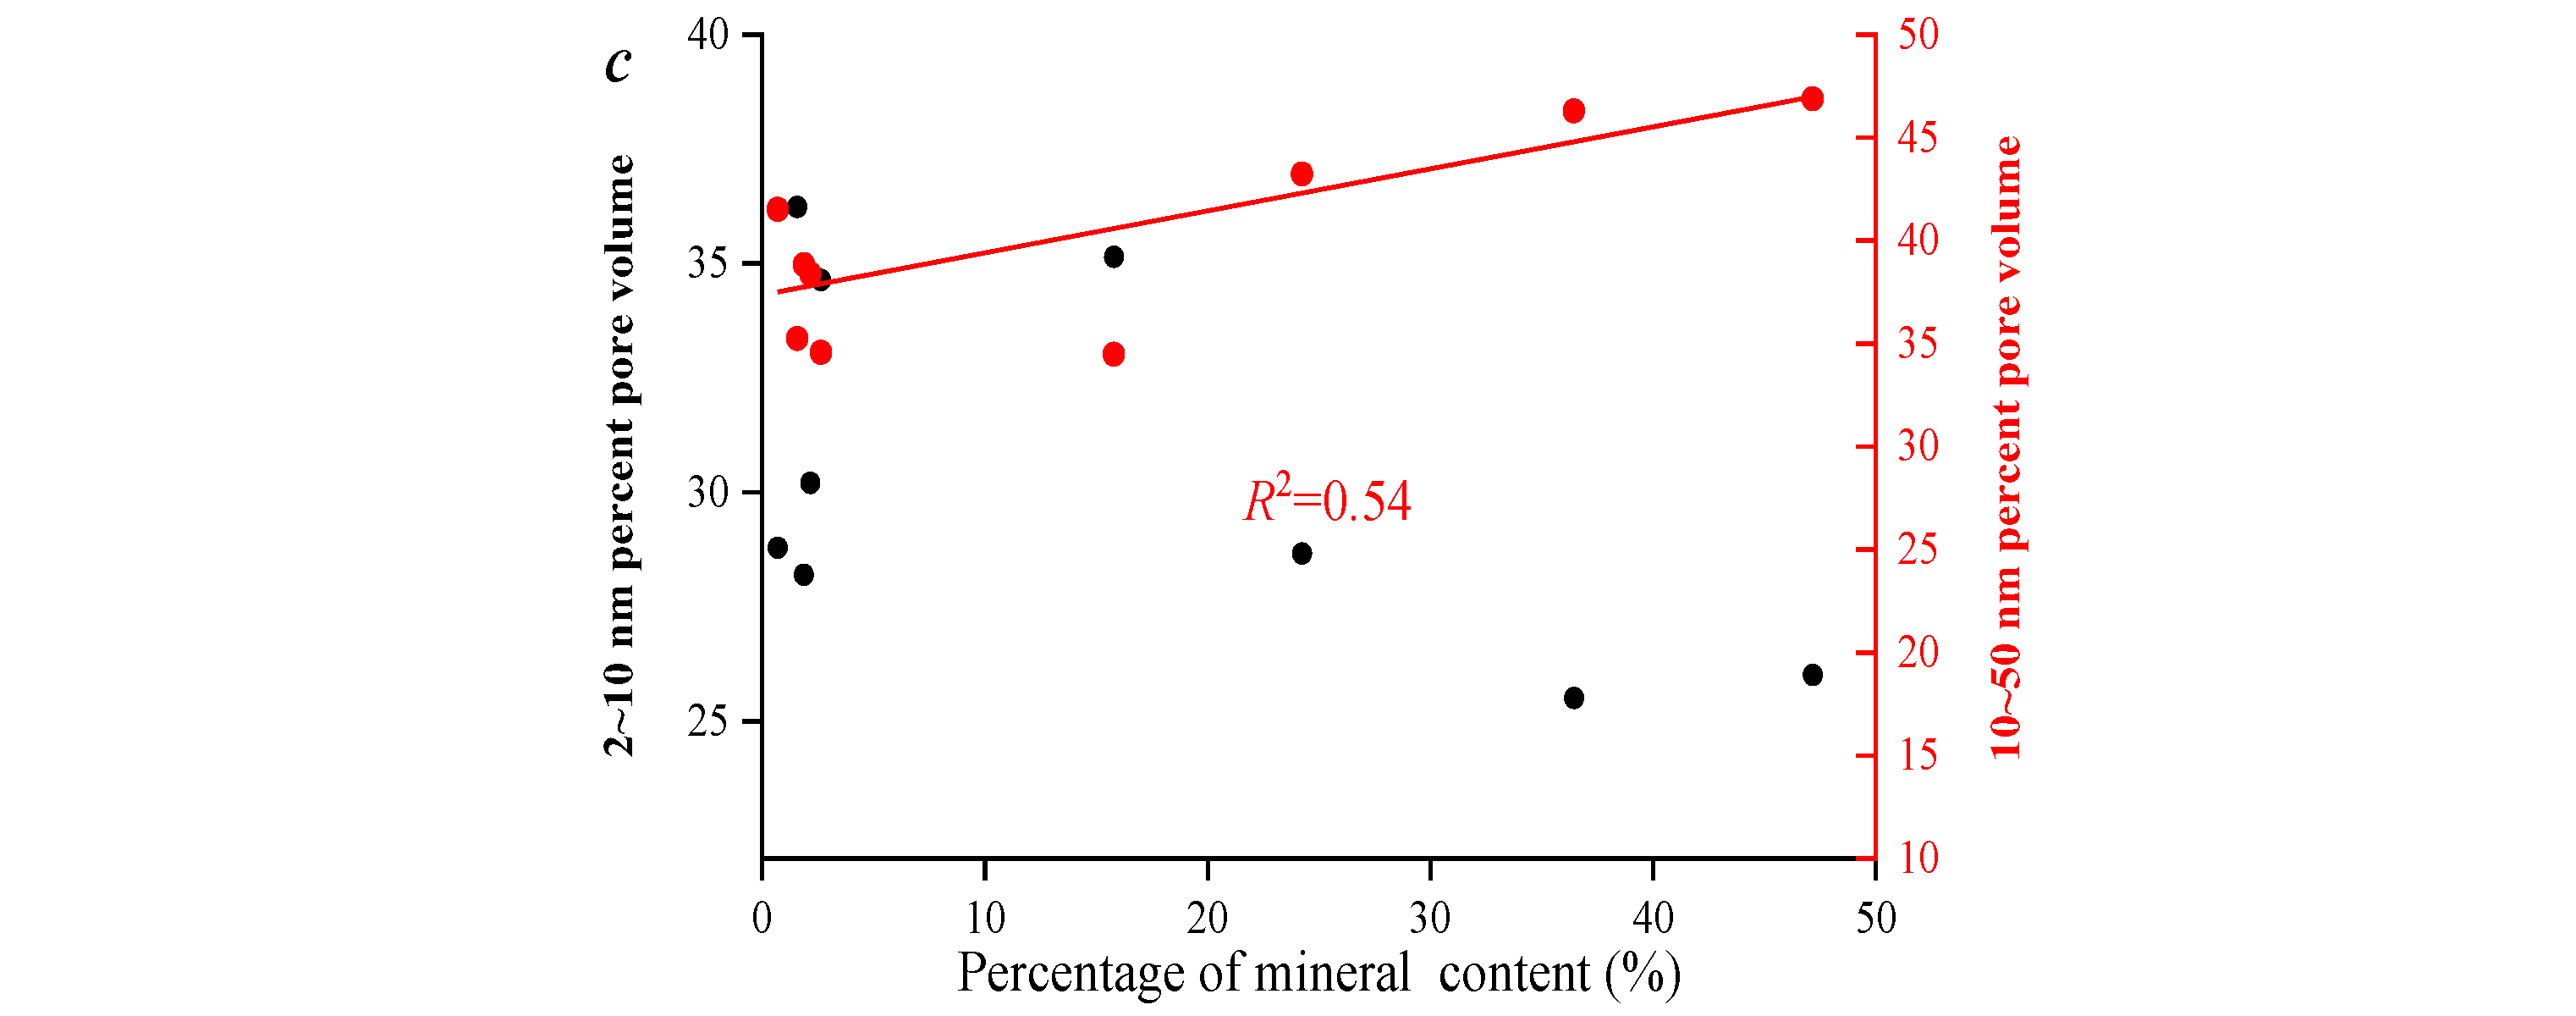
Relationships between pore structure parameters and vitrinite, thermal maturation degree (
Ro,max), and mineral components were analyzed. The results show that the total porosity decreases with an increase in mineral component content. Compared to this, Ro has a weaker effect on the volume of large pores. This is constrained by the Ro range of the selected samples (
Figure 12).
The fractal dimension of the seepage pore was calculated using Equation (1). The results showed that the lg(P) and lg(dv/dp) values of all samples were divided into two segments at an lg(P) value of 1, with R
2 values all greater than 0.96. When lg(P) was less than 1, it corresponded to the low-stress stage (P less than10 MPa), indicating the heterogeneity of larger pore diameter. When lg(P) was greater than 1, it corresponded to the high-stress stage (P is larger than 10 MPa), indicating the heterogeneity of smaller pore sizes (
Figure 13). Overall, fractal dimensions of the two segments were similar, with little difference in fractal characteristics, the two segments were considered as a single entity. Based on multifractal theory, a multifractal analysis was performed on the large pore size distribution curve, revealing that the large pore volume of this type of sample exhibited multifractal characteristics, showing an inverse S-shape. This indicates that the larger pore distribution curve of this type has multifractal characteristics (
Figure 14).
Figure 15a shows that there is a positive relationship between D
−10–D
0 and D
−10–D
10, while D
0–D
10 and D
−10–D
0 have a weak correlation, which also indicates that there are differences in fractal characteristics between low-value and high-value areas of pore volume. The two areas exhibit inherent independence.
Figure 15b shows that with the increase of 2–10 nm pore volume, pore distribution heterogeneity of the lower value area of the pore volume (D
−10–D
0) weakens. This indicates that pore volume is one of the most important factors affecting multifractal variation.
Figure 15c indicates that the thermal evolution degree has a positive correlation with D
−10–D
0 and D
0–D
10, which also indicates that the heterogeneity of mesopore distribution is affected by the thermal evolution level.
4. Conclusions
In this paper, carbon dioxide adsorption, cryogenic liquid nitrogen, and high-pressure mercury intrusion, as well as coal microscopic components, were used to measure pore volumes and quantitatively characterize pore diameter distribution heterogeneity. By the theory of single weight and multiple fractal formations, the heterogeneity of the pore fracture structure of the coal reservoir is expressed, and the influencing factors of the heterogeneity of the pore fracture structure and the pore volume are also discussed. The conclusions are as follows.
(1) The adsorption capacity of CO2 in the coal sample with a high degree of evolution is higher than that in the weaker Ro,max sample. Micro-pore distribution presents a distinct bidirectional state, with the main peak at approximately 0.6 nm and the secondary peak at approximately 0.85 nm. Ro,max has a relatively obvious influence on micro-pore volume. The single-fractal dimension of micro-pore is not affected by a micro-pore volume, but it is influenced by other factors such as Ro,max and microscopic composition. The heterogeneity of the low-value area of the pore volume controls the heterogeneity of micro-pore diameter distribution.
(2) For lower Ro,max samples, mesopores of these samples are ink bottle-shaped pores, and the pore connectivity is poor. In contrast, the meso-pore of the higher thermal evolution coal samples are mostly simple pores, such as parallel plates. The main mesopores are 10–100 nm pores, accounting for 75% of the total meso-pore volume, with an average value of 0.0038 cm3/g. The single fractal dimension D1 is greater than D2, which also shows that the heterogeneity of pore structure greater than 4 nm is much stronger than that of pore structure less than 4 nm in these samples.
(3) For lower Ro,max samples, double S-shaped curves with a distinct hysteresis loop are obtained, while samples of higher Ro,max samples show parallel curves, suggesting that this type of sample develops parallel plate-like structures. There is a positive relationship between D−10–D0 and D−10–D10, while D0–D10 and D−10–D0 have a weak correlation. With the increase of 2–10 nm pore volume, pore distribution heterogeneity of lower value area of pore volume (D−10–D0) weakens. This indicates that pore volume is one of the most important factors affecting multifractal variation.
It should be noted that, limited by the number of samples and the study area, the current experimental results of the samples only analyzed typical wells, making it difficult to comprehensively characterize the development characteristics of pore and fracture structures in the entire study area. In subsequent research, it is necessary to strengthen the collection of samples and the organization of data.
Author Contributions
Software, B.F., Z.Q. and Y.G.; Formal analysis, Z.Z.; Investigation, M.C. and Y.H.; Resources, X.L. All authors have read and agreed to the published version of the manuscript.
Funding
This research was sponsored by Henan Provincial Key Science and Technology Tackling Program (No. 242102320349).
Data Availability Statement
The original contributions presented in this study are included in the article. Further inquiries can be directed to the corresponding authors.
Conflicts of Interest
The authors declare no conflict of interest.
References
- Yao, P.; Zhang, J.; Lv, D.; Vandeginste, V.; Chang, X.; Zhang, X.; Wang, D.; Han, S.; Liu, Y. Effect of water occurrence in coal reservoirs on the production capacity of coalbed methane by using NMR simulation technology and production capacity simulation. Geoenergy Sci. Eng. 2024, 243, 213353. [Google Scholar] [CrossRef]
- Xu, F.Y.; Xiong, X.Y.; Hou, W.; Wang, F.; Ma, P.; Zhang, L.; Yun, J.; Yu, Y.; Yan, X.; Xu, B.; et al. Upgrading of deep coalbed methane industry and establishment of ‘eight integration’ system. Pet. J. 2025, 46, 289–305. [Google Scholar]
- Xu, F.; Hou, W.; Xiong, X.; Xu, B.; Wu, P.; Wang, H.; Feng, K.; Yun, J.; Li, S.; Zhang, L.; et al. The status and development strategy of coalbed methane industry in China. Pet. Explor. Dev. 2023, 50, 765–783. [Google Scholar] [CrossRef]
- Tao, S.; Chen, S.D.; Pan, Z.J. Current status, challenges, and policy suggestions for coalbed methane industry development in China: A review. Energy Sci. Eng. 2019, 7, 1059–1074. [Google Scholar] [CrossRef]
- Li, Y.; Yang, J.; Pan, Z.; Meng, S.; Wang, K.; Niu, X. Unconventional Natural Gas Accumulations in Stacked Deposits: A Discussion of Upper Paleozoic Coal-Bearing Strata in the East Margin of the Ordos Basin, China. Acta Geol. Sin.-Engl. Ed. 2019, 93, 111–129. [Google Scholar] [CrossRef]
- Li, B.; Wang, Y.; Yang, M.; Hu, J.; Zhang, X.; Zhang, C.; Wen, Z.; Wu, C. Distribution characteristics and genesis of deep coal reservoirs in the central and eastern Ordos Basin. Natural Gas Geoscience, 13 May 2025. [Google Scholar]
- Yao, J.; Han, H.; Yang, Y.; Song, Y.; Li, G. A Review of Recent Progress of Carbon Capture, Utilization, and Storage (CCUS) in China. Appl. Sci. 2023, 13, 1169. [Google Scholar] [CrossRef]
- Zheng, S.; Yao, Y.; Liu, D.; Cai, Y.; Liu, Y. Characterizations of full-scale pore size distribution, porosity and permeability of coals: A novel methodology by nuclear magnetic resonance and fractal analysis theory. Int. J. Coal Geol. 2018, 196, 148–158. [Google Scholar] [CrossRef]
- Liu, T.; Lin, B.Q.; Yang, W. Impact of matrix-fracture interactions on coal permeability: Model development and analysis. Fuel 2017, 207, 522–532. [Google Scholar] [CrossRef]
- Wang, T.; Deng, Z.; Hu, H.; Ding, R.; Tian, F.; Zhang, T.; Ma, Z.; Wang, D. Pore structure of deep coal of different ranks and its effect on coalbed methane adsorption. Int. J. Hydrogen Energy 2024, 59, 144–158. [Google Scholar] [CrossRef]
- Zhang, J.; Wei, C.; Zhao, C.; Zhang, T.; Lu, G.; Zou, M. Effects of nano-pore and macromolecule structure of coal samples on energy parameters variation during methane adsorption under different temperature and pressure. Fuel 2021, 289, 119804. [Google Scholar] [CrossRef]
- Zhang, L.S.; Shan, Y.F. Quantitative Analysis of Fracture Roughness and Multi-Field Effects for CO2-ECBM Projects. Energies 2024, 17, 2851. [Google Scholar] [CrossRef]
- Su, E.; Wei, J.; Chen, H.; Chen, X.; Liang, Y.; Zou, Q.; Zhu, X. Effect of CO2 injection on Coalbed Permeability Based on a Thermal-Hydraulic-Mechanical Coupling Model. Energy Fuels 2024, 38, 11078–11092. [Google Scholar] [CrossRef]
- Liu, S.; Sun, H.; Zhang, D.; Yang, K.; Wang, D.; Li, X.; Long, K.; Li, Y. Nuclear magnetic resonance study on the influence of liquid nitrogen cold soaking on the pore structure of different coals. Phys. Fluids 2023, 35, 012009. [Google Scholar] [CrossRef]
- Fu, H.; Tang, D.; Xu, T.; Xu, H.; Tao, S.; Li, S.; Yin, Z.; Chen, B.; Zhang, C.; Wang, L. Characteristics of pore structure and fractal dimension of low-rank coal: A case study of Lower Jurassic Xishanyao coal in the southern Junggar Basin, NW China. Fuel 2017, 193, 254–264. [Google Scholar] [CrossRef]
- Chang, X.; Han, R.; Zhang, J.; Vandeginste, V.; Zhang, X.; Liu, Y.; Han, S. Prediction of Coal Body Structure of Deep Coal Reservoirs Using Logging Curves: Principal Component Analysis and Evaluation of Factors Influencing Coal Body Structure Distribution. Nat. Resour. Res. 2025, 34, 1023–1044. [Google Scholar] [CrossRef]
- Yang, R.; Zhang, H.; Zhang, J.; Wang, F.; Li, M.; Yin, T.; Wen, S.; Han, Y. Effects of Nanopore Structure Heterogeneity of Coal Samples on Adsorption Ability and Porosity-Permeability Variation. Energy Fuels 2023, 37, 2721–2734. [Google Scholar] [CrossRef]
- Zhou, H.; Liu, Z.; Zhong, J.; Chen, B.; Zhao, J.; Xue, D. NMRI online observation of coal fracture and pore structure evolution under confining pressure and axial compressive loads: A novel approach. Energy 2022, 261, 125297. [Google Scholar] [CrossRef]
- Liao, Z.; Liu, X.; Song, D.; He, X.; Nie, B.; Yang, T.; Wang, L. Micro-structural damage to coal induced by liquid CO2 phase change fracturing. Nat. Resour. Res. 2021, 30, 1613–1627. [Google Scholar] [CrossRef]
- Zhang, J.; Wang, H.; Vandeginste, V.; Miao, H.; Guo, Y.; Ji, Y.; Liu, P.; Peng, Y. Effect of litho-facies on nano-pore structure of continental shale in shuinan formation of Jiaolai Basin. Geoenergy Sci. Eng. 2023, 228, 212020. [Google Scholar] [CrossRef]
- Chen, S.D.; Tao, S.; Tang, D.Z. In situ coal permeability and favorable development methods for coalbed methane (CBM) extraction in China: From real data. Interational J. Coal Geol. 2024, 284, 104472. [Google Scholar] [CrossRef]
- Fan, C.; Elsworth, D.; Li, S.; Chen, Z.; Luo, M.; Song, Y.; Zhang, H. Modelling and optimization of enhanced coalbed methane recovery using CO2/N2 mixtures. Fuel 2019, 253, 1114–1129. [Google Scholar] [CrossRef]
- Chen, G.; Li, J.; Zhang, W.; Gao, M.; Zhang, F.; Zhang, X.; Zhang, J. Logging calculation method of coalbed methane content in deep medium-low coal rank reservoirs. Geol. Xinjiang 2024, 42, 385–391. [Google Scholar]
- Zhou, S.; Liu, D.; Cai, Y.; Yao, Y.; Jiao, Y.; Ren, S. Characteristics and fractal characterization of adsorption pores in low rank coal. Pet. Nat. Gas Geol. 2018, 39, 373–383. [Google Scholar]
- Wu, J.; Sun, Q.; Shi, X.; Gao, L. Research on the pore structure and fluid differential occurrence characteristics of deep coal seams. Coalf. Geol. Explor. 2024, 52, 89–100. [Google Scholar]
- Dai, X.; Wei, C.; Wang, M.; Ma, R.; Song, Y.; Zhang, J.; Wang, X.; Shi, X.; Vandeginste, V. Interaction mechanism of supercritical CO2 with shales and a new quantitative storage capacity evaluation method. Energy 2023, 264, 126424. [Google Scholar] [CrossRef]
- Zhao, L.; Chang, X.; Li, D.; Zhang, J.; Vandeginste, V.; Yao, P.; Su, J. Effect of coal facies on pore structure heterogeneity of coal measures: Quantitative characterization and comparative study. Open Geosci. 2024, 16, 20220738. [Google Scholar] [CrossRef]
- Liu, J.; Yang, D.; Yang, M.; Nie, Z.; Wang, D. Research on the main control factors of gas desorption in middle and low rank coals based on orthogonal testing. Fuel 2023, 357, 129862. [Google Scholar] [CrossRef]
- GB/T 19222-2003; Methods for Sampling Coal and Rock Samples. China Standard Press: Beijing, China, 2003.
- GB/T 18023-2000; Macroscopic Classification of Coal Rock Types for Bituminous Coal. China Standard Press: Beijing, China, 2000.
- GB/T 6948-1998; Microscopic Determination Method for Vitrinite Reflectance of Coal. China Standard Press: Beijing, China, 1998.
- GB/T 212-2001; Industrial Analysis Methods for Coal. China Standard Press: Beijing, China, 2001.
- Liang, W.G.; Yan, J.W.; Zhang, B.N.; Hou, D.S. Review on coal bed methane recovery theory and technology: Recent progress and perspectives. Energy Fuels 2021, 35, 4633–4643. [Google Scholar] [CrossRef]
- Saghafi, A. Discussion on determination of gas content of coal and uncertainties of measurement. Int. J. Min. Sci. Technol. 2017, 27, 741–748. [Google Scholar] [CrossRef]
- Liu, A.; Fu, X.; Wang, K.; An, H.; Wang, G.; Kędzior, S. Investigation of coalbed methane potential in low-rank coal reservoirs-Free and soluble gas contents. Fuel 2013, 112, 14–22. [Google Scholar] [CrossRef]
- Li, C.; Qin, Y.; Guo, T.; Shen, J.; Yang, Y. Supercritical methane adsorption in coal and implications for the occurrence of deep coalbed methane based on dual adsorption modes. Chem. Eng. J. 2023, 474, 145931. [Google Scholar] [CrossRef]
- Qin, Y. Progress on geological research of deep coalbed methane in China. Acta Petrol Sin. 2023, 44, 1791–1811. [Google Scholar]
Figure 1.
CO2 adsorption curves and micro-pore diameter distribution. (a) CO2 adsorption curve of the first type; (b) micro-pore diameter distribution of the first type; (c) CO2 adsorption curve of the second type; (d) micro-pore diameter distribution of the second type.
Figure 1.
CO2 adsorption curves and micro-pore diameter distribution. (a) CO2 adsorption curve of the first type; (b) micro-pore diameter distribution of the first type; (c) CO2 adsorption curve of the second type; (d) micro-pore diameter distribution of the second type.
Figure 2.
Single fractal dimension curves of micro-pore. (a) Single fractal dimension curves of the first type; (b) Single fractal dimension curves of the first type.
Figure 2.
Single fractal dimension curves of micro-pore. (a) Single fractal dimension curves of the first type; (b) Single fractal dimension curves of the first type.
Figure 3.
Correlation between Ro,max of micro-pore volume, etc. (a) Correlation analysis between D2 and D1; (b) Correlation analysis between D1–D2 and D1; (c) Correlation analysis between pore volume and D1; (d) Correlation analysis between pore volume and D2.
Figure 3.
Correlation between Ro,max of micro-pore volume, etc. (a) Correlation analysis between D2 and D1; (b) Correlation analysis between D1–D2 and D1; (c) Correlation analysis between pore volume and D1; (d) Correlation analysis between pore volume and D2.
Figure 4.
Multifractal dimension curves of micro-pore. (a) Analysis of multi fractal dimension differences; (b) Correlation analysis between i(q) and q; (c) Multi fractal dimension of A; (d) Multi fractal dimension of B.
Figure 4.
Multifractal dimension curves of micro-pore. (a) Analysis of multi fractal dimension differences; (b) Correlation analysis between i(q) and q; (c) Multi fractal dimension of A; (d) Multi fractal dimension of B.
Figure 5.
Correlation between multi-fractal parameters of micro-pore, etc. (a) Correlation analysis between D−10–D0, D0–D10 and D−10–D10; (b) Correlation analysis between D−10–D0 and pore volume; (c) Correlation analysis between D−10–D0, D0–D10 and Ro,max; (d) Correlation analysis between D−10–D0, D0–D10 and Vitrinite; (e) Correlation analysis between D−10–D0, D0–D10 and Mineral components.
Figure 6.
N2 adsorption curve and mesopore distribution. (a) Type A adsorption curve; (b) Type A pore size distribution; (c) Type B adsorption curve; (d) Type B pore size distribution.
Figure 6.
N2 adsorption curve and mesopore distribution. (a) Type A adsorption curve; (b) Type A pore size distribution; (c) Type B adsorption curve; (d) Type B pore size distribution.
Figure 7.
Analysis of factors affecting mesoporous volume. (a) Correlation analysis between mesoporous volume and Ro,max; (b) Correlation analysis between mesoporous volume and Vitrinite; (c) Correlation analysis between mesoporous volume and Mineral components.
Figure 7.
Analysis of factors affecting mesoporous volume. (a) Correlation analysis between mesoporous volume and Ro,max; (b) Correlation analysis between mesoporous volume and Vitrinite; (c) Correlation analysis between mesoporous volume and Mineral components.
Figure 8.
Mesoporous single fractal curve. (a) Mesoporous single fractal curve of A; (b) Mesoporous single fractal curve of B.
Figure 8.
Mesoporous single fractal curve. (a) Mesoporous single fractal curve of A; (b) Mesoporous single fractal curve of B.
Figure 9.
Mesoporous multifractal curve. (a) Mesoporous multifractal curve of A; (b) Mesoporous multifractal curve of B.
Figure 9.
Mesoporous multifractal curve. (a) Mesoporous multifractal curve of A; (b) Mesoporous multifractal curve of B.
Figure 10.
Correlation analysis and influencing factors of mesoporous multifractal parameters. (a) Correlation analysis between mesoporous volume and Ro,max; (b) Correlation analysis between mesoporous volume and Vitrinite; (c) Correlation analysis between mesoporous volume and Mineral components; (d) Correlation analysis between mesoporous volume and Mineral components.
Figure 11.
Pressure–mercury curves and pore diameter distribution. (a) Type A pressure–mercury curves; (b) Type A pore diameter distribution; (c) Type B pressure–mercury curves; (d) Type B pore diameter distribution.
Figure 11.
Pressure–mercury curves and pore diameter distribution. (a) Type A pressure–mercury curves; (b) Type A pore diameter distribution; (c) Type B pressure–mercury curves; (d) Type B pore diameter distribution.
Figure 12.
Analysis of influencing factors of mesoporous volume. (a) Correlation analysis between total pore volume and Ro,max; (b) Correlation analysis between percentage and Ro,max; (c) Correlation analysis between total pore volume and Vitrinite; (d) Correlation analysis between pore volume and Liptinite; (e) Correlation analysis between total pore volume and Mineral components.
Figure 13.
Comparison of dimensionality values for different types of samples based on the M-model. (a) M-model of type A; (b) M-model of type B.
Figure 13.
Comparison of dimensionality values for different types of samples based on the M-model. (a) M-model of type A; (b) M-model of type B.
Figure 14.
Multifractal dimension curves of mesoporous pore. (a) Multifractal curve of Class A sample; (b) Multifractal curve of Class A sample.
Figure 14.
Multifractal dimension curves of mesoporous pore. (a) Multifractal curve of Class A sample; (b) Multifractal curve of Class A sample.
Figure 15.
Correlation between the multi-fractal parameter of mesoporous pore (a) Relationship between D-10-D0 and D-10-D10; (b) Relationship between mineral contents and multi-fractal dimension; (c) Relationship between vitrinite contents and multi-fractal dimension).
Figure 15.
Correlation between the multi-fractal parameter of mesoporous pore (a) Relationship between D-10-D0 and D-10-D10; (b) Relationship between mineral contents and multi-fractal dimension; (c) Relationship between vitrinite contents and multi-fractal dimension).
Table 1.
Microscopic composition and maturity of the selected sample.
Table 1.
Microscopic composition and maturity of the selected sample.
| Sample No. | Ro,max (%) | Vitrinite (%) | Liptinite (%) | Inertinite (%) | Mineral Components (%) |
|---|
| S1 | 1.31 | 89.14 | 0 | 8.99 | 1.87 |
| S3 | 1.11 | 45.75 | 0 | 7.08 | 47.17 |
| S4 | 1.19 | 58.65 | 0 | 25.56 | 15.79 |
| S6 | 1.17 | 91.04 | 0 | 1.08 | 7.88 |
| S7 | 1.08 | 70.86 | 0 | 26.98 | 2.16 |
| S8 | 1.42 | 56.54 | 0 | 7.01 | 36.45 |
| S2 | 1.23 | 87.01 | 0 | 11.42 | 1.57 |
| S5 | 1.21 | 21.89 | 0.38 | 75.09 | 2.64 |
| S9 | 1.42 | | | | |
| S10 | 0.82 | 56.06 | 0.76 | 18.94 | 24.24 |
| S11 | 0.71 | 51.58 | 6.66 | 41.06 | 0.7 |
| Disclaimer/Publisher’s Note: The statements, opinions and data contained in all publications are solely those of the individual author(s) and contributor(s) and not of MDPI and/or the editor(s). MDPI and/or the editor(s) disclaim responsibility for any injury to people or property resulting from any ideas, methods, instructions or products referred to in the content. |
© 2025 by the authors. Licensee MDPI, Basel, Switzerland. This article is an open access article distributed under the terms and conditions of the Creative Commons Attribution (CC BY) license (https://creativecommons.org/licenses/by/4.0/).


 and
and 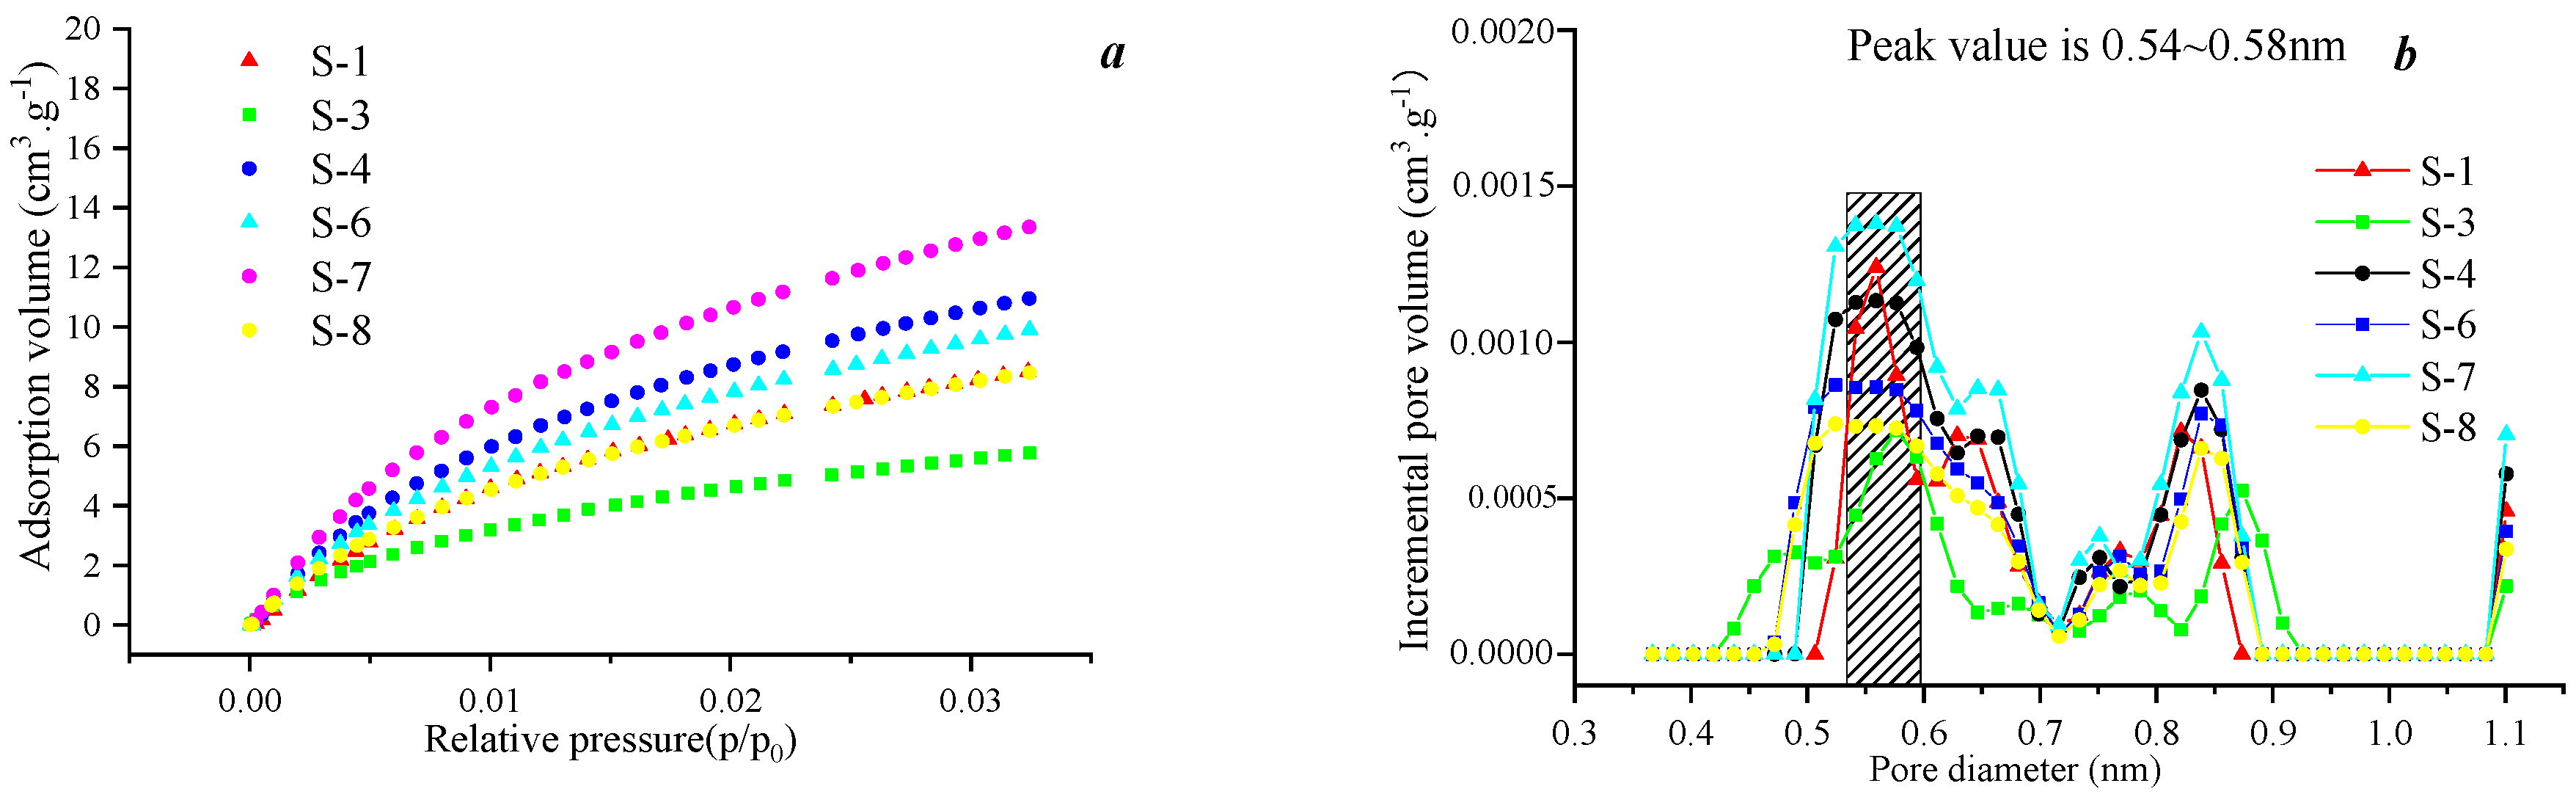


