Article

Valorization of Grape Seed By-Products Using Subcritical Water Extraction: A Sustainable Approach for Bioactive Compound Recovery

by
Marion Breniaux
1,*,
Benjamin Poulain
1,
Sandra Mariño-Cortegoso
2,
Letricia Barbosa-Pereira
2,
Claudia Nioi
1 and
Rémy Ghidossi
1
1
Univ. Bordeaux, Bordeaux INP, Bordeaux Sciences Agro, INRAE, OENO, UMR 1366, ISVV, F-33140 Villenave d’Ornon, France
2
Department of Analytical Chemistry, Nutrition and Food Science, Faculty of Pharmacy, University of Santiago de Compostela, E-15782 Santiago de Compostela, Spain
*
Author to whom correspondence should be addressed.
Processes 2025, 13(6), 1788; https://doi.org/10.3390/pr13061788
Submission received: 27 March 2025 / Revised: 14 May 2025 / Accepted: 22 May 2025 / Published: 5 June 2025
(This article belongs to the Section Environmental and Green Processes)

Abstract

:
Grape seeds are a major by-product of the winemaking industry and a great source of bioactive compounds such as polyphenols and proteins. These compounds have a wide range of applications including those in nutraceutical products and cosmetics and within the wine industry itself. Subcritical water extraction (SWE) was explored as a global method to valorize grape seed by-products for their different bioactive compounds in the context of waste valorization, green chemistry (solvent-free extraction), and circular economy. A Box–Behnken design was applied to generate mathematical responses and the ANOVA analysis determined the optimal extraction conditions (pressure, temperature, and time of extraction) for different responses such as total polyphenol content (TPC), antioxidant activity (AA), and total protein (Tprot). Extraction temperature was found to be the most significant factor influencing all responses while pressure had no significant impact on them. Optimal conditions were derived from the mathematical models for each response. For polyphenol extraction, the optimal conditions were as follows: 170 °C and 20 bar for 39 min with 288 mg GAE/g DM. To achieve the highest AA, SWE parameters should be set at 165 °C and 20 bar for 51 min with 332 mg TROLOX/g DM. For the extraction of proteins, it is necessary to work at 105 °C and 20 bar for 10 min (78 mg BSA/g DM) to preserve protein functionality. In comparison, conventional solvent extraction was unable to outperform SWE with values under the SWE results. Given the high content of polyphenols found in the extracts, an HPLC analysis was conducted. The following compounds were detected and quantified: protocatechuic acid (7.75 mg/g extract), gallic acid (6.63 mg/g extract), delphinidin chloride (1.44 mg/g extract), catechin (0.36 mg/g extract), gentisic acid (0.197 mg/g extract), and some epicatechin (0.07 mg/g extract). Additionally, Maillard reaction products (MRPs) were detected at high temperatures, with 5-hydroxymethylfurfural (5-HMF) appearing in extracts processed at 165 °C and above. The presence of MRPs, known for their antioxidant and bioactive properties, may have contributed to the increased AA observed in these extracts. These findings are significant because a solvent-free extraction process like SWE offers a sustainable approach to repurposing winemaking by-products, with potential applications in the wine and food industries.

Graphical Abstract

1. Introduction

Grape seed by-products still contain bioactive compounds that possess anti-carcinogenic, anti-mutagenic, anti-aging, anti-inflammation, antimicrobial, and antioxidation functions [1]. For example, grape seed oil is beneficial for human health because it contains unsaturated fatty acids and antioxidant compounds and could also have antimicrobial activity [2]. These products are already commercialized in food, pharmaceutical, and cosmetic applications [3]. Grape seeds also contain a high content of valuable compounds such as proteins, carbohydrates, lipids, and polyphenols. These polyphenols may have high antioxidant capacity, including mainly monomeric flavan-3-ols, oligomeric proanthocyanidins, flavonoids, procyanidin dimers, trimers, catechin, epicatechin, gallocatechin, epigallocatechin and epicatechin 3-O-gallate, gallic acid, and more highly polymerized procyanidins [4]. The high antioxidant nature of polyphenols is based on their ability to absorb free radicals, and polyphenols are the most concentrated secondary metabolites found in this waste by-product [5].
Considering grape seeds as a potential source of protein from wine-making by-products, several research groups have reported that grape seed proteins contain essential amino acids at a relatively high level [6]. Moreover, grape seed proteins have recently started to attract attention as a potential fining agent due to their endogenous origin, offering a natural alternative to conventional plant-based fining agents such as potato, pea, and soybean proteins, as well as animal-derived proteins like egg, pork, and fish [7]. The use of grape seed proteins presents several advantages, including their alignment with the increasing consumer demand for more sustainable and plant-based options. Fining agents are known to improve wine clarity by binding to and precipitating colloids, such as tannins, phenolics, and proteins. Studies have shown that fining with plant proteins, including grape seed proteins, can effectively reduce bitterness and astringency, enhancing the sensory qualities of the wine [8].
Recently, the extraction of bioactive compounds from grape seeds has emerged as an attractive opportunity for the wine industry. In distilleries, organic solvents such as hexane, methanol, acetone, acetonitrile, and others are employed to extract polyphenols from grape seeds. Then, vacuum evaporation is realized to eliminate the solvent [9]. These practices have several disadvantages such as being time-consuming and requiring a high quantity of organic solvents which are toxic, expensive, and present environmental disposal problems in industrial utilization [10]. Recent research has shown that ethanol and boiling water can enable polyphenol extraction from food material. Polyphenols are polar compounds (containing multiple -OH groups) and the extraction should be completed by water [11]. An alternative process is needed and must be economical, environmentally friendly, effective, safe, and fast to avoid these drawbacks [12,13]. The use of water as an extraction solvent could overcome these problems. Several options have been proposed and subcritical water extraction (SWE) seems to be one of the most interesting.
SWE, also known as pressurized hot water extraction or hot compressed water, is a modern extraction method used for the isolation of high-added-value compounds from raw materials and is a process that is increasingly developing for the extraction of interesting compounds [14,15,16,17,18]. SWE uses hot water under sufficient pressure to maintain water between its boiling point of 100 °C and its critical point of 374 °C. SWE is an inexpensive, rapid, and ecofriendly technology because it uses a nontoxic solvent and has good selectivity [19]. Subcritical water induces a reduction in polarity (expressed as a dielectric constant) by increasing the temperature. Under ambient conditions (20 °C and 1 atm), the dielectric constant of water is close to 80 but decreases to values similar to solvent between 100 and 200 °C [12]. The combination of a reduced dielectric constant and high temperature increases the solubility of organic compounds, and in SWE, the extraction of nonpolar phenolics from by-products could be enhanced [20]. Moreover, this process has already proven its capacity to selectively extract different classes of compounds depending on the temperature used. More polar compounds are extracted at lower temperatures and less polar compounds are extracted at higher temperatures. SWE induces water to act as a solvent for hydrophobic matters (because the dielectric constant decreases) and, secondarily, a high magnitude of ion products at elevated temperatures [21]. Duba et al. [11] extracted polyphenols from defatted grape seeds (cultivar: Pinot Noir) by using SWE in a semi-continuous mode. The pressure applied was 10 MPa at 80 °C, 100 °C, and 120 °C with two flow rates. The authors argued that the total polyphenol content (TPC) yield significantly increased with temperature from 44 ± 2 to 124 ± 1 mg/g when the temperature increased from 80 to 120 °C. They also proved that TPC yield decreased with the flow rate at a constant temperature in all the cases. Tian et al. [22] extracted resveratrol from grape seeds by using the SWE process. The authors proved that the optimal values of extraction pressure, extraction time, extraction temperature, and solid/solvent ratios were 1.02 MPa, 24.89 min, 152.32 °C, and 1:15 (g/mL), respectively. The extraction of resveratrol yield reached 6.90 µg/g under the above-optimized conditions.
García-Marino et al. [2] considered that SWE is a good alternative for extracting flavanols (better than methanol/water (75:25)). The authors proved that higher recoveries for flavanol dimers and trimers, showing higher antioxidant activity, were obtained using a single extraction at 150 °C. They also argued that gallic acid, with antioxidant characteristics similar to the catechin and epicatechin monomers, is obtained in greater quantities by a single extraction at 150 °C. They conclude that higher temperature is linked to a better extraction of gallic acid, which reaches approximately 70% of the total of polyphenols extracted. This research proved that the effectiveness of SWE depends on several operating conditions, such as temperature, extraction time, and pressure.
Thus, the optimization of the extraction conditions is essential for the development and industry application of SWE. The objective of this research is to explore the potential of SWE as an innovative and sustainable method to valorize grape seed by-products for different purposes. By optimizing SWE conditions in a wide range of parameters using response surface methodology (RSM), we aim to maximize the recovery of valuable compounds within the extract. Furthermore, different families of compounds of interest were quantified.

2. Materials and Methods

2.1. Raw Materials and Preparation

Grape seed samples were recovered from the wine distillery Union Cooperative Vinicoles Aquitaine (UCVA, Coutras, France) and were composed of a mix of grape seeds from different grape varieties including Ugni blanc, Cabernet Sauvignon, and Merlot. Grape seeds were dried to 8% of residual humidity and pulverized in a lab-mixer Pulverisette 11 (Fritsch, Idar-Oberstein, Germany).
The particle size distribution of crushed grape seeds was determined by Laser diffraction using a Mastersizer (model 3000, Malvern Instruments, Malvern, UK) in a range from 10 nm to 3500 µm. The measurements were based on Fraunhofer diffraction theory, which states that the intensity of scattered light by a particle is directly proportional to the particle size.
The measurements were done in dry mode using an Aero S dry powder dispersion accessory. For each measurement, statistical volume diameters, D10, D50, and D90 were given (Dx indicates a particle size for which x% of the particles are below that size). The statistical volume diameters of crushed grape seeds were as follows: D90 = 1260 ± 43 μm, D50 = 664 ± 20 μm, and D10 = 197 ± 11 μm.

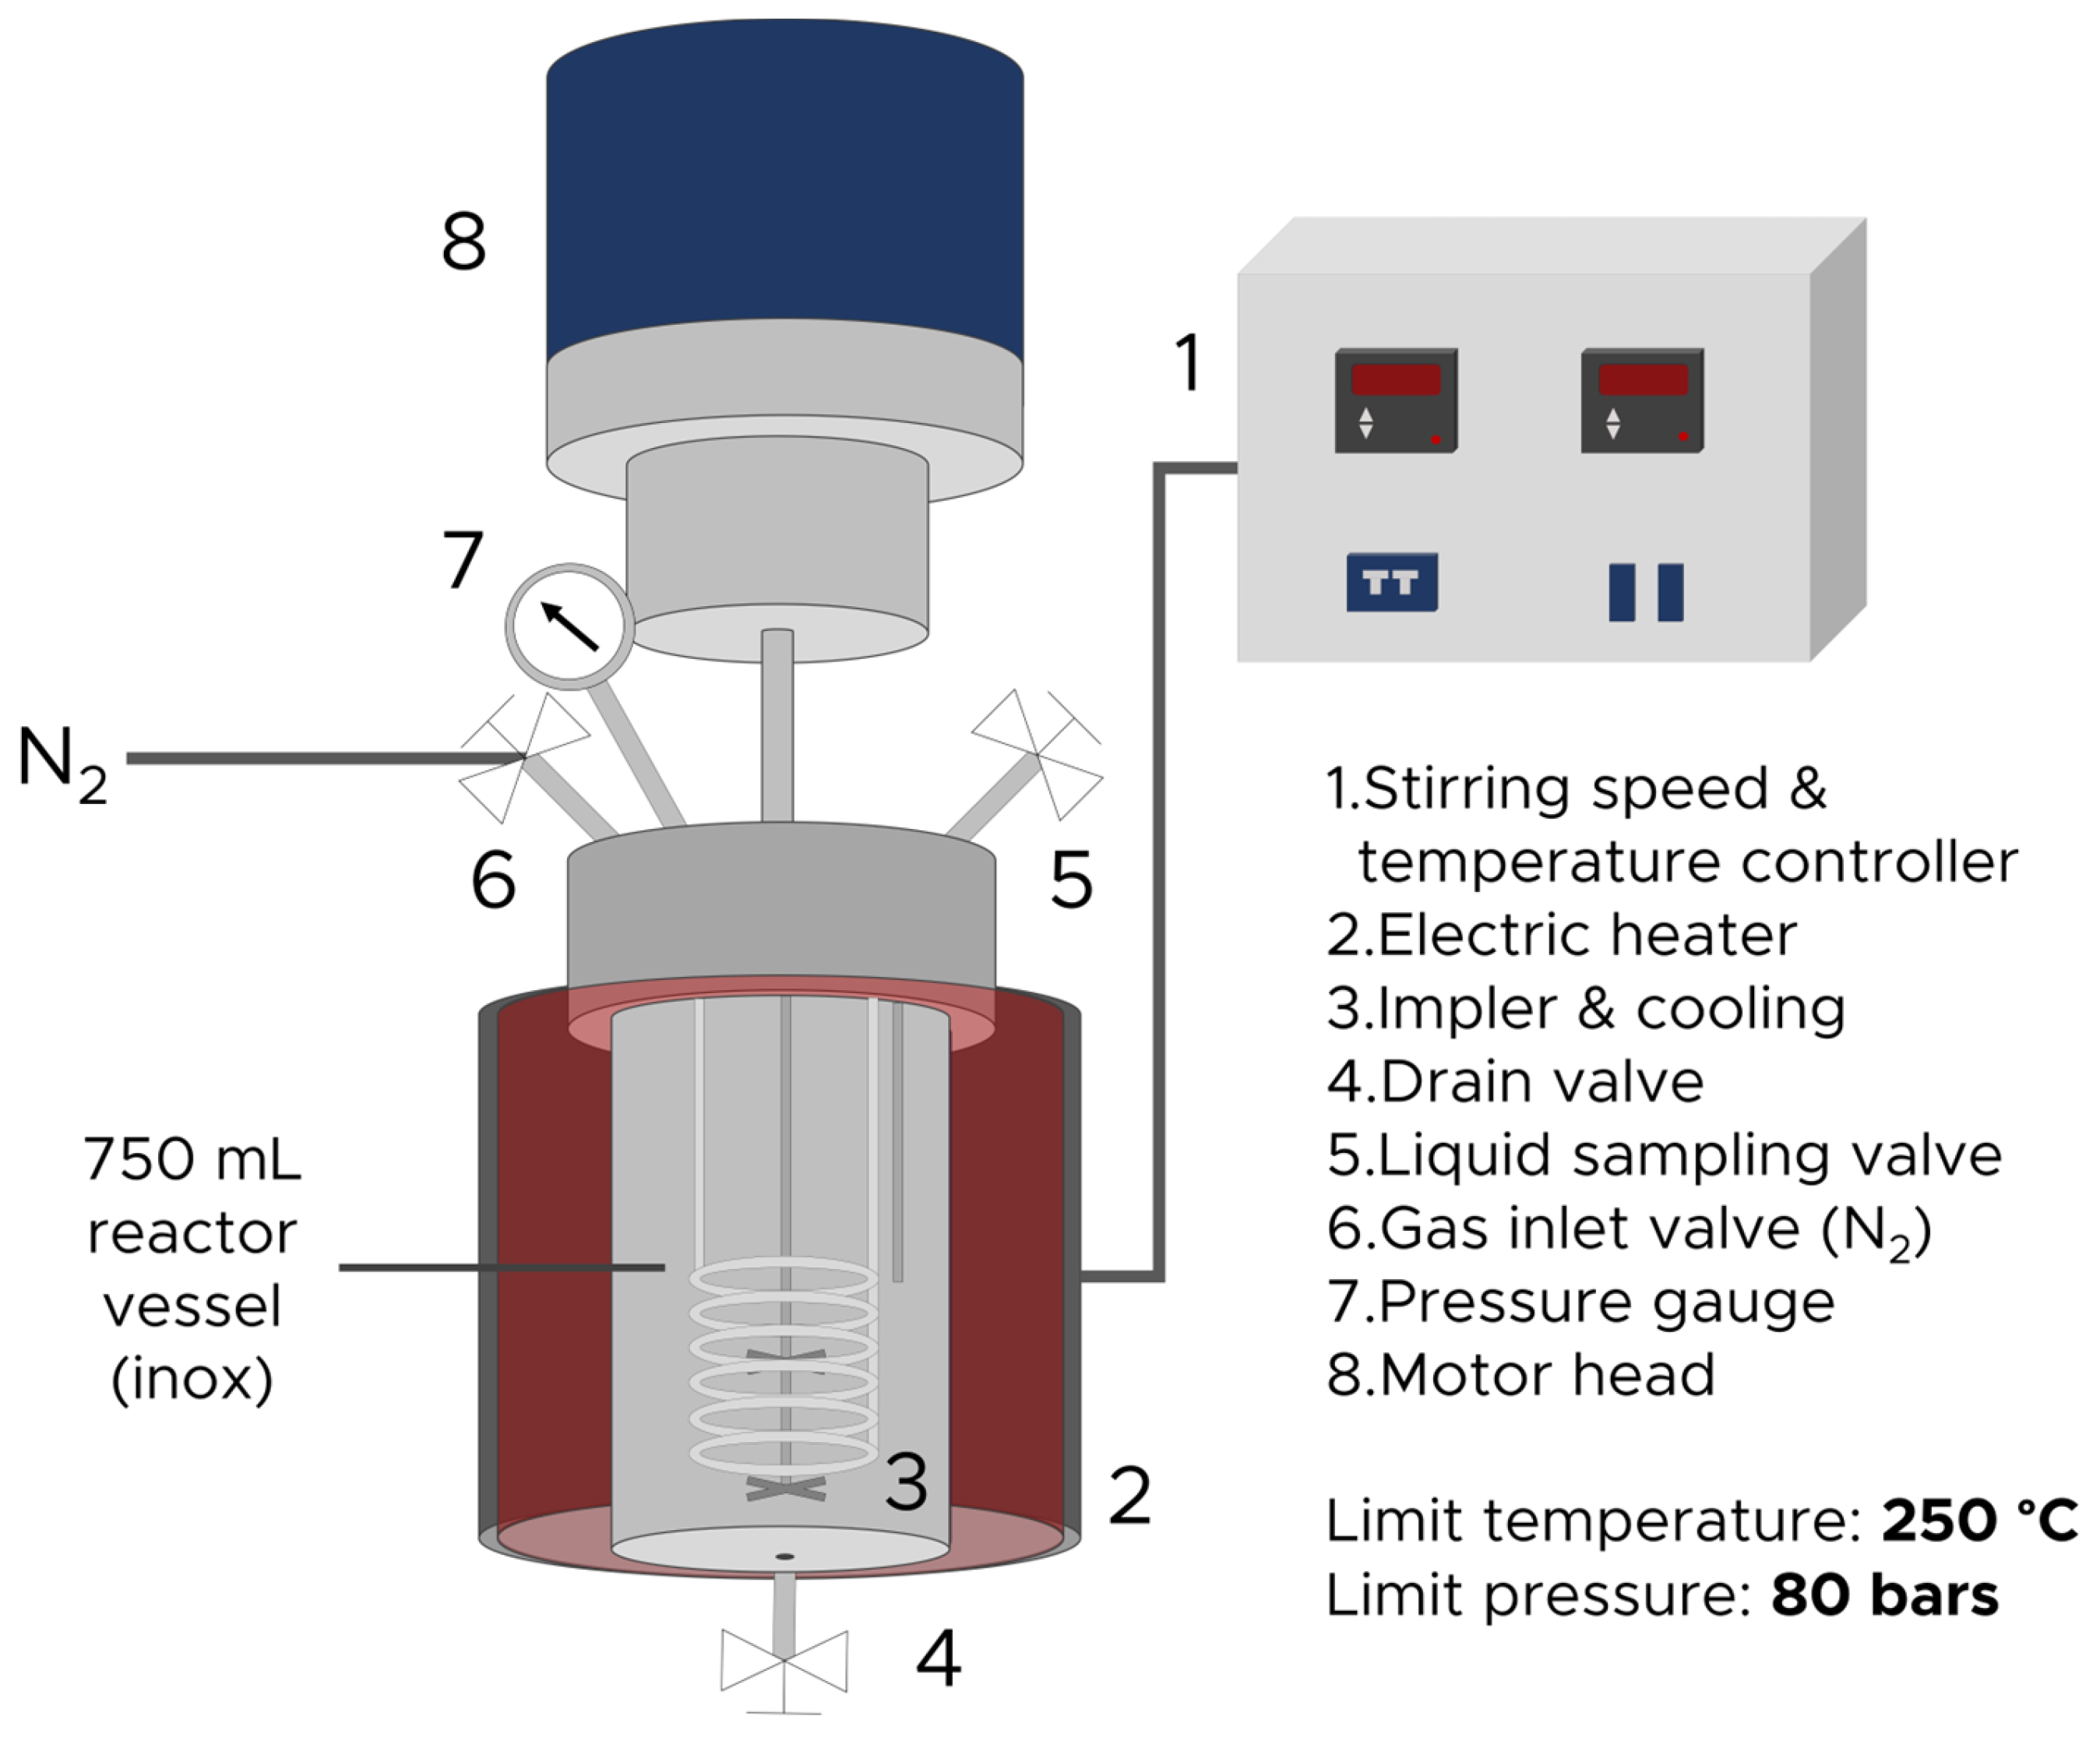
2.2. Subcritical Water Extraction (SWE)

The grape seed extraction was carried out in batch mode in a subcritical water vessel composed of a heating jacket with a temperature controller, a stirrer, and a cooling system (HPP systems, Cambrai, France), shown in Figure 1. MilliQ water (250 mL) (erck KGaA, Darmstadt, Germany) was preheated from ambient temperature until 80 °C in the vessel using an agitation speed of 400 rpm. Then, 5 g of crushed grape seeds were added to the water, with a final solid-to-liquid ratio of 1:50 (g/mL). The vessel was then tightly sealed. The inside of the vessel was pressurized with nitrogen (N2) to the required pressure to maintain the aqueous mixture in a liquid state. Temperature, pressure, and time parameters were set according to the response surface methodology. The range of temperature was set between 100 and 200 °C, the time between 10 and 60 min, and the pressure between 20 and 70 bar.
After the required time of extraction, the system was cooled until 50 °C and the liquid extract was collected by opening the outlet valve. The sample was centrifuged at 10,000 rpm for 15 min and the supernatant was stored at −20 °C until being freeze-dried at −83 °C under a vacuum of 0.005 mbar (Christ Alpha 2-4 LSCbasic, Grosseron, Couëron, France) and stored at −20 °C until further analysis.

2.3. Conventional Solvent Extraction

The conventional solvent extraction by ethanol was used as the reference extraction method. Five grams of crushed grape seeds were placed in a jar with 250 mL of milliQ water/ethanol 1:1 (v/v) with a final solid-to-liquid ratio of 1:50 (g/mL) and the mixture was agitated at 400 rpm. The extraction was performed for 24 h at 25 °C. The extract sample was centrifuged at 10,000 rpm for 15 min. The supernatant was evaporated with a rotavapor R-114 (Büchi, Villebon-sur-Yvette, France) and stored at −20 °C until being freeze-dried at −83 °C under a vacuum of 0.005 mbar (Martin Christ Gefriertrocknungsanlagen GmbH, Osterode am Harz, Germany) for further analysis.

2.4. Experimental Design of SWE by RSM

The response surface methodology (RSM) was used to optimize the extraction of grape seeds by the SWE process. The Box–Behnken design used for the optimization was developed with XLSTAT software (Addinsoft, v 2024.4.2). The three levels for the different parameters (F1: temperature, F2: time, F3: pressure) to optimize were detailed in Table 1 and the complete design is shown in Table 2. Fifteen experiments were performed with three center points per block to optimize the SWE method.

2.5. Validation of the Model

To validate the reliability of the models developed through the Box–Behnken design, we compared the predicted values obtained from the regression equations with experimental values measured under the corresponding optimal conditions for each response (total polyphenol content, antioxidant activity, and total protein). The optimal extraction conditions were independently set for each response in order to maximize the yield based on the desirability function applied in XLSTAT. The predicted values were calculated by applying these optimized parameters to the model equations.
Experimental values were obtained under the same conditions and are presented as the mean ± standard deviation of three replicates. The good agreement between predicted and experimental values confirms the validity and predictive power of the developed models within the tested range.

2.6. Characterization of SWE Grape Seed Extracts

2.6.1. Dry Matter Determination

After freeze-drying, the dry matter of extract samples was determined by desiccation in a stove at 105 °C for 24 h.
Dry matter was determined by weighing the sample before and after desiccation. M0 represents the initial weight of the empty cup (g), M1 is the weight of the cup containing the fresh sample before desiccation (g), and M2 is the weight of the cup and the sample after desiccation (g). The dry matter content was then calculated using the following formula:
DM = ((M2 − M0)/(M1 − M0)) × 100

2.6.2. Total Phenolic Content (TPC) Determination

Total Phenolic Content was determined in accordance with the Folin–Ciocalteu method [23] to fit in 96-well microplates. A volume of 20 μL of standard or rehydrated extract 20 g/L in EtOH/milliQ water (1:1, v/v) (n = 6) and 80 μL of sodium carbonate (7.5% w/v) were deposited onto a 96-well microplate. After 2 min of reaction, 100 μL of Folin–Ciocalteu reagent (previously diluted 10-fold in milliQ water) was added into each well. A blank sample containing EtOH/milliQ water (1:1, v/v) was prepared. After 30 min under dark conditions at 25 °C, absorbance was measured at 760 nm with a microplate spectrophotometer UV–Vis MultiSkan Sky High (Thermo Fisher Scientific Inc., Waltman, MA, USA). Gallic acid diluted in EtOH/milliQ water (1:1, v/v) with a concentration range of 0 to 200 mg/L was used as a standard for the calibration curve and TPC was expressed as milligrams of gallic acid equivalent (GAE) per gram of dry matter (DM).

2.6.3. Protein Determination

Total protein content (Tprot) was determined in accordance with the Bradford method [24] to fit in 96-well microplates. A volume of 200 μL of Bradford reagent diluted in milliQ water (2:7.5 v/v) was added to 50 μL of standard or rehydrated extract at 20 g/L in milliQ water (n = 6) on a 96-well microplate. MilliQ water was used as blank. After 5 min at 25 °C, absorbance was measured at 600 nm with a microplate spectrophotometer UV–Vis MultiSkan Sky High (Thermo Fisher Scientific Inc., Waltman, MA, USA). Bovine serum albumin (BSA) with a concentration range of 0 to 20 mg/L was used as a standard for the calibration curve and the total protein content (Tprot) was expressed as milligrams of BSA equivalent (BSAeq) per gram of DM.

2.6.4. DPPH Radical Scavenging Activity Determination

The DPPH radical scavenging activity of each extract condition was carried out according to the method of [25] with some modifications to fit in 96-well microplates [26]. The DPPH• solution was prepared daily in ethanol (35 mg/L) and 280 μL of this reagent was deposited with 20 μL of standard or rehydrated extract at 20 g/L in EtOH/milliQ water (1:1, v/v) (n = 6) onto a 96-well microplate. A blank sample containing EtOH/milliQ water (1:1, v/v) was prepared. The calibration curve was obtained using Trolox concentrations from 0 to 200 mg/L in EtOH/milliQ water (1:1, v/v). After 30 min under dark at 25 °C, the absorbance was measured at 515 nm with a microplate spectrophotometer UV–Vis MultiSkan Sky High (Thermo Fisher Scientific Inc., Waltman, MA, USA). The DPPH radical scavenging activity or the antioxidant activity (AA) of the sample was expressed as milligrams of Trolox equivalent (TROLOXeq) per gram of DM.

2.7. Quantification of Phenolic Compounds Through HPLC-DAD

The extraction procedure was prepared as in previous work [27]. The optimal extraction conditions obtained from the experimental design were applied to characterize the extract. The lyophilized extract was dissolved in milliQ water and filtered through 0.22 µm PTFE membrane filters for further chromatographic analysis.
Polyphenol quantification was performed using an Agilent HPLC 1100 (Hewlett-Packard, Waldbronn, Germany) equipped with DAD and FLD detectors, a thermostatted column system, a degassing system, a pump, and an autosampler. A reverse-phase Kinetex EVO C18 100 Å column (150 × 3 mm ID, 5 µm of particle size) (Phenomenex, Torrance, CA, USA) thermostatted at 30 °C was used to separate phenolic compounds. The injection volume was 20 µL. The mobile phase was composed of water acidified with 0.1% acetic acid (A) and methanol with 0.1% acetic acid (B). The working flow was established in 0.6 mL/min with a mobile phase gradient—0 min, 95% of A, and 5% of B; 3 min, 90% of A and 10% of B; 10 min, 80% of A, and 20% of B; 18 min, 70% of A, and 30% of B; 25 min, 30% of A, and 70% of B; 33 min, 0% of A, and 100% of B; 33–40 min, 0% of A and 100% of B—and a post-time of 6 min to return to initial conditions. Stock solutions of each reference standard were dissolved in methanol at 1 mg/mL. A minimum of 6 points were prepared for each calibration curve by diluting the stock solution. All standards, stock, and working solutions were protected from light and kept at −30 °C. Phenolic compounds in the samples were identified by comparisons with the retention times and UV spectra of standards injected under the same conditions. Phenolic compound identification was based on the retention time and UV spectrum of the standards, which were also used for the external standard quantification of polyphenols at the maximum absorbance of each compound (278, 300, 325, and 360 nm). For the fluorescence detector, excitation and emission wavelengths of 230 nm and 410 nm, respectively, were set.

2.8. Identification of Phenolic Compounds Through HPLC-PDA-MSMS

Phenolic compounds were confirmed through HPLC-ESI-MS/MS (Thermo Fisher Scientific, San José, CA, USA). This instrument was equipped with a degassing system, an Accela quaternary pump, a thermostatted column system, an autosampler, and a TSQ Quantum Access max triple quadrupole mass spectrometer with an electrospray ionization (ESI) source that operated in negative and positive. MS data were acquired in multiple reaction monitoring (MRM) mode. The column and chromatographic conditions were the same as those described for HPLC-DAD analysis. Argon was used as the collision gas (1.5 mTorr). Nitrogen gas with a purity of 99.98% served as the envelope, ion sweep, and auxiliary gas. The vaporization temperature was set at 340 °C, and the capillary temperature was set at 350 °C. The electrospray voltage was 2500 V, 25 psi of envelope gas, and five arbitrary units of pressure for the auxiliary gas. The precursor union, the fragmentation union, and characteristic retention times of the standards injected under the same conditions were used to confirm the identity of the phenolic compounds (see Table S5 and Figure S2).

2.9. Maillard Reaction Products Analysis

To evaluate the formation of Maillard reaction products (MRP) that may occur during SWE, various methods were applied, including absorbance measurement at 420 nm, pH assessment, total reducing sugar quantification, and 5-hydroxymethylfurfural quantification.
The advancement of the Maillard reaction is performed by following the absorbance at 420 nm. A suspension of each SWE final product was made at a 1 g/L concentration in milliQ water and the absorbance was measured at 420 nm in a microplate using a spectrophotometer UV–Vis MultiSkan Sky High (Thermo Fisher Scientific Inc., Waltman, MA, USA). Deionized water was used as blank.
The same preparation was used for pH measurements.
Total reducing sugar was evaluated according to the DNS method. DNS reagent was prepared as follows: 150 g of sodium potassium tartrate in 250 mL of milliQ water, then 100 mL of NaOH 2N was added, then 1 g of 3,5-dinitrosalicylic acid was added slowly and the solution was completed at 500 mL. This preparation was kept in darkness at room temperature. The D-glucose solutions used to prepare the calibration range were prepared from stock solution at 2.5 g/L to 0 g/L. In a hemolysis tube, 200 μL of sample, blank, or range solution was mixed with 200 μL of DNS reagent. Tubes were heated in a water bath between 80 and 100 °C for 5 min and then cooled in ice. An amount of 2 mL of deionized water was added to each tube and homogenized. Absorbance at 540 nm was measured after 5 min in a microplate using a spectrophotometer UV–Vis MultiSkan Sky High (Thermo Fisher Scientific Inc., Waltman, MA, USA). The total reducing sugar was expressed in glucose eq g/g of DM.
The 5-hydroxymethylfurfural quantification was performed by HPLC analysis. A solid–liquid extraction was performed before HPLC analysis. To achieve this, approximately 0.1 g of the sample was mixed with 2 mL of a 12% vol. hydroalcoholic solution (ethanol/milli-Q water, 88:12 (v/v). The final mixture was sonicated for 10 min, then stirred on a magnetic stirrer for 48 h at 900 rpm. Finally, the mixture was centrifuged at 5000 rpm for 10 min, then passed through a 0.45 µm cellulose acetate syringe filter before injection. 5-Hydroxymethylfurfural was determined by high-performance liquid chromatography on hydrocarbon-bonded reversed-phase packings (OIV-MA-BS-16: R2009). The HPLC−DAD system used was a Dionex Ultimate 3000 (Thermo Fisher Scientific, Waltham, MA, USA), coupled with a DAD detector set at 280 nm. Elution was performed using a Spherisorb ODS2 column (250 × 4.6 mm × 5 μm, Waters, Saint-Quentin-en-Yvelines, France). Two mobile phases were used: acidic water (Milli-Q water/acetic acid, 99.95/0.05 (v/v) (solvent A)) and an ethanol/water mixture (methanol/Milli-Q water, 98:2 (v/v) (solvent B)). The flow rate was set at 0.6 mL/min. The gradient of solvent B was as follows: 20% solvent B at 0 min, 50% at 50 min, 100% at 60 min, and 20% at 70 min, maintained for 5 min for equilibration before the next injection. An amount of 20 µL of the sample was injected for analysis. The method was adapted from Salagoïty-Auguste et al. [28], developed for the simultaneous quantification of aromatic aldehydes and coumarins in wines and brandies stored in oak barrels.

2.10. Statistical Analysis

The responses from the different samples in the Box–Behnken design were used to create an empirical regression model based on SWE process parameters, fitted with a second-order polynomial model according to the following equation:
Y = β 0 + i = 1 k β i X i + i = 1 k β i i X i 2 + i = 1 k 1 j = 2 k β i j X i X j   i < j
where Y is the dependent variable or response (TPC, Tprot, AA), X represents the independent variables or the level of ESC parameters (temperature, time, and pressure), and β0, βi, βii, and βij are the regression coefficients for the intercept, linear, quadratic, and interaction, respectively, and were calculated with the experiment results. k is the number of variables.
XLSTAT software (Addinsoft, v20224.4.2) was used for the analysis of variance (ANOVA) to derive the quadratic polynomial mathematical model that describes the relationship between SWE parameters and responses (TPC, Tprot, AA). The coefficient of determination (R2) and model p-value were calculated to evaluate the model’s accuracy.
The significance of MRP results was assessed using the Kruskal–Wallis test (α < 0.05), followed by a post-hoc Dunn’s test.
Pearson correlation analysis was conducted to assess the relationship between the variables. The correlation coefficients (r) were calculated.

3. Results and Discussion

3.1. Experimental Design

The purpose of this study is to investigate the use of a new green method of extraction, SWE, for wine by-product grape seed valorization. To determine the optimal SWE parameters, response surface methodology (RSM) was employed, which allowed for a reduction in the number of experiments. RSM, notably the Box–Behnken design, is a statistical experimental design method commonly used to optimize the operating parameters of extraction methods.
The Box–Behnken design was limited to 15 runs (from run 1 to 15), with three repetitions at the central level (runs 13, 14, and 15). The responses for each SWE run regarding AA, TPC, and Tprot are shown in Table 2. A reference extraction was also performed using a 1:1 (v/v) water/ethanol solvent in triplicate (runs 16, 17, and 18).
The ANOVA analysis based on these experimental results enabled the generation of different quadratic models (Equations (3)–(5)) for all studied responses—AA, TPC, and Tprot—and the prediction of all combinations of SWE parameters, as shown in Figure 2. The significance of these models was determined using the F-test and p-value (Table 3).
AA = 331.08 + 28.41 × F1 − 0.73 × F2 + 5.46 × F3 − 55.35 × F12 − 3.077 × (F1 × F2) + 1.44 × F1 × F3 + 9.06 × F22 − 2.66 × (F2 × F3) + 12.33 × F32
TPC = 308.08 + 54.62 × F1 + 11.26 × F2 + 1.95 × F3 − 66.74 × F12 + 5.58 × (F1 × F2) − 7.97 × F1 × F3 − 40.29 × F22 + 3.72 × (F2 × F3) − 45.45 × F32
Tprot = 72.79 − 24.52 × F1 − 6.66 × F2 − 2.07 × F3 − 23.78 × F12 + 0.13 × (F1 × F2) + 0.12 × F1 × F3 − 0.74 × F22 − 1.78 × (F2 × F3) − 1.26 × F32
The goodness of fit for all models was evaluated with the regression coefficient (R2) and adjusted R2, providing complementary insights into model performance. For AA, TPC, and Tprot, the R2 values were 0.866, 0.939, and 0.996 respectively, while the adjusted R2 values were 0.801, 0.898, and 0.989 (Table 3). The R2 measures the proportion of variability in the response variable explained by the model, with values closer to 1 indicating a better fit. However, R2 can be overly optimistic when additional predictors are included, as it does not account for the number of predictors. Adjusted R2, on the other hand, penalizes the addition of unnecessary predictors, providing a more reliable measure of model performance, particularly for models with multiple factors. We observe that the models for TPC and Tprot show excellent fits with the experimental data, with minimal differences between R2 and adjusted R2, indicating a strong and reliable predictive capacity. For AA, while the R2 and adjusted R2 are slightly lower, they still suggest that the model captures the majority of the response variability, albeit less robustly compared to TPC and Tprot.
However, we can already note that temperature has a significant contribution to AA with a p-value < 0.05 (Table S1). The TPC model, on the other hand, has a p-value < 0.05 and a high R2 (0.939), demonstrating the accuracy of the model and the influence of the independent variables with a high contribution of temperature (p-value = 0.002) (Table S2). Time of extraction (F2) and pressure (F3) have a negligible effect on AA with a p-value of 0.937 and 0.559, respectively, as well as for the TPC model with an F2 p-value of 0.275 and an F3 p-value of 0.840 (Tables S1 and S2). When we focus on parameter contribution (Table S3) for Tprot extraction, we observe that temperature had a high influence (p-value < 0.0001) as well as the time of extraction (p-value = 0.0005).
Finally, pressure had no significant impact on the SWE efficiency, as previous studies have shown [29,30]. This could be due to the low effect of pressure on the dielectric constant.

3.2. Response Surface Analysis of AA

In Figure 2a, 3D surfaces and contour plots mainly illustrate the evolution of AA according to parameter combinations (temperature and time with pressure set at 20 bar) evaluated by DPPH radical scavenging capacity, expressed as mg of TROLOXeq/g of the dry matter (DM) of the extract. We observe that AA increases from 100 °C (254.9 mg TROLOXeq/g of DM), reaching a maximum at a temperature of 165 °C (351.59 mg TROLOXeq/g of DM). Higher temperatures above 165 °C appear to cause the degradation of antioxidant compounds, regardless of the extraction duration. Aliakbarian et al. [29], who have performed SWE on grape pomace (seeds, grape skin, stalks) for polyphenol extraction, also found that temperature was the only significant factor affecting AA. Based on their surface model, they estimated an optimal temperature of 145 °C, although their model was constrained by RSM experimental conditions ranging from 100 °C to 140 °C and higher temperatures were not tested. In our study, we extended the temperature range to assess the effects of SWE on antioxidant compound extraction more thoroughly and found that higher temperatures significantly enhance extraction efficiency up to 165 °C, beyond which degradation occurs. This temperature effect aligns with prior studies, where optimal extraction temperatures ranged from 120 °C to 200 °C [11,12,22,31,32]. In our study, however, AA across all experimental SWE (Table 2) and computed combinations showed only minor variations (min 254.93 mg TROLOXeq/g DM; max 351.59 mg TROLOXeq/g DM). This phenomenon could be attributed to the saturation of antioxidant molecules in the water. Reducing the solid-to-liquid ratio to 1:75 or 1:100 might improve solubility and consequently increase the AA in the extract. Furthermore, the AA of extracts from SWE could vary depending on the grape variety, as previously observed for grape pomace from the Dunkelfeder variety compared to Merlot [12]. Solvent extraction with ethanol/water 1:1 (v/v) under identical solid-to-liquid conditions (1:50) at room temperature over 24 h was able to recover in the extract an antioxidant activity of around 187.8 ± 9.3 mg TROLOXeq/g DM (Table 2). The higher AA observed in SWE may result from the reduced polarity of subcritical water, enhancing the extraction of less polar compounds with greater AA, especially around the optimal temperature of 160 °C. Indeed, at 20 bars and 25 °C, water has a dielectric constant of ε = 80, decreasing to 45 at 150 °C. This constant is similar to that of certain organic solvents (ε = 37.5 for acetonitrile) [14].
Finally, as shown in Table 4, the relative standard error between the predicted and the experimental values is 5.6% with a desirability of 0.949, which confirms the consistency and reliability of the model. SWE proves to be an interesting and promising method for extracting antioxidant compounds, offering a more sustainable alternative compared to solvent-based extraction.

3.3. Response Surface Analysis of TPC

The 3D surface and contour plot in Figure 2b shows that temperature has a major impact on TPC extraction. Similar to AA, TPC increases from 100 °C (89.1 mg GAE/g of DM) and peaks at 170 °C (with pressure set at 20 bar) with 276.0 mg GAE/g of DM. Temperatures above 170 °C seem to negatively affect phenolic compounds. High-temperature degradation has been documented for polyphenols, such as stilbenes and resveratrol, at 190 °C for stilbenes and starting from 150 °C for flavan-3-ols, benzoic aldehydes, resveratrol, certain coumarins, and cinnamic acids [32,33]. These authors noted that polyphenols with more hydroxyl-type substituents are more easily degraded at elevated temperatures. In our study, the optimal extraction conditions were 170 °C for 39 min at 20 bar, which is consistent with previous works.
Extraction time had only a minor, statistically insignificant effect on TPC (p-value > 0.05). This trend is consistent with previous research on phenolic compound extraction using SWE [2,22,29,32]. The optimal extraction of resveratrol from grape seeds was achieved at 152 °C and 10 bar for 25 min according to Tian et al. [22] and at 160 °C for 5 min for stilbenes from grape vines [32]. García-Marino et al. [2] found that SWE conditions affected procyanidin types based on polymerization degree and structure. A single extraction at 150 °C yielded the highest level of gallic acid, tetramers, dimers, and trimers. The variability of optimal conditions comes from the huge diversity of objectives. This observation highlights the challenges and importance of optimizing the method regarding the response. Finally, solvent extraction with ethanol/water 1:1 (v/v) at room temperature for 24 h yielded 160.9 ± 9.6 mg GAE/g DM. According to our model, our optimal conditions (170 °C and 20 bar for 39 min) yielded a TPC of 276 mg GAE/g DM, surpassing those reported for other SWE and extraction methods for grape pomace and seeds [11,12,29]. Furthermore, as shown in Table 4, the relative standard error between the predicted and the experimental values is 4.2% which confirms the consistency and the reliability of the model.

3.4. Response Surface Analysis of Tprot

Grape seeds contain 11–16% protein (DM) [34,35,36,37], which could be valuable for food applications, enhancing nutritional, sensory, or additive qualities [6]. Additionally, plant-based proteins have been assessed for their effectiveness as fining agents in wine clarification and stabilization [7,8]. In this context, proteins from grape seeds extracted via SWE present a promising endogenous fining agent. In Figure 2c, temperature significantly influences the Tprot response (mg BSAeq/g of DM), with a high protein content at low temperature in the tested range (84.2 mg BSAeq/g of DM) and a decrease in protein levels (19.7 mg BSAeq/g of DM) as the temperature rises to 200 °C (with pressure set at 20 bar). Extraction time (F2) also significantly affects Tprot (p-value = 0.0005) (Table S3). For optimal protein extraction, a short extraction time (10 min) and lower temperature (105 °C) are recommended (Table 4), with a relative standard error of 6.6% between predicted and experimental values. According to Gazzola et al. [8], grape seed extract obtained from the oil industry significantly reduces turbidity and positively impacts sensory properties. The protein concentration is comparable to that used for patatin as a fining agent.
On the other hand, solvent extraction allows the recovery of 70.1 ± 4.9 mg BSAeq/g DM, which is comparable to our results with SWE. The extraction of grape seed proteins could be further optimized by adjusting the pH to improve protein solubility away from their isoelectric point, which may further enhance protein yield [38,39]. Grape seed proteins are rich in glutamic acid, arginine, glycine, and aspartic acid, with globulin as the major protein component [6,40]. Temperature and pH are critical for optimizing protein extraction. Indeed, according to Baca-bocanegra et al. [40], the extraction yield of proteins was highest at pH 9.94 and 36.42 °C with a meal/water ratio of 1:9 (w/v) and a 2.19 h extraction time. Under subcritical conditions, the properties of water change, including an increase in water dissociation, leading to a decrease in pH [30,41].
Using grape-derived proteins could enhance the circular economy within the winemaking industry, as they are a by-product of grape processing, reducing waste and promoting an eco-friendly approach to wine clarification and stabilization.

3.5. Phenolic Compounds Identification and Quantification

Phenolic compounds were identified and quantified by HPLC under optimal SWE conditions (165 °C, 51 min, 70 bar) to evaluate whether antioxidant activity correlates with polyphenol concentration (Table 5). Several compounds were identified, including phenolic acids, flavonoids, and flavanols. Notable amounts of protocatechuic acid (7.75 mg/g extract), gallic acid (6.63 mg/g extract), delphinidin chloride (1.44 mg/g extract), catechin (0.36 mg/g extract), gentisic acid (0.197 mg/g extract), and some epicatechin (0.07 mg/g extract) were extracted. Those compounds are naturally present in grape seeds, and previous research has quantified some principal compounds after solvent extraction [42,43,44]. For instance, an average of 225 μg/g of gallic acid and 138 μg/g of catechin was found across several grape varieties [43]. According to Rokenbach et al. [42] grape seeds from different varieties, including Cabernet Sauvignon and Pinot Noir, contain chlorogenic acid. However, in our study, the concentration of chlorogenic acid was below the limit of quantification, as was rutin, which was also quantified in certain varieties [42,45].
A previous study on grape-derived nutraceutical products revealed considerable variation in polyphenolic concentrations across eight commercial products on the market [46]. For example, delphinidin chloride appeared in only one product at a lower concentration of 7 mg/kg. In the case of gallic acid, the highest concentration observed was 890 mg/kg, which is lower than the concentration we achieved under optimal SWE conditions. Additionally, maximum concentrations for catechin and epicatechin were 16,728 mg/kg and 10,679 mg/kg, respectively, with minimum values of 98 and 33 mg/kg. The amounts of these compounds in our SWE extract align with those in these commercial products.
However, we identified only a few phenolic compounds, and many concentrations were below the quantification limit. This limitation may result from reactions occurring during SWE, such as hydrolysis, hydration/dehydration, rearrangements, elimination, formation, and the cleavage of carbon–carbon bonds as well as hydrogenation/dehydrogenation [47]. The formation of new molecules from original phenolic compounds warrants further investigation, as these newly formed compounds may contribute to antioxidant activity. Our analyzed extract exhibited high antioxidant activity, yet only a few phenolic compounds were detected. Previous work on other biological sources has shown a correlation between antioxidant activity and phenolic compound concentration [48,49]. In our study, a moderate positive correlation was found between TPC and AA, with a Pearson correlation r = 0.659 (p-value = 0.008), suggesting that not all extracted phenolic compounds exhibit antioxidant activity, but the TPC could partially explain the AA observed in the extract.
Some researchers attribute the enhanced antioxidant capacity in the extract to the formation of neo-compounds resulting from the Maillard reaction, caramelization, and thermoxidation during subcritical water extraction [50,51].

3.6. Formation of Maillard Reaction Products During SWE

The Maillard reaction is a non-enzymatic process that occurs during food processing. It begins with the spontaneous condensation of the carbonyl group from reducing sugars, aldehydes, or ketones with the free primary amine group of amino acids, peptides, proteins, or other nitrogenous compounds [52]. This reaction leads to the formation of a diverse range of compounds known as Maillard reaction products (MRPs) [53]. These compounds contribute to the color, flavor, and bioactivity of various food and biological systems. The formation of MRPs has been associated with SWE performed at high temperatures [50,51]. Several studies in different food matrices have suggested that SWE can lead to the production of new molecules with high antioxidant capacity [54,55,56,57]. In this study, we aimed to evaluate the formation of MRPs and their potential contribution to the antioxidant activity of our extract obtained by SWE at different temperatures (10 min at 100 °C, 150 °C and 200 °C) and under optimal conditions to maximize AA (51 min at 165 °C). Thus, we monitored these extracts’ pH, browning color, total reducing sugar (TRS), and the formation of 5-hydroxymethylfurfural (5-HMF).
The pH of the extract is influenced by the condensation of amino groups with carbonyl groups; it decreases as the Maillard reaction progresses [58]. This pH reduction, along with the TRS content (Figure 3a,b), provides an indicator of Maillard reaction advancement. The highest TRS content at 150 °C may reflect the extensive release of reducing sugars under these conditions, while the Maillard reaction is still at an early stage, with the limited consumption of TRS by downstream reactions. Additionally, the significant pH decrease at 150 °C suggests that the Maillard reaction is significantly more advanced compared to the 100 °C. At the highest temperature (165 °C and 200 °C), we did not observe a significant diminution of pH. Some authors have also observed this diminution of pH during SWE in different matrices, especially between 100 °C and 200 °C [50]. However, they have also suggested that while SWE occurs there is also a potential evolution of the extraction of compounds that would have an impact on pH, like phenolic acids. In some other matrices, the solubilization of TRS increases during SWE, with an apex value at around 60 min, followed by a diminution, probably due to degradation [54]. In our case, at high temperatures, there is less TRS content compared to 150 °C, but this diminution is not significant. This could be due to a partial degradation of TRS content due to long extraction (51 min) or high temperature (200 °C).
Then, we focused on the simplest way to evaluate the progression of the Maillard reaction by monitoring absorbance at 420 nm (A420) in Figure 3c. The development of a brown color in food matrices is correlated with the production of melanoidins, a final MRP [51]. After 10 min of extraction, the sample at 150 °C exhibits the highest brown color intensity, which is significantly different from the 100 °C condition. Under optimal conditions (165 °C–51 min), a lower brown color intensity is observed, though the difference is statistically non-significant compared to the other conditions.
Finally, as a key indicator, 5-HMF was analyzed. This compound is a furanic aldehyde formed primarily through the thermal degradation of reducing sugars. It represents a major end-product of the Maillard reaction, following the conversion of reducing sugars into Amadori compounds, which then undergo dehydration to yield 5-HMF. It is also a well-known intermediate in the thermal decomposition of hexoses, particularly fructose, under acidic conditions. In addition to its role in the Maillard reaction, 5-HMF is also widely recognized as a degradation product arising during the production of carbohydrate hydrolysates under subcritical water extraction. This involves the thermal hydrolysis of polysaccharides into monosaccharides (such as glucose and fructose), which are further dehydrated into furanic compounds like 5-HMF. Several studies have reported the formation of 5-HMF from monosaccharides under subcritical water conditions, highlighting its dual origin from both Maillard reactions and carbohydrate degradation processes [55,59,60]. In Figure 3d, we observe that there is no detectable 5-HMF in samples treated at 100 °C and 150 °C for 10 min (<LOD). Thanks to previous observations, this finding suggests that at 100 °C, the Maillard reaction has not yet initiated. Further, at 150 °C, it is still in an early phase, where intermediates such as Amadori compounds are likely present but dehydration into 5-HMF has not yet occurred. However, at 200 °C, after 10 min of extraction by SWE, 5-HMF production is detected (0.04 mg/g DM), indicating that the Maillard reaction is progressing toward its later stages. In contrast, in the optimal SWE conditions (165 °C–51 min), we observe a significant accumulation of 5-HMF (0.81 mg/g DM). This suggests that prolonged exposure to high temperatures enhances the conversion of Amadori intermediates and promotes the thermally induced dehydration of sugars into furan derivatives. The increase in 5-HMF concentration at this stage highlights the intensification of Maillard-derived pathways, as well as possible interactions with caramelization mechanisms, further influencing the chemical profile of the extract. Further, the small 5-HMF concentration at higher temperatures (200 °C) could be potentially due to degradation, polymerization, and reaction with other components in the extract.
Vergara et al. [61] have also detected 5-HMF in grape pomace (stems, seeds, and skins of grapes) extracted by pressurized hot water at 200 °C and none at 100 °C. The authors demonstrated that both extracts have a high protective activity on leukemia growth cells (HL-60 cell model) and mitochondrial membrane potential as a conventional antioxidant (Trolox). However, at high temperatures (200 °C), the presence of MRP and 5-HMF enhanced the cytotoxic effect. These findings suggest that 5-HMF and MRPs contribute not only to the antioxidant properties of grape extracts but also to their antiproliferative effects on cancer cells [62]. While this cytotoxicity could be beneficial for cancer treatment strategies, it also raises concerns about potential toxicity in non-cancerous cells. The dual role of these compounds acting as both protective antioxidants and pro-oxidant cytotoxic agents highlights the complexity of their biological effects, which likely depend on concentration, exposure time, and cellular context [63]. Further investigations are needed to determine the selective action of 5HMF-containing extracts and to assess their safety for potential therapeutic applications.

4. Conclusions

SWE has been proven to be a promising method to valorize grape seed by-products, aligning with the principles of waste recovery, green chemistry, and the circular economy. Grape seeds are a rich source of bioactive compounds, including polyphenols with potent antioxidant properties, and proteins, with applications as stabilizing agents in foods and beverages. Using RSM and the Box–Behnken design, SWE optimization was performed by varying the temperature, pressure, and time. Second-order models identified optimal conditions for AA, TPC, and Tprot, with temperature emerging as the most influential factor. High temperatures (200 °C) proved unsuitable for maximizing phenolic compound extraction, as they likely induce compound degradation. Instead, optimal conditions for extracting the TPC were identified at 170 °C, 39 min, and 20 bar. AA was maximized at 165 °C, 51 min, and 20 bar, partially due to the presence of phenolic compounds quantified by HPLC and maybe newly formed antioxidant molecules. For protein extraction, lower temperatures (105 °C, 10 min, and 20 bar) preserved protein functionality as potential fining agents in winemaking, meriting further study.
Additionally, this study demonstrated the formation of Maillard reaction products (MRPs) under SWE conditions, particularly at higher temperatures. While MRPs may enhance antioxidant activity, their formation, along with 5HMF accumulation, raises questions about potential implications for extract functionality.
Overall, SWE offers a sustainable alternative to solvent-based extraction, enabling the efficient recovery of valuable compounds. Further research is needed to better understand MRP kinetics and assess the applications and safety of these extracts in various industries.

Supplementary Materials

The following supporting information can be downloaded at: https://www.mdpi.com/article/10.3390/pr13061788/s1, Table S1: ANOVA analysis and parameter contribution for the AA response of the SWE of grape seeds. Table S2: ANOVA analysis and parameter contribution for the TPC response of the SWE of grape seeds. Table S3: ANOVA analysis and parameter contribution for the Tprot response of the SWE of grape seeds. Figure S1: Three-dimensional surface and contour plots for yields. Table S4: ANOVA analysis and parameter contribution for the yield response of the SWE of grape seeds. Figure S2: Experimental responses vs. model-predicted responses for AA (a), TPC (b), and Tprot (c). Figure S3: Phenolic compounds in the grape seed extract detected by HPLC-ESI-MS/MS. Figure S4: Chromatogram of the grape seed extract acquired at 278 nm: 1—gallic acid; 2—protocatechuic acid; 3—p-hydroxybenzoic acid; 4—delphinidin; 5—catechin; 6—gentisic acid; 7—chlorogenic acid; 8—epicatechin; 9— isoquercitrin; 10—rutin. Table S5: List of the MS conditions required (collision energy and fragmentation voltage) to achieve the fragmented ions.

Author Contributions

Conceptualization, M.B.; methodology, M.B. and B.P.; investigation, M.B. and S.M.-C.; formal analysis, M.B. and S.M.-C.; writing—original draft preparation, M.B., S.M.-C. and L.B.-P.; reviewing, B.P., C.N., L.B.-P. and R.G.; funding acquisition, L.B.-P. and R.G.; supervision, R.G. and L.B.-P. All authors have read and agreed to the published version of the manuscript.

Funding

In Spain, ValICET project is supported by PRIMA program (MCIN/AEI/10.13039/501100011033 and by the European Union “NextGenerationEU”/PRTR).

Data Availability Statement

The original contributions presented in this study are included in the article. Further inquiries can be directed to the corresponding author.

Conflicts of Interest

The authors declare no conflicts of interest.

References

  1. Gupta, M.; Dey, S.; Marbaniang, D.; Pal, P.; Ray, S.; Mazumder, B. Grape Seed Extract: Having a Potential Health Benefits. J. Food Sci. Technol. 2020, 57, 1205–1215. [Google Scholar] [CrossRef] [PubMed]
  2. García-Marino, M.; Rivas-Gonzalo, J.C.; Ibáñez, E.; García-Moreno, C. Recovery of Catechins and Proanthocyanidins from Winery By-Products Using Subcritical Water Extraction. Anal. Chim. Acta 2006, 563, 44–50. [Google Scholar] [CrossRef]
  3. Cherubim, D.J.; Martins, C.V.; Fariña, L.; Lucca, R.A. Polyphenols as Natural Antioxidants in Cosmetics Applications. J. Cosmet. Dermatol. 2020, 19, 33–37. [Google Scholar] [CrossRef] [PubMed]
  4. Martin, M.E.; Grao-Cruces, E.; Millan-Linares, M.C.; la Paz, S.M. Grape (Vitis vinifera L.) Seed Oil: A Functional Food from the Winemaking Industry. Foods 2020, 9, 1360. [Google Scholar] [CrossRef]
  5. Gutiérrez-del-Río, I.; López-Ibáñez, S.; Magadán-Corpas, P.; Fernández-Calleja, L.; Pérez-Valero, Á.; Tuñón-Granda, M.; Miguélez, E.M.; Villar, C.J.; Lombó, F. Terpenoids and Polyphenols as Natural Antioxidant Agents in Food Preservation. Antioxidants 2021, 10, 1264. [Google Scholar] [CrossRef]
  6. Zhou, T.; Zhang, T.; Liu, W.; Zhao, G. Physicochemical Characteristics and Functional Properties of Grape (Vitis vinifera L.) Seeds Protein. Int. J. Food Sci. Technol. 2011, 46, 635–641. [Google Scholar] [CrossRef]
  7. Marangon, M.; Vincenzi, S.; Curioni, A. Wine Fining with Plant Proteins. Molecules 2019, 24, 2186. [Google Scholar] [CrossRef]
  8. Gazzola, D.; Vincenzi, S.; Marangon, M.; Pasini, G.; Curioni, A. Grape Seed Extract: The First Protein-based Fining Agent Endogenous to Grapes. Aust. J. Grape Wine Res. 2017, 23, 215–225. [Google Scholar] [CrossRef]
  9. Rajbhar, K.; Dawda, H.; Mukundan, U. Polyphenols: Methods of Extraction. Sci. Rev. Chem. Commun. 2015, 5, 1–6. [Google Scholar]
  10. Sulaiman, S.F.; Sajak, A.A.B.; Ooi, K.L.; Supriatno; Seow, E.M. Effect of Solvents in Extracting Polyphenols and Antioxidants of Selected Raw Vegetables. J. Food Compos. Anal. 2011, 24, 506–515. [Google Scholar] [CrossRef]
  11. Duba, K.S.; Casazza, A.A.; Mohamed, H.B.; Perego, P.; Fiori, L. Extraction of Polyphenols from Grape Skins and Defatted Grape Seeds Using Subcritical Water: Experiments and Modeling. Food Bioprod. Process. 2015, 94, 29–38. [Google Scholar] [CrossRef]
  12. Yammine, S.; Delsart, C.; Vitrac, X.; Peuchot, M.M.; Ghidossi, R. Characterisation of Polyphenols and Antioxidant Potential of Red and White Pomace By-Product Extracts Using Subcritical Water Extraction. OENO One 2020, 54, 263–278. [Google Scholar] [CrossRef]
  13. Ferreira, C.; Moreira, M.M.; Delerue-Matos, C.; Sarraguça, M. Subcritical Water Extraction to Valorize Grape Biomass—A Step Closer to Circular Economy. Molecules 2023, 28, 7538. [Google Scholar] [CrossRef] [PubMed]
  14. Zhang, J.; Wen, C.; Zhang, H.; Duan, Y.; Ma, H. Recent Advances in the Extraction of Bioactive Compounds with Subcritical Water: A Review. Trends Food Sci. Technol. 2019, 95, 183–195. [Google Scholar] [CrossRef]
  15. Benito-Román, Ó.; Blanco, B.; Sanz, M.T.; Beltrán, S. Subcritical Water Extraction of Phenolic Compounds from Onion Skin Wastes (Allium cepa Cv. Horcal): Effect of Temperature and Solvent Properties. Antioxidants 2020, 9, 1233. [Google Scholar] [CrossRef]
  16. Giombelli, C.; Iwassa, I.J.; da Silva, C.; Barros, B.C.B. Valorization of Peach Palm By-Product through Subcritical Water Extraction of Soluble Sugars and Phenolic Compounds. J. Supercrit. Fluids 2020, 165, 104985. [Google Scholar] [CrossRef]
  17. Rodrigues, L.G.G.; Mazzutti, S.; Vitali, L.; Micke, G.A.; Ferreira, S.R.S. Recovery of Bioactive Phenolic Compounds from Papaya Seeds Agroindustrial Residue Using Subcritical Water Extraction. Biocatal. Agric. Biotechnol. 2019, 22, 101367. [Google Scholar] [CrossRef]
  18. Ibañez, E.; Kubátová, A.; Señoráns, F.J.; Cavero, S.; Reglero, G.; Hawthorne, S.B. Subcritical Water Extraction of Antioxidant Compounds from Rosemary Plants. J. Agric. Food Chem. 2003, 51, 375–382. [Google Scholar] [CrossRef]
  19. Singh, P.P.; Saldaña, M.D.A. Subcritical Water Extraction of Phenolic Compounds from Potato Peel. Food Res. Int. 2011, 44, 2452–2458. [Google Scholar] [CrossRef]
  20. Carr, A.G.; Mammucari, R.; Foster, N.R. A Review of Subcritical Water as a Solvent and Its Utilisation for the Processing of Hydrophobic Organic Compounds. Chem. Eng. J. 2011, 172, 1–17. [Google Scholar] [CrossRef]
  21. Möller, M.; Nilges, P.; Harnisch, F.; Schröder, U. Subcritical Water as Reaction Environment: Fundamentals of Hydrothermal Biomass Transformation. ChemSusChem 2011, 4, 566–579. [Google Scholar] [CrossRef] [PubMed]
  22. Tian, Y.; Wang, Y.; Ma, Y.; Zhu, P.; He, J.; Lei, J. Optimization of Subcritical Water Extraction of Resveratrol from Grape Seeds by Response Surface Methodology. Appl. Sci. 2017, 7, 321. [Google Scholar] [CrossRef]
  23. Singleton, V.L.; Rossi, J.A. Colorimetry of Total Phenolics with Phosphomolybdic-Phosphotungstic Acid Reagents. Am. J. Enol. Vitic. 1965, 16, 144–158. [Google Scholar] [CrossRef]
  24. Bradford, M.M. A Rapid and Sensitive Method for the Quantitation of Microgram Quantities of Protein Utilizing the Principle of Protein-Dye Binding. Anal. Biochem. 1976, 72, 248–254. [Google Scholar] [CrossRef]
  25. Brand-Williams, W.; Cuvelier, M.E.; Berset, C. Use of a Free Radical Method to Evaluate Antioxidant Activity. LWT Food Sci. Technol. 1995, 28, 25–30. [Google Scholar] [CrossRef]
  26. Nioi, C.; Lisanti, M.T.; Meunier, F.; Redon, P.; Massot, A.; Moine, V. Antioxidant Activity of Yeast Derivatives: Evaluation of Their Application to Enhance the Oxidative Stability of White Wine. LWT 2022, 171, 114116. [Google Scholar] [CrossRef]
  27. Mateus, A.R.S.; Barros, S.C.; Cortegoso, S.M.; Sendón, R.; Barbosa-Pereira, L.; Khwaldia, K.; Pataro, G.; Ferrari, G.; Breniaux, M.; Ghidossi, R.; et al. Potential of Fruit Seeds: Exploring Bioactives and Ensuring Food Safety for Sustainable Management of Food Waste. Food Chem. X 2024, 23, 101718. [Google Scholar] [CrossRef]
  28. Salagoity-Auguste, M.-H.; Tricard, C.; Sudraud, P. Dosage Simultané Des Aldéhydes Aromatiques et Des Coumarines Par Chromatographie Liquide Haute Performance Application Aux Vins et Eaux-de-Vie Vieillis En Fŭt de Chĕne. J. Chromatogr. A 1987, 392, 379–387. [Google Scholar] [CrossRef]
  29. Aliakbarian, B.; Fathi, A.; Perego, P.; Dehghani, F. Extraction of Antioxidants from Winery Wastes Using Subcritical Water. J. Supercrit. Fluids 2012, 65, 18–24. [Google Scholar] [CrossRef]
  30. Kronholm, J.; Hartonen, K.; Riekkola, M.-L. Analytical Extractions with Water at Elevated Temperatures and Pressures. TrAC Trends Anal. Chem. 2007, 26, 396–412. [Google Scholar] [CrossRef]
  31. Ju, Z.; Howard, L.R. Subcritical Water and Sulfured Water Extraction of Anthocyanins and Other Phenolics from Dried Red Grape Skin. J. Food Sci. 2005, 70, S270–S276. [Google Scholar] [CrossRef]
  32. Gabaston, J.; Leborgne, C.; Valls, J.; Renouf, E.; Richard, T.; Waffo-Teguo, P.; Mérillon, J.-M. Subcritical Water Extraction of Stilbenes from Grapevine By-Products: A New Green Chemistry Approach. Ind. Crops Prod. 2018, 126, 272–279. [Google Scholar] [CrossRef]
  33. Liazid, A.; Palma, M.; Brigui, J.; Barroso, C.G. Investigation on Phenolic Compounds Stability during Microwave-Assisted Extraction. J. Chromatogr. A 2007, 1140, 29–34. [Google Scholar] [CrossRef] [PubMed]
  34. Matthäus, B. Virgin Grape Seed Oil: Is It Really a Nutritional Highlight? Eur. J. Lipid Sci. Technol. 2008, 110, 645–650. [Google Scholar] [CrossRef]
  35. Pesavento, I.C.; Bertazzo, A.; Flamini, R.; Vedova, A.D.; Rosso, M.D.; Seraglia, R.; Traldi, P. Differentiation of Vitis vinifera Varieties by MALDI-MS Analysis of the Grape Seed Proteins. J. Mass Spectrom. 2008, 43, 234–241. [Google Scholar] [CrossRef]
  36. Elkatry, H.O.; Ahmed, A.R.; El-Beltagi, H.S.; Mohamed, H.I.; Eshak, N.S. Biological Activities of Grape Seed By-Products and Their Potential Use as Natural Sources of Food Additives in the Production of Balady Bread. Foods 2022, 11, 1948. [Google Scholar] [CrossRef]
  37. Oprea, O.B.; Popa, M.E.; Apostol, L.; Gaceu, L. Research on the Potential Use of Grape Seed Flour in the Bakery Industry. Foods 2022, 11, 1589. [Google Scholar] [CrossRef]
  38. Hata, S.; Wiboonsirikul, J.; Maeda, A.; Kimura, Y.; Adachi, S. Extraction of Defatted Rice Bran by Subcritical Water Treatment. Biochem. Eng. J. 2008, 40, 44–53. [Google Scholar] [CrossRef]
  39. Zhang, J.; Wen, C.; Li, C.; Duan, Y.; Zhang, H.; Ma, H. Antioxidant Peptide Fractions Isolated from Wheat Germ Protein with Subcritical Water Extraction and Its Transport Across Caco-2 Cells. J. Food Sci. 2019, 84, 2139–2146. [Google Scholar] [CrossRef]
  40. Baca-Bocanegra, B.; Nogales-Bueno, J.; Hernández-Hierro, J.M.; Heredia, F.J. Optimization of Protein Extraction of Oenological Interest from Grape Seed Meal Using Design of Experiments and Response Surface Methodology. Foods 2021, 10, 79. [Google Scholar] [CrossRef]
  41. Teo, C.C.; Tan, S.N.; Yong, J.W.H.; Hew, C.S.; Ong, E.S. Pressurized Hot Water Extraction (PHWE). J. Chromatogr. A 2010, 1217, 2484–2494. [Google Scholar] [CrossRef] [PubMed]
  42. Rockenbach, I.I.; Gonzaga, L.V.; Rizelio, V.M.; Gonçalves, A.E.d.S.S.; Genovese, M.I.; Fett, R. Phenolic Compounds and Antioxidant Activity of Seed and Skin Extracts of Red Grape (Vitis vinifera and Vitis labrusca) Pomace from Brazilian Winemaking. Food Res. Int. 2011, 44, 897–901. [Google Scholar] [CrossRef]
  43. Sochorova, L.; Prusova, B.; Jurikova, T.; Mlcek, J.; Adamkova, A.; Baron, M.; Sochor, J. The Study of Antioxidant Components in Grape Seeds. Molecules 2020, 25, 3736. [Google Scholar] [CrossRef] [PubMed]
  44. Guendez, R.; Kallithraka, S.; Makris, D.P.; Kefalas, P. Determination of Low Molecular Weight Polyphenolic Constituents in Grape (Vitis vinifera Sp.) Seed Extracts: Correlation with Antiradical Activity. Food Chem. 2005, 89, 1–9. [Google Scholar] [CrossRef]
  45. Tița, O.; Lengyel, E.; Stegăruș, D.I.; Săvescu, P.; Ciubara, A.B.; Constantinescu, M.A.; Tița, M.A.; Rață, D.; Ciubara, A. Identification and Quantification of Valuable Compounds in Red Grape Seeds. Appl. Sci. 2021, 11, 5124. [Google Scholar] [CrossRef]
  46. López-Gutiérrez, N.; Romero-González, R.; Vidal, J.L.M.; Frenich, A.G. Determination of Polyphenols in Grape-Based Nutraceutical Products Using High Resolution Mass Spectrometry. LWT Food Sci. Technol. 2016, 71, 249–259. [Google Scholar] [CrossRef]
  47. Galkin, A.A.; Lunin, V.V. Subcritical and Supercritical Water: A Universal Medium for Chemical Reactions. Russ. Chem. Rev. 2005, 74, 21–35. [Google Scholar] [CrossRef]
  48. Xu, G.; Ye, X.; Chen, J.; Liu, D. Effect of Heat Treatment on the Phenolic Compounds and Antioxidant Capacity of Citrus Peel Extract. J. Agric. Food Chem. 2007, 55, 330–335. [Google Scholar] [CrossRef]
  49. Alibekov, R.S.; Kamal, S.M.M.; Taip, F.S.; Sulaiman, A.; Azimov, A.M.; Urazbayeva, K.A. Recovery of Phenolic Compounds from Jackfruit Seeds Using Subcritical Water Extraction. Foods 2023, 12, 3296. [Google Scholar] [CrossRef]
  50. Plaza, M.; Amigo-Benavent, M.; del Castillo, M.D.; Ibáñez, E.; Herrero, M. Facts about the Formation of New Antioxidants in Natural Samples after Subcritical Water Extraction. Food Res. Int. 2010, 43, 2341–2348. [Google Scholar] [CrossRef]
  51. Plaza, M.; Amigo-Benavent, M.; del Castillo, M.D.; Ibáñez, E.; Herrero, M. Neoformation of Antioxidants in Glycation Model Systems Treated under Subcritical Water Extraction Conditions. Food Res. Int. 2010, 43, 1123–1129. [Google Scholar] [CrossRef]
  52. Ellis, G.P. The Maillard Reaction. Adv. Carbohydr. Chem. 1959, 14, 63–134. [Google Scholar] [CrossRef] [PubMed]
  53. Parisi, S.; Luo, W. Maillard Reaction and Processed Foods—Main Chemical Products. In Chemistry of Maillard Reactions in Processed Foods; SpringerBriefs in Molecular Science; Springer: Cham, Switzerland, 2018. [Google Scholar]
  54. Kheirkhah, H.; Baroutian, S.; Quek, S.Y. Evaluation of Bioactive Compounds Extracted from Hayward Kiwifruit Pomace by Subcritical Water Extraction. Food Bioprod. Process. 2019, 115, 143–153. [Google Scholar] [CrossRef]
  55. Fan, R.; Gao, Y. Maillard and Hydrolytic Reactions in Subcritical Water Extraction of Bioactive Compounds from Licorice. Molecules 2022, 27, 6851. [Google Scholar] [CrossRef]
  56. He, L.; Zhang, X.; Xu, H.; Xu, C.; Yuan, F.; Knez, Ž.; Novak, Z.; Gao, Y. Subcritical Water Extraction of Phenolic Compounds from Pomegranate (Punica granatum L.) Seed Residues and Investigation into Their Antioxidant Activities with HPLC–ABTS+ Assay. Food Bioprod. Process. 2012, 90, 215–223. [Google Scholar] [CrossRef]
  57. Plaza, M.; Abrahamsson, V.; Turner, C. Extraction and Neoformation of Antioxidant Compounds by Pressurized Hot Water Extraction from Apple Byproducts. J. Agric. Food Chem. 2013, 61, 5500–5510. [Google Scholar] [CrossRef]
  58. Liu, S.-C.; Yang, D.-J.; Jin, S.-Y.; Hsu, C.-H.; Chen, S.-L. Kinetics of Color Development, PH Decreasing, and Anti-Oxidative Activity Reduction of Maillard Reaction in Galactose/Glycine Model Systems. Food Chem. 2008, 108, 533–541. [Google Scholar] [CrossRef]
  59. Kanmaz, E.Ö. 5-Hydroxymethylfurfural (HMF) Formation during Subcritical Water Extraction. Food Sci. Biotechnol. 2018, 27, 981–986. [Google Scholar] [CrossRef]
  60. Asghari, F.S.; Yoshida, H. Acid-Catalyzed Production of 5-Hydroxymethyl Furfural from d-Fructose in Subcritical Water. Ind. Eng. Chem. Res. 2006, 45, 2163–2173. [Google Scholar] [CrossRef]
  61. Vergara-Salinas, J.R.; Vergara, M.; Altamirano, C.; Gonzalez, Á.; Pérez-Correa, J.R. Characterization of Pressurized Hot Water Extracts of Grape Pomace: Chemical and Biological Antioxidant Activity. Food Chem. 2014, 171, 62–69. [Google Scholar] [CrossRef]
  62. Usui, T.; Shizuuchi, S.; Watanabe, H.; Hayase, F. Cytotoxicity and Oxidative Stress Induced by the Glyceraldehyde-Related Maillard Reaction Products for HL-60 Cells. Biosci. Biotechnol. Biochem. 2004, 68, 333–340. [Google Scholar] [CrossRef]
  63. Kitts, D.D.; Chen, X.-M.; Jing, H. Demonstration of Antioxidant and Anti-Inflammatory Bioactivities from Sugar–Amino Acid Maillard Reaction Products. J. Agric. Food Chem. 2012, 60, 6718–6727. [Google Scholar] [CrossRef]
Figure 1. Experimental set-up for the SWE.
Processes 13 01788 g001
Figure 2. Three-dimensional surface and contour plots for AA (a), TPC (b), and Tprot (c) by SWE.
Processes 13 01788 g002
Figure 3. Effect of SWE temperature (pressure set at 20 bar) on pH (a), total reducing sugar (b), browning color with absorbance at 420 nm (c), and concentration of 5-hydroxymethylfurfural (d). <LOD: inferior to the limit of detection; different capital letters indicate significant differences between samples according to the Kruskal–Wallis test (p-value < 0.05).
Processes 13 01788 g003
Table 1. Levels for the different SWE variables.
VariableF1
Temperature (°C)
F2
Time (min)
F3
Pressure (Bar)
Low level (−1)1001020
Middle level (0)1503545
High level (+1)2006070
Table 2. Box–Behnken experimental design and the results of grape seed extraction by SWE.
Extraction Procedure Responses
RunRepetitionF1
(°C)
F2
(h)
F3
(bar)
AA
(mg TROLOXeq/g DM)
TPC
(mg GAE/g DM)
Tprot
(mg BSAeq/g DM)
Subcritical water111000.1745235.2 ± 1.9120.2 ± 1.677.2 ± 3.4
212000.1745300.5 ± 2.0240.0 ± 0.729.5 ± 3.7
31100145275.2 ± 2.2150.9 ± 1.766.8 ± 4.2
41200145328.2 ± 2.0293.0 ± 0.719.6 ± 1.7
511000.5820251.1 ± 2.8151.7 ± 2.975.6 ± 4.8
612000.5820302.7 ± 2.5255.2 ± 0.824.8 ± 2.7
711000.5870270.5 ± 2.2152.5 ± 0.870.5 ± 2.4
812000.5870327.9 ± 2.7224.1 ± 0.920.1 ± 1.5
911500.1720368.4 ± 2.9213.0 ± 1.278.9 ± 4.6
101150120337.0 ± 1.4208.8 ± 2.066.0 ± 3.3
1111500.1770373.2 ± 1.9228.5 ± 3.979.2 ± 4.8
121150170331.2 ± 3.5239.1 ± 2.159.1 ± 2.1
1311500.5845334.1 ± 1.1331.2 ± 0.773.7 ± 3.5
1411500.5845341.3 ± 2.9305.7 ± 0.772.2 ± 3.0
1511500.5845317.8 ± 3.1287.3 ± 1.172.5 ± 3.23.2
Water/ethanol
extraction
16125241177.0 ± 10.1150.0 ± 5.864.4 ± 1.9
17125241192.5 ± 8.5166.0 ± 5.373.2 ± 3.2
18125241193.8 ± 8.6166.7 ± 7.472.7 ± 2.7
Table 3. ANOVA results for grape seed SWE responses.
SourceDegree of FreedomSum of SquareMean SquareF Valuep ValueR2Adjusted R2Signification Code
AA
(mg TROLOXeq/g DM)
Model919,659.02184.33.5840.0870.8660.801.
Residual53047.6609.5
Total corrected1422,706.7
TPC (mg GAE/g DM)Model951,725.15747.28.4940.0150.9390.898*
Residual53383.1676.6
Total corrected1455,108.2
Tprot (mg BSAeq/g DM)Model97305.9811.7145.405<0.00010.9960.989***
Residual527.95.5
Total corrected147333.9
Signification codes: 0 < *** < 0.001 < ** < 0.01 < * < 0.05 < . < 0.1.
Table 4. Optimal conditions for grape seed SWE to maximize associated responses.
Conditions
(°C; min, bar)
ValuesDesirabilityRelative Standard Error
Optimal AA
165 °C, 51 min, 20 bar
Predicted value351.6 mg TROLOXeq/gDM0.9495.6%
Experimental
value
332.7 ± 1.4 mg TROLOXeq/gDM
Optimal TPCPredicted value276.0 mg GAE/g DM0.9694.1%
170 °C, 39 min, 20 barExperimental
value
288.3 ± 2.1 mg GAE/g DM
Optimal Tprot Predicted value84.2 mg BSA/g DM1.0006.6%
105 °C, 10 min, 20 barExperimental
value
78.0 ± 2.0 mg BSA/g DM
Table 5. Phenolic compounds confirmed through HPLC-PDA-MS/MS and quantified by HPLC-DAD in grape seed extract.
NCompoundRt (min)λmax (nm)Concentration Range (µg/mL)Calibration Curve EquationR2LOD
(µg/mL)
LOQ
(µg/mL)
Grape Seed *
1Gallic acid2.592780.1–50y = 75.71089x − 65.713460.99780.050.106.59 ± 0.05
2Protocatechuic acid4.373000.1–50y = 48.46254x − 33.520030.99570.050.107.83 ± 0.11
3p-hydroxybenzoic acid6.722780.05–5y = 55.64851x − 0.885610.99990.0250.05<LOQ
4Delphinidin chloride7.623252.5–50y = 2.19073x − 2.436980.997812.501.92 ± 0.67
5Catechin8.692780.25–5y = 18.27697x − 1.515850.99930.10.250.44 ± 0.12
6Gentisic acid9.40FLD0.25–5y = 138.89148x − 48.880050.99220.10.250.20 ± 0.00
7Chlorogenic acid12.333250.25–10y = 75.63289x − 33.694500.99300.10.25<LOQ
8Epicatechin12.482780.25–5y = 19.67890x − 0.364730.99960.10.250.07 ± 0.00
9Isoquercitrin22.763600.25–5y = 56.13872x − 11.339720.99840.10.25<LOQ
10Rutin22.803600.1–5y = 35.67480x − 3.804150.99910.050.10<LOQ
* Phenolic compounds are expressed in mg/g extract. LOD: limit of detection. LOQ: limit of quantification. <LOQ: inferior to the limit of quantification.
Disclaimer/Publisher’s Note: The statements, opinions and data contained in all publications are solely those of the individual author(s) and contributor(s) and not of MDPI and/or the editor(s). MDPI and/or the editor(s) disclaim responsibility for any injury to people or property resulting from any ideas, methods, instructions or products referred to in the content.

