Article

Failure Analysis and Safety De-Icing Strategy of Local Transmission Tower-Line Structure System Based on Orthogonal Method in Power System

1
State Grid Hubei Electric Power Research Institute, Wuhan 430077, China
2
School of Electrical Engineering and Automation, Wuhan University, Wuhan 430072, China
3
Hubei Engineering and Technology Research Center for AC/DC Intelligent Distribution Network, School of Electrical Engineering and Automation, Wuhan University, Wuhan 430072, China
*
Author to whom correspondence should be addressed.
Processes 2025, 13(6), 1782; https://doi.org/10.3390/pr13061782
Submission received: 2 April 2025 / Revised: 30 May 2025 / Accepted: 3 June 2025 / Published: 4 June 2025

Abstract

:
The development of lightweight de-icing equipment for partial transmission lines in a microtopography area has become a hot research topic. However, the existing local line de-icing methods pay less attention to the mechanical damage caused by unequal tension on the tower, and there is a lack of safe de-icing strategies. This study has proposed a methodology integrating an orthogonal experimental design and finite element mechanical analysis to assess the impact of localized line de-icing on the structural stability of transmission tower-line systems. Taking the ±800 kV transmission line as an example, the refined finite element model of the transmission tower-line system has been established, the influence of each conductor and ground wire defrosting on the tower has been analyzed, and a scientific de-icing strategy has been formulated. Thus, the critical ice thickness and wind speed curves for tower failure have been calculated. The research results show that the de-icing of conductor 1, 5, 6, and ground wires 11 and 12 has a higher impact on the failure of the entire tower-line system. Ice melting on the windward side and ice covering on the leeward side will cause the unbalanced tension of the tower to be greater. The findings provide actionable guidelines for the formulation of a transmission line de-icing strategy and reduce the damage caused by ice.

1. Introduction

Power transmission line icing poses a significant threat to the safe and stable operation of the transmission lines [1]. Experience has shown that line icing risk exhibits distinct local characteristics, influenced by micro-topographical factors. The severe icing sections that pose a genuine threat to the fundamental safety of tens of kilometers of lines are generally at the kilometer scale, with 90% being less than 2 km in length. Focusing on melting ice in these kilometer-scale micro-topographical line sections can effectively prevent tower collapses and line breaks caused by ice disasters, thereby reducing the impact on the safe operation of the power grid [2,3].
Hence, portable de-icing technologies for specific line sections have emerged as a research hotspot [4]. Based on the intermediate frequency voltage-regulated rectification inverter topology [5], the State Grid Corporation of China has developed a man-portable DC de-icing device equipped with a built-in generator to address the challenge of obtaining power sources in the field [6]. This device weighs only 80 kg, with a rated power of 12 kW, a maximum de-icing current of 400 A, and an output voltage range of 15–30 V. Refs. [7,8] introduced a vehicle-based mobile DC de-icing device (MDID) that uses a 6-pulse rectifier to rectify 50 Hz of AC power, adjusting the de-icing current through the control of the triggering angle. In Refs. [9,10], a lightweight DC de-icing power source based on a coaxial modular motor design has been proposed, with a single unit weighing 85 kg, a rated power of 25 kW, capable of dual parallel operation, and a maximum output current of 600 A. Additionally, there are localized de-icing methods for conductors and ground wires, such as blank shell detonation [11,12], robot vibration de-icing [13], and drone-mounted iron rod vibration de-icing [14]. Existing de-icing methods can effectively remove severe icing on conductors and ground wires in icing-affected sections, addressing the challenge of obtaining power sources in the field. However, they seldom consider the mechanical destabilization and damage to the transmission tower structure during the de-icing process. After de-icing a single span of conductors and ground wires, the tower may experience increased unbalanced tension, potentially leading to tower damage [15,16]. Thus, it is very important to study the mechanical effect of melting ice on a transmission tower for the local de-icing of micro-terrain.
For research on the mechanical failure of the transmission tower, numerous scholars have systematically investigated the mechanical characteristics of transmission towers under various loads based on beam element finite element models [17,18]. Rao N. Prasad et al. [19] employed the finite element software MSC-NASTRAN for the nonlinear analysis of transmission towers, and proposed a nonlinear finite element analysis model considering the effects of member eccentricity, beam-column effects, and material nonlinearity. Ref. [20] conducted in-depth research on the mechanical characteristics of tower-line systems with uneven icing, exploring the mechanical characteristics of the tower-line system under uneven icing conditions such as short-span and long-span heavy icing, and central heavy icing in the span. It has been observed that the excessive limit load and unbalanced tension borne by the tower-line system are the primary causes of tower collapses. However, the analysis of how various loads combine and their impact on the unbalanced tension of the tower-line system is not sufficiently in-depth. There is a lack of quantitative research on the mechanical characteristics of the tower-line system under uneven wind and ice loads during the local line section de-icing process [21].
Aiming at the problems existing in the local ice-melting technology of transmission lines, this paper proposed a method for analyzing the impact of local line section de-icing on tower failure based on orthogonal analysis and mechanical finite element calculations. Taking an actual ±800 kV power transmission line as a case study, the 1:1 refined finite element model of the tower-line system was established, and appropriate indicators for tower instability were selected. Using the orthogonal method, the impact of de-icing on each span of conductors and ground wires on tower instability was analyzed. A scientific de-icing strategy has been formulated. Thus, the critical ice thickness and wind speed curves for tower failure have been calculated. The research findings hold significant engineering practical value for safe de-icing decisions and the development of local line section de-icing technologies, as shown in Table 1.

2. Transmission Tower-Line System Model

Take a strain section of a ±800 kV DC transmission line in China as the research object. The section is located on a plateau with an altitude of 2000 m and harsh climatic conditions. The maximum design wind speed is 30 m/s. Each tower consists of three different types of angled steel elements, Q420, Q345, and Q235, respectively. The tension section is composed of two tangent towers and two tension towers. The relevant parameters of the towers and spans are shown in Table 2.
To calculate the tower stress and deformation caused by uneven loading on the high-voltage transmission tower-line system accurately, the beam element is used to simulate the three types of angled steel used in transmission towers. The link element with nonlinear, stress-stiffening, and large deformation capabilities is used to simulate the conductor and ground wire. For the modeling of the conductor and ground wire, under normal conditions, the conductor and ground wire of overhead transmission lines are in a suspension line structure under the action of gravity, and various forces have reached equilibrium. The 6-split conductor can be equivalent to a single conductor to simplify the model, and the equivalent must ensure that the initial strain, conductor-specific load, and unit cross-section tension are still consistent with the single conductor. The catenary equation of the transmission line is as follows [22]:
y = σ 0 h γ L h = 0 ( sinh γ l 2 σ 0 + sinh γ ( 2 x l ) 2 σ 0 ) ( 2 σ 0 γ sinh γ x 2 σ 0 sinh γ ( l x ) 2 σ 0 ) 1 + ( h L h = 0 ) 2 L h = 0 = 2 σ 0 γ sinh γ l 2 σ 0
where l and h are the horizontal distance and vertical distance of the line, respectively. γ is the ratio of gravity per unit length to the cross-section of the wire; σ0 is the horizontal stress of the wire.
The tower takes each steel element and each string of insulators as a separate unit, and the conductor and ground wire between each segment are divided into 300 units. The 1:1 refined simulation model of the tower-line system is shown in Figure 1.

3. Orthogonal Test Design of De-Icing for Each Wire

Mechanical failure of the transmission tower is mainly caused by an excessive load and unbalanced tension. When part of the conductors or ground wires melt ice due to natural de-icing or artificial de-icing, the unbalanced tension borne by the tower increases. Therefore, it is necessary to analyze the influence of different ice-covering combinations of the conductors and ground wires on the stress distribution of the transmission tower. By sequencing the effect of the conductors’ and ground wires’ ice covering on the mechanics of the tower, the optimal de-icing strategy can be obtained.

3.1. Design of the Orthogonal Array

The DC ± 800 kV transmission tower-line system contains 6 conductors and 6 ground wires, as shown in Figure 2. Considering the ice covering of each conductor and ground wire between the three spacing, there are 212 cases of combination, and 4096 finite element simulation calculations are needed to determine the worst de-icing combination, which takes too long. Therefore, the orthogonal design method can be used for analysis [23], which will greatly reduce the workload of simulation calculation and improve the efficiency of analysis.
Considering the number of ice melting combinations of each conductor and ground wire, the 15 factors and 2 levels the orthogonal table are selected, and its first 12 columns are taken to correspond to the conductors and ground lines (12 factors) in Figure 2. The last 3 empty columns in the orthogonal table that are orthogonal to the other factors are regarded as the influence of random error on the test index. A total of 16 simulation calculations are required for a given ice thickness and wind speed. The orthogonal table is shown in Table 3. Level 1 indicates that the conductor or ground wire corresponding to the factor has not melted ice, and level 0 indicates that the ice covering the surface of the wire has fallen off. Abbreviate “Condutor 1” as shown in Figure 2 to “C1”, “Ground wire 1” to “G1”, and so on. For example, the ice combination “111111111111” in Table 3 means that all conductors and ground wires are fully covered with ice.
The wind speed and ice thickness will affect the wind load and ice load of the line, so the analysis results under different wind speed and ice thicknesses may be different. Therefore, based on the transmission line section design wind speed of 30 m/s and ice thickness of 30 mm, a variety of typical wind speeds and ice thicknesses are comprehensively selected for simulation calculation in the test, which will make the final analysis conclusion not affected by the external environment and cover realistic combinations observed in plateau regions.

3.2. Apply Loads and Calculations According to the Orthogonal Table

3.2.1. Calculation of Load

The load applied to the transmission tower-line system includes the ice load and the wind load.
Usually, the ice covering of various types and different surface shapes attached to the transmission line is translated into a circular rime section with a density of 0.9 × 10³ kg/m3. If the ice thickness of the wire is δ mm, the unit ice covering load is shown as Equation (2).
g0 = 9.8 × 0.9πδ(d + δ) × 10−3
where d is the calculated outside diameter of the conductor or ground wire.
According to Ref. [9], the ice covering thickness of the ground wire is set to be 5 mm larger than the ice covering thickness of the conductor, and the conductor ice load must be multiplied by the number of splits when calculating.
When the wire is covered with ice, the wind load per unit length of wire generated by horizontal wind is calculated using the following Equation (3).
g 1 = 0.625 n α μ z μ s c β c B v 2 ( d + 2 δ ) sin 2 θ × 10 3
where n is the number of wire splits; α is the uneven factor of wind speed; μz is the wind pressure height variation coefficient; μsc is the type coefficient of the wire; βc is the wind load adjustment factor; lH is the horizontal span; B is the increasing coefficient of wind load during ice covering; θ is the angle between the wind direction and the wire.
The ice load on the transmission tower node is equivalent to half of the algebraic sum of the ice load on all the members connected to it, as shown below:
F i = 1 2 j = 1 m ρ g ( π 4 h z D 2 ) l j
where m is the number of members connected at the tower node; ρ is the density of covered ice; hz is the coefficient of ice diameter change with height; lj is the length of the tower element. Considering that there is no heat generated for the tower, the ice thickness of the tower is consistent with the ice thickness of the ground wire.
For the wind load borne by the tower, the wind load acting on the vertical structure surface can be calculated using the following Equation (5).
F t = k k z k T A c v 2 1.6
where k is the shape coefficient; kz is the variation coefficient of wind pressure, which is calculated by interpolation method. kT is the adjustment factor of wind load. Ac is the wind blocking area of the tower element.

3.2.2. Load Application and Calculation

In the simulation, the self-weights of the conductors, ground wires, and towers are first set, and then the ice load and wind load as described above are, respectively, applied to them, and the loads are all loaded to the nodes of the tower-line system in the form of concentrated force. The tower base is deeply buried in soil, and the displacement of the foundation needs to be considered only when the foundation of the transmission tower experiences settlement. This paper aims to study the stability of the tower during the ice-melting process. Therefore, the connection nodes between the tower foundation and the ground can be regarded as fixed points in the calculation. At the same time, considering that the offset of the tension tower under unbalanced tension is relatively small, it is assumed that the conductor and ground suspension points of the two tension towers will not move. Therefore, zero displacement constraints are applied to all degrees of freedom of each tower foundation node and the wire suspension points of the two tension towers.
Taking orthogonal test 6 as an example, the corresponding levels of conductors 1, 4, and 5 and ground wire 4 and 5 in Table 2 are 1, and the others are 0. Therefore, ice load and wind load are applied to wires 1, 4, and 5 and ground wires 4 and 5 when loading, while other conductors and ground wires only load wind load. When loading, the wind speed is 30 m/s and the ice thickness is 40 mm. The geometric nonlinearity of the transmission tower-line system is considered in the calculation. After the calculation is completed, the node displacements of transmission tower No. 398 and 399 are extracted, as shown in Figure 3, and the stress values of each element of the towers are extracted, as shown in Figure 4.
As shown in Figure 3, under the combined conditions of the conductor and ground wire ice covering corresponding to test 6, the maximum displacement of the transmission tower appears at the top of the tower, and the displacement of tower 398 is much larger than that of tower 399. From Figure 4, the greatest stress of the two transmission towers is located at their waists under the current calculation conditions. And the maximum stress of the main element of the No. 398 transmission tower reached 274 MPa.

4. Analysis of Orthogonal Test Results

The purpose of the orthogonal test is to analyze the effect of different wires’ ice melting on the mechanical failure of the transmission tower. In general, when the stress of part of the main beams and diagonal beams exceeds its yield strength, the tower has the risk of mechanical failure. In addition, the standard [24] stipulates that the top displacement of the high-voltage transmission tangent tower shall not exceed 3/1000 of its tower height. Thus, considering the influence factors of the mechanical failure of the transmission tower comprehensively, the following two calculation indexes are selected as the indexes of orthogonal test analysis:
(1) The first test index is the stress ratio of the beam, which is calculated as follows:
γ = σ e q σ
where [σ] is the allowable stress of the beam element, σeq is the absolute value of the beam stress. If γ > 1, it indicates that the equivalent stress of the bar exceeds the allowable stress value, and the beam element has failed.
(2) The second test index is the horizontal displacement of the top node of the transmission tower.
The orthogonal test results have been analyzed using the above two test indexes. Firstly, the range analysis method is used to determine the conditions in which the different melting combinations lead to the maximum test index value. The test indexes’ sum k of each factor are calculated at different levels.
k i ( j ) = 1 n ( i ) Ω ( i , j ) n ( i )
i is level 0 or 1, j is the factor, n(i) is the number of occurrences of level i in the j column of the orthogonal table, and Ω(i, j) is the total value of indexes of the corresponding test with level i.
According to the value of k, the most severe combination can be obtained. The advantages of this method are simple, and the disadvantage is that the confidence coefficient of the optimal level of each factor cannot be determined, and the influence of random error on the test results cannot be considered. Then, by using the method of the experiment and mathematical statistics, this paper analyses the results of the 16 orthogonal experiments and obtains the variance ratio F of each factor. The corresponding F of a factor is the variance of each corresponding column divided by the variance of the error. F represents the confidence coefficient of a factor, and the influence degree of each factor can be obtained. The most severe combination determined by the range analysis method is shown in Table 4.
From Table 3, the most severe combination of different wind speeds and ice thicknesses can be changed slightly, and the selected test indexes influence the results of orthogonal analysis. But under the same index, most of the factors are basically unchanged. For example, when the displacement of the top of the tower is the index, the other factors will always be 0 or 1, except for factors 8 and 10. Therefore, in order to determine factor 8 and other uncertainties, the variance analysis method should be used. It can be seen from the distribution table of F that the factor with an F value greater than 10.13 has a more than 95% confidence coefficient, and the factor with an F value greater than 5.54 is a 90% confidence coefficient. And the greater the confidence coefficient, the greater the influence of this factor on the results. Due to different orthogonal groups in different weather conditions, the variance ratio F of different orthogonal groups is tremendous. This paper gives the frequency of occurrence of F whose value is greater than 5.54, as shown in Table 5.
According to Table 4 and the mean values of F of each factor to rank the importance of each factor, the most reliable factors include lines 1, 5, 6, 11, and 12, comparatively important factors are lines 2, 3, 4, and 9, and the least important factors are lines 7, 8, and 10, whose F values are close to F values of error obtained from the final three columns of the orthogonal table. The effect of conductors and ground wires corresponding to the least important factors on tower failure is negligible. Therefore, when reliable factors achieve an optimal value, the probability of tower failure is greatest. Combining with the most severe combination of different weather conditions, the worst combination can be obtained, index 1 corresponds to condition combination of ice cover 1000110x1011, index 2 corresponds to condition combination of ice cover 1010101x1010, and the level x can be 0 or 1, which does not make much difference to the tower failure. So, there are four of the worst combinations, the four kinds of combinations are verified in this paper, the results show that all the peak stress ratios of the main element or diagonal element of the former two combinations are bigger than the results of those combinations in the orthogonal table, and all the horizontal displacement of the tower top nodes of the latter two combinations are bigger than the results of those combinations in the orthogonal table. The reliability of the orthogonal test results is proven.
To analyze the actual terrain of the tower-line system, factors 5, 6, 11, and 12 correspond to the conductors and ground wires of the span 3, the length of span 3 is much larger than the other two spans, and the altitude of tower 399 and tower 400 is much different. Therefore, it has a great influence on the unbalanced tension of the transmission tower, which reflects the reliability of the orthogonal test results. From the results of the orthogonal analysis, generally when the conductors and ground wires of the windward side are covered with nothing, and the conductors and ground wires of the leeward side are covered with ice, the tower-line system is more likely to fail. Due to the high confidence coefficient of factors 1, 5, 6, 11, and 12, these lines must be much accounted for when developing ice-melting strategies.
Since the combination factors 1, 5, 6, 11, and 12 are determined with high confidence, and the values of these factors are all 1 in the worst combination for the tower failure, this means that whether the conductor and ground ice melt at these numbered places has the greatest influence on the unbalanced tension and load of the tower-line system. When formulating ice melt strategies or preventing tower tipping accidents, priority should be given to ensuring that these conductors and ground lines melt ice in time or make their ice thickness not too large to prevent excessive unbalanced tension caused by improper ice melting. According to the confidence degree of each factor and its value on the mechanical instability of the tower obtained by the orthogonal test, the optimal ice melting order is as follows: conductor 5 in span 3, ground wires 11 and 12 in span 3, conductor 6 in span 3, and conductor 1 in span 1. As for the ice melting order of other lines, it has little influence on the mechanical characteristics of the towers, so the ice melting order can be formulated according to the distance of the span distance.

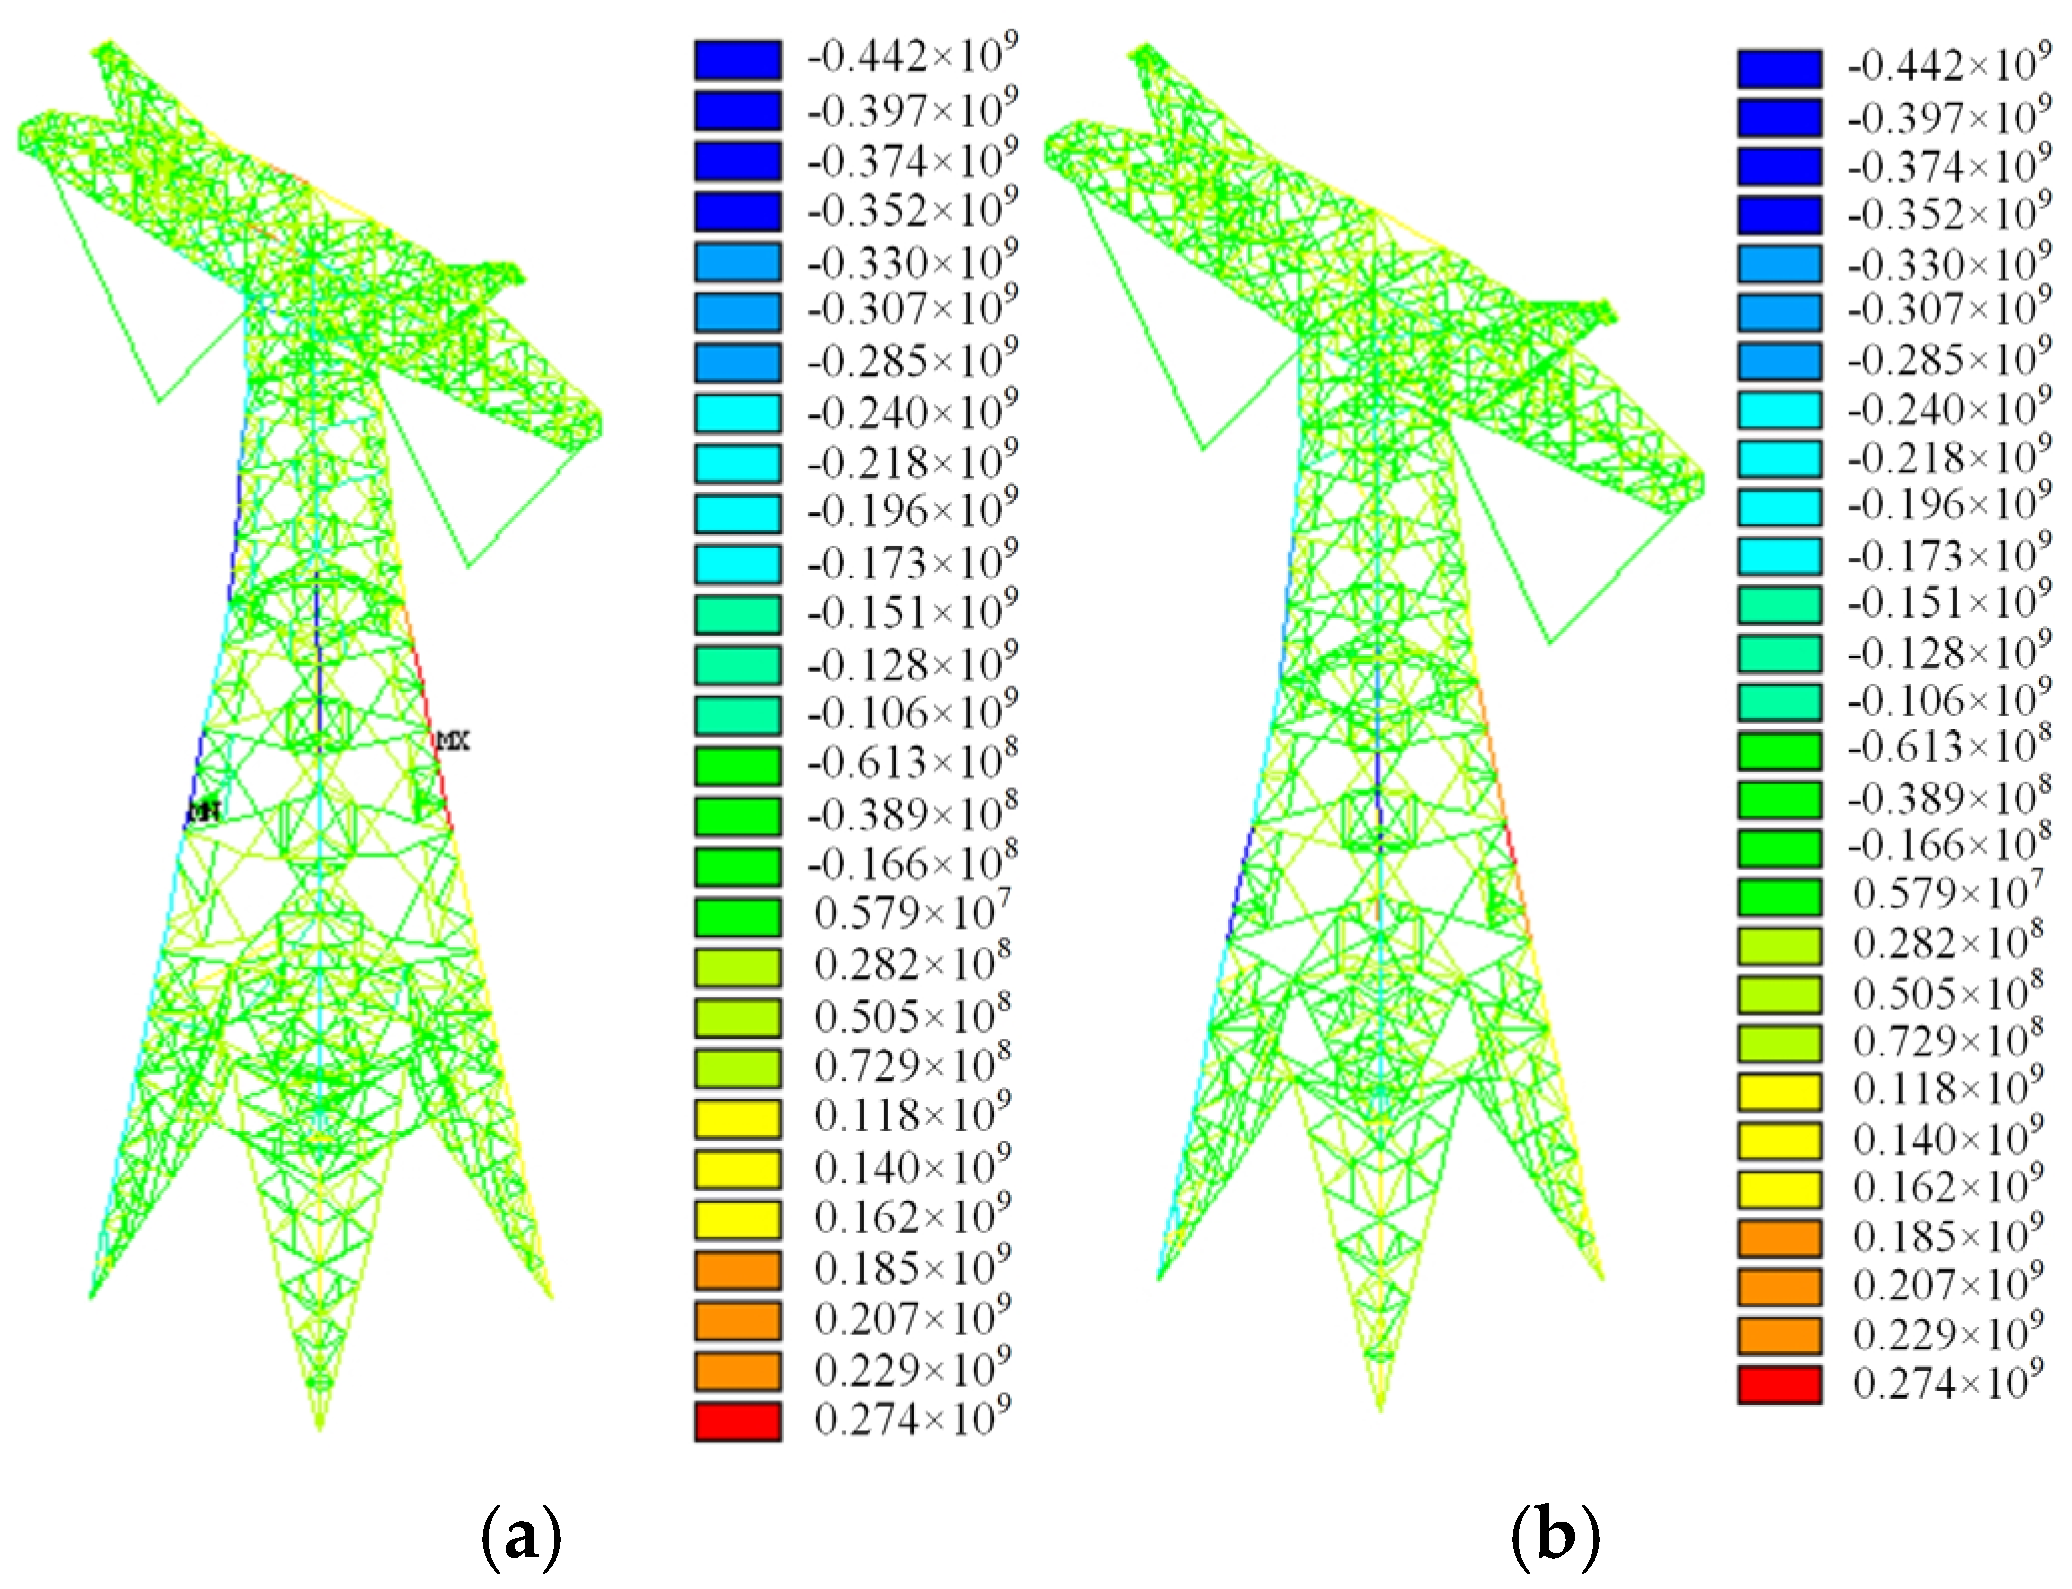
5. Tower Failure Analysis Under the Most Dangerous Ice Melting Condition

A transmission tower is a construction with a tall structure composed of angled steels, which belongs to the high-order super-static structure system. The failure of an individual structural component does not inevitably result in the collapse of the entire transmission tower system, but when the corresponding component’s damage reaches a certain number, the local section of the tower fails gradually, then even the whole tower ultimately fails. At present, many experts and scholars have studied the failure of the tower structure system. In general, the failure criterion of a transmission tower structure system can be roughly classified into the following three kinds of circumstances [25,26]:
(1)
The structure of the tower becomes a single mechanism. The criterion is that after the failure of some components, the total stiffness matrix of the residual components is singular.
(2)
The structural deformation is greater than the allowable value. If the top displacement of the tower exceeds a certain value, the transmission tower will be considered a failure.
(3)
The structure cannot bear the extra load or a lower structural bearing capacity occurs for the first time. Generally speaking, the transmission tower will be considered a failure when the stress ratio of the main components of the tower is too large.
Based on relevant literature and standards, the classification failure criterion of the tower-line system is shown in Table 6. There are three levels of failure: minor damage, moderate damage, and serious damage. ξ is the peak value of the stress ratio of elements, l is the horizontal displacement of nodes of the tower top, and h is the tower height.
Based on the most severe combination determined by the range analysis method, the wind speed and the ice thickness have been changed to study the failure of the tower-line system under different environmental loads, and we obtained the general trigger range of tower failure. Refer to Table 5, and the critical failure curves of the ±800 kV DC transmission tower-line system are shown in Figure 5.
From Figure 5, the minimum thickness of ice when the tower-line system fails is significantly reduced with the increase in wind speed. When the wind speed is less than 20 m/s, the minimum thickness of ice of failure curve at all levels is not much different with the increase in wind speed, mainly because the wind load is positively correlated with the squared wind speed, and the wind load is small when the wind speed is small. It is recommended that the tower-line system should be noticed when the ice thickness of the transmission lines is above 25 mm, and some ice melting measures should be taken in a timely manner. When the wind speed exceeds 20 m/s, the ice thickness of the failure reduces evidently. When the wind speed exceeds 26 m/s, even if the ice thickness is smaller than about 10 mm, the tower still has a risk of mechanical failure. The calculated results are close to the designed wind speed and designed ice thickness of the tower, verifying the accuracy of the calculation results.

6. Conclusions

This paper proposed a method for failure analysis and a safety de-icing strategy of a local transmission tower-line system based on orthogonal analysis and mechanical finite element analysis. The research work helps to prevent the failure of transmission towers caused by ice melting. The following conclusions are made:
(1)
Orthogonal test results show that conductors 1, 5, and 6 and ground lines 11 and 12 icing or not has a great impact on the mechanical failure situation of the whole tower-line system, and conductors and ground lines with large span lengths and large altitude differences in icing have a greater impact. Meanwhile, from the results of optimal combination, no icing at the windward side and icing at the leeward side can cause larger unbalanced tension on the tower, wherein the risk of tower collapse is significantly elevated. Therefore, the ice on these lines should be preferentially removed when melting ice.
(2)
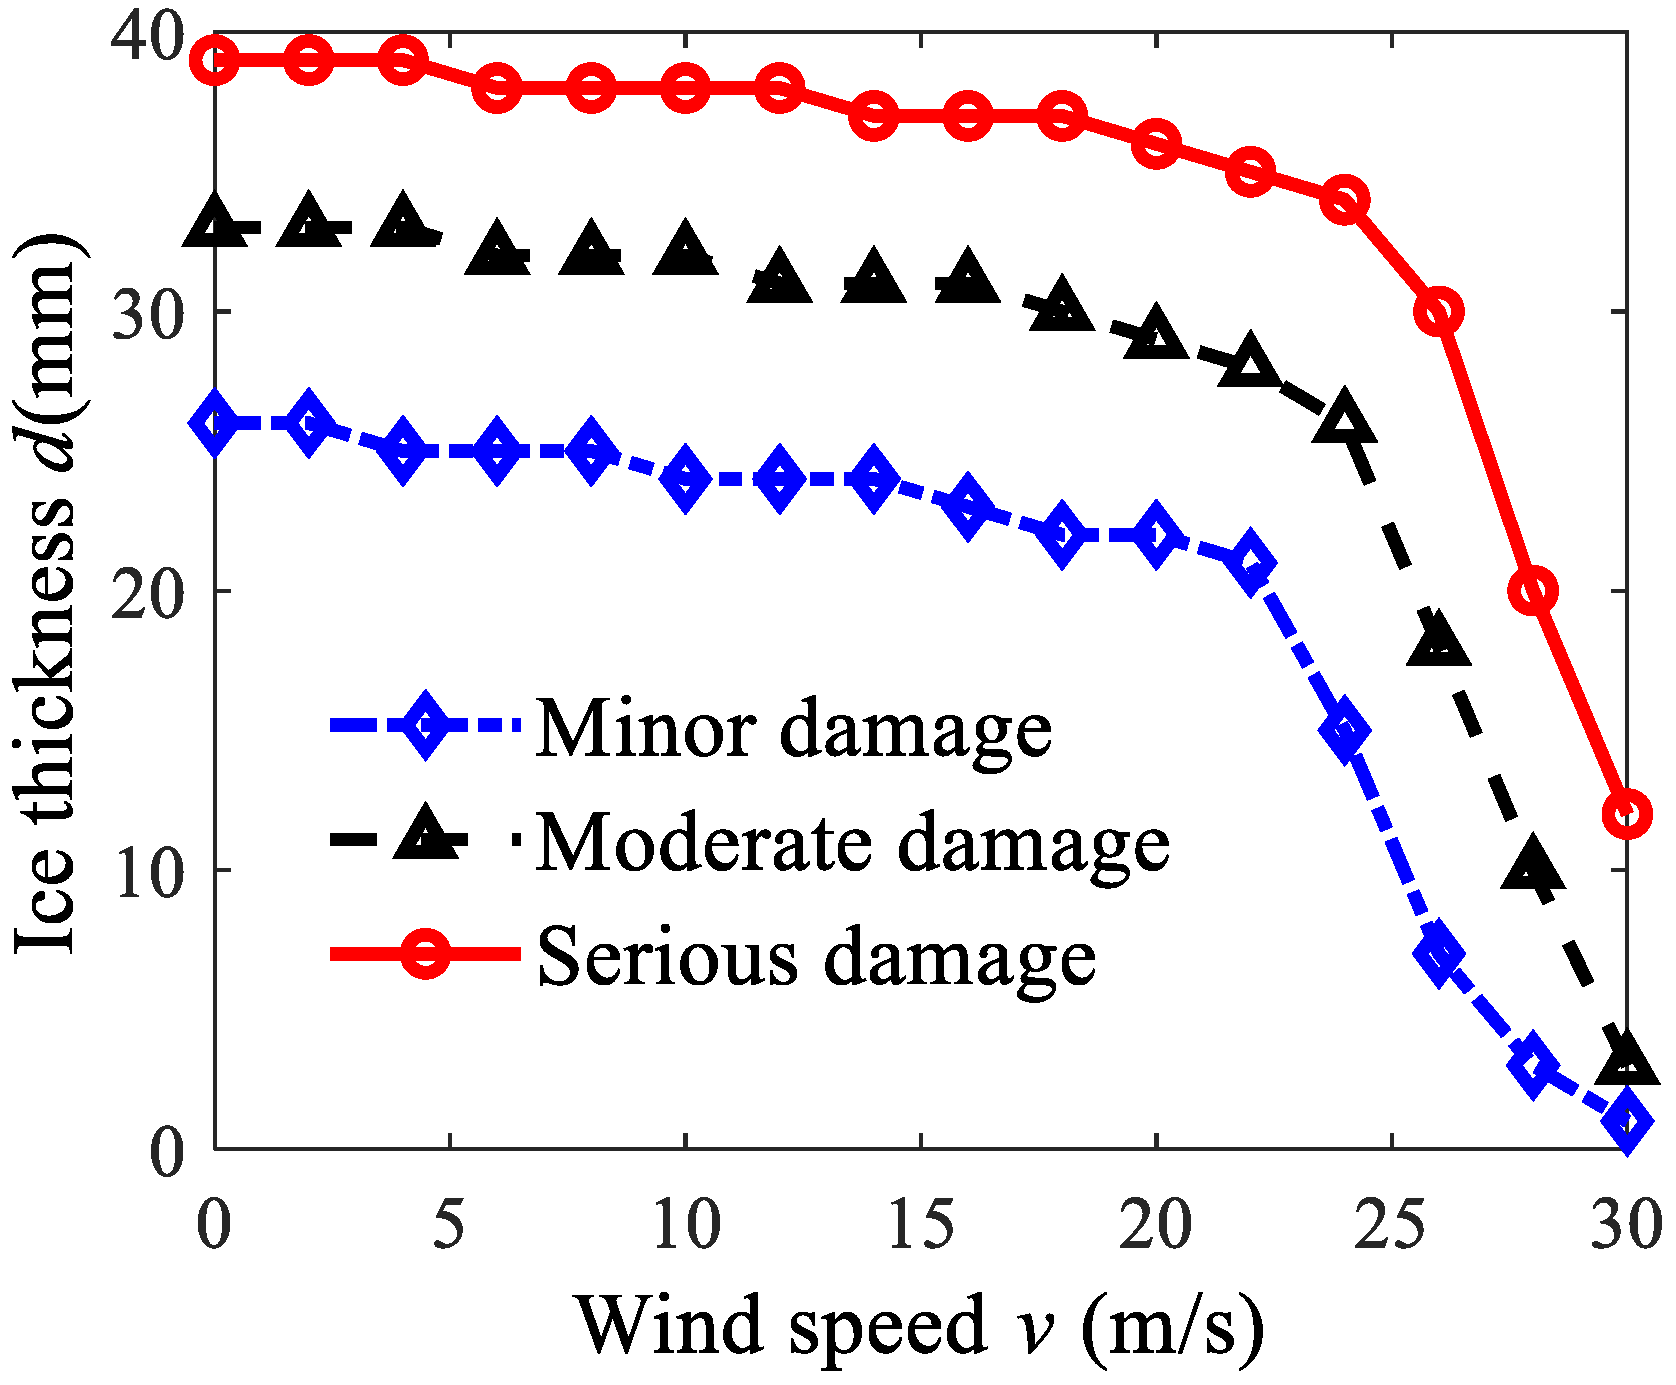
The ice thickness–wind speed critical failure curves of the tower-line system have been proposed. When the ice thickness of the transmission lines is above 25 mm, some ice melting measures should be taken in a timely manner. When the wind speed exceeds 20 m/s, the ice thickness of the tower failure reduces evidently. When the wind speed exceeds 26 m/s, even if the ice thickness is smaller than about 10 mm, the tower still has a risk of mechanical failure.
(3)
Next, research on the real-time de-icing system can be carried out based on the work of this paper. The ice–wind critical failure curve is pre-input into the system, thereby enabling the prediction of ice disaster on transmission lines and the determination of the conditions for ice-melting initiation. Subsequently, based on the current situation of the ice-melting equipment, differentiated efforts will be made to conduct ice melting on specific sections of the conductors and ground wires. The application of the system will help reduce the hazards and losses caused by ice formation on transmission lines.

Author Contributions

Conceptualization, L.Z., X.Z., Z.F. and J.R.; Methodology, L.Z. and J.R.; Software, L.Z. and X.Z.; Writing—original draft, L.Z.; Supervision, Y.S.; Project administration, Y.Y. All authors have read and agreed to the published version of the manuscript.

Funding

This work was supported by State Grid Corporation headquarters technology project, China, under Project Numbers 5500-202222137A-1-1-ZN.

Data Availability Statement

The original contributions presented in this study are included in the article. Further inquiries can be directed to the corresponding author.

Conflicts of Interest

Authors Li Zhang, Xueming Zhou, Zhiqiang Feng, Yu Shen and Yao Yao were employed by State Grid Hubei Electric Power Research Institute. The remaining author declares that the research was conducted in the absence of any commercial or financial relationships that could be construed as a potential conflict of interest.

References

  1. Dong, B.; Jiang, X.; Yin, F. Development and prospect of monitoring and prevention methods of icing disaster in China power grid. IET Gener. Transm. Distrib. 2022, 16, 4480–4493. [Google Scholar] [CrossRef]
  2. Farzaneh, M.; Chisholm, W.A. Insulators for Icing and Polluted Environments; John Wiley & Sons: Hoboken, NJ, USA, 2009. [Google Scholar]
  3. Huang, J.; Zhou, X. Study on transmission line icing prediction based on micro-topographic correction. AIP Adv. 2022, 12, 085103. [Google Scholar] [CrossRef]
  4. Couture, P. Smart Power Line and photonic de-icer concepts for transmission-line capacity and reliability improvement. Cold Reg. Sci. Technol. 2011, 65, 13–22. [Google Scholar] [CrossRef]
  5. Lu, J.; Wu, C.; Li, B.; Zhang, H.-X. Comparative research on topology of DC de-icing equipment. Power Syst. Prot. Control 2014, 42, 83–88. (In Chinese) [Google Scholar]
  6. Mao, X.; Tan, Y.; Zhu, Y.; Huang, Q.; Liu, H.; Xu, B. The Portable DC De-icer with Emergency Power Supply Function. In Proceedings of the 2019 3rd IEEE Conference on Energy Internet and Energy System Integration, Changsha, China, 8–10 November 2019; pp. 2364–2369. [Google Scholar]
  7. Fan, R.; Sun, M.; He, Z.; Yan, S. Design and system test of movable DC de-icer for Jiangxi power grid. Autom. Elect. Power Syst. 2009, 33, 67–71. (In Chinese) [Google Scholar]
  8. Yan, M.; Ai, X.; Shahidehpour, M.; Li, Z.; Wen, J.; Bahramira, S.; Paaso, A. Enhancing the Transmission Grid Resilience in Ice Storms by Optimal Coordination of Power System Schedule with Pre-Positioning and Routing of Mobile DC De-Icing Devices. IEEE Trans. Power Syst. 2019, 34, 2663–2674. [Google Scholar] [CrossRef]
  9. Zhou, X.; Yao, Y.; Li, Z.; Chen, L.; Chen, J. Multi-Physics Optimization Study of Permanent Magnet Synchronous Generator for Direct Current De-icing Based on Surrogate Model. In Proceedings of the 2023 10th International Forum on Electrical Engineering and Automation (IFEEA), Nanjing, China, 3–5 November 2023; pp. 783–787. [Google Scholar]
  10. Zhou, X.; Yao, Y.; Ma, X.; Feng, Z.; Yu, X. The Scheme of Movable DC Ice Melting Device Based on the Engine-Generator Topology. In Proceedings of the 2023 4th International Conference on Electrical, Electronic Information and Communication Engineering, EEICE, Dalian, China, 21–23 April 2023; Volume 2023, pp. 1–8. [Google Scholar]
  11. Xie, D.; Song, W.; Wang, W.; Sun, T.; Huang, T.; Cai, X. Research on ice removal blasting parameters of HV Transmission Lines. J. North Univ. China 2018, 39, 746–751. (In Chinese) [Google Scholar]
  12. Cao, Y.; Xue, K.; Miao, L.; Li, H.; Guan, X.; Zhang, J.; Li, G. Dynamic response analysis of ice tower line system after blasting deicing. J. North Univ. China Nat. Sci. Ed. 2019, 40, 198–205. (In Chinese) [Google Scholar]
  13. Zhao, J.; Guo, R.; Cao, L.; Zhang, F. Improvement of LineROVer: A mobile robot for de-icing of transmission lines. In Proceedings of the 2010 1st International Conference on Applied Robotics for the Power Industry, Montreal, QC, Canada, 5–7 October 2010; pp. 1–4. [Google Scholar]
  14. Zhang, Z.; Zhang, H.; Yue, S.; Zeng, W. A Review of Icing and Anti-Icing Technology for Transmission Lines. Energies 2023, 16, 601. [Google Scholar] [CrossRef]
  15. Jiang, X.; Wu, J.; Deng, Y.; Hu, J.; Ren, X. Research on Uneven Icing of Lines in Adjacent Towers Under Pass Micro-topography. Zhongguo Dianji Gongcheng Xuebao/Proc. Chin. Soc. Electr. Eng. 2023, 44, 2462–2474. (In Chinese) [Google Scholar]
  16. Lu, J.; Liu, C.; Chen, H.; Hu, B. Finite element calculation of 500 kV iced power transmission system. High Volt. Eng. 2007, 33, 167–169. (In Chinese) [Google Scholar]
  17. Zhang, Z.; Liu, J.; Shao, K.; Zhang, P. Analysis of wind-sand-load-induced dynamic response of transmission tower-line systems. Shock Vib. 2022, 2022, 4924091. [Google Scholar] [CrossRef]
  18. Zhang, D.; Hu, X.; Song, X.; Deng, H.; Ma, X. Investigation on aerodynamic characteristics for steel tubular cross-arms of transmission tower under skew wind. J. Wind Eng. Ind. Aerodyn. 2022, 222, 1–13. [Google Scholar] [CrossRef]
  19. Rao, N.P.; Kalyanaraman, V. Nonlinear behaviour of lattice panel of angle towers. J. Constr. Steel Res. 2001, 57, 1337–1357. [Google Scholar]
  20. Yao, C.; Mao, F.; Xu, D.; Liu, X.; Zhou, Z.; Cui, Y. Mechanical properties of transmission tower-line system in non-uniformly iced condition. High Volt. Eng. 2011, 37, 3084–3092. (In Chinese) [Google Scholar]
  21. Dong, B.; Jiang, X.; Xiang, Z. Calculation model and experimental verification of equivalent ice thickness on overhead lines with tangent tower considering ice and wind loads. Cold Reg. Sci. Technol. 2022, 200, 103588. [Google Scholar] [CrossRef]
  22. Zhang, L.; Ruan, J.; Du, Z.; Zhou, W.; Li, G.; Gan, Y. Short-term failure warning for transmission tower under land subsidence condition. IEEE Access 2020, 8, 10455–10465. [Google Scholar] [CrossRef]
  23. Ghaderpour, E. Constructions for orthogonal designs using signed group orthogonal designs. Discret. Math. 2018, 341, 277–285. [Google Scholar] [CrossRef]
  24. GB 50545-2010; Code for Design of 110 kV~750 kV Overhead Transmission Line. PRC National Standard: Beijing, China, 2010.
  25. Han, F. Study on Reliability Analysis of UHV Transmission Tower-Line System with Wind Action. Ph.D. Thesis, Chongqing University, Chongqing, China, 2012. (In Chinese). [Google Scholar]
  26. Zhang, L.; Ruan, J.; Du, Z.; Huang, D.; Deng, Y. Transmission line tower failure warning based on FBG strain monitoring and prediction model. Electr. Power Syst. Res. 2023, 214, 108827. [Google Scholar] [CrossRef]
Figure 1. Simulation model of the tower-line system. (a) Tower-line system; (b) Enlarged view of Tower 398.
Processes 13 01782 g001
Figure 2. Diagram of tower-line system numbering.
Processes 13 01782 g002
Figure 3. Node displacement nephogram of the transmission tower. (a) Tower 398; (b) Tower 399.
Processes 13 01782 g003
Figure 4. Element stress nephogram of the transmission tower. (a) Tower 398; (b) Tower 399.
Processes 13 01782 g004
Figure 5. The critical failure curves of the tower-line system.
Processes 13 01782 g005
Table 1. Comparison table of the proposed work with the existing work.
AspectExisting WorkInadequacyReferencesProposed Work
Local Line De-icing
Technologies
Effectively removes the ice, overcomes the problems of inconvenient transportation in mountainous areas and difficulty in obtain-ing power supply.Lack of ice-melting strategy.[4,5,6,7,8,9,10,11,12,13,14]Research on the de-icing strategy for local line de-icing.
Mechanical AnalysisThe mechanical characteristics of the tower under various loads based on beam element finite element models have been studied.Lack of research on the impact of local ice melting on the unbalanced tension of the tower.[15,16,17,18,19,20,21,22]Analyzed based on FEM and orthogonal design.
Optimization StrategyHeuristic or single-factor approaches.Lack of criteria for transmission tower failure, and the considerations are also very limited.[17,18,19,22]Considers both the tower displacement and the element stress.
Computational EfficiencyFinite element calculations can analyze the impact of ice melting on the mechanical properties of the tower.The number of ice-melting combinations for the wires is large, resulting in low cal-culation efficiency.[20,21]Orthogonal tests to re-duce the calculation time.
Table 2. Related parameters of the towers and spans.
No.TypeNominal Height/mTotal Height/mAltitude/mSpan/m
397Tension towerJT6146.564.5249
398Tangent towerZ306016069.889
399Tangent towerZ306017281.8320
400Tension towerJT614866/
Table 3. Orthogonal trial plan.
Test
No.
Ice Combination
C1C2C3C4C5C6G1G2G3G4G5G6
1111111111111
2111111100000
3111000011110
4111000000001
5100110011001
6100110000110
7100001111000
8100001100111
9010101010101
10010101001010
11010010110100
12010010101011
13001100110011
14001100101100
15001011010010
16001011001101
Table 4. Most severe combination under different weather conditions.
Wind SpeedIce
Thickness
Most Severe CombinationWind SpeedIce
Thickness
Most Severe Combination
Index 1Index 2Index 1Index 2
22 m/s20 mm11011101001110101010101026 m/s40 mm101011001011101010101010
22 m/s30 mm11011100011110101011101026 m/s50 mm100011011011101010101010
22 m/s40 mm11001100011110101011101030 m/s20 mm100011011011101010111010
26 m/s20 mm11001100011110001011101030 m/s30 mm100011010011101010111010
26 m/s30 mm10101100101110101010111030 m/s40 mm101011001011101010101110
Table 5. Frequency of confidence coefficient greater than 90% of each factors.
FactorFrequency of OccurrenceFactorMost Severe Combination
Index 1Index 2Index 1Index 2
1610700
2410800
305905
43101000
5101011910
67101289
Table 6. Grading failure criteria of tower-line system.
CategoryMinor DamageModerate DamageSerious Damage
Stress ratio of main beamξ > 1.0ξ > 1.15——
Stress ratio of diagonal beam0.8 < ξ < 1.01.0 < ξ < 1.15ξ > 1.15
Horizontal displacement of the tower top——3h/1000 < l < h/100l > h/100
Convergence of program————Program cannot
converge
Disclaimer/Publisher’s Note: The statements, opinions and data contained in all publications are solely those of the individual author(s) and contributor(s) and not of MDPI and/or the editor(s). MDPI and/or the editor(s) disclaim responsibility for any injury to people or property resulting from any ideas, methods, instructions or products referred to in the content.

