Abstract
The Tankou area is a vital production capacity replacement area in the Jianghan oilfield. The recovery of the amount of erosion in Qianjiang Formation and Jinghezhen Formation is significant for studying this area’s tectonic evolution and geothermal history. The target layer, characterised by well-developed plastic materials, intense tectonic deformation, and insufficient well data, fails to meet the applicability criteria of the conventional denudation estimation methods. This study proposes a novel approach based on the structural strain characteristics. The method estimates the stratigraphic denudation by analysing residual formation features and fault characteristics. First, a stress analysis is performed using the fault characteristics, and the change law for the thickness of the target layer is summarised based on the characteristics of the residual strata to recover the amount of erosion in the profile. Second, a grid of the stratigraphic lines in the profiles of the main line and the tie line is used to complete the recovery of the amount of erosion in the plane through interpolation, and the results of the profile recovery are corrected again. Finally, the evolution results of the geological equilibrium method and the stress–strain analysis are compared to analyse the reasonableness of their differences and verify the accuracy of the erosion recovery results. The area of erosion in each layer increases from bottom to top. The amount of denudation in each layer gradually increases from the denudation area near the southern slope to the surrounding area. It converges to 0 at the boundary of the denudation area. The maximum amount of erosion is distributed in the erosion area close to the side of the residual layer with a low dip angle. The specific denudation results are as follows: Qian1 Member + Jinghezhen Formation has a denudation area of 6.3 km2 with a maximum denudation thickness of 551 m; Qian2 Member has a denudation area of 2.6 km2 with a maximum denudation thickness of 164 m; Qian3 Member has a denudation area of 2.3 km2 with a maximum denudation thickness of 215 m; Upper Qian4 Submember has a denudation area of 1.54 km2 with a maximum denudation thickness of 191 m; and Lower Qian4 Submember has a denudation area of 1.2 km2 with a maximum denudation thickness of 286 m. This method overcomes the conventional denudation restoration approaches’ reliance on well logging and geochemical parameters. Using only seismic interpretation results, it achieves relatively accurate denudation restoration in the study area, thereby providing reliable data for timely analyses of the tectonic evolution, sedimentary facies, and hydrocarbon distribution patterns. In particular, the fault displacement characteristics can be employed to promptly examine how reasonable the results on the amount of denudation between faults are during the denudation restoration process.
1. Introduction
The Tankou area is located on the frontal margin of the downthrown block of the Qianbei fault—the largest sediment-controlling fault in the Jianghan basin. Influenced by sediment sources from the northern Han River and Jingmen, it has primarily developed alluvial fans, (fan) deltas, and beach-bar systems, with its well-developed reservoirs exhibiting relatively good physical properties. Adjacent to the hydrocarbon-generating sags of Banghu and Wangchang, this area is rich in oil and gas resources. Controlled by the denudation surface of the Jingsha Formation on the downthrown block of the Qianbei fault, as well as lithological and structural factors, it possesses favourable conditions for the formation of multi-target zones and diverse types of hydrocarbon accumulation. The study area includes two developed oilfields—Tankou and Daihe—with rich oil-bearing intervals, spanning from the Upper Neogene Guanghuasi Formation to Lower Qian4 Member. A third resource assessment to be undertaken indicates significant remaining exploration potential in this region. Recent drilling results from key appraisal wells suggest substantial untapped potential, particularly in the Qian3 Member and the eastern sector of the Tan-71 well area [1,2,3].
There is no literature including specific research and a systematic demonstration of the three-dimensional erosion recovery of the Qianjiang Formation and Jinghezhen Formation in the Tankou area. However, understanding the three-dimensional erosion recovery is crucial for deepening the basic research in the Tankou area. An integrated understanding of this research area requires three-dimensional erosion values, whether through the analysis of the evolution of the sedimentary structure or the thermal evolution or a study of the oil and gas migration and the reservoir formation rules [4,5]. Many previous studies have covered the erosion recovery in the Tangkou area. Still, most of them have sufficed with providing a single profile, and the recovery methods and erosion values have not been explained in detail [3,4,5]. Under the current conditions with the available data, recovering 3D erosion is an urgent task which will strengthen the basic research in the Tangkou area of the oilfield [6].
The fundamental principle of denudation restoration is to estimate the paleo-thickness of eroded strata based on the distribution patterns of specific parameter(s) within preserved formations. To address the needs of sedimentological, tectonic, thermal evolution, and hydrocarbon resource evaluation studies, various techniques have been developed for different data availability scenarios and geological contexts. These methods can be classified into three categories: (1) Vertical parameter–depth relationship methods: the rock porosity method, the shale acoustic transit time (ΔlogR) technique, vitrinite reflectance (Ro) analyses, the illite crystallinity index, and fluid inclusion thermometry. (2) Lateral parameter–distribution trend methods: thickness trend analyses, the sedimentation–denudation rate ratio method, and sedimentary wave process analyses. (3) Temporal–volumetric parameter variation methods: the natural gas equilibrium concentration technique and the cosmogenic nuclide dating method.
The technical challenges in 3D denudation restoration of the Qianjiang Formation and Jinghezhen Formation in the Tangkou area primarily concern three aspects: (1) There is a lack of sound data in the eroded area, which limits the use of logging methods such as the sonic time difference [7,8,9] and the rock porosity method [10]. (2) The section under study is rich in plastic substances, the thickness distribution of the residual formation is not consistent, and the vigorous tectonic activity does not meet the conditions for applying the stratigraphic thickness trend method or the sedimentation rate ratio method [11,12]. 3. There is a lack of chemical measurement data [13], which makes it impossible to use methods such as vitrinite reflectance natural gas concentration. Therefore, using the characteristics of residual layers and faults to determine the thickness distribution of eroded layers has become the core of this study [14,15].
This study develops a method to recover the amount of denudation based on construction strain [16]. Specifically, fault characteristics are utilised to analyse the paleostress field [17]. Integrated with stratigraphic lithology and residual thickness data, strain distribution patterns are established to reconstruct denuded stratigraphic thickness trends along geological profiles. Then, the closure of the profile stratigraphic boundary along the central and tie lines is implemented, the results of profile erosion recovery are calibrated [18,19], and the planar distribution map of erosion of each layer is constructed using the interpolation method in Petrel 2021version software [20]. Finally, balanced cross-section modelling in MOVE 2018version software is employed to invert syn-sedimentary tectonic activities using denudation reconstruction data. The characteristics of tectonic activities reflected by the inversion results were compared with those indicated by the residual strata and faults to evaluate the degree of consistency or the reasonableness of discrepancies, thereby verifying the accuracy of the denudation recovery results [21]. This study provides reference significance for denudation recovery under similar conditions and offers data support for subsequent research on tectonic evolution and sedimentary characteristics in this area.
2. Geological Background
The Tankou structural zone (55 km2) occupies the central-eastern segment of the Qianbei fault zone within the Qianjiang Depression, Jianghan Basin (Figure 1a). It has the structural characteristics of “one slope, two convexities and three depressions”. From west to east, the Tankou Uplift is flanked by the Benghu Depression, Wangchang Uplift, Wangchang Depression, Huangyang Slope belt, and Sanhechang Depression. Planar geometry reveals the Tankou Uplift as an eroded, dome-capped short-axis syncline (Figure 1b) [22], representing our primary study target. This study focuses on the Cenozoic era, with the Quaternary Pingyuan Group, Neogene Guanghuasi Group, Paleogene Jinghezhen Formation, Qianjiang Formation, Jingsha Formation, Xingouzui Formation, and Shashi Formation in order from top to bottom. Among them, Qianjiang Formation and Jinghezhen Formation are the target strata for this study, which are divided into five sets of strata: Jinghezhen Formation + Qian1 Member, Qian2 Member, Qian3 Member, Upper Qian4 Member, and Lower Qian4 Member. Sandstone, gypsum, saltstone, and dark mudstone are abundant in each layer (Figure 1c) [23].
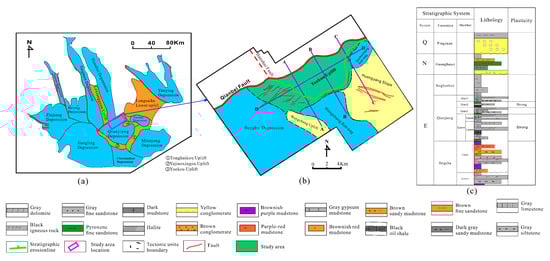
Figure 1.
Structural background and formation of the Tankou area. (a) Structural location map of Qianbei Depression, Jianghan Basin; (b) structural location map of Tankou Uplift, Qianbei Depression; (c) lithologic histogram of Tankou area.
On the seismic profile, the target layer is distributed on the hanging wall of the Qianbei fault. The bottom of the Guanghuasi Formation is adjacent to an unconformity (erosion line), with an angular unconformity contact with the Jinghezhen Formation, Qian2 Member, Qian3 Member, Upper Qian4 Member and Lower Qian4 Member. Within the target layer, multiple normal and syn-sedimentary faults cut the layers at different levels and have different geometric and kinematic characteristics. The eastern limb of the Tankou Uplift is characterised by steeply inclined, thinly laminated tectonic features that undergo abrupt westward transition into a stable domain of gently dipping, thickly bedded strata, displaying markedly greater formation thickness compared to the western limb (Figure 2, Figure 3, Figure 4 and Figure 5).
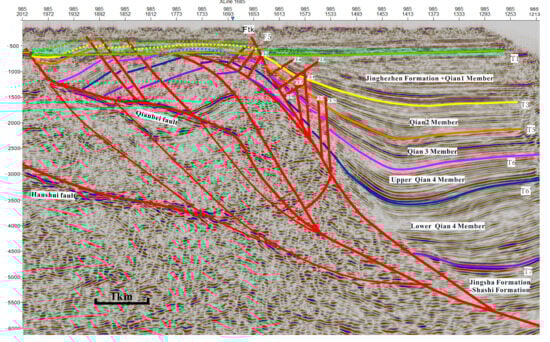
Figure 2.
Restoration results of denuded strata in profile AA′.
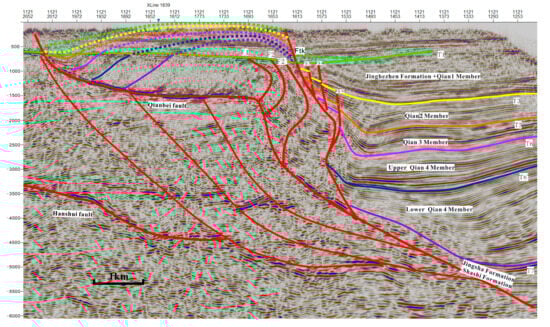
Figure 3.
Restoration results of denuded strata in profile BB′.
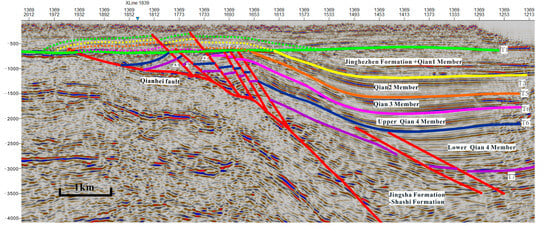
Figure 4.
Restoration results of denuded strata in profile CC′.
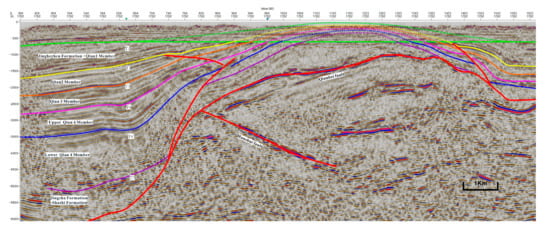
Figure 5.
Restoration results of denuded strata in profile DD′.
3. Materials and Methods
3.1. Principles of Stratigraphic Denudation Restoration
3.1.1. Control Patterns of Structural Deformation Types on Sedimentary Thickness of Overlying Strata
The relationship between sedimentary thickness and basement relief morphology can be classified into three types: (1) basement uplift, where sedimentary thickness at the highest point of the basement is less than that on the surrounding slopes, with steeper slopes exhibiting greater thickness variation rates than gentler slopes; (2) basement depression, where sedimentary thickness at the lowest point of the basement is greater than that on the surrounding slopes, with steeper slopes exhibiting greater thickness variation rates than gentler slopes; (3) horizontal basement plane, where uniform-thickness strata are deposited above the basement.
The relationship between sedimentary thickness and fault types can be classified into three types: (1) uniform-displacement faults, (2) growth normal faults, and (3) composite faults exhibiting both uniform-displacement and growth characteristics. For uniform-displacement normal faults, faulting occurs after strata deposition, with both the hanging wall and footwall maintaining original sedimentary thickness trends. For growth normal faults, faulting occurs synchronously with deposition, resulting in greater thickness in the hanging wall than in the footwall. For composite faults combining uniform-displacement and growth characteristics, the fault is divided into two segments based on displacement features, with thickness controlled by uniform-displacement behaviour in one segment and growth fault behaviour in the other.
3.1.2. Identification of Structural Deformation Characteristics and Locations in Denuded Areas
The study area predominantly develops two major types of structural deformation: growth anticlines and normal faults. The restoration of denuded strata requires that two key problems be addressed: The first problem is determining where the crest of the basement anticline was located during strata deposition. The second problem is defining the temporal range of fault activity superimposed on the growth anticline. (1) Determination of the basement’s highest location requires comprehensive consideration of multiple factors: residual stratigraphic intervals, thinning trends of adjacent strata, fault assemblage comparisons, and pre-existing fault geometries in the basement. When the preserved portion of the target layer or adjacent strata above and below exhibit thickness reduction, it indicates that during the depositional period, the anticlinal crest of this area was located in the direction of thinning. Compared to planar and listric geometries, curved fault morphologies within the sedimentary basement suggest the anticlinal crest is located above the outer side of the fault’s “convex bend”. For two contemporaneously active sets of parallel normal faults, the anticlinal crest occurs above the opposing fault step. (2) Fault activity duration must also be determined. The temporal range of fault activity is determined through two approaches: one based on displacement distribution characteristics, and the other by referencing kinematic features of correlative faults in adjacent cross-sections.
3.1.3. Procedures for Denuded Strata Restoration
First, preliminarily determine the potential range of existing basement highs based on strata thinning directions, then integrate fault characteristics within this range to precisely locate anticlinal crests. Next, analyse fault features and activity duration in denuded areas, following the principle of “restoring simple sections before complex ones”, and initiate denuded strata restoration according to corresponding thickness distribution patterns. Finally, verify the accuracy of restored denuded sections by examining their consistency with displacement development patterns of bounding faults on both sides. On this basis, maintaining smoothness of restored strata and ensuring closure of stratigraphic lines in both crossline and inline seismic sections can further improve restoration accuracy. On seismic profiles, denudation boundaries are identified at positions where residual stratigraphic boundaries intersect with truncation surfaces. Finally, the denudation amount distribution map is obtained by subtracting structural contour maps of upper and lower strata.
3.2. Process of Stratigraphic Denudation Restoration
When the temperature and pressure reach a specific value, the plastic layer will show the phenomenon of tensile thinning or agglomerative thickening under tectonic stress. According to the type of tectonic stress on the target layer at a certain period, the strain characteristics of plastic rock layer thinning or thickening can be determined [24]. Combined with the law of change in the thickness of the residual layers on both sides of the denudation zone, the trend of thickness distribution of layers in the study area can be determined.
Based on this idea, tectonic strain analysis was carried out on the seismic profiles of 60 mainline profiles and 28 tie line profiles in the Tangkou area, the thickness distribution trend of the strata was summarised, and the denuded strata were restored. The stratigraphic lines of the two types of profiles were closed throughout the area, and a planar distribution map of the denudation of each layer was drawn. Due to space limitations, this article provides a detailed explanation of four representative profiles, including the main lines AA′, BB′, CC′, and the tie line DD′ (Figure 1b).
3.2.1. Main Line Profile AA′
- (1)
- Structural Strain Analysis
The seismic profile (Figure 2) shows three sets of normal faults distributed on the hanging well of the Qianbei fault. (i) The SE-trending normal fault (F4 series fault) near the Qianbei fault stops at the erosion line on the top and converges with the Qianbei fault on the bottom. The small and nearly equal fault distance indicates that the strata cut by the fault were stable during deposition. Before erosion occurred, the series of strata were in a state of tensile stress. (ii) NW-dipping normal faults (F3 series) proximal to the Ftk Fault terminate at the unconformity surface, with some terminating within the Qian2 Member. It converges downward to the Ftk fault with a small and almost equal fault distance, indicating that the deposition of Lower Qian4 Member Jinghezhen Formation was stable. At the end of the deposition of the Jinghezhen Formation, the Formation entered a state of tensile stress [25]. (iii) Between these two fault sets, SE-dipping normal faults (F1, F2) occur, including both steeply dipping and low-angle varieties. The fault distance decreases from the Jingsha Formation to the lower part of the Qian4 Formation. It converges in the upper part of the Qian4 Formation, indicating that the activity of this type of fault stopped in the late stage of the deposition of the upper part of the Qian4 Formation. At the same time, the thickness of the hanging well layers immediately adjacent to the fault is smaller than that of the footwell layers, indicating that the layers were subjected to uplift and tensile thinning in the later stage [26]. These observations indicate that F1 and F2 were active during deposition of both Lower and Upper Qian4 Members. The Qian3 Member was deposited in the Jinghezhen Formation, and the deposition was stable. At the end of the deposition of the Jingsha Formation, the Qianjiang Formation–Jinghezhen Formation, which is located between two sets of normal faults with NW and SE orientations, was subjected to forces, forming the highest point of the uplift. The strata on both sides entered a state of tensile stress and underwent tectonic stress of tensile thinning, creating a trend of rock layer thickness distribution that gradually thins from both sides to the highest point.
- (2)
- Restoration of Denuded Strata
The T1 unconformity represents a key stratigraphic boundary. This study aims to reconstruct the stratigraphic configuration at the transition from tectonic uplift to denudation. The restoration methodology involves the following three key steps: (i) Adjust the hanging wall strata along the Ftk fault to align and level the hanging wall and footwall denudation surfaces. (ii) Regional stratigraphic correlation indicates that the denuded succession comprises the Qian3, Qian2 Members, and Jinghezhen Formation. Notably, the upper boundaries of the preserved Qian2 and Qian3 Members show near-conformable relationships, suggesting that during Qian2 Member deposition, arid conditions caused lake-level drop, exposing the Qian3 Member as a paleo-high; alternatively, they may have caused differential thinning of the ductile Qian2 Member during later extension. Preceding Upper-to-Lower Qian4 Member deposition, only SE-trending growth faults F1 and F2 developed in the study area, with strata thinning toward the Qianbei fault, indicating pre-Qian3 Member basement uplift. (iii) Eroded strata reconstruction can be performed based on thickness variations in Upper Qian4–Jinghezhen Formation strata across the F3-F4 fault system, which thin toward the central area between faults. Following structural balancing along 20 tie lines, the denudation reconstruction along the AA′ profile was completed (Figure 2).
3.2.2. Main Line BB′ Profile
- (1)
- Structural Strain Analysis
The seismic profile (Figure 3) reveals two distinct fault types within the residual strata. (i) The F3 normal fault system, developed along the Ftk fault’s right flank, exhibits consistent displacement magnitudes, with lower tips terminating at the Ftk fault while upper tips in thinner Qian2 Member sections terminate within the Jinghezhen–Qing1 interval, and those in thicker sections extend into the Qingshan 2 Member. This behaviour reflects the Qingshan 2 Member’s composition as a ductile, salt mud-rich unit that exerts stratabound deformation resistance proportional to its thickness [27,28]. Integrated analysis of adjacent section fault patterns constrains this system’s timing to the Jinghezhen Formation’s depositional termination. (ii) The F1-F2′ fault system between the Qianbei and Ftk faults displays NW-concave crescent morphology, with lower tips merging at the Qianbei fault and upper tips at the unconformity. This geometry, modified by subsequent NW-directed material flow [29], indicates that the structural high occurs at the NW-oriented fault tips. Thickness variations show near-uniform strata near the Qianbei fault versus abrupt thinning near the Ftk fault, suggesting the Tan Kou uplift’s gentle western limb (slow thinning rate) contrasts sharply with its steep eastern limb (rapid thinning rate).
- (2)
- Restoration of Denuded Layers
The T1 unconformity constrains the denudation timing to the Jinghezhen Formation depositional termination. The restoration procedure involves the following steps: (i) Vertically adjust the Ftk fault’s hanging wall to align its denudation surface with the footwall, creating a continuous horizontal datum. (ii) Regional stratigraphic correlation (Figure 1b) reveals the denuded succession includes (from base to top): sedimentary basement, Lower Qian4 Member, Upper Qian4 Member, Qian3 Member, Qian2 Member, and Qian1 Member–Jinghezhen Formation, with partial erosion of Lower Qian4–Qian3 Members and complete removal of overlying units in the Ftk fault footwall. (iii) Eroded strata reconstruction: Guided by strain analysis results, restoration proceeded stratigraphically upward from preserved Lower Qian4–Qian3 Member remnants. Only basement-penetrating segments of F1-F2′ faults (Jingsha–Shashi formations) are preserved, precluding fault displacement measurements in the completely eroded Qianjiang–Jinghezhen interval. Consequently, fault displacement was excluded during restoration, treating these zones as continuous strata. Following structural balancing along 20 tie lines, the final restored stratigraphic profile was obtained (Figure 3).
3.2.3. Main Line CC′ Profile
- (1)
- Structural Strain Analysis
The seismic profile (Figure 4) reveals three distinct sets of normal faults within the preserved stratigraphic succession: (i) Syn-depositional faults occurring in the mid-upper section of the Qianbei fault, penetrating the Lower-to-Upper Qian4 Members and terminating at the unconformity surface. Fault displacement decreases upward, becoming negligible at the Upper Qian4 Member boundary, indicating cessation during Qian3 Member deposition. (ii) Post-depositional normal faults, comprising two subsets: Step-like faults within thin, ductile intervals of Lower Qian4 Member, recording syn-sedimentary extension and faults along the central Qianbei fault zone, displaying uniform displacement between the main fault and unconformity, suggesting post-uplift formation. (iii) Curvature-controlled faults developing in zones where significant thickness gradients and high stratigraphic curvature coexist. These faults demarcate transitional zones between rapidly thinned and relatively stable stratigraphic domains.
- (2)
- Restoration of Denuded Strata
Stratigraphic denudation in this section occurred at the Jinghezhen Formation depositional termination, resulting in the complete erosion of Upper Qian4 Member, Qian2 Member, and Qian1 Member–Jinghezhen Formation intervals. The restoration procedure adopted a systematic approach progressing from basal to upper units and from right to left. For Lower Qian4 Member restoration, the entire downslope section beyond the F4-2 fault was eroded and reconstructed based on overlying strata thickness, F4-2 fault displacement, and strain analysis results. The Qian3 Member was similarly restored using preserved sections and Upper Qian4 Member relationships, constrained by strain analysis data.
This restoration methodology revealed consistent denudation patterns characterised by (i) uniform thickness distribution in the F4-1 fault footwall, (ii) an anticlinal flexure with thickness reduction between F4-1 and F4-3 faults, and (iii) progressive thickening of hanging wall strata toward the Qianbei fault. Final stratigraphic reconstruction (Figure 4) was achieved through structural balancing along 20 tie lines.
3.2.4. Tie Line DD′ Profile
- (1)
- Structural Strain Analysis
The seismic profile (Figure 5) reveals two syn-depositional faults flanking the Qianbei fault’s uplifted segment: the western fault’s basal termination intersects the Qianbei fault, terminating within Upper Qian4 Member, whereas the eastern fault intersects basally in a similar manner but extends into the Qian2 Member. Displacement variations are prominent between the Lower and Upper Qian4 Members but negligible between the Qian3 and Qian2 Members, indicating predominant fault activity during Qian4 Member deposition.
Strata overlying the western flank exhibit shallower dip angles than the eastern flank, containing a synclinal depression with progressively decreasing dip angles from Lower Qian4 to Qian2 Member. These observations suggest that Qian2 Member deposition coincided with SW-NE directed compressional stresses, resulting in fault-parallel slip and uplift [30,31], with maximum uplift occurring near the fault’s dip-transition zone.
During uplift, stress concentration at the uplift apex formed a low-angle normal fault on the western flank. The high-uplift zone exhibits a sub-Qianjiang Formation pressure deficit, driving ductile basement material to intrude along the fault plane and accumulate above the uplift [32,33,34]. Consequently, basement material shows greater thickness at the uplift centre compared to flanking areas.
Denudation patterns demonstrate fault-controlled uplift, with (i) maximum uplift near the fault’s inflexion point and (ii) stratigraphic thickening toward the uplift axis. These characteristics reflect syn-sedimentary tectonic control on basin evolution.
- (2)
- Restoration of Denuded Layers
Integrating the denudation line’s intersection with the target layer upper boundary and strain analysis results, the denuded area exhibits an uplifted morphology, where maximum uplift coincides with the dip-direction transition of the Qianbei fault, enabling complete stratigraphic restoration (Figure 5).
4. Results
Based on cross-sectional research, the study of the amount of strata erosion in the Tankouarea was extended to the plane (surface). The entire area was restored on the 3D seismic data volume using a 16 × 16 survey line grid, with 60 main lines and 20 tie lines completed for denudation recovery. All stratigraphic horizons from both types of survey line profiles achieved complete intersection closure. On this basis, we verified the denudation recovery results using an 8 × 8 survey line grid, achieving an average accuracy rate of 95%. Meanwhile, according to the lithostratigraphy under high temperature–pressure conditions, local plastic creep may occur, resulting in local thickness inconsistencies, which causes local stratigraphic thickness to not follow the same thickness variation rate, leading to certain deviations. Meanwhile, in some areas with intense tectonic activity, the seismic events appear severely fragmented, making accurate identification of both strata and faults difficult, which introduces deviations to the local stratigraphic restoration using this method. According to the verification results from the 8 × 8 seismic survey grid, the denudation recovery errors caused by uncertainty factors are generally controlled within 10% across all sections of the study area.
The denudation area in the Tankou area is mainly the top of the Tankou uplift. The denudation results show that the Qian1 Member + Jinghezhen Formation has a denudation area of 6.3 square kilometres and a maximum denudation thickness of 551 m (Figure 6a); the Qian2 Member has a denudation area of 2.6 square kilometres and a maximum denudation thickness of 164 m (Figure 6b); the Qian3 Member, with an area of 2.3 square kilometres and a maximum denudation thickness of 215 m (Figure 6c); for Upper Qian4 Member, the denudation area is 1.54 square kilometres and the maximum denudation thickness is 191 m (Figure 6d); for Lower Qian4 Member, the denudation area is 1.2 square kilometres and the maximum denudation thickness is 286 m (Figure 6e).
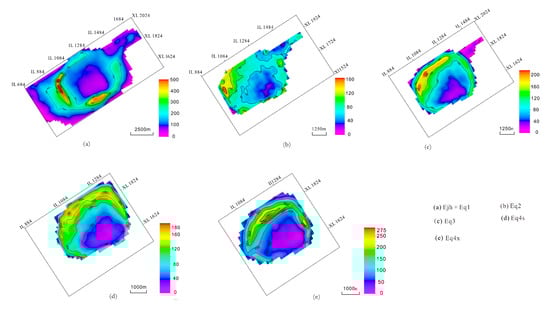
Figure 6.
Plane distribution map of denudation amount. (a) Plane distribution map of denudation amount of Jinghezhen Formation + Qian1 Member; (b) plane distribution map of denudation amount of Qian2 Member; (c) plane distribution map of denudation amount of Qian3 Member; (d) plane distribution map of denudation amount of Upper Qian4 Member; (e) plane distribution map of denudation amount of Lower Qian4 Member.
The planimetric distribution of the stripping volume shows that the high part of the Tankou uplift is located in the stripping area near the south slope. Taking the high part of Tankou uplift as the centre, the stripping volume gradually increases in all directions and converges to 0 at the boundary of the stripping area. The maximum stripping of Lower Qian4 Member, Upper Qian4 Member, Qian3 Member and Qian2 Member is in the north slope area of Tankou Uplift, which is consistent with the slight inclination angle of the strata in this area and the low thinning rate of the thickness. The denudation of the Qian1 Member + Jinghezhen Formation is uniformly distributed from the high point of the uplift to the surrounding area, with an increase occurring locally on the west and south slopes. In this area, the boundary between Qian2 Member and Qian3 Member is close to the boundary, which indicates that the stratum here suffers from extrusion, and it is the conversion zone from high stratum dip to ground dip, so the thickness of the stratum there is greater than that of the stratum in the stripping area.
5. Discussion
The key to judging whether the erosion recovery is accurate is whether the regional tectonic evolution history derived from the erosion recovery data is consistent with the characteristics of stratigraphic lithology and regional tectonic stress evolution [35,36,37].
5.1. Fundamental Principles of Balanced Cross-Section Analysis
The balanced cross-section method assumes that the deformation of strata on the cross-section conforms to the plane strain condition, and the structural restoration of the cross-section is carried out according to the geometric balance principle of constant area.
During structural inversion, it is essential to remove the effects of tectonic deformation (folding and faulting) on stratigraphic layers. The oblique shear method is currently the most widely used technique for fault and fold restoration.
5.1.1. Fault Restoration Using Oblique Shear
This method applies to directional slip models where the hanging wall moves at an angle to the fault plane (Figure 7a). The restoration process involves the following steps: (1) Slip vector definition: The hanging wall displacement direction and magnitude are specified. The hanging wall is moved backward along the slip vector to remove fault offset. (2) Gap formation and collapse: A gap forms between the fault plane and the hanging wall due to reverse displacement. The hanging wall collapses toward the fault plane under shear vector control, with point-to-point correspondence along the fault surface. (3) Fold propagation: Since the shear vector length remains constant, deformation near the fault plane propagates into the hanging wall strata as folded structures, completing fault restoration.
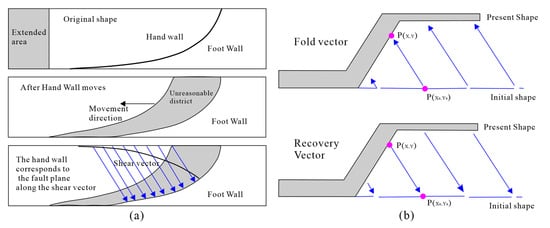
Figure 7.
Sketch map showing the principle of de-fault and de-fold by using inclined shear. (a) De-fault; (b) de-fold.
5.1.2. Fold Restoration Using Oblique Shear
For fold restoration, the shear vector is oriented parallel or subparallel to the fold axial plane. The restoration vector is determined by (1) Axial plane observation: Direct measurement of fold axial plane orientation from structural data, constrained by balanced cross-section principles (area/length conservation). (2) Layer-by-layer retrodeformation: The restoration vector is applied downward sequentially. Its magnitude equals the original folding displacement, but in the opposite direction, accurately reconstructing the pre-fold geometry (Figure 7b) [38].
5.2. Ideas for Verifying the Accuracy of Results
Tectonic deformation in geological sections reflects the evolution of tectonic stress [39,40]. Fault and stratigraphic characteristics are essential elements that show tectonic deformation and are also essential carriers that reflect the evolution of tectonic stress [41]. In the same area, the stress evolution characteristics the two independently or jointly reflect should be the same.
Within saline mud layers, tectonic activity elevates both temperature and pressure, thereby enhancing material fluidity. In regions of pronounced tectonic deformation, layer materials undergo stress-induced outward flow, resulting in measurable thickness variations (thinning or thickening) [42]. Successive tectonic stresses from distinct periods superimpose their geometric and kinematic signatures onto fault characteristic, without inducing slip along pre-existing fault planes. Consequently, two-dimensional profiles preserve more comprehensive and authentic records of tectonic stress evolution, providing reliable indicators of regional tectonic history. Employing geological equilibrium principles, post-deformation profile data were processed through MOVE software for tectonic inversion modelling [43]. Comparative analysis reveals measurable discrepancies between modelled and observed tectonic geometries, attributable to deformation-induced areal changes in layer profiles.
Analyse this deviation. If the deviation is consistent with the MOVE software calculation principles and geological theory, it indicates that the deviation is reasonable and the denudation recovery result is credible. If the deviation does not agree with the MOVE software or geological principles, it indicates that the deviation is unreasonable and the denudation recovery result has a significant error. In this paper, the AA′ profile is used as an example. The geological form of the profile before the end of deposition of the Jinghehzhen Formation and the occurrence of uplift is the standard to compare the structural inversion results obtained based on fault characteristics and using stress–strain analysis. The structural inversion results were obtained based on the area of the stratigraphic section and using the geological equilibrium method to verify the credibility of the denudation recovery results.
5.3. Structural Inversion Results of the Two Methods
5.3.1. Results of Structural Inversion Based on Fault Characteristics
According to the structural strain analysis in Section 3.1.1, the main body shape of the Qianbei fault did not change much after the deposition of the upper Member of the Jingsha Formation and before the deposition of the Guanghuasi Formation. During the deposition of Lower Qian4 Member and Upper Qian4 Member, the strata were under tensile stress and in the same depositional state. The syn-deposition faults F1 and F2 developed, and the fault shapes were plate-like or spatulate [44,45]. The upper boundary of the strata is controlled by faults F1 and F2 and is stepped, with the terrain decreasing from west to east. The Qian3 Member–Jinghezhen Formation’s deposition was not affected by tectonic activity, and the deposition was stable. The upper boundary of the strata remained continuous and gentle, with the west side higher and the east side lower. From the bottom to the top, the softness of each layer gradually increases (Figure 8d).
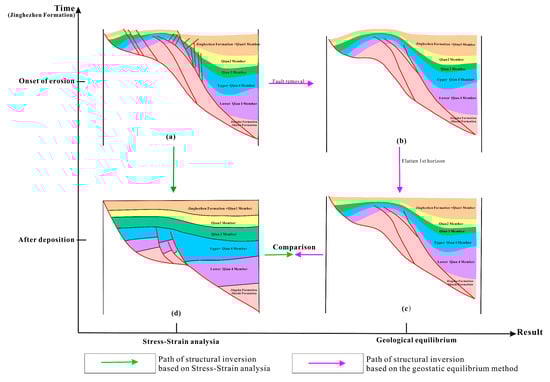
Figure 8.
Comparison map of tectonic inversion. (a) The structural form of the AA′ profile after the amount of erosion has been restored; (b) the structural morphology of the AA′ profile after removing fault; (c) the structural morphology of the AA′ profile after flattening the Jinghe Town Formation; (d) the structural morphology at the end of deposition in the Jinghe Formation based on structural stress–strain.
5.3.2. Results of Structural Inversion Based on Preservation of Stratigraphic Section Area
The profile data for the restoration of the eroded strata (Figure 8a) were imported into the MOVE software for structural inversion calculations. (1) Faults developed at the end of Jinghezhen Formation deposition were removed to obtain the geological shape of the section at the end of Jinghezhen Formation deposition, when the uplift of the strata ended, and the geological shape of the section at a time when the rock strata had not yet broken (Figure 8b). (2) Structural flattening was applied to the Qian1 Member and Jinghezhen Formation (Figure 7a) to reconstruct the original depositional geometry of the Jinghezhen Formation, representing the pre-uplift configuration (Figure 8c). The results show that in the denudation area (the high part of the Tankou uplift), the Qian2 Member is basically horizontal with slight undulations. The Qian3—Upper Qian4 Member is slightly flattened but still in an uplifted state. The two syn-depositional faults maintain a dip-flat shape, but the degree of dip-flatness has decreased. The corresponding Qianbei fault segment below the denudation area shows a concave change. This is a deviation from the structural inversion results presented in Section 5.3.1.
5.4. Analysis of the Reasonableness of the Deviation
(1) When the strata rise, the material flows out, and the section area decreases due to the stress and thinning of the Qian1 Member + Jinghezhen Formation. When calculating the levelling of the strata, compared with the relatively large area of the strata before the uplift, the ability to flatten the underlying strata and reduce the curvature of the fault line is weakened, but still exists. (2) The Qian2 Member is thin, and the uplift area is closest to that of Qian1 Member + Jinghezhen Formation. Therefore, after the flattening of the Qian1 Member + Jinghezhen Formation, the Qian2 Member is the most flattened, with a slight uplift range compared to the underlying strata [46]. (3) Because the Qianjiang Formation is rich in plastic materials, there was no material outflow of different degrees during the uplift of each layer. In the denudation area, the overall thinning of the overlying strata is more remarkable, as the stratigraphic position becomes deeper compared to before the uplift. During the flattening process, the greater the lack of braking force received, the more easily the shape of the uplift is maintained. (4) After the uplift of the strata, a low-pressure space is formed below the lower boundary of the Qianjiang Formation vertically corresponding to the high part of the uplift, causing the inflow of highly plastic basement materials and resulting in a positive increase in the basement profile [47]. Therefore, the corresponding section of the Qianbei fault appears to concave in the MOVE software calculation based on area preservation.
Assuming that the result of denudation recovery is greater than the actual denudation, after flattening the Qian1 Member + Jinghezhen Formation section, Lower Qian4 Member—Qian2 Member will appear horizontal or concave. In contrast, a sedimentary fault should appear as a plate or spatula shape or even a change in dip. However, this is inconsistent with the characteristics of saline layers and the current tectonic characteristics. When the amount of denudation is restored, the result is less than the actual amount of denudation [48,49,50]. After Qian1 Member + Jinghezhen Formation is flattened, the braking ability of the underlying strata is even weaker. The strata of the second subduction stage maintain a higher uplifted form, and the degree of uplift of the remaining strata increases from top to bottom. This is inconsistent because the second subduction stage has thin deposits, and the uplifted area is closest to the overlying strata [51]. This shows that the deviation is reasonable, and the result of this denudation recovery is credible.
6. Conclusions
- (1)
- At the end of the deposition of the Jinghezhen Formation, the combined effects of compressional forces and the upwelling of saline basement materials in the Tankou area jointly facilitated the formation of the Tankou uplift. This study clarifies the genetic mechanism of the high point of Tankou, providing critical references for subsequent research on hydrocarbon reservoir distribution and migration patterns in the deeper sections of the oilfield.
- (2)
- The tectonic strain-based denudation restoration method can perform stress–strain analysis in fault zones by integrating fault characteristics, residual strata, and lithological properties, thereby obtaining stratigraphic thickness variation patterns and tectonic morphological attributes of the target area. With only seismic data available, this method still achieves accurate denudation estimation and is applicable to both ductile and brittle formations. This approach significantly enhances feasibility for structural interpretation studies in both data-scarce new exploration areas and geologically complex mature fields, while avoiding the economic costs associated with extensive testing programmes.
- (3)
- We recommend comparing the structural inversion results obtained from MOVE software simulation with the denudation restoration data based on tectonic stress–strain analysis. Whether the deviations between them conform to the calculation principles of MOVE software, regional geological conditions, and geological theories can verify the credibility of the stratigraphic denudation restoration results. This study mainly restored the denudation amounts of five layers in the Lower Qian4 Member of the Tankou area. The minimum denudation of each layer is distributed on the steeper side of the residual strata, while the maximum denudation is located near the gentler part of the residual strata. During the depositional period, areas with greater denudation had larger depositional spaces and thicker sedimentary deposits compared to areas with less denudation. Therefore, residual strata in areas with greater denudation have higher potential for hydrocarbon accumulation, providing new insights for deeper exploration in the oilfield.
This method is primarily applicable to areas with clear seismic interpretation results, and thus is unsuitable for strata with poor seismic data quality or low resolution.
Author Contributions
Writing—original draft, methodology, software, validation, data curation, H.Y.; data curation, formal analysis, investigation, writing—review and editing, T.L. and J.C. All authors have read and agreed to the published version of the manuscript.
Funding
This research received no external funding.
Data Availability Statement
All data and materials are available on request from the corresponding author. The data are not publicly available due to ongoing research using a part of the data.
Conflicts of Interest
Author Junjie Chang was employed by Jianghan Oilfield Company, Sinopec Group (China Petroleum & Chemical Corporation Jianghan Oilfield Brance). The remaining authors declare that the research was conducted in the absence of any commercial or financial relationships that could be construed as a potential conflict of interest.
References
- Liu, Y.; Luo, J.; Li, M.; Guo, L.; Yu, J.; Zhang, L. Structural model and exploration potential in Tankou block of Qianjiang sag; Jianghan Basin. China Pet. Explor. 2017, 22, 84–89. [Google Scholar]
- Liu, A.; Tang, D.; Guo, L.; Wen, H.; Tang, W.; Zou, S. Segmental differential activity and evolution of Qianbei fault zone in Jianghan Basin. Oil Geophys. Prospect. 2022, 57, 937–949. [Google Scholar]
- Li, Q.; Li, Q.; Cao, H.; Wu, J.; Wang, F.; Wang, Y. The crack propagation behavior of CO2 fracturing fluid in unconventional low permeability reservoirs: Factor analysis and mechanism revelation. Processes 2025, 13, 159. [Google Scholar] [CrossRef]
- Li, Z.; Zhang, Y.; Yu, X.; Pei, J.; Ran, B. Denudation restoratiom of Lawer Cretaceous hormation eosion and is significance to hydrocarhon accumulation in the northern area of Naiman Depression, Kailu Basin. Chin. J. Geol. 2024, 59, 341–351. [Google Scholar] [CrossRef]
- Wang, J.; Li, Z.; Liu, K. Rehabilitation status of denuded land in the eastern Qaidam Basin: Geophysical and thermochronological evidences. Earth Sci. Front. 2022, 29, 371–384. [Google Scholar]
- Yan, H.; Wang, L.; Zheng, M.; He, D.; Xu, W.; Wang, Z.; Zhang, Y.; Jing, X. Paleogeomorphology Restoration and Its Significance in Controlling Reservoirs: A Case Study of the Fourth Member of Sinian Dengying Formation in the Moxi Area, Sichuan Basin, SW China. Carbonates Evaporites 2024, 39, 116. [Google Scholar] [CrossRef]
- Zhao, Q.; Zhu, H.; Zhang, X.; Liu, Q.; Qiu, X.; Li, M. Geomorphologic Reconstruction of an Uplift in a Continental Basin with a Source-to-Sink Balance: An Example from the Huizhou-Lufeng Uplift, Pearl River Mouth Basin, South China Sea. Mar. Pet. Geol. 2021, 128, 104984. [Google Scholar] [CrossRef]
- Li, Q.; Li, Q.; Wu, J.; Li, X.; Li, H.; Cheng, Y. Wellhead Stability during Development Process of Hydrate Reservoir in the Northern South China Sea: Evolution and Mechanism. Processes 2025, 13, 40. [Google Scholar] [CrossRef]
- Fu, X.; Li, Z.; Lu, S.; Fu, G. Recovering denudation thickness by interval transit-time. Pet. Geol. Oilfield Dev. Daqing 2004, 23, 9–11. [Google Scholar]
- Yuan, Y.; Sun, D.; Li, S.; Lin, J. Caledonian denudation restoration woods in Sichuan Basin. Chin. J. Geol. 2013, 48, 581–591. [Google Scholar]
- Phillips, M.S.; McInenly, M.; Hofmann, M.H.; Hinman, N.W.; Warren-Rhodes, K.; Rivera-Valentin, E.G.; Cabrol, N.A. Salt Constructs in Paleo-Lake Basins as High-Priority Astrobiology Targets. Remote Sens. 2023, 15, 314. [Google Scholar] [CrossRef]
- Pichel, L.M.; Legeay, E.; Ringenbach, J.-C.; Callot, J.-P. The West African Salt-Bearing Rifted Margin-Regional Structural Variability and Salt Tectonics between Gabon and Namibe. Basin Res. 2023, 35, 2217–2248. [Google Scholar] [CrossRef]
- Li, Q.; Liu, J.; Wang, S.; Guo, Y.; Han, X.; Li, Q.; Cheng, Y.; Dong, Z.; Li, X.; Zhang, X. Numerical Insights into Factors Affecting Collapse Behavior of Horizontal Wellbore in Clayey Silt Hydrate-Bearing Sediments and the Accompanying Control Strategy. Ocean. Eng. 2024, 297, 117029. [Google Scholar] [CrossRef]
- Yang, K.; Qi, J.; Shen, F.; Sun, T.; Duan, Z.; Cui, M.; Li, P.; Lv, J. Formation Mechanism of Salt Piercement Structures in a Compressive Environment: An Example from the Kuqa Depression, Western China. J. Struct. Geol. 2024, 178, 105005. [Google Scholar] [CrossRef]
- Li, S.; Li, C.; Chen, Z.; Zhai, W.; Lei, Y.; Cao, J. Geomechanical Simulation of 3D Directional Borehole Circumference in Deep Composite Salt Formation. Lithosphere 2024, 2024, 212. [Google Scholar] [CrossRef]
- Zhou, Y.; Sheng, Q.; Fu, X.; Ding, H. The Dynamic Deformation Properties of Rock Materials Under Different Types of Seismic Load. Rock Mech. Rock Eng. 2022, 55, 5807–5820. [Google Scholar] [CrossRef]
- Wang, Z.; Gu, L.; Zhang, Q.; Jang, B.-A. Influence of Initial Stress and Deformation States on the Shear Creep Behavior of Rock Discontinuities with Different Joint Roughness Coefficients. Rock Mech. Rock Eng. 2021, 54, 5923–5936. [Google Scholar] [CrossRef]
- Li, Q.; Li, Q.; Han, Y. A Numerical Investigation on Kick Control with the Displacement Kill Method during a Well Test in a Deep-Water Gas Reservoir: A Case Study. Processes 2024, 12, 2090. [Google Scholar] [CrossRef]
- Guan, X.; Meng, Q.; Jiang, C.; Liu, X.; Han, M. Research and Application of Globally Optimized Sequence Stratigraphic Seismic Interpretation Technology: Taking the Lower Cretaceous Shahezi Formation of Xujiaweizi Fault Depression as an Example. Geofluids 2021, 2021, 7564374. [Google Scholar] [CrossRef]
- Tian, M.; Verma, S.; Gao, Y. Enhancing 3D Seismic Facies Interpretation through a Modified Patched Deep Learning Approach Leveraging Spatio-Temporal Dependencies. Comput. Geosci. 2025, 29, 8. [Google Scholar] [CrossRef]
- Deng, C.; Zhu, R.; Han, J.; Hou, K.; Shu, Y.; Liu, C.; Wu, Y.; Long, W. Influence of Fault Geometry, Kinematics and Growth Rate on Syn-Tectonic Stratigraphic Pattern: Insights from the 2D Move-on-Fault Technique in MOVE Software. J. Struct. Geol. 2021, 149, 104377. [Google Scholar] [CrossRef]
- Gao, X. On Structural Characteristics of Tankou Uplift Belt. J. Jianghan Pet. Univ. Staff. Work. 2022, 35, 9–12. [Google Scholar]
- Li, Q.; Cheng, Y.; Li, Q.; Zhang, C.; Ansari, U.; Song, B. Establishment and evaluation of strength criterion for clayey silt hydrate bearing sediment. Energy Sources Part A Recovery Util. Environ. Eff. 2018, 40, 742–750. [Google Scholar] [CrossRef]
- Zhu, Z.; Wang, P.; Chen, K.; Lv, F.; Hong, Y. Evolution of the Overlying Strata Structure and Characteristics of Ground Pressure Behavior under the Influence of Tectonic Stress. Front. Earth Sci. 2024, 12, 1501631. [Google Scholar] [CrossRef]
- Zazoun, R.S. The Hercynian Tectonics in the Tassili-n-Ajjers Area, Algeria: A Possible Continuous Stress-Strain Regime? J. Afr. Earth Sci. 2023, 202, 104902. [Google Scholar] [CrossRef]
- Zwaan, F.; Rosenau, M.; Maestrelli, D. How Initial Basin Geometry Influences Gravity-Driven Salt Tectonics: Insights from Laboratory Experiments. Mar. Pet. Geol. 2021, 133, 105195. [Google Scholar] [CrossRef]
- Yang, Y.; Li, Q.; Xu, Y.; Huang, J. Dynamics study of self-Pulling & self-Rotating jet drill bit in natural gas hydrate reservoirs radial horizontal well drilling. Geoenergy Sci. Eng. 2025, 244, 213490. [Google Scholar]
- Gong, X.; She, X.; Chen, J.; Xu, H.; Tang, T.; Dong, Z. The plastic deformation mechanism of Tankou salt mud uplift on the downthrow side of the Qianbei fault and petroleum geological significance. Chin. J. Geol. 2016, 51, 920–933. [Google Scholar]
- Tian, F.; He, D.; Chen, J.; Mao, D. Vertical Differential Structural Deformation of the Main Strike-Slip Fault Zones in the Shunbei Area, Central Tarim Basin: Structural Characteristics, Deformation Mechanisms, and Hydrocarbon Accumulation Significance. Acta Geol. Sin.-Engl. Ed. 2022, 96, 1415–1431. [Google Scholar] [CrossRef]
- Li, Q.; Wang, Y.; Li, Q.; Wang, Y.; San, J.; Li, Q.; Foster, G. Synthetic process on hydroxyl-containing polydimethylsiloxane as a thickener in CO2 fracturing and Thickening performance test. Energy Sources Part A Recovery Util. Environ. Eff. 2018, 40, 1137–1143. [Google Scholar] [CrossRef]
- Ma, K.; Zhao, Y.; Zhao, Q.; Xie, H.; Li, J. Numerical Simulations of Fault Stick-Slip Characteristics in Different Temperature Fields at Laboratory Scale. Geomech. Geophys. Geo-Energy Geo-Resour. 2024, 10, 30. [Google Scholar] [CrossRef]
- Li, C.; Yin, H.; Wu, Z.; Zhou, P.; Wang, W.; Ren, R.; Guan, S.; Li, X.; Luo, H.; Jia, D. Effects of Salt Thickness on the Structural Deformation of Foreland Fold-and-Thrust Belt in the Kuqa Depression, Tarim Basin: Insights from Discrete Element Models. Front. Earth Sci. 2021, 9, 655173. [Google Scholar] [CrossRef]
- Swanger, W.R.; Thigpen, J.R.; Goldsby, R.C.; Preece, M.B.; Powell, N.E.; Spencer, B.M.; Helfrich, A.L. Understanding Deformation Band Formation across a Range of Length Scales in the Paradox Basin, Utah. J. Struct. Geol. 2023, 166, 104775. [Google Scholar] [CrossRef]
- Blondel, S.; Bellucci, M.; Evans, S.; Del Ben, A.; Camerlenghi, A. Contractional Salt Deformation in a Recently Inverted Basin: Miocene to Current Salt Deformation within the Central Algerian Basin. Basin Res. 2022, 34, 1632–1654. [Google Scholar] [CrossRef]
- Chen, S.; Li, J.; Yuan, F.; Deng, Y.; Zhang, D.; Li, X.; Jiang, R. Deformation History of the Feidong Segment of the Tan-Lu Fault Zone in the Early Cretaceous: Implications for the Tectonic Evolution in Eastern China. Geol. J. 2022, 57, 3668–3685. [Google Scholar] [CrossRef]
- Ji, T.; Zheng, W.; Yang, J.; Zhang, D.; Liang, S.; Li, Y.; Liu, T.; Zhou, H.; Feng, C. Tectonic Significances of the Geomorphic Evolution in the Southern Alashan Block to the Outward Expansion of the Northeastern Tibetan Plateau. Remote Sens. 2022, 14, 6269. [Google Scholar] [CrossRef]
- Li, Q.; Li, Y.; Cheng, Y.; Wang, F.; Wei, J.; Liu, Y.; Zhang, C.; Song, B.; Yan, C.; Ansari, U. Numerical simulation of fracture reorientation during hydraulic fracturing in perforated horizontal well in shale reservoirs. Energy Sources Part A Recovery Util. Environ. Eff. 2018, 40, 1807–1813. [Google Scholar] [CrossRef]
- He, K.; Ma, G.; Hu, X. Formation Mechanisms and Evolution Model of the Tectonic-Related Ancient Giant Basalt Landslide in Yanyuan County, China. Nat. Hazards 2021, 106, 2575–2597. [Google Scholar] [CrossRef]
- Yang, C.; Wang, C. Tensile Fractures and in Situ Stress Measurement Data Constraints on Cretaceous-Present Tectonic Stress Field Evolution of the Tanlu Fault Zone in Shandong Province, North China Craton. Acta Geol. Sin.-Engl. Ed. 2023, 97, 1616–1624. [Google Scholar] [CrossRef]
- Li, H.; Lin, C.; Ren, L.; Zhang, G.; Chang, L.; Dong, C. Quantitative Prediction of Multi-Period Tectonic Fractures Based on Integrated Geological-Geophysical and Geomechanics Data in Deep Carbonate Reservoirs of Halahatang Oilfield in Northern Tarim Basin. Mar. Pet. Geol. 2021, 134, 105377. [Google Scholar] [CrossRef]
- Li, Q.; Li, Q.; Wu, J.; He, K.; Xia, Y.; Liu, J.; Wang, F.; Cheng, Y. Wellhead Stability during Development Process of Hydrate Reservoir in the Northern South China Sea: Sensitivity Analysis. Processes 2015, 13, 1630. [Google Scholar] [CrossRef]
- Wei, J.; Cheng, Y.; Yan, C.; Li, Q.; Zou, D.; Zhang, H. Drilling Parameter Optimizing Strategies to Prevent Hydrate Decomposition Risks. Appl. Therm. Eng. 2019, 146, 405–412. [Google Scholar] [CrossRef]
- Guo, J.; Yang, R.; Geng, F.; Wang, L.; Zhang, S.; Wang, L.; Han, F. Segmentation Characteristics of Strike-Slip Fault Zone and Its Reservoir Control Mechanisms in the Southwestern Tarim Basin. Front. Earth Sci. 2024, 12, 1464924. [Google Scholar] [CrossRef]
- Li, Q.; Wu, J.; Li, Q.; Wang, F.; Cheng, Y. Sediment Instability Caused by Gas Production from Hydrate-Bearing Sediment in Northern South China Sea by Horizontal Wellbore: Sensitivity Analysis. Nat. Resour. Res. 2025, 34, 1667–1699. [Google Scholar]
- Zhou, H.; Sun, C.; Zhou, Y.; Yang, P.; Luo, X.; Chen, X. Structural characteristics, formation and evolution of Salam and Aqia faults in northwestern Tarim Basin. Chin. J. Geol. 2024, 59, 1487–1499. [Google Scholar]
- Yuan, R.; Li, J.; Jiang, J.; Miao, W.; Huang, Z.; Kang, X.; Song, Y.; Deng, X.; Shi, B.; Ji, L. Structural characteristics, formation and evolution of the Yiqikelik anticline in the eastern segment Kuqa fold-thrust belt, Tarim Basin, NW China. Chin. J. Geol. 2024, 59, 1212–1228. [Google Scholar]
- Zhou, X.; Su, Y.; Cheng, Y.; Li, Q. Preliminary Insight into Ice Melting, Surface Subsidence, and Wellhead Instability during Oil and Gas Extraction in Permafrost Region. Energies 2024, 17, 1292. [Google Scholar] [CrossRef]
- Li, Q.; Cheng, Y.; Li, Q.; Ansari, U.; Liu, Y.; Yan, C.; Lei, C. Development and Verification of The Comprehensive Model for Physical Properties of Hydrate Sediment. Arab. J. Geosci. 2018, 11, 325. [Google Scholar] [CrossRef]
- Yu, Y.; Tao, C.; Shi, S.; Yin, J.; Wu, C.; Liu, J. Physical Modeling of Salt Structures in the Middle South Atlantic Marginal Basins and Their Controlling Factors. Pet. Explor. Dev. 2021, 48, 136–145. [Google Scholar] [CrossRef]
- Li, Q.; Wang, Y.; Wang, F.; Li, Q.; Kobina, F.; Bai, H.; Yuan, L. Effect of a modified silicone as a thickener on rheology of liquid CO2 and its fracturing capacity. Polymers 2019, 11, 540. [Google Scholar] [CrossRef]
- Liu, Y.; Zhou, L.; Wan, X.; Tang, Y.; Liu, Q.; Li, W.; Liao, J. Synthesis and Characterization of a Temperature-Sensitive Microcapsule Gelling Agent for High-Temperature Acid Release. ACS Omega 2024, 9, 20849–20858. [Google Scholar] [CrossRef]
Disclaimer/Publisher’s Note: The statements, opinions and data contained in all publications are solely those of the individual author(s) and contributor(s) and not of MDPI and/or the editor(s). MDPI and/or the editor(s) disclaim responsibility for any injury to people or property resulting from any ideas, methods, instructions or products referred to in the content. |
© 2025 by the authors. Licensee MDPI, Basel, Switzerland. This article is an open access article distributed under the terms and conditions of the Creative Commons Attribution (CC BY) license (https://creativecommons.org/licenses/by/4.0/).