Article

Correlation Between Plume Emission and Material Modifications in Fiber Laser Processing of Titanium

1
Directed Energy Research Center, Technology Innovation Institute (TII), Abu Dhabi P.O. Box 9639, United Arab Emirates
2
Empa–Swiss Federal Laboratories for Materials Science and Technology, Laboratory for Advanced Materials Processing, Feuerwerkerstrasse 39, CH-3602 Thun, Switzerland
*
Author to whom correspondence should be addressed.
Processes 2025, 13(6), 1761; https://doi.org/10.3390/pr13061761
Submission received: 22 February 2025 / Revised: 10 May 2025 / Accepted: 24 May 2025 / Published: 3 June 2025
(This article belongs to the Special Issue Progress in Laser-Assisted Manufacturing and Materials Processing)

Abstract

:
The plume emission generated during the interaction of a fiber laser with titanium is spectrally analyzed to investigate the thermal effect-based spectral signature with a focus on surface impact and penetration depth. A wobble head coupled with the fiber laser forms circular patterns on the surface during the interaction. The effects of wobble speed and laser peak power on the track width of the circular pattern, penetration depth, and plume emission characteristics were studied. Decreasing the wobble speed and increasing the laser peak power led to wider tracks and a deeper penetration. The variation in track width, penetration depth, and line emission intensities follows a similar pattern, indicating a correlation between plume emission and material modifications. A transition point at approximately 400 W of laser peak power was observed in track width, penetration depth, line emission intensities, and plume temperature variations. The increase in track width and line emission intensities with laser peak power shows growth at a slower rate below the transition point and at a higher rate above it. By contrast, the penetration depth and plume temperature increase at a higher rate below the transition compared to above it. This indicates that the increasing laser peak power leads to a more pronounced surface impact, resulting in an increase in track width and to a greater plume formation, causing enhanced line emission intensities and laser beam shielding that reduces the rate of increase in penetration depth above the transition point.

1. Introduction

Research on laser–material interaction processes has earned increasing attention due to a wide range of applications in manufacturing and materials processing [1,2,3]. In particular, the laser processing of titanium and its alloys has received significant interest from both academia and industries due to their important properties, such as a low density, excellent high-temperature mechanical properties, a high strength, biocompatibility, and excellent corrosion resistance and applications in the aerospace, chemical, biomedical, automotive, shipbuilding, petrochemical, nuclear and power generation industries [4,5,6]. During the laser processing of metals, a high-power laser beam is focused on the metal, which delivers a large amount of energy into a small region leading to heating, melting, and evaporation. In addition, a vapor/plasma plume is generated during the laser–metal interaction process, which carries crucial information about the laser-processed zone. Li et al. [7] have reported a correlation between plume fluctuations and keyhole dynamics during fiber laser keyhole welding, which is not influenced by the welding parameters such as welding speed and laser power. However, the weld microstructure and bead profile are affected [8]. In keyhole welding, a narrow and deep penetration into the material is achieved, accompanied by substantial generation of vapor/plasma plumes. Frey et al. [9] have studied the interdependence of metal vapor plumes and melt pool dynamics during laser beam welding under vacuum and mentioned that the emitted hot metal vapor and particles from the keyhole interact with the laser beam through scattering, absorption, and phase-front deformation. Mohanta et al. [10] have investigated the dynamics of the plume produced due to the interaction of millisecond infrared fiber lasers that have different spectral profiles with titanium at different ambient atmospheres and pressures and reported that neutral titanium atoms in the plume can reabsorb the laser pulse if the spectral profile of the laser overlaps with the corresponding transition energies. Moreover, the quality of the laser weld and stability of the process are associated with the dynamics of the vapor/plasma plume flow in the keyhole [11]. Wang et al. [12] have analyzed the cause of the periodic oscillation of the plasma/vapor induced during high-power fiber laser penetration welding and attributed it to the oscillation of the keyhole. The acoustic emission (AE) effect of the plasma plume in pulsed laser welding has also been studied, where the source mechanism for AE’s generation is attributed to the recoil force and thermal vibrations generated by the plasma plume acting on the molten pool [13]. Furthermore, rapid heating and cooling during the laser welding process induces a high cooling rate and temperature gradient, which subsequently leads to excessive thermal stress and even cracks in the weld joints [14]. To control the welding process and improve the weld quality, in situ process investigations have been conducted by monitoring the acoustic, visual, and thermal signal produced during laser welding [15,16]. Optical emission spectroscopy (OES) has been used to monitor Al/Cu’s dissimilar laser welding process in situ to gain a comprehensive understanding of the process and to assess its feasibility as a monitoring tool [17]. OES is a robust and non-invasive diagnostic method utilized to investigate plasma properties [18]. This technique analyzes the electromagnetic radiation emitted by excited species, including ions, atoms, and molecules, within the plasma, thereby providing valuable insights into its composition and behavior. Although OES has been widely used for plasma diagnostics, its direct relation to the material’s morphological transformation during processing, especially using a wobble-mode fiber laser, has not been thoroughly explored. In this study, we have used OES to analyze the characteristics of plume emissions produced during the interaction of a laser with titanium at different process parameters. Laser beam wobbling in a circular pattern at various speeds and laser powers has been investigated to study its effects on titanium, as it offers several advantages over conventional laser welding [19,20]. Optical microscopy and cross-sectional analysis reveal an increase in track width and penetration depth with a higher laser power and lower speed, indicating enhanced thermal effects in the material. These effects are also reflected in the plume emission characteristics, as OES analysis betokens an increase in plume temperature with an increase in laser power and a decrease in speed. Thus, the thermal effects generated in the material can provide a spectral signature to better understand the interaction of laser with titanium by monitoring the plume in real time using OES. Such an approach can also help to establish an adequate model for the online prediction of quality during laser processing.

2. Experimental Details

The interaction of a laser with Grade 5 titanium was studied using a ROFIN-LASAG AG, Switzerland (LFS 150 OEM) fiber laser with a Gaussian beam profile (wavelength: 1070 nm), coupled with a wobble head (Smart Weld, Coherent, Switzerland). A schematic representation of the experimental setup is shown in Figure 1. The laser was focused to a diameter of 30 µm onto the sample, which was positioned perpendicular to the laser beam. The wobble head was programmed to produce circular patterns on the sample’s surface with different diameters and speeds. The pulse duration of the laser was measured using a photodiode coupled to an oscilloscope and was adjusted to produce only one turn of the circular pattern on the surface without overlapping. Figure 2 shows the temporal profiles of the laser at varying pulse durations. Note that there is a slight offset of approximately 0.14 ms between the set pulse duration ( τ s ) and the actual measured pulse duration ( τ m ). Different diameters of the circular pattern were realized by adjusting the wobble frequency ( w f ) and amplitude ( w A ) as shown in Figure 3. In a similar manner, there is a slight difference between the set diameter and the actual diameter of the circular patterns on the titanium plate. The cross-sections of the circular patterns produced on the sample surface were prepared by cutting, grinding, polishing, and etching using standard metallographic techniques. Keller’s reagent, consisting of 95 mL of distilled water, 2.5 mL of nitric acid (HNO3), 1.5 mL of hydrochloric acid (HCl), and 1.0 mL of hydrofluoric acid (HF), was used for etching. The surface and cross-sectional images were obtained using an Axioplan optical microscope (Zeiss, Germany) equipped with a ProgResC14 plus camera (Jenoptik, Germany). The plume emission generated during the interaction of the laser with titanium was collected perpendicular to the laser beam axis close to the surface using collection optics attached to one end of a fiber optic patch cable. The other end was coupled to the entrance slit of a spectrometer [Andor Technology (Shamrock Spectrograph and Newton CCD), UK]. The plume emission spectra were recorded at atmospheric pressure with argon gas shielding at various power levels and speeds, using integration times that matched the duration required for the laser beam to complete the circular pattern. Argon gas shielding was used to prevent oxidation during the laser–titanium interaction. A detailed study has previously been conducted with and without argon gas shielding to investigate its effect on oxidation in both the laser-processed zone and the plume emission characteristics [21,22]. During laser processing, preventing oxidation is essential to maintain the desired quality of the fabricated parts. Moreover, oxygen contamination affects both the weld’s surface color and microstructure. The color of the weld surface changes from silver to straw/dark straw, purple, and blue with increasing oxygen content [23]. Oxide bands also appear in the optical emission spectra, as demonstrated in previous reports [21,22].

3. Results

A circular pattern with varying diameters was produced on the titanium’s surface using a fiber laser coupled with a wobble head to investigate the interaction of the laser with titanium, as the wobbling mode can result in high-quality welds for a wide range of materials [24]. Optical microscope images of the corresponding patterns are shown in Figure 3. The wobble frequency was adjusted for different diameters of the circular patterns, while maintaining a wobble speed of 900 mm/s. The wobble frequencies were 143, 286, 382, 573, 716, 955, 1432, and 2865 Hz for set diameters of 2 mm, 1 mm, 750 µm, 500 µm, 400 µm, 300 µm, 200 µm, and 100 µm, respectively. The corresponding τ s were 7, 3.5, 2.6, 1.85, 1.5, 1.2, 0.85, and 0.55 ms, respectively, for the single turn of the circular patterns. The track width of the circular pattern on the titanium surface is found to increase with a decreasing diameter. Additionally, the circular pattern appears as a single spot for diameters of 200 and 100 µm.
To investigate the interaction of a laser with titanium at different laser peak powers and wobble speeds, a circular pattern of a single turn with a set diameter of 750 µm was considered. Figure 4 shows the optical microscope images of the circular patterns on the titanium’s surface at different wobble speeds from 1000 mm/s to 100 mm/s for a fixed laser peak power of 250 W. Since the time required to complete a single-turn circular pattern increases with a decreasing wobble speed, the laser pulse duration was adjusted accordingly to complete the single turn. The τ s values were 2.3, 2.6, 2.9, 3.3, 3.9, 4.7, 5.8, 7.8, 11.7, and 23.3 ms, while the w f values were 424, 382, 340, 297, 255, 212, 170, 127, 85 and 42, respectively, corresponding to the wobble speeds of 1000, 900, 800, 700, 600, 500, 400, 300, 200, and 100 mm/s, respectively. It is evident from Figure 4 that the track width increases as the wobble speed decreases. The track widths were estimated from optical microscope images by measuring the difference between the outer and inner diameters of the circular patterns on the titanium’s surface, as shown in Figure 4. The variation in track width, outer diameter, and inner diameter with respect to wobble speed is illustrated in Figure 5. As the wobble speed decreases from approximately 1000 to 100 mm/s, the track width increases from about 200 to 820 µm, the outer diameter increases from about 830 to 1090 µm, and the inner diameter decreases from about 630 to 270 µm. Figure 6 shows the optical microscope images of the circular patterns produced at different laser peak powers for a fixed wobble speed of 900 mm/s with a τ s of 2.6 ms and w f of 382 Hz. Similarly, the track widths were determined from optical microscope images by measuring the difference between the outer and inner diameters of the circular patterns on the titanium’s surface. Figure 7 shows the variation in track width, outer diameter, and inner diameter with laser peak powers (100–700 W) at a fixed wobble speed of 900 mm/s. The track width increased from approximately 180 µm to 355 µm, the outer diameter increased from about 815 µm to 915 µm, and the inner diameter decreased from approximately 635 µm to 560 µm as the laser peak power increased from 100 W to 700 W, as shown in Figure 7. The thick solid line represents the linear fit to the variation in track width with laser peak power, represented by the scattered data points (). The transition in the observed variation occurs at a laser peak power of approximately 400 W. The slope of the increase in track width exhibits two distinct values: 0.13 below the transition point and 0.36 above it.

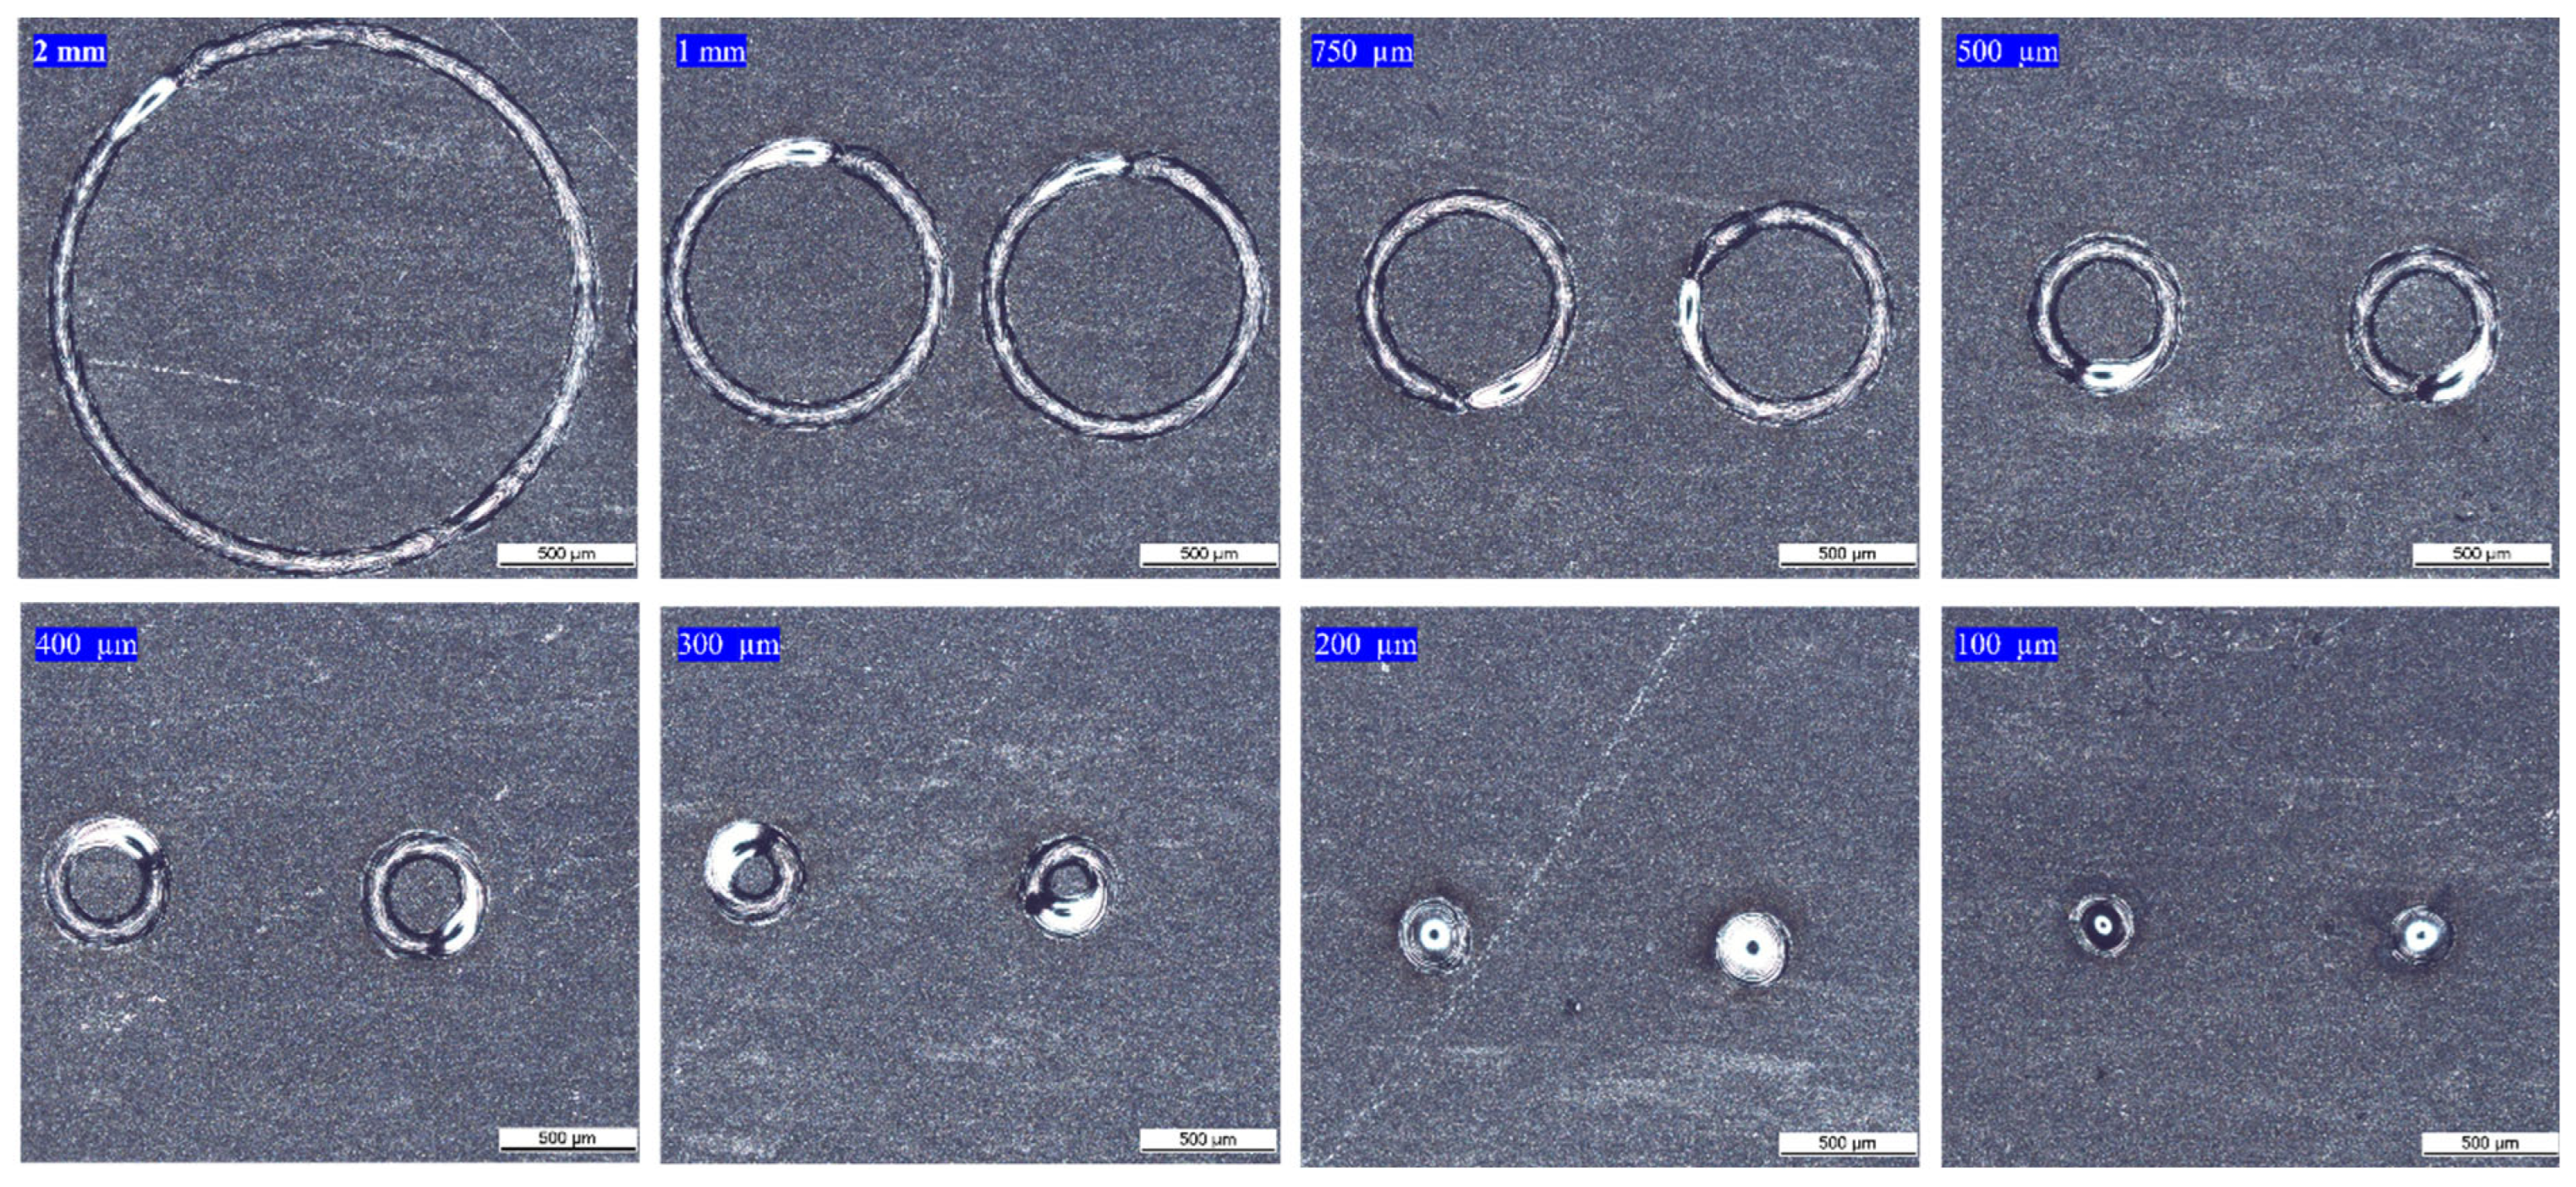
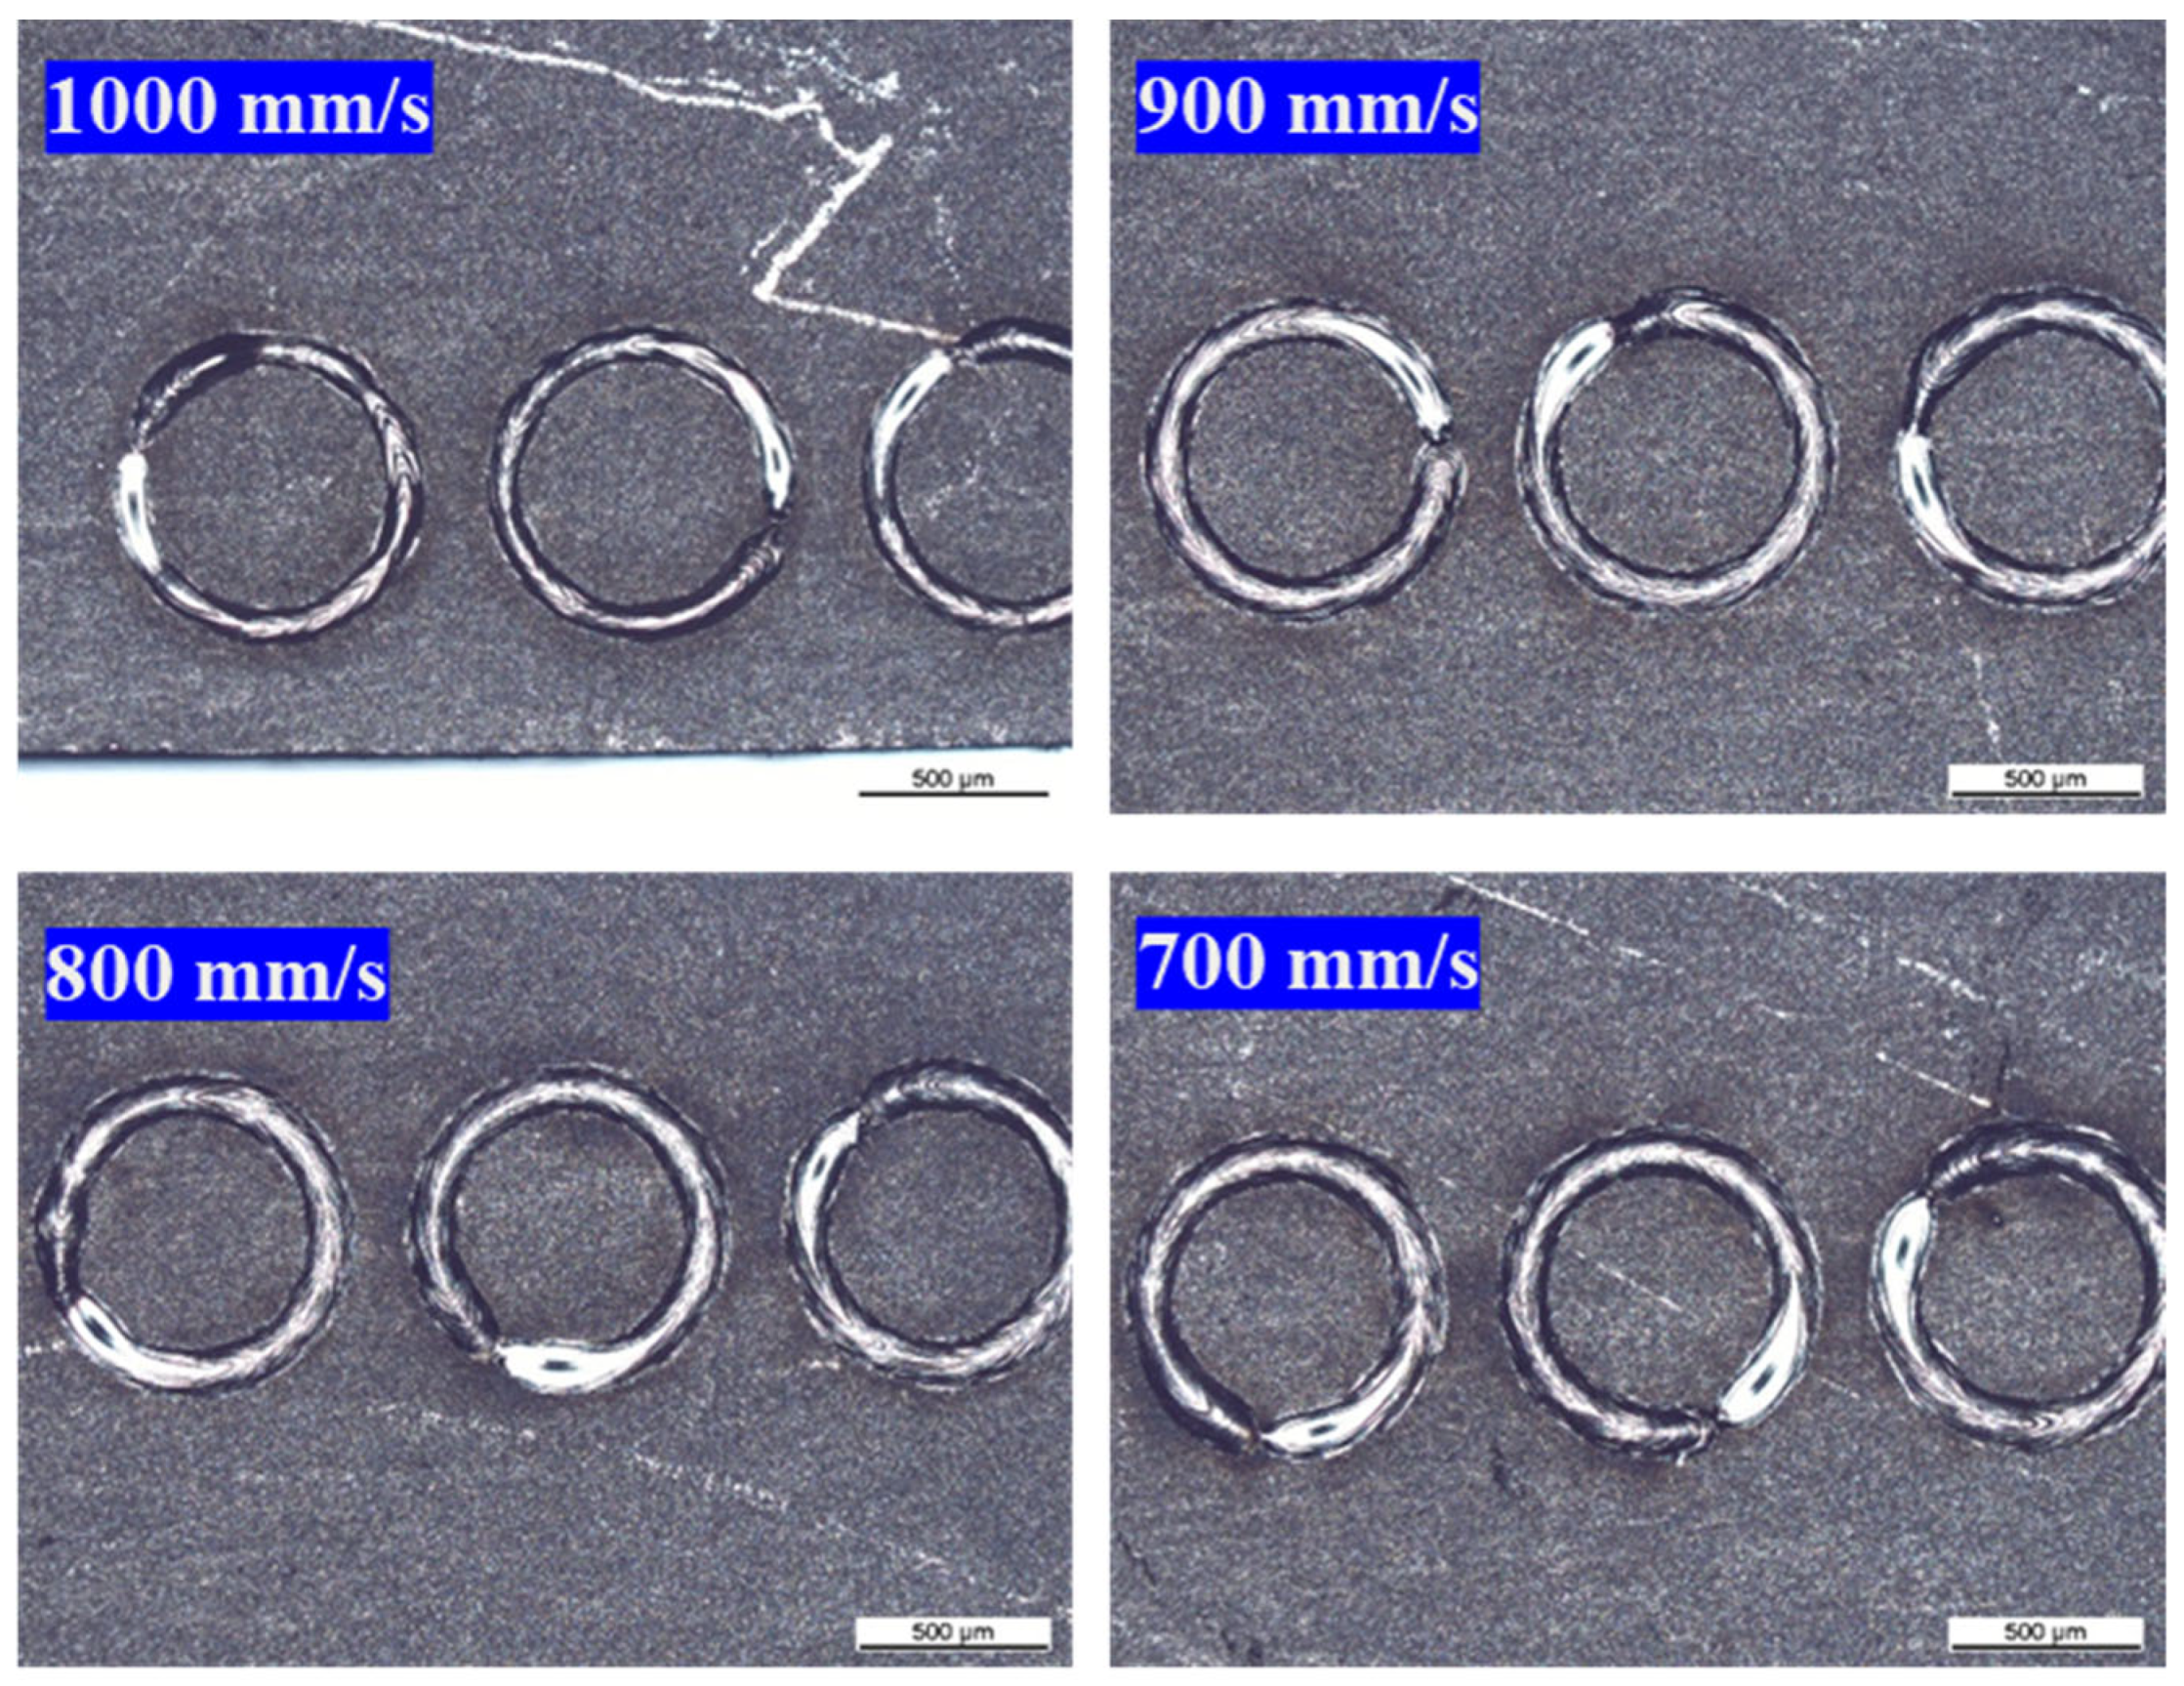
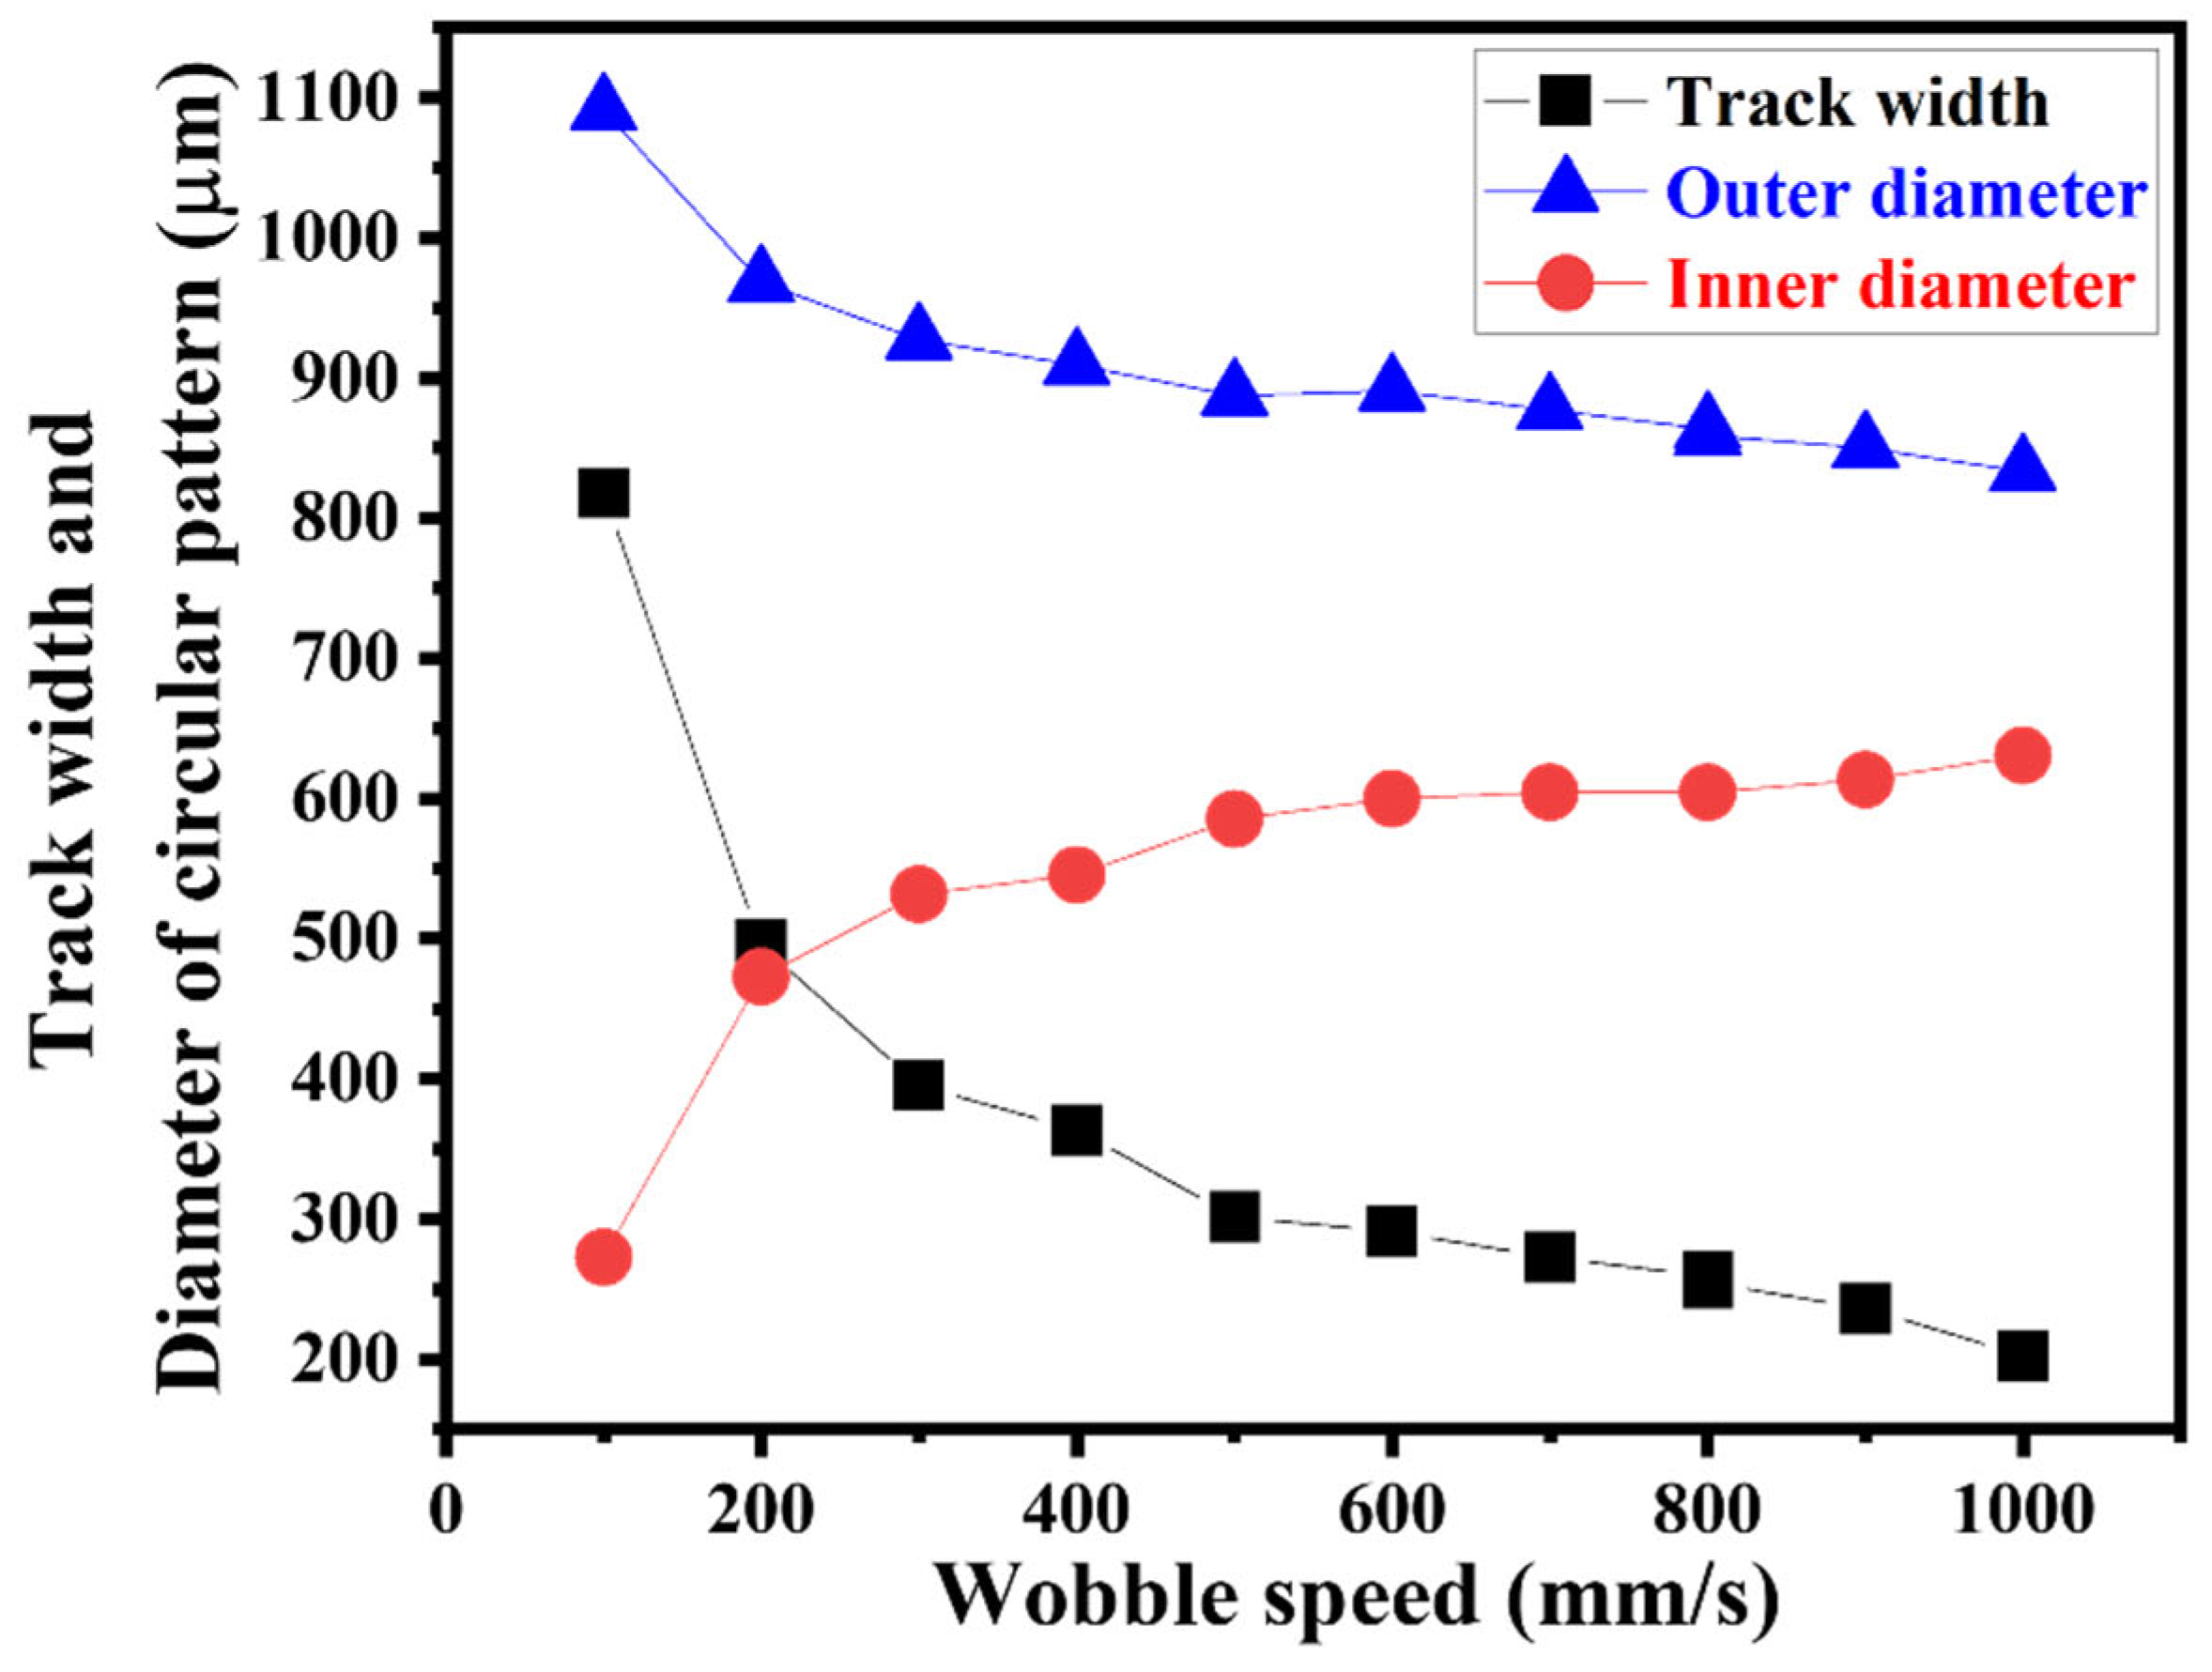
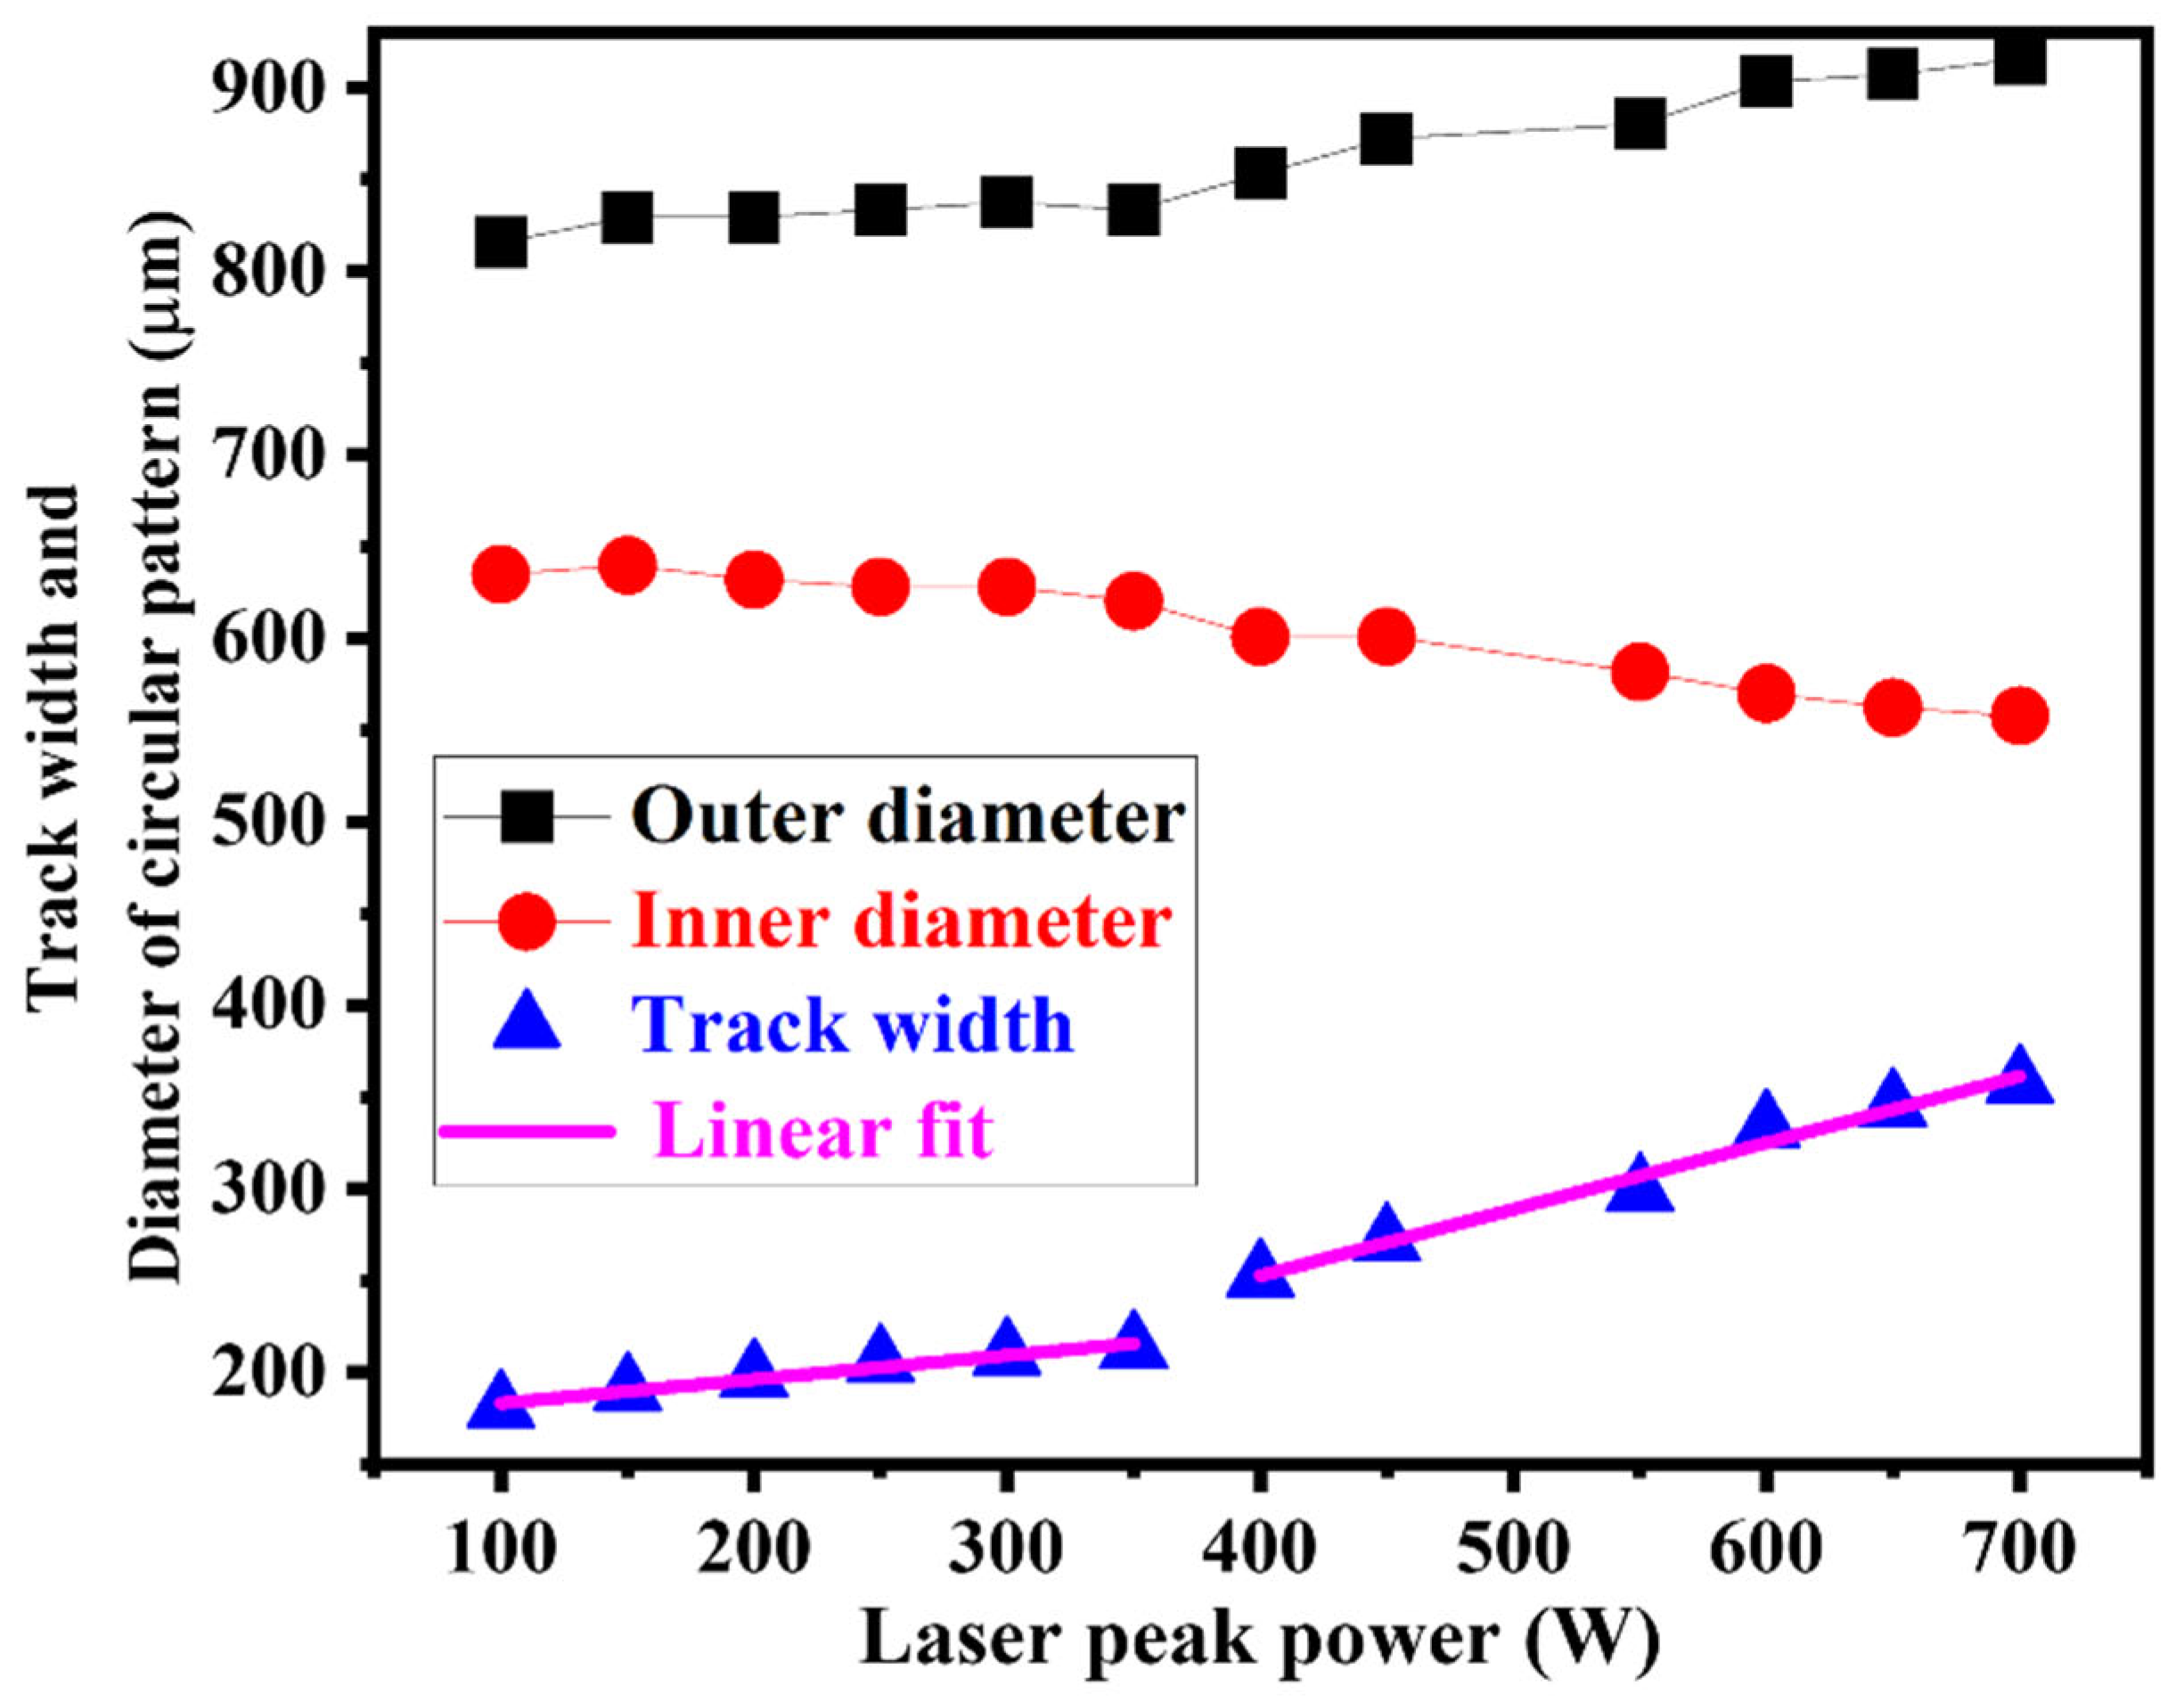
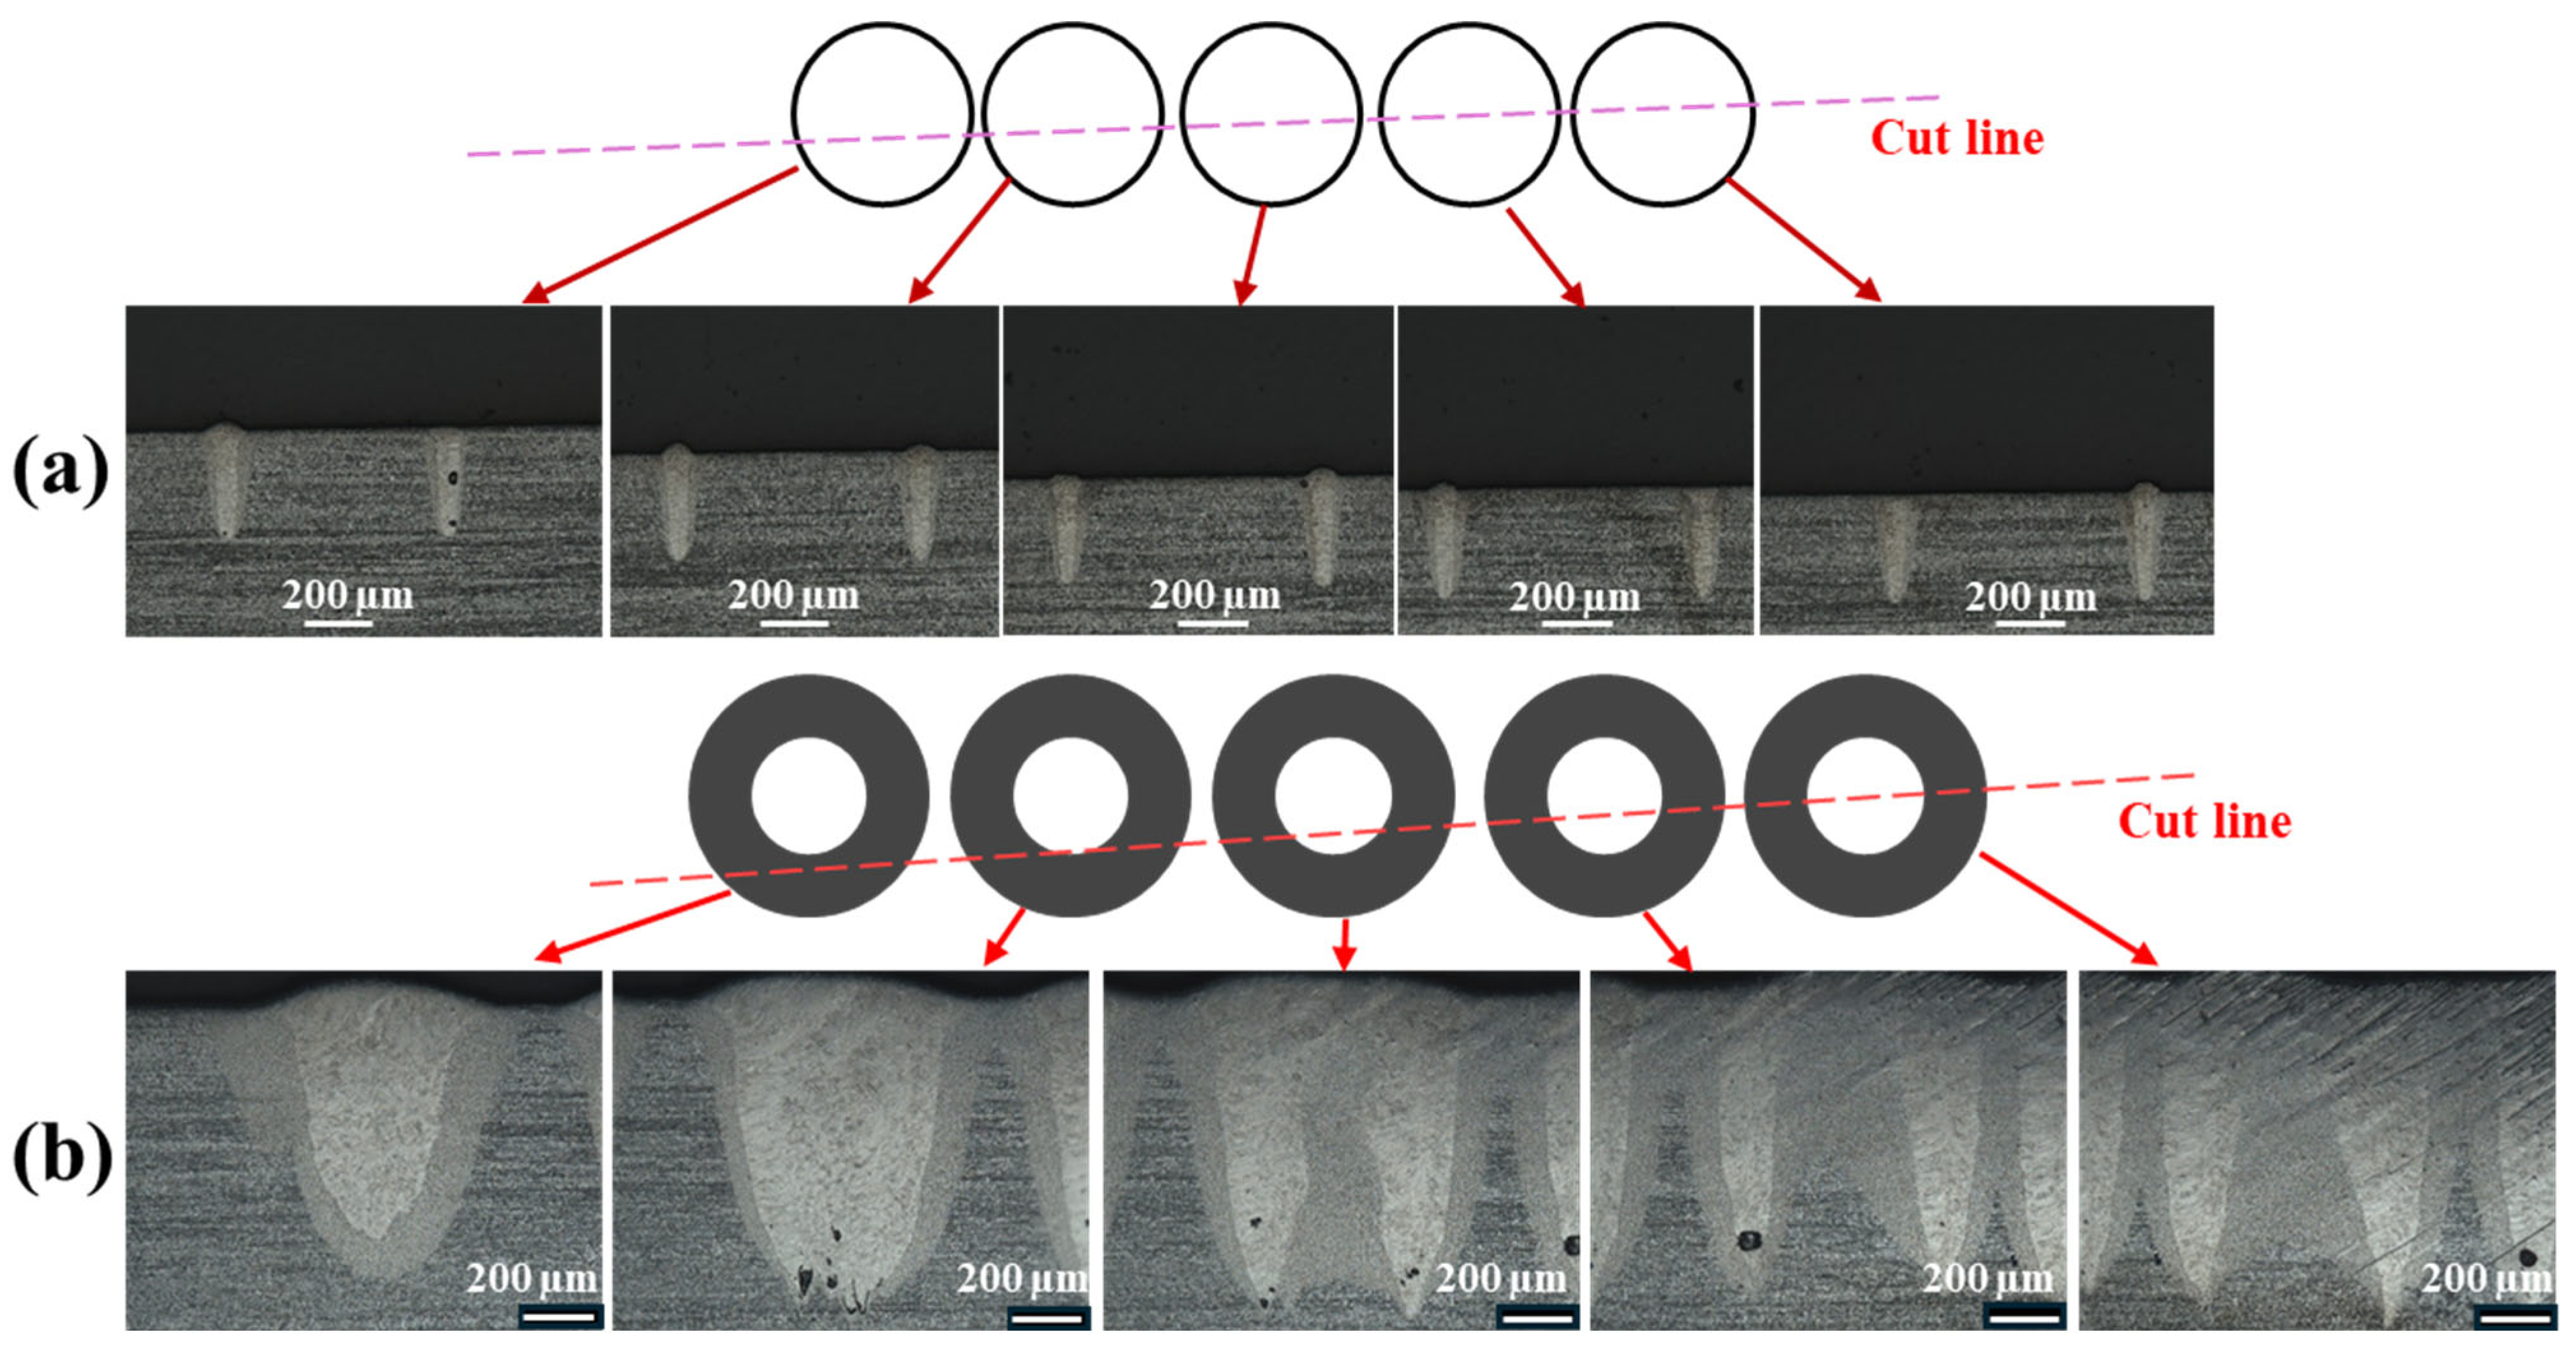
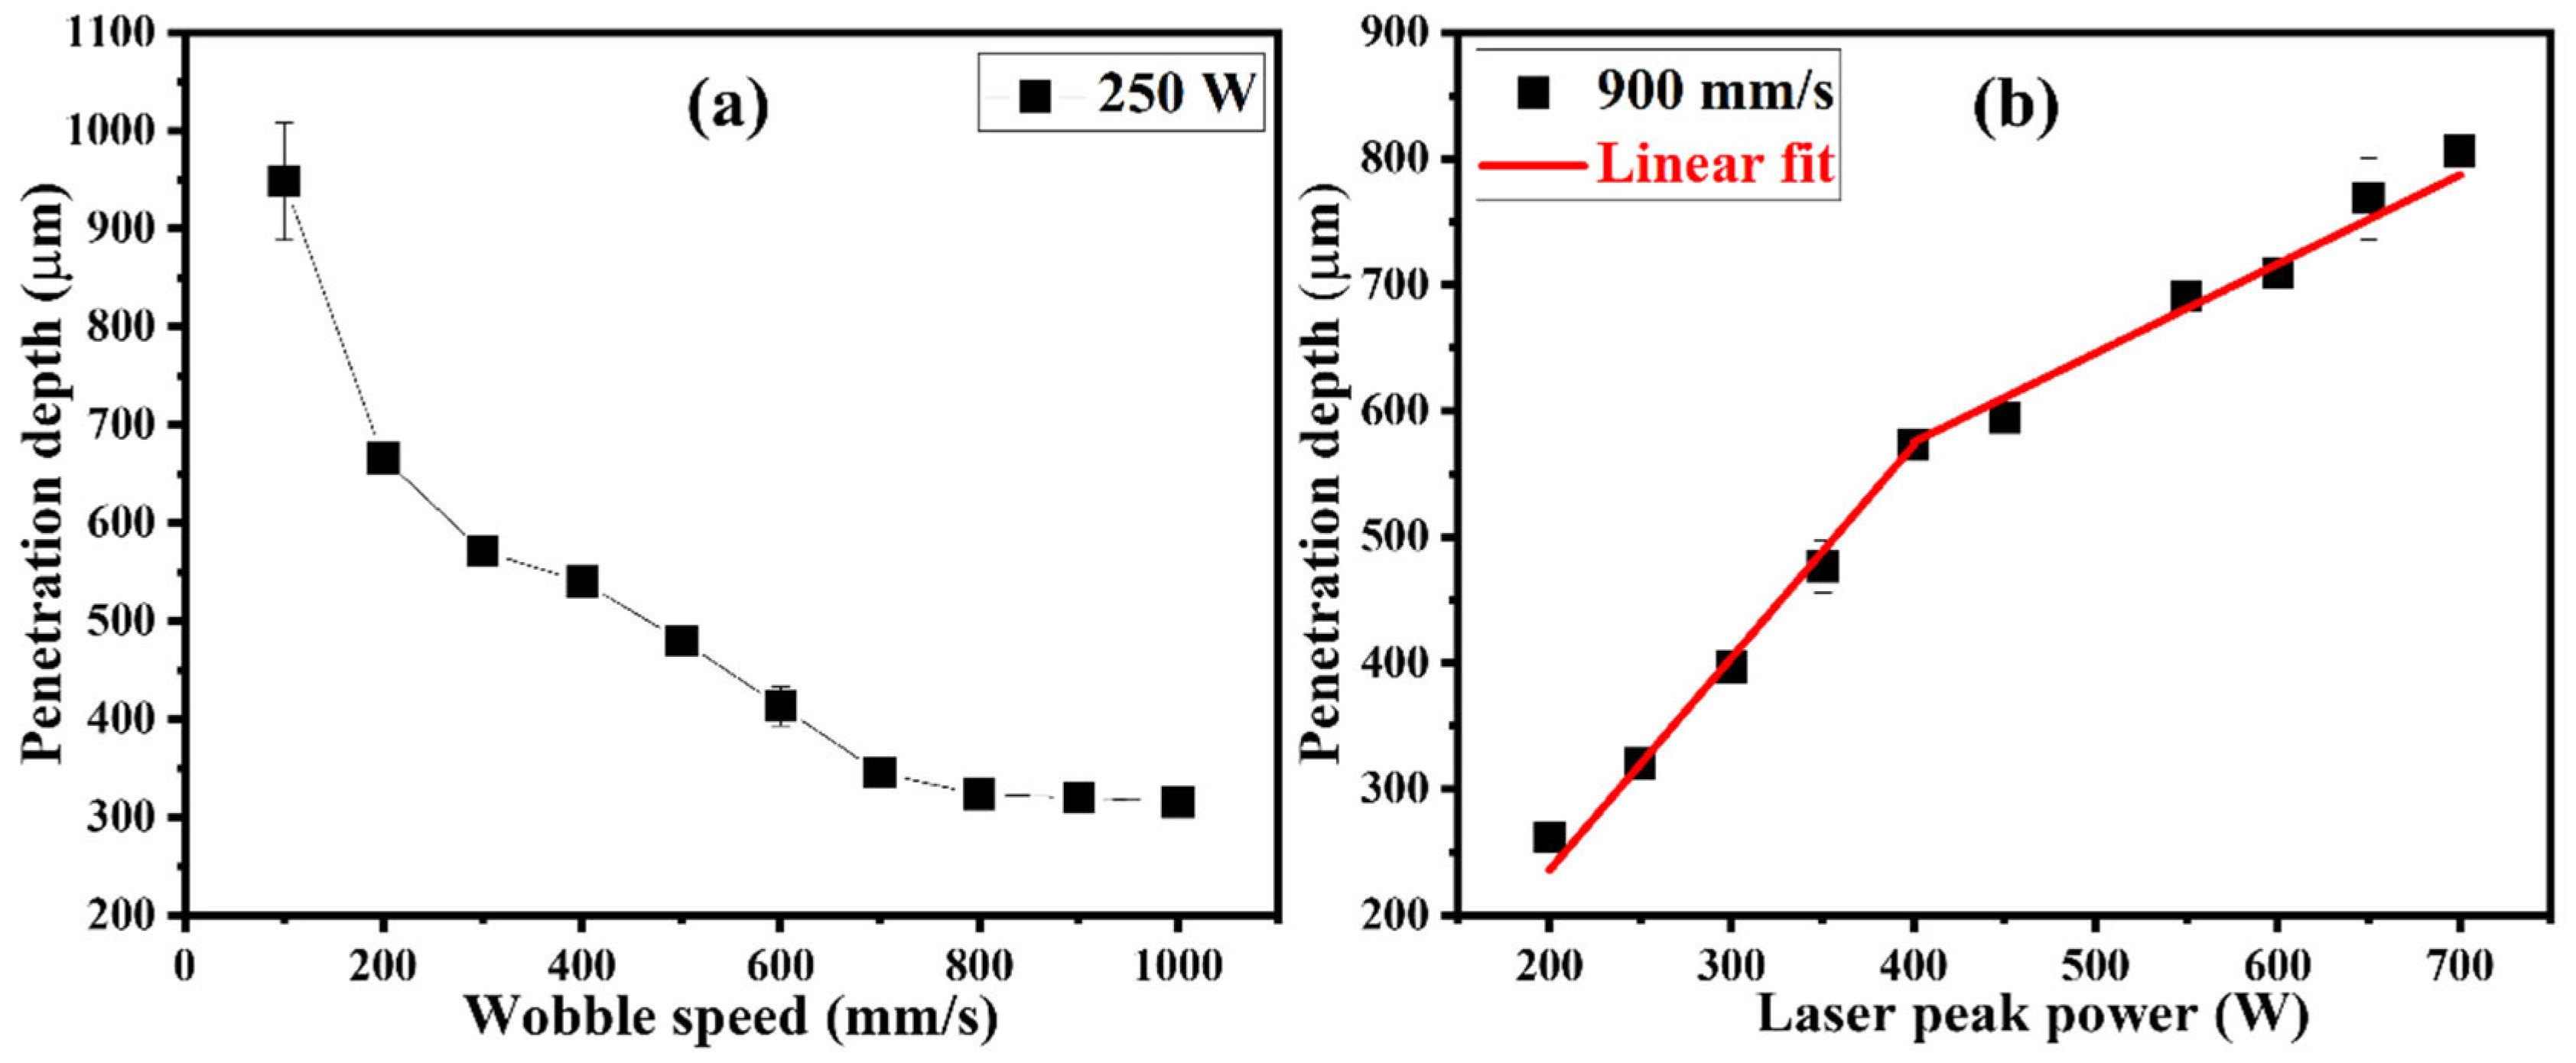
3.1. Cross-Sectional Analysis

The cross-sectional analysis of the circular patterns depicted in Figure 4 and Figure 6 was conducted to examine the penetration profile within the titanium at the laser-irradiated zone. This analysis is focused on evaluating the effects of varying wobble speeds and laser peak powers on the penetration characteristics. Five circular patterns were produced adjacent to one another on the titanium’s surface to examine reproducibility under identical parametric conditions, as shown in Figure 4 and Figure 6, and we cut simultaneously across the circular patterns as illustrated in Figure 8. Figure 8a depicts the cross-sectional images of the circular patterns obtained at a laser peak power of 250 W and wobble speed of 1000 mm/s, where τ s is 2.3 ms. Similarly, Figure 8b shows the cross-sectional images of the circular patterns at a laser peak power of 250 W and wobble speed of 100 mm/s, where the τ s is 23.3 ms. The dotted cut line on the circular patterns represents the line along which the circular patterns on the titanium surface were cut for cross-sectional analysis. In Figure 8a, the cut line passes from the top half of the rightmost circle to the bottom half of the leftmost circle. Consequently, the gap between the penetration profiles varies for each circular pattern shown in the optical microscope images of the cross-sections, as two penetration profiles are observed per circular pattern. The penetration depth was determined from the optical microscope image shown in Figure 8a for a wobble speed of 1000 mm/s and was found to be about 315 µm on average, with a standard deviation of 7 µm. Similarly, the cut line passes through the circular patterns at a wobble speed of 100 mm/s, as shown in Figure 8b. In this case, the cut line crosses the track of the two leftmost circular patterns. As a result, the penetration profiles of these two patterns merge. The merged penetration depth for the leftmost circular pattern is comparatively smaller, which could be attributed to the cut line not passing through the central spot of the laser beam with a Gaussian profile. The penetration depths were determined from the optical microscope images of the cross-sections of the three rightmost patterns and were found to be approximately 950 µm on average, with a standard deviation of 60 µm for a wobble speed of 100 mm/s. Additionally, the width of the penetration profile is larger at a wobble speed of 100 mm/s compared to 1000 mm/s, consistent with the wider track at 100 mm/s. Figure 9 shows the variation in penetration depth with increasing speed (a) and laser peak power (b). The penetration depth shows decreasing behavior with an increase in the wobble speed for a fixed laser peak power of 250 W. This trend is aligned with the behavior of track width for the wobble speed as shown in Figure 5. Similarly, as the laser peak power increases, the penetration depth increases. Additionally, the solid lines in Figure 9b represent the linear fits to the data points (), indicating a transition around 400 W, at which the variation in the track width with the laser peak power shows a transition, as depicted in Figure 7. The slope of the penetration depth increase is 1.7 below the transition and 0.7 above it.

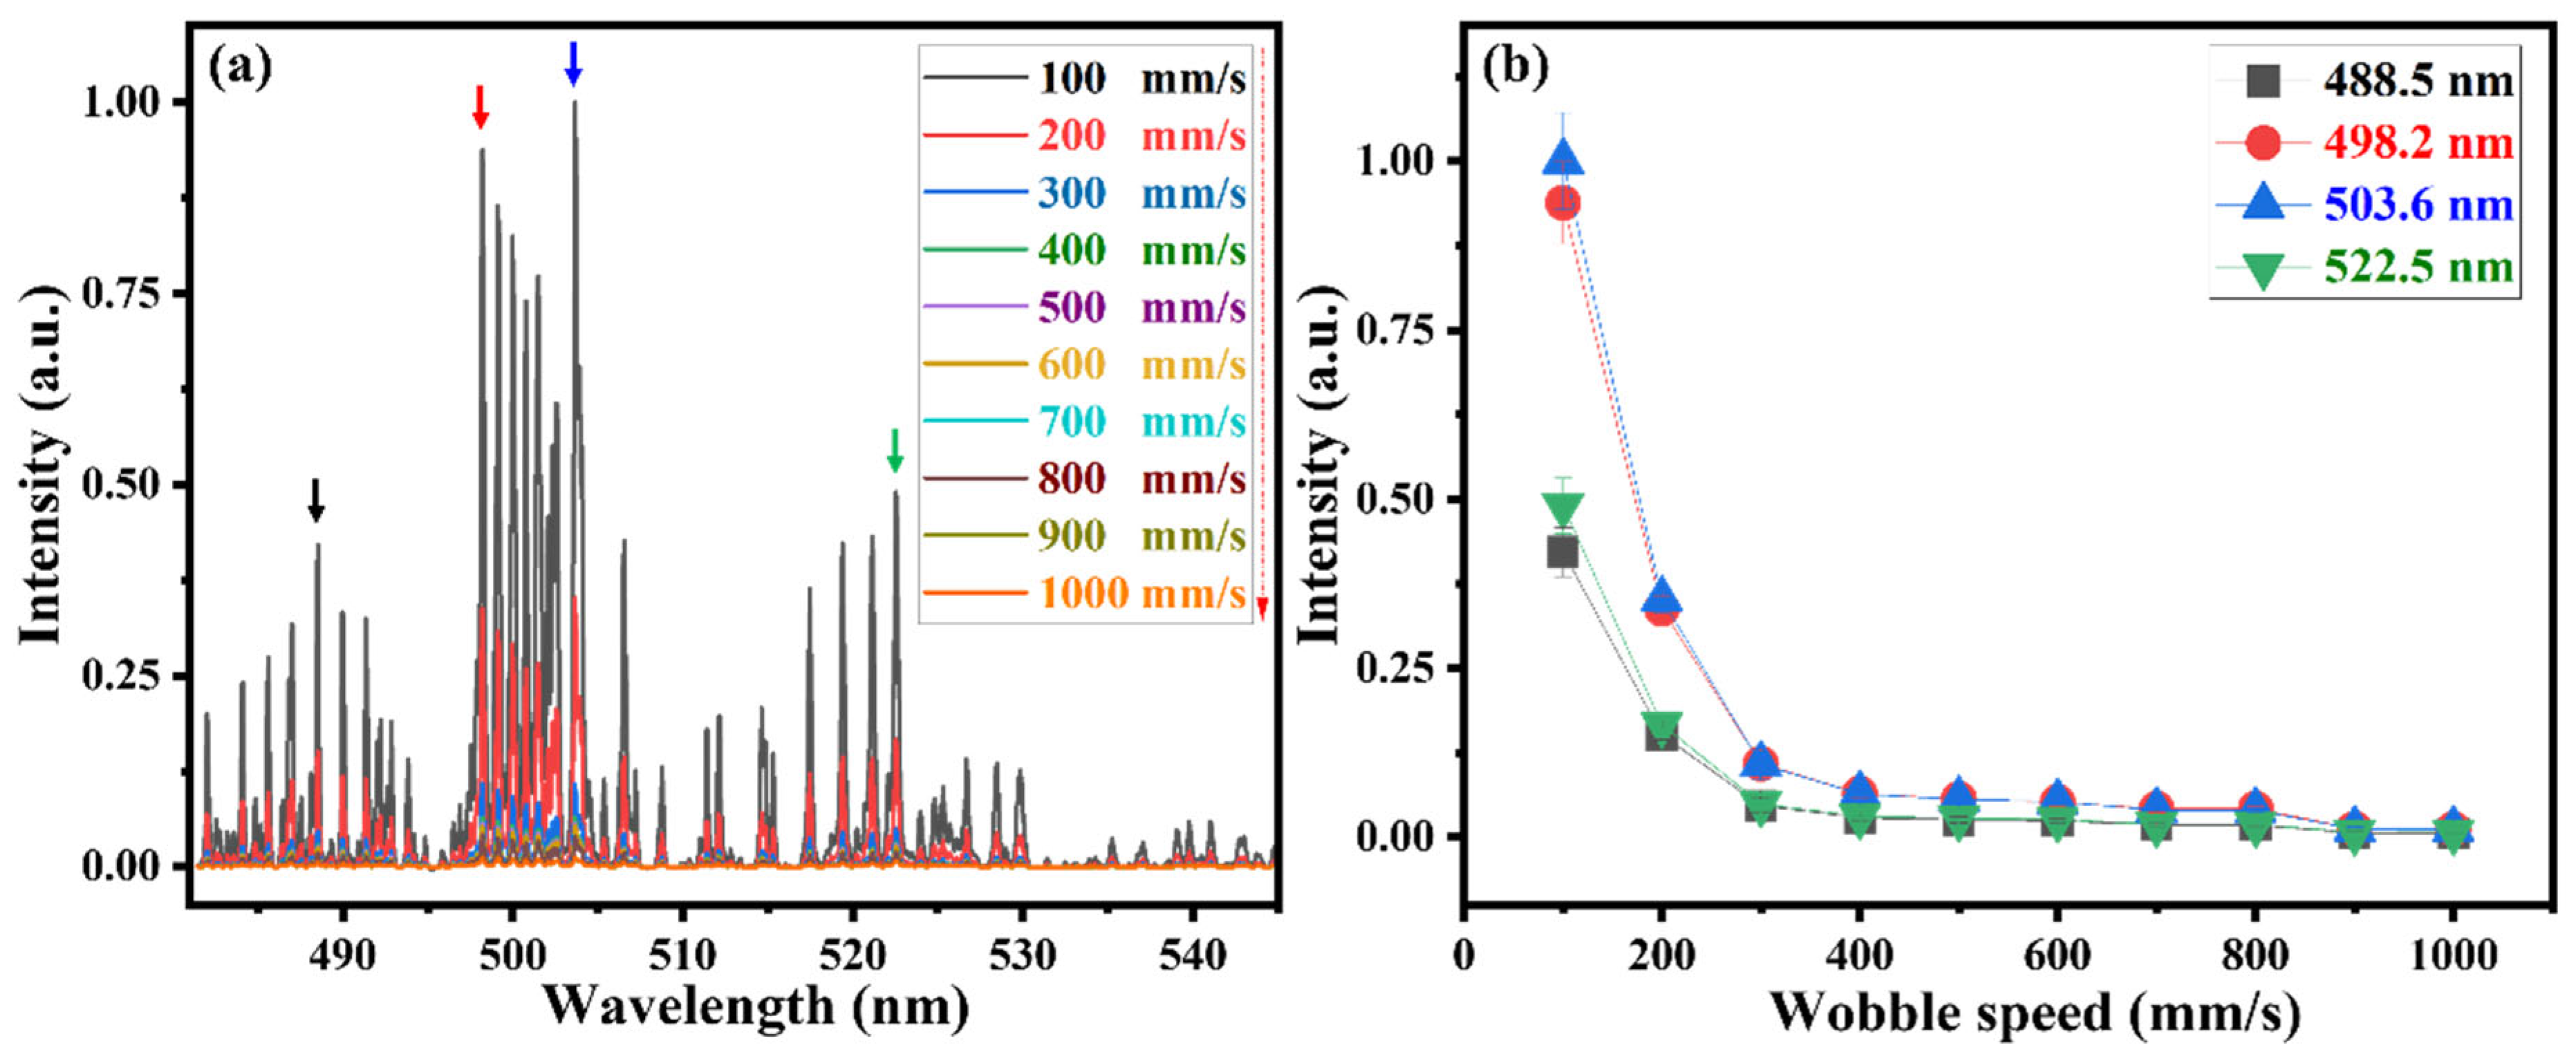
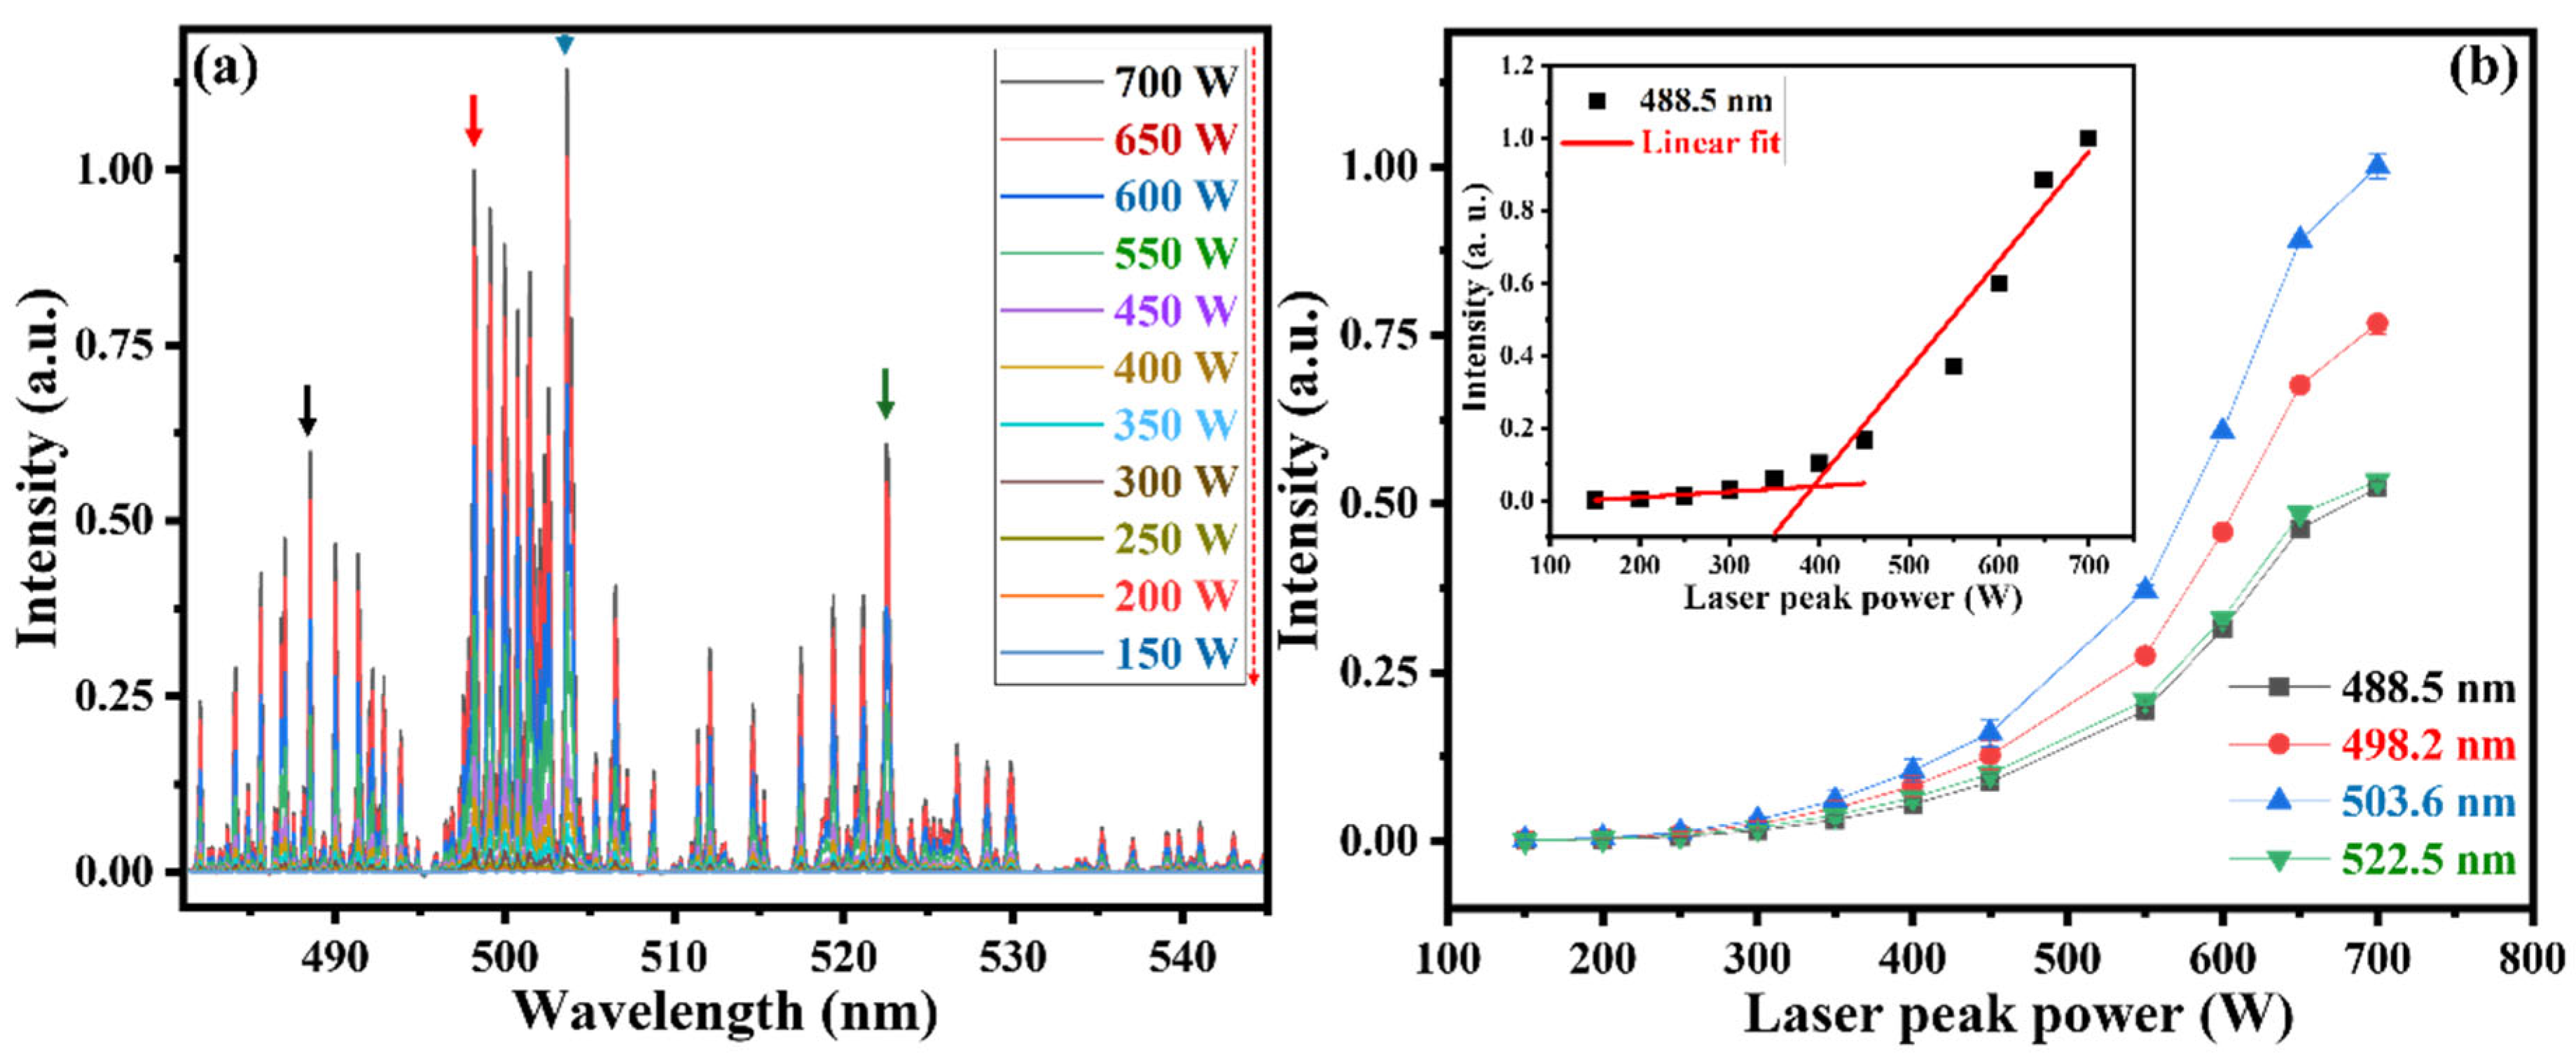
3.2. Optical Emission Spectroscopy

The interaction of the laser with titanium is further investigated by monitoring the plume produced from the laser-irradiated zone using optical emission spectroscopy. OES signals were collected by producing circular patterns of a fixed set diameter of 750 µm with the same conditions as depicted in Figure 4 and Figure 6. The plume was monitored from an area with a diameter of approximately 1 mm near the titanium’s surface at the center of the circular pattern, and its spectral emission was analyzed. Figure 10 shows the optical emission spectrum of the plume generated during the creation of the circular pattern on the titanium’s surface at a wobble speed of 900 mm/s and a laser peak power of 700 W in the spectral region between 481 and 545 nm. The optical emission spectrum is dominated by neutral titanium atomic transitions (Ti I). The most dominant emission lines occur at 488.5 nm, 489.9 nm, 498.2 nm, 499.1 nm, 499.9 nm, 500.7 nm, 501.4 nm, 502.5 nm, 503.6 nm, 503.9 nm, and 522.5 nm, corresponding to the transitions (3d3(2G)4p y 36 → 3d3(2G)4s a 3G5), (3d3(2G)4p y 35 → 3d3(2G)4s a 3G4), (3d3(4F)4p y 56 → 3d3(4F)4s a 5F5), (3d3(4F)4p y 55 → 3d3(4F)4s a 5F4), (3d3(4F)4p y 54 → 3d3(4F)4s a 5F3), (3d3(4F)4p y 53 → 3d3(4F)4s a 5F2), (3d2(3F)4s4p(3P°) z 31 → 3d24s2 a 3F2), (3d24s(4F)5s e 5F5 → 3d2(3F)4s4p(3P°)z 56), (3d3(4F)4p w 34 → 3d3(4F)4s b3F3), (3d2(3F)4s4p(3P°) z32 → 3d24s2 a 3F3), and (3d24s(4F)5s e 5F5 → 3d2(3F)4s4p(3P°) z 55), respectively [25]. Figure 11a shows the optical emission spectra at different wobble speeds for a fixed laser peak power of 250 W, and Figure 11b depicts the variation in intensity of emission lines at 488.5 nm, 498.2 nm, 503.6 nm, and 522.5 nm marked in Figure 11a with the wobble speed. As the speed decreases, the intensity of the emission lines increases. The decreasing behavior of the emission intensity with the increase in the wobble speed shown in Figure 11b follows a similar trend to that shown in Figure 9a, which depicts the variation in penetration depth with the wobble speed. Figure 12a shows the optical emission spectra of the plume produced during the laser’s interaction with titanium at different powers, ranging from 150 to 700 W, with a fixed wobble speed of 900 mm/s. Figure 12b shows the variation in the intensity of emission lines at 488.5 nm, 498.2 nm, 503.6 nm, and 522.5 nm marked in Figure 12a with the laser peak power. The inset in Figure 12b shows the variation in the intensity of the emission line at 488.5 nm with the laser peak power as a representative, where the red solid lines represent the linear fits to the data points (■). The variation shows a transition around 400 W, where the variation in track width and penetration depth with laser peak power also exhibits a transition, as shown in Figure 7 and Figure 9b, respectively. The intensity of the emission line at 488.5 nm increases at a slower rate up to 400 W and at a faster rate beyond 400 W, as depicted in the inset of Figure 12b.
The plume temperature (T) is determined by using the Boltzmann plot method under the assumption of local thermodynamical equilibrium (LTE):
l n I k i λ k i g k A k i = E k k B T + C
where C is a constant; k and i represent the upper and lower levels, respectively; I k i is the emission line intensity at a wavelength of λ k i ; g k is the statistical weight of the upper level; A k i is the transition probability; E k is the energy of the upper-level k; and k B is the Boltzmann constant. The following Ti I transitions have been considered to estimate the plume temperature, which occur at 484.1 nm: [3d2 (1D)4s4p(1P0) y 1 D 2 0 → 3d2 4s2 a 1D2], 485.6 nm [3d3 (2H)4p z 3 I 7 0 → 3d3 (2H)4s a 3H6], 488.5 nm [3d3 (2G)4p y 3 H 6 0 → 3d3 (2G)4s a 3G5], 491.4 nm [3d3 (2G)4p y 3 H 4 0 → 3d3 (2G)4s a 3G3], 506.5 nm [3d2 (3F)4s4p (3P0) z 3 D 3 0 → 3d2 4s2 a 3F4], 517.3 nm [3d2(3F)4s4p (3P0) z 3 F 2 0 → 3d2 4s2 a 3F2], and 519.3 nm [3d2 (3F)4s4p (3P0) z 3 F 3 0 → 3d2 4s2 a 3F3]. The value of T is calculated from the slope 1 k B T of the plot between E k and l n I k i λ k i g k A k i obtained using the spectral response corrected aforesaid Ti I emission lines. The NIST database is referred to for the required parameters [25]. Figure 13a shows the Boltzmann plot for a laser peak power of 450 W and wobble speed of 900 mm/s, where the red solid line is the linear fit to the data points (■), with R2 > 0.99, which provides a plume temperature T of about 8900 ± 170 K. Figure 13b shows the variation in plume temperature with laser peak power at a fixed wobble speed of 900 mm/s, which shows a transition at about 400 W similar to the trend for the variation in the penetration depth with laser peak power as shown in Figure 9b. The red solid lines in Figure 13b represent the linear fits to the data points, with slopes of 5.30 ± 0.60 and 0.95 ± 0.30 below and above the transition, respectively, which occurs at 400 W. The plume temperature at various wobble speeds, ranging from 100 to 1000 mm/s for a fixed laser peak power of 250 W, was determined, which showed insignificant variation with the wobble speed, with a mean of 7800 K and a standard deviation of 220 K.

4. Discussion

The interaction process between the laser and titanium has been extensively investigated using a setup comprising a fiber laser coupled with a wobble head. This configuration enables the production of different wobble geometries on the material’s surface. A circular pattern with a single turn was produced on the titanium’s surface by adjusting the laser’s pulse duration for different diameters, for a detailed examination of the laser-titanium interaction dynamics. As the diameter of the circular pattern decreases, the laser energy is confined to a smaller area, resulting in a higher local energy density and increased heat input. This localized heating enhances lateral heat diffusion. Consequently, the track width increases with a decreasing pattern diameter due to the greater thermal load within the confined region. The measured pulse duration of the laser deviated from the set pulse duration by a consistent amount across all the pulse durations used in this study. Wobble speed and laser peak power were systematically varied to assess their impact on three key aspects of the laser–titanium interaction: track width, penetration depth, and plume characteristics. The results of this comprehensive investigation revealed several significant trends and relationships between the processing parameters and the resulting material modifications. One of the significant findings was the inverse relationship between wobble speed and both track width and penetration depth. As the wobble speed was decreased from 1000 to 100 mm/s, a substantial increase in track width was observed, ranging from approximately 200 to 820 µm. This phenomenon can be attributed to the extended interaction time between the laser and the material at lower speeds, which facilitates a greater accumulation of heat that spreads the laser’s impact across the surface. Concurrently, the penetration depth exhibited a corresponding increase with a decreasing wobble speed. This observation aligns with the fact that a prolonged laser–titanium interaction allows for greater energy coupling to the titanium, resulting in a deeper penetration depth. The relationship between wobble speed and these dimensional parameters provides valuable insights into the process control and optimization of laser-based titanium processing. In addition to the effects of wobble speed, the laser peak power showed a significant influence on the interaction process. The results demonstrated a clear positive correlation between the laser peak power and both track width and penetration depth. As the laser peak power was increased from 100 to 700 W, the track width expanded from approximately 180 to 355 µm, and the penetration depth increased from about 260 to 800 µm with increase in laser peak power from 200 to 700 W. This trend is consistent with the fact that a higher energy input leads to more extensive material modifications and penetration. Moreover, a transition point was identified at approximately 400 W of laser peak power. At this point, the rate of increase in track width and penetration depth underwent a noticeable change. The track width on the titanium’s surface increased at a higher rate, whereas the penetration depth increased at a slower rate above this transition point compared to below it. This transition suggests a potential shift in the dominant impact on the surface or a fundamental alteration in the laser–material interaction dynamics at higher power levels. These transitions are of particular interest in laser processing research, as they often indicate the onset of different physical phenomena that can significantly influence the process outcomes and efficiency. Such peculiar behavior could be attributed to the shielding effect caused by the enhanced interaction of the laser beam with the plume at higher laser peak powers [26].
To gain a deeper insight into the laser–titanium interaction process, this study employed optical emission spectroscopy (OES) for plume analysis. The emission spectra obtained from the plume were dominated by neutral titanium atomic transitions, with the most prominent lines observed in the wavelength range of 481 to 545 nm. The intensity of these emission lines showed a clear dependence on both wobble speed and laser power. Decreasing the wobble speed and increasing the laser power both resulted in higher emission line intensities. This trend correlates well with the observed changes in track width and penetration depth, suggesting a strong link between the plume characteristics and the extent of material modification. The plume temperature, calculated using the Boltzmann plot method, revealed peculiar dependencies on the processing parameters, as depicted in Figure 13b. While the temperature showed a significant increase with a rising laser peak power, it did not show a significant variation across different wobble speeds, although there was a slight uptrend with a decreasing speed. This observation suggests that the plume temperature is primarily governed by power rather than the interaction time. Notably, the plume temperature exhibited a transition point at around 400 W of laser peak power, mirroring the trend observed in the penetration depth. For a detailed analysis, four emission lines at 488.5 nm, 498.2 nm, 503.6 nm, and 522.5 nm were chosen as representatives of the optical emission spectrum to study variations with wobble speed and laser peak power. The intensity of the emission lines at 488.5 nm, 498.2 nm, 503.6 nm, and 522.5 nm decreases with an increasing wobble speed, which follows the similar decreasing trend in track width and penetration depth with an increasing wobble speed. Although the emission lines show an increase in intensity with a decrease in wobble speed, the plume temperature does not exhibit a significant rise. Moreover, the decreasing speed widens the penetration depth profile, indicating evaporation from a wider area, which contributes to the increased intensity of the emission lines. The intensity of the emission lines at 488.5 nm, 498.2 nm, 503.6 nm, and 522.5 nm also shows increasing behavior with an increase in the laser peak power. However, the increasing trend has a transition at a laser peak power of about 400 W. The intensity of the emission lines increases at a slower rate below the transition point and at a higher rate above it, consistent with the variation in track width relative to the laser peak power. In contrast, penetration depth shows the opposite trend: it increases more rapidly below the transition point but at a slower rate above it. This suggests that, at higher powers, the more pronounced surface impact leads to an increase in track width, while a greater plume formation enhances the emission intensity and increases laser beam shielding. This shielding effect results in a reduced rate of increase in penetration depth as power continues to rise. This consistent correlation between the thermal effects observed in the material and the plume characteristics underscores the potential of OES as a valuable tool for real-time monitoring of the laser–titanium interaction process. The non-invasive nature of this technique makes it particularly attractive for industrial applications, where in-situ process monitoring could lead to improved control and quality assurance.

5. Conclusions

This investigation examined the interaction between a fiber laser and titanium, using a wobble head to produce circular patterns. This study focused on how laser peak power and wobble speed influence thermal and material responses and evaluated the diagnostic potential of optical emission spectroscopy (OES).
The key findings include the following:
  • Track width and penetration depth increase with a decreasing wobble speed and increasing laser peak power;
  • A critical transition point was identified at around 400 W of laser peak power, indicating a shift in the material’s response characteristics;
  • Plume temperature rises with increasing laser peak power, but its variation with wobble speed is negligible;
  • Emission line intensities from OES strongly correlate with the extent of material modification, suggesting the feasibility of predictive modeling using multivariate statistics.
These results highlight the intricate interplay between processing parameters and thermal effects during laser–titanium interaction. The demonstrated potential of OES for real-time monitoring paves the way for integrating feedback mechanisms into advanced manufacturing systems to enhance consistency, control, and reliability in laser-based fabrication.

Author Contributions

A.M.: Conceptualization, Methodology, Software, Validation, Formal analysis, Investigation, Data curation, Writing—original draft, Writing—review and editing. M.L.: Conceptualization, Supervision, Writing—review and editing, Project administration. All authors have read and agreed to the published version of the manuscript.

Funding

This research is partially funded by Innosuisse, the Swiss Innovation Agency through a project (No. 25818 PFNM-NM).

Data Availability Statement

The original contributions presented in this study are included in the article. Further inquiries can be directed to the corresponding author.

Conflicts of Interest

The authors declare no conflicts of interest.

References

  1. Brown, M.S.; Arnold, C.B. Fundamentals of Laser-Material Interaction and Application to Multiscale Surface Modification. In Laser Precision Microfabrication; Springer Series in Materials Science; Sugioka, K., Meunier, M., Piqué, A., Eds.; Springer: Berlin/Heidelberg, Germany, 2010; Volume 35, pp. 91–120. [Google Scholar] [CrossRef]
  2. Shin, Y.C.; Wu, B.; Lei, S.; Cheng, G.J.; Yao, Y.L. Overview of Laser Applications in Manufacturing and Materials Processing in Recent Years. J. Manuf. Sci. Eng. 2020, 142, 110818-1. [Google Scholar] [CrossRef]
  3. DePond, P.J.; Fuller, J.C.; Khairallah, S.A.; Angus, J.R.; Guss, G.; Matthews, M.J.; Martin, A.A. Laser-metal interaction dynamics during additive manufacturing resolved by detection of thermally induced electron emission. Commun. Mater. 2020, 1, 92. [Google Scholar] [CrossRef]
  4. Auwal, S.T.; Ramesh, S.; Yusof, F.; Manladan, S.M. A review on laser beam welding of titanium alloys. Int. J. Adv. Manuf. Technol. 2018, 97, 1071–1098. [Google Scholar] [CrossRef]
  5. Gao, X.-L.; Zhang, L.-J.; Liu, J.; Zhang, J.-X. A comparative study of pulsed Nd: YAG laser welding and TIG welding of thin Ti6Al4V titanium alloy plate. Mater. Sci. Eng. A 2013, 559, 14–21. [Google Scholar] [CrossRef]
  6. Yunlian, Q.; Ju, D.; Quan, H.; Liying, Z. Electron beam welding, laser beam welding and gas tungsten arc welding of titanium sheet. Mater. Sci. Eng. A 2000, 280, 177–181. [Google Scholar] [CrossRef]
  7. Li, M.; Xiao, R.; Zou, J.; Wu, Q.; Xu, J. Correlation between plume fluctuation and keyhole dynamics during fiber laser keyhole welding. J. Laser Appl. 2020, 32, 022010-1–022010-7. [Google Scholar] [CrossRef]
  8. Ahn, J.; Chen, L.; Davies, C.M.; Dear, J.P. Parametric optimisation and microstructural analysis on high power Yb-fibre laser welding of Ti–6Al–4V. Opt. Laser Eng. 2016, 86, 156–171. [Google Scholar] [CrossRef]
  9. Frey, C.; Beyel, A.; Wahl, J.; Twiehaus, T.; Olschok, S.; Hagenlocher, C.; Graf, T.; Reisgen, U. Interdependence of metal vapor plume and melt pool dynamics during laser beam welding under vacuum. J. Laser Appl. 2024, 36, 042008. [Google Scholar] [CrossRef]
  10. Mohanta, A.; Leistner, M.; Leparoux, M. Effect of plume dynamics on surface contamination during interaction of millisecond infrared fiber laser with titanium. Opt. Laser Eng. 2022, 153, 106996. [Google Scholar] [CrossRef]
  11. Pang, S.; Chen, X.; Shao, X.; Gong, S.; Xiao, J. Dynamics of vapor plume in transient keyhole during laser welding of stainless steel: Local evaporation, plume swing and gas entrapment into porosity. Opt. Laser Eng. 2016, 82, 28–40. [Google Scholar] [CrossRef]
  12. Wang, J.; Wang, C.; Meng, X.; Hu, X.; Yu, Y.; Yu, S. Study on the periodic oscillation of plasma/vapour induced during high power fiber laser penetration welding. Opt. Laser Technol. 2012, 44, 67–70. [Google Scholar] [CrossRef]
  13. Luo, Y.; Zhu, L.; Han, J.; Xie, X.; Wan, R.; Zhu, Y. Study on the acoustic emission effect of plasma plume in pulsed laser welding. Mech. Syst. Signal Process 2019, 124, 715–723. [Google Scholar] [CrossRef]
  14. Xie, L.; Shi, W.; Wu, T.; Gong, M.; Cai, D.; Han, S.; He, K. Effect of Dynamic Preheating on the Thermal Behaviour and Mechanical Properties of Laser-Welded Joints. Materials 2022, 15, 6159. [Google Scholar] [CrossRef] [PubMed]
  15. Li, H.; Ren, H.; Liu, Z.; Huang, F.; Xia, G.; Long, Y. In-situ monitoring system for weld geometry of laser welding based on multi-task convolutional neural network model. Measurement 2022, 204, 112138. [Google Scholar] [CrossRef]
  16. Cai, W.; Wang, J.Z.; Jiang, P.; Cao, L.C.; Mi, G.Y.; Zhou, Q. Application of sensing techniques and artificial intelligence-based methods to laser welding real-time monitoring: A critical review of recent literature. J. Manuf. Process 2020, 57, 1–18. [Google Scholar] [CrossRef]
  17. Kang, S.; Shin, J. In-situ monitoring of Al/Cu dissimilar laser welding process using optical emission spectroscopy (OES). Opt. Laser Technol. 2024, 176, 110893. [Google Scholar] [CrossRef]
  18. Mohanta, A.; Kung, P.; Thareja, R.K. Exciton-exciton scattering in vapor phase ZnO nanoparticles. Appl. Phys. Lett. 2015, 106, 013108. [Google Scholar] [CrossRef]
  19. Shah, L.H.; Khodabakhshi, F.; Gerlich, A. Effect of beam wobbling on laser welding of aluminum and magnesium alloy with nickel interlayer. J. Manuf. Process 2019, 37, 212–219. [Google Scholar] [CrossRef]
  20. Asirvatham, M.C.; Collins, S.; Masters, I. Laser wobble welding of steel to Aluminum busbar joints for Li-ion battery packs. Opt. Laser Technol. 2022, 151, 108000. [Google Scholar] [CrossRef]
  21. Mohanta, A.; AlAmeri, R.; Leparoux, M.; Matras, G.; Kasmi, C. In-situ investigation of laser interaction with AlMg5 and Ti6Al4V alloys using spectroscopy and high-speed imaging for laser manufacturing. Opt. Eng. 2024, 63, 064104-1–064104-11. [Google Scholar] [CrossRef]
  22. Mohanta, A.; Leparoux, M. Spectroscopic investigation of laser produced plasma of carbon nanotube reinforced AlMg5 metal matrix nanocomposites. Opt. Lasers Eng. 2019, 121, 37–45. [Google Scholar] [CrossRef]
  23. Li, X.; Xie, J.; Zhou, Y. Effect of oxygen contamination in the argon shielding gas in laser welding of commercially pure titanium thin sheet. J. Mat. Sci. 2005, 40, 3437–3443. [Google Scholar] [CrossRef]
  24. Hornik, P.; Sebestova, H.; Novotny, J.; Mrna, L. Laser beam oscillation strategy for weld geometry variation. J. Manuf. Process 2022, 84, 216–222. [Google Scholar] [CrossRef]
  25. National Institute of Standards and Technology (NIST). Atomic Spectra Database. Available online: https://www.nist.gov/pml/atomic-spectra-database (accessed on 23 May 2025).
  26. Gao, M.; Chen, C.; Hu, M.; Guo, L.; Wang, Z.; Zeng, X. Characteristics of plasma plume in fiber laser welding of aluminum alloy. Appl. Surf. Sci. 2015, 326, 181–186. [Google Scholar] [CrossRef]
Figure 1. Schematic representation of the experimental setup for creating circular patterns on the titanium’s surface and performing optical emission spectroscopy.
Processes 13 01761 g001
Figure 2. Temporal profiles of the laser at varying pulse durations.
Processes 13 01761 g002
Figure 3. Optical microscope images of the circular pattern on the surface of the titanium with varying diameters. The numbers in the top left corner of the images correspond to the set diameters of the respective circular patterns.
Processes 13 01761 g003
Figure 4. Optical microscope images of the circular patterns produced on the titanium’s surface at wobble speeds ranging from 1000 to 100 mm/s for a fixed laser peak power of 250 W.
Processes 13 01761 g004aProcesses 13 01761 g004b
Figure 5. Track width with outer and inner diameter of circular patterns on the titanium’s surface at wobble speeds ranging from 100 to 1000 mm/s for a fixed laser peak power of 250 W.
Processes 13 01761 g005
Figure 6. Optical microscope images of the circular patterns produced on the titanium’s surface at laser peak powers ranging from 100 to 700 W for a fixed wobble speed of 900 mm/s.
Processes 13 01761 g006
Figure 7. Track width with outer and inner diameter of circular patterns on the titanium’s surface at laser peak powers ranging from 100 to 700 W for a fixed wobble speed of 900 mm/s. The thick solid lines represent the linear fit to the data points (), which corresponds to the variation in track width with laser peak power.
Processes 13 01761 g007
Figure 8. Cross-sectional optical microscope image at a laser peak power of 250 W for a wobble speed of (a) 1000 mm/s, and (b) 100 mm/s. The dotted cut line on the circular patterns represents the line along which the circular patterns on the titanium’s surface were cut for cross-sectional analysis.
Processes 13 01761 g008
Figure 9. Variation in penetration depth with wobble speed at a fixed laser peak power of 250 W (a) and with laser peak power at a fixed wobble speed of 900 mm/s (b). The solid red lines in (b) represents the linear fit to the data points (■).
Processes 13 01761 g009
Figure 10. Optical emission spectrum of the plume generated during the creation of a circular pattern on the titanium’s surface at a wobble speed of 900 mm/s and a laser peak power of 700 W, in the spectral region of 481–545 nm.
Processes 13 01761 g010
Figure 11. (a) Optical emission spectra of the plume generated during the creation of a circular pattern on the titanium’s surface at different wobble speeds ranging from 100 to 1000 mm/s at a laser peak power of 250 W, in the spectral region of 481–545 nm. (b) The variation in intensity of emission lines at 488.5 nm, 498.2 nm, 503.6 nm, and 522.5 nm marked by arrows in (a) with the wobble speed.
Processes 13 01761 g011
Figure 12. (a) Optical emission spectra of the plume generated during the creation of circular patterns on the titanium’s surface at different laser peak powers ranging from 150 to 700 W at a fixed wobble speed of 900 mm/s, in the spectral region of 481–545 nm. (b) The variation in intensity of emission lines at 488.5 nm, 498.2 nm, 503.6 nm, and 522.5 nm marked by arrows in (a) with the wobble speed. The inset in (b) shows linear fits (red solid lines) to the variation in intensity of the emission line at 488.5 nm with laser peak power (■).
Processes 13 01761 g012
Figure 13. (a) Boltzmann plot between Ek and l n I k i λ k i g k A k i to determine the plume temperature at a laser peak power of 450 W and wobble speed of 900 mm/s. (b) Variation in plume temperature with laser peak power at a fixed wobble speed of 900 mm/s.
Processes 13 01761 g013
Disclaimer/Publisher’s Note: The statements, opinions and data contained in all publications are solely those of the individual author(s) and contributor(s) and not of MDPI and/or the editor(s). MDPI and/or the editor(s) disclaim responsibility for any injury to people or property resulting from any ideas, methods, instructions or products referred to in the content.

