Abstract
Laser cutting processes entail the cutting of metal sheets by the emission of a laser source that melts the material along defined paths, potentially generating incidental metal nanoparticles (IMNPs). These particles have been associated with genotoxicity, oxidative stress, and pro-inflammatory responses. However, quantitative data on IMNP emissions remain limited. This study assessed IMNP emissions from CO2 and fiber laser cutting through two monitoring days at a high-precision metalworking facility in Italy. The first day dealt with environmental monitoring, while the second included both personal and environmental monitoring. Personal sampling consistently indicated elevated particle number concentrations and lung-deposited surface area, with average values reaching up to five times the background level (161,960 n/cm3) and peak concentrations as high as 2,781,962 particles/cm3. Environmental concentrations increased significantly only during CO2 stainless steel cutting (95,670 n/cm3). Depending on the process, 73–89% of the emitted particles were <300 nm, with substantial enrichment in the nanoparticle fraction. Emission profiles varied by laser source, metal, and sheet thickness, with the highest concentrations recorded during CO2-laser cutting of stainless steel. These findings provide preliminary evidence of occupational exposure to IMNPs during laser cutting and highlight the need for systematic exposure assessments to quantify the potential occupational health risk.
1. Introduction
Laser cutting is extensively utilized in the industrial sector due to its ability to produce precise and cost-effective cuts in metal materials [1]. The process operates by focusing a high-power, coherent, monochromatic laser beam onto the surface of a workpiece, where the absorbed energy induces localized melting and vaporization, thereby enabling the cut formation [2]. Compared to conventional cutting methods, laser cutting offers significant advantages, including faster processing speeds, micrometer-level precision, and high repeatability [3].
Currently, the most commonly used laser sources are CO2, fiber, and yttrium aluminum garnet [4].
Fiber lasers offer several advantages, including high-precision cutting, elevated output power, a waveguide structure with high power conversion efficiency, low operating threshold, excellent output beam quality, high reliability, long-term stability, and reduced operating costs. As a result, fiber lasers have increasingly replaced CO2 lasers as the predominant technology in many applications [4].
Laser cutting is widely employed across various industrial sectors (such as automotive, aerospace, electronics, and construction), for the production of components at multiple scales [5]. These applications require the capability to cut metals of different thicknesses and types, including stainless steels, low carbon steels, aluminum, low alloy steels, copper alloys. Each of these materials necessitates specific ranges of laser power and energy density for effective processing.
The interaction between high thermal energy and metals has been extensively documented to generate incidental metal nanoparticles (IMNPs) in several metalworking processes including additive manufacturing and welding [6,7,8,9,10,11]. Concerning cutting processes, studies demonstrated and characterized IMNP emissions from plasma cutting systems [12,13]. However, despite the widespread adoption of laser cutting, only one study to date has provided qualitative and quantitative assessment of IMNP emissions associated to this technique [14].
According to the standard ISO/TR 18401:2017, nanoparticles (NPs), are defined as particles with all external dimensions smaller than 100 nm [15]. Due to their nanoscale size, NPs can reach the lower airways, including the gas exchange region, and demonstrate a high penetration potential into the systemic circulation, an effect that is inversely correlated with their dimensions [16,17,18].
Metal-based NPs exhibit toxicity through a dual mechanism: one resulting from the intrinsic toxicity of their constituent metal elements, and the other related to their physical properties, such as size, shape, and surface area [19]. Their primary mechanisms of action include genotoxicity, oxidative stress, and inflammation [20,21].
Notably, metal NPs have been demonstrated to induce oxidative stress either directly, through reactive oxygen species (ROS) generation via a Fenton-like reaction, or indirectly, by activating the cell’s redox mechanism [22,23]. Additionally, metal NPs showed the capability to disrupt the body’s metal homeostasis [24].
Metals are generally classified into two main categories: ferrous and non-ferrous. Ferrous metals include iron, manganese, chromium, and their respective alloys, whereas non-ferrous metals are further categorized into heavy, light, noble, and rare metals [25]. IMNPs generated during high-energy density processes are predominantly composed of ferrous and/or heavy metals [26].
Heavy metals are known for their ability to interact with and inhibit human proteins and enzymes. They tend to bioaccumulate in the human body, potentially leading to chronic toxicity as well as damage to tissues and vital organs [27]. A growing body of research has identified IMNPs as a potential health risk factor for the exposed subjects [28]. Studies applying in silico models demonstrated macrophage toxicity [29], while in vitro experiments using lung cell models highlighted potential cytotoxicity and inflammatory responses [30].
Due to the NPs physicochemical characteristics, traditional mass-based environmental hygiene approaches are inadequate for a reliable risk assessment. Indeed, compliance with the available standard occupational limit values based on gravimetric analysis does not provide a reliable evaluation of workplace safety in the context of nanoparticle exposure [31].
Nowadays, no specific international regulations nor occupational exposure limits for nanoparticles are available at a European level, and only provisional reference values based on material density are available. The Nanosafety Research Centre of the Finnish Institute of Occupational Health (FIOH) proposed benchmark target concentrations of 20,000 particles/cm3 for metals with a density greater than 6 g/cm3 and 40,000 n/cm3 for those with lower density, calculated as 8-h time weighted average concentration. These values have subsequently been adopted by both Germany and the Netherlands [31,32,33]. In this context, presenting results from field monitoring campaigns dealing with processes releasing IMNPs is strategic for building a foundational knowledge base to support the definition of benchmarks and reference exposure values. Furthermore, the potential health impact associated with metal NPs underscores the importance of characterizing operator exposure during industrial processes that may release IMNPs. In the absence of established standards, identifying potential risks requires the definition of exposure benchmarks tailored to specific metal manufacturing industries.
Despite its widespread use and reliance on high-energy input, laser cutting remains underexplored in terms of nanoparticle emission monitoring. While the process likely results in the release of nanoparticles, the current literature lacks sufficient quantitative data to inform reliable risk assessments.
Therefore, the objective of this study is to conduct a quantitative evaluation of particles and NP release from laser cutting processes, under real conditions in an industrial setting. This study deals with both environmental and personal monitoring conducted on two types of laser cutting systems, namely CO2 and fiber lasers. The monitored processes, representative of the usual company routine, focused on cutting metal sheets of different materials (iron-based and aluminum alloys) and thicknesses. The monitoring results provide an initial understanding of potential exposure to metal and metal oxide NPs of laser cutting operators and serve as a preliminary benchmark for risk assessment.
2. Materials and Methods
To assess and characterize the IMNP emissions resulting from CO2 and fiber laser cutting processes, a two-day monitoring campaign was conducted in a manufacturing facility in Northern Italy, which is specialized in high-precision sheet metal processing for a variety of applications. On the first day (September 2024), environmental monitoring was carried out to evaluate emissions during normal operations. On the second day, (November 2024), both environmental and personal exposure monitoring were conducted.
2.1. Workspace and Features of Laser Cutting Devices
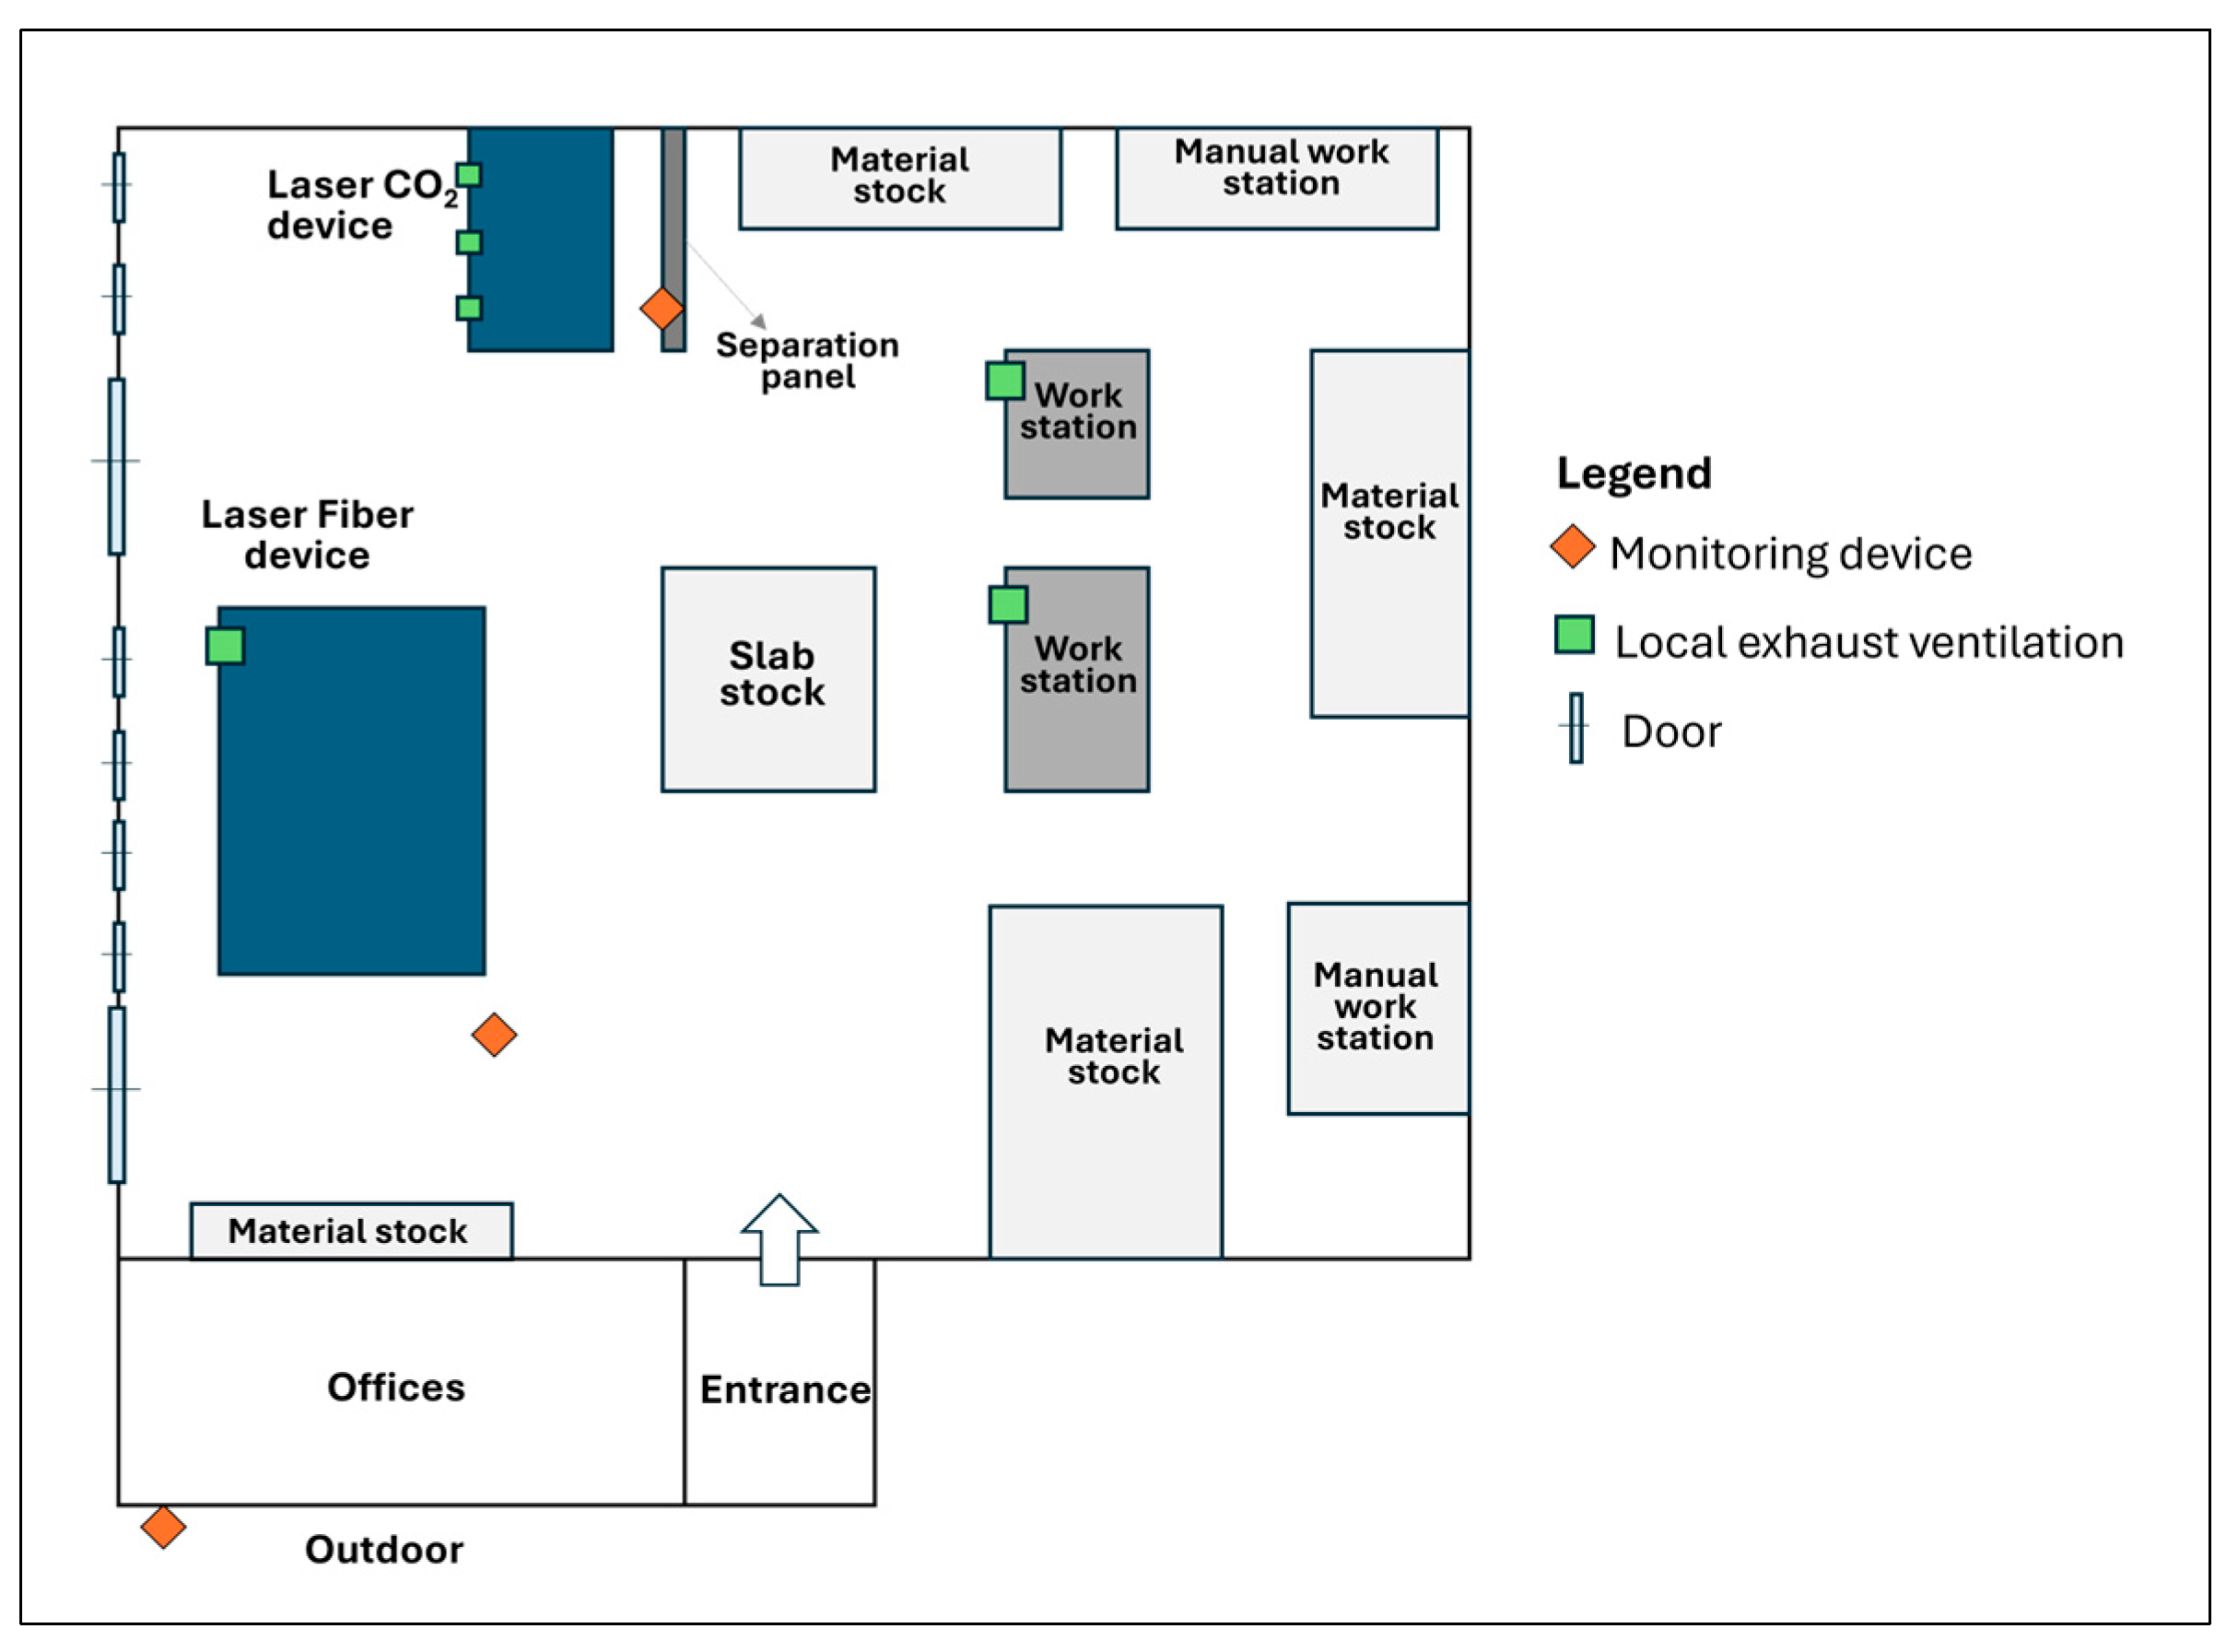
The monitored workspace is open-plan, divided according to the manufacturing activities performed, including laser cutting, welding, folding, and turning. The area is equipped with a general ventilation system providing an airflow of 3000 m3/h and is connected with the external environment with two forklift-access hatches and two emergency exits (Figure 1).

Figure 1.
Characteristics of the work environment and position of the monitoring devices.
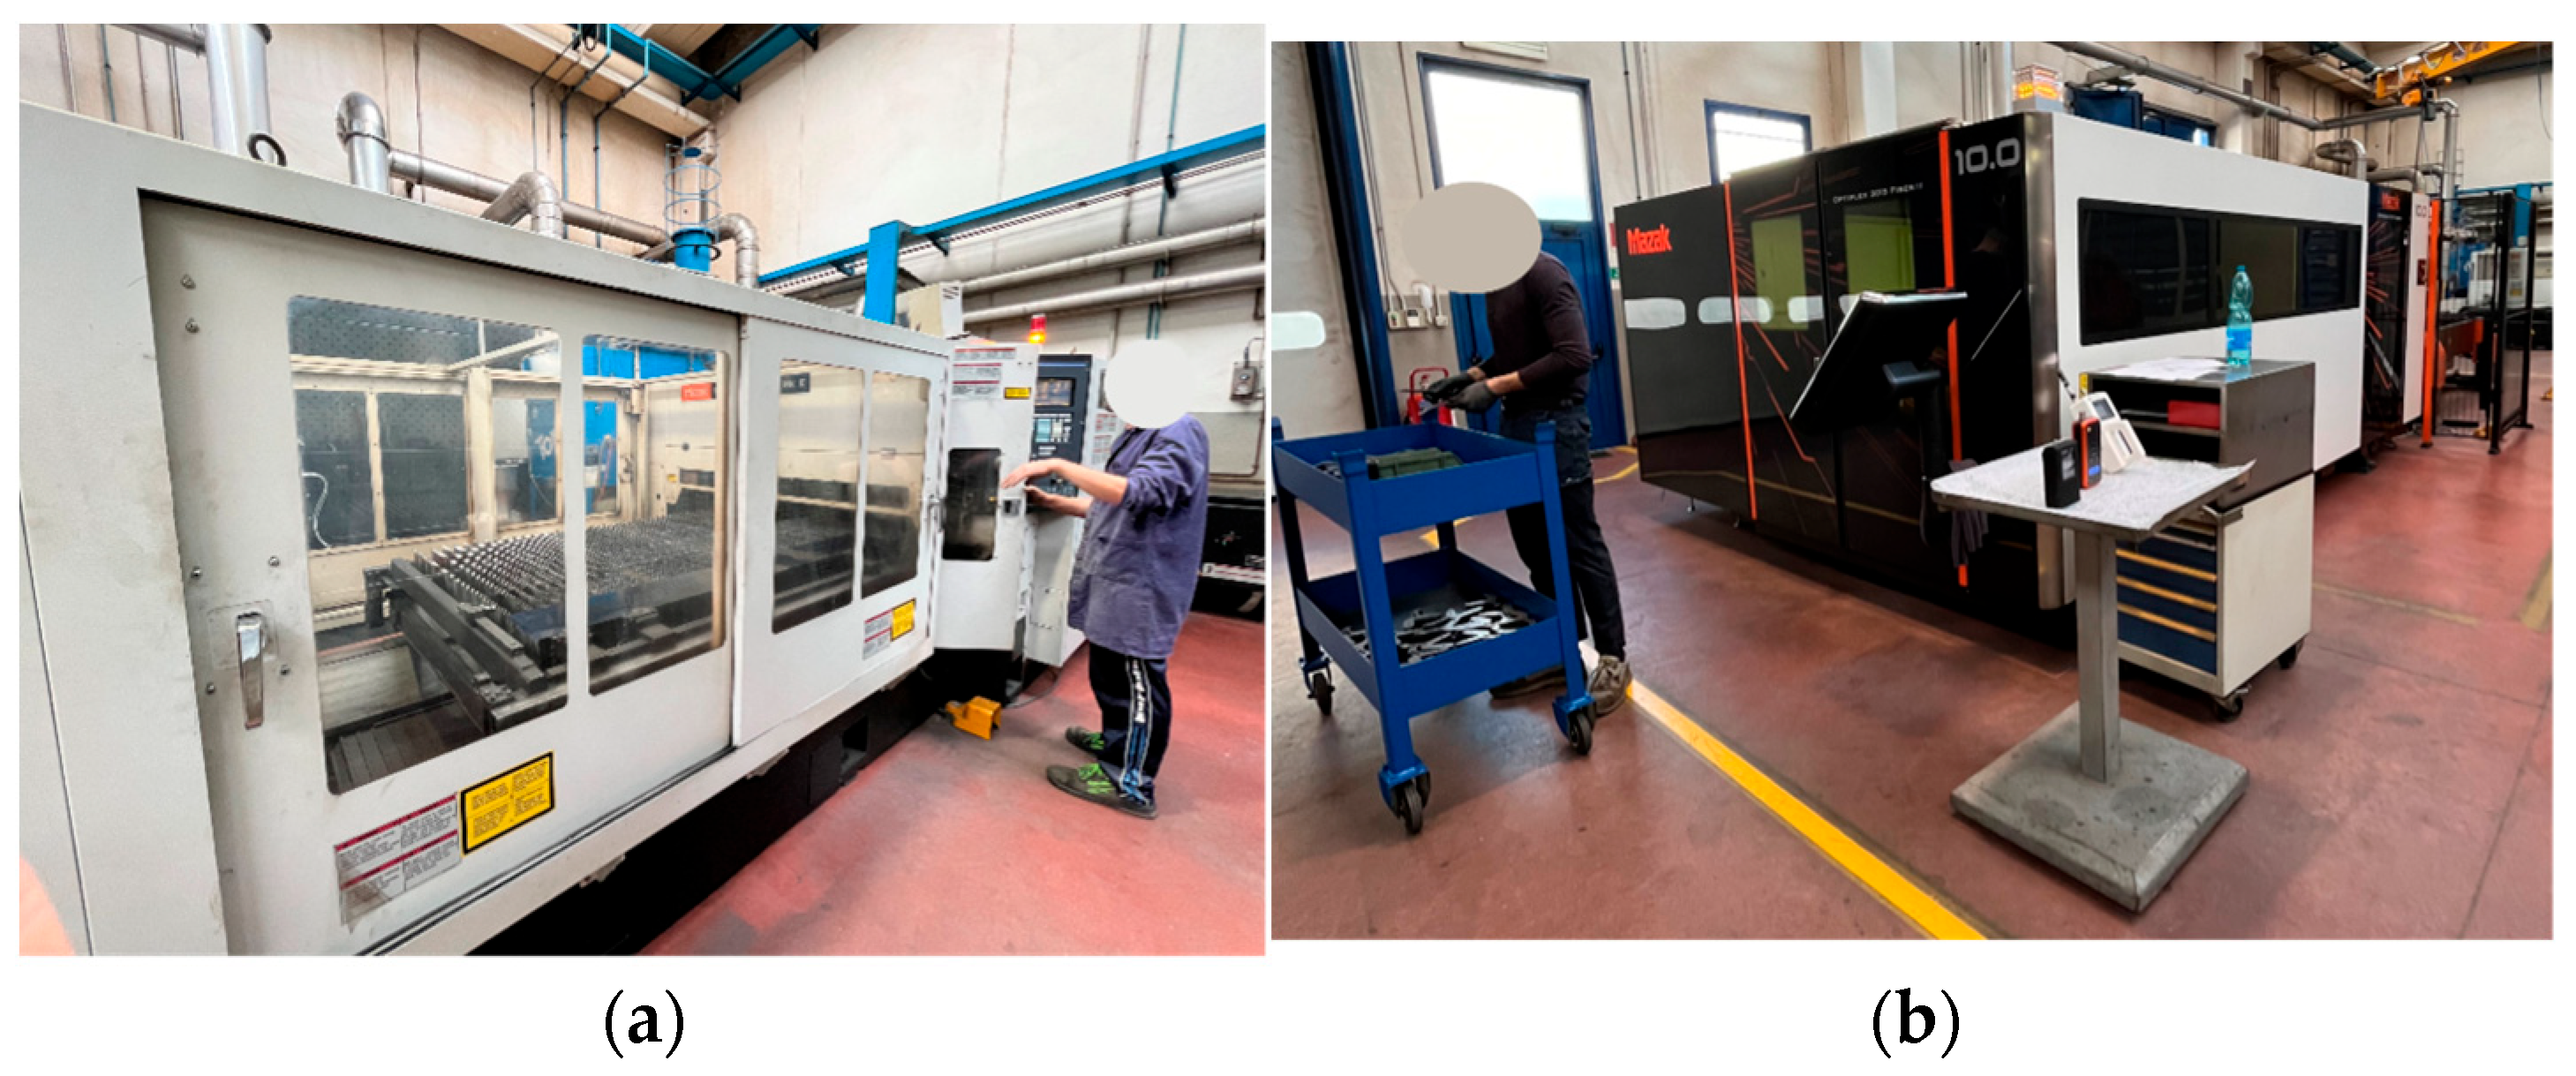
The campaign focused on two laser cutting machines, both produced by the same manufacturer. The first is a CO2 laser cutting machine equipped with a local exhaust ventilation (LEV) system set to an air change rate of 3000 m3/h. This machine presents an open-roof design, a large side-access door, and a smaller adjacent door near the control panel (Figure 2a). The second is a fiber laser cutting machine, which operates within a fully enclosed chamber with a local exhaust aspiration delivering a constant airflow of 5000 m3/h.

Figure 2.
Monitored laser cutting devices: (a) CO2 laser device; (b) Fiber laser device.
However, when the laser is turned off, the machine can be opened from both the front and lateral sides. Its control panel is mounted externally and can be rotated to face either the front or the side of the machine (Figure 2b). Both laser cutting systems are capable of processing metal sheets of various types and thicknesses, and adjust their parameters (such as laser power, frequency, process gas pressure, cutting speed, etc.) according to specific cutting requirements.
2.2. IMNP Measurement
During both monitoring campaigns two direct-reading devices were employed: an electrical nanoparticle counter (DiSCMini) and an optical particle counter (Lighthouse). The Miniature Diffusion Size Classifier (DiSCMini—TESTO) measures NP concentration (up to 106 particles/cm3), average particle size (in the range 10–300 nm), and estimate LDSA with a time resolution of one air sample per second.
The Lighthouse 3016-IAQ (Lighthouse Worldwide Solutions) measures particle concentration in the 0.3 to 10 μm range across 6 different size channels (0.3, 0.5, 1.0, 2.5, 5.0, and 10.0 µm). It also records relative humidity and temperature, and the measurement time resolution accounts for 10 s per sample.
2.3. Measurements Implementation
On the first monitoring day (Day 1), all instruments were positioned 1.5 m from the laser cutting machines, near the access door of the cutting chambers. Four processes were monitored, two for each device. For the fiber laser system, the monitored processes included the following: galvanized steel 2 mm thickness (13 min), carbon steel 5 mm thickness. For the CO2 laser system: C70 steel 0.3 mm thickness (19 min) and stainless steel 0.8 mm thickness (23 min).
During the second monitoring campaign (Day 2), the Lighthouse device was again used for environmental monitoring and was positioned identically to Day 1, while the DiSCMini was employed for personal exposure monitoring and worn by the laser machine operators. On Day 2, the monitored processes included the followings:
Fiber laser cutting system:
- -
- Aluminum 1.5 mm; laser power 7000–9000 Watt; speed: 50,000–60,000 mm/min; frequency 1000 Hz; nitrogen pressure 10–12 bar; 43 min.
- -
- Satin-finished stainless steel with a plastic polymer film; 1 mm for the steel cut; power 6500–9000 Watt; speed: 60,000–68,000 mm/min; frequency 5000 Hz; nitrogen pressure 10 bar; 24 min.
CO2 laser device:
- -
- SAF (austenitic-ferritic) stainless steel 0.9 mm; laser power 500 Watt; frequency 250 Hz; speed 1000 mm/min; nitrogen pressure 1 bar; 30 min.
- -
- Stainless steel 2 mm; power 2500 Watt; frequency 500 Hz; speed 5000 mm/min; nitrogen pressure 8 bar; 20 min.
Indoor stationary background particle levels were measured for approximately 20 min prior to the start of each operational session during both campaigns. Outdoor background concentrations were assessed for the same time intervals. The nominal composition of the metal sheets used during the monitored processes are detailed in Supplementary Materials (Table S1). During all the monitored activities, the operators wore safety shoes, a work suit, and cut-resistant gloves while unloading processed materials.
3. Results
Data was collected during two monitoring campaigns conducted in September and December 2024, under representative conditions of routine company operations. Table 1 summarizes the monitoring characteristics for each of the analyzed processes.

Table 1.
Monitored processes and relative characteristics.
3.1. Environmental Monitoring
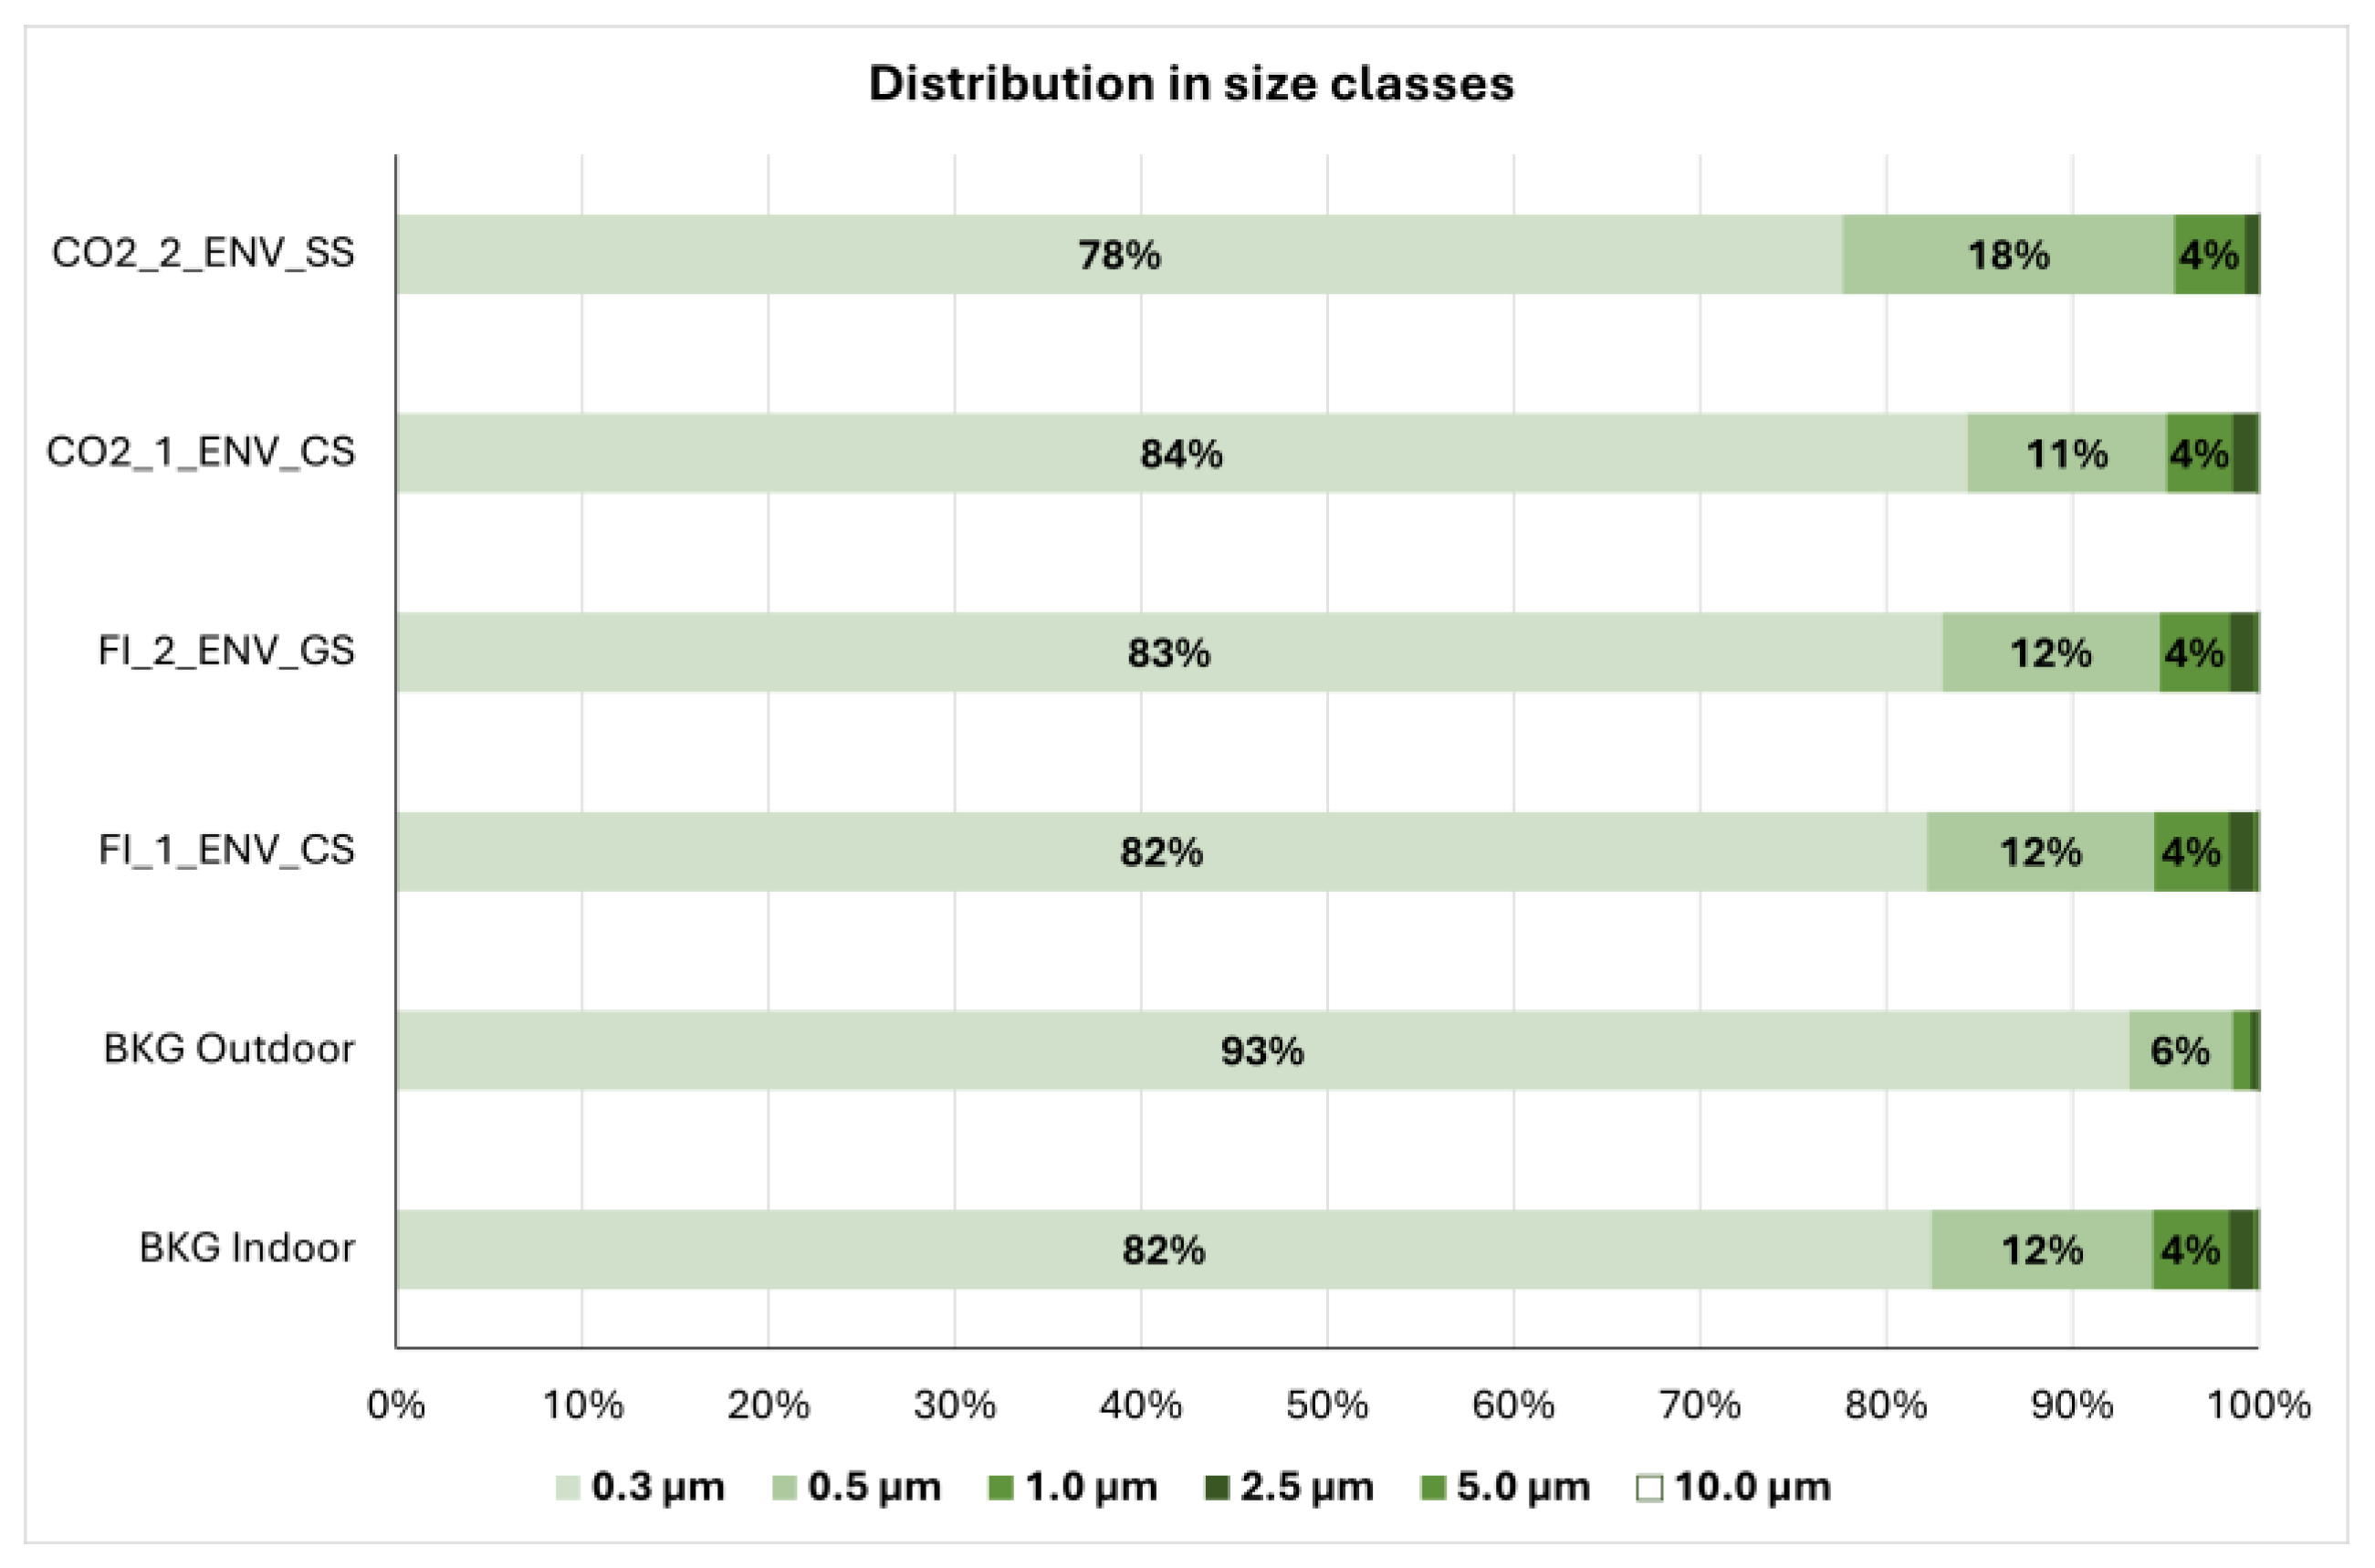
Analysis of the Lighthouse data indicated that the majority of the measured particles (ranging from 78% to 93% depending on the specific process), fell within the particle range <300 nm. Figure 3 illustrates the distribution of the particles emitted during the monitored processes in size classes in the range of 0.3–10 µm.
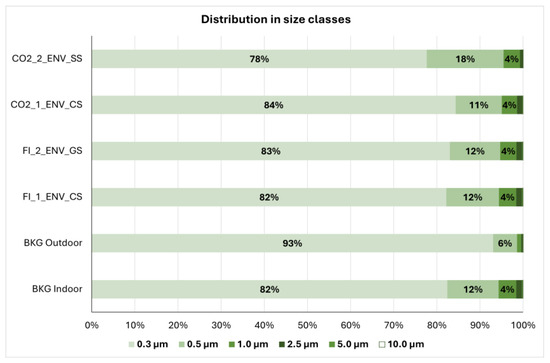
Figure 3.
Day 1—environmental monitoring, size distribution of particles 0.3–10 µm.
The average background concentration of particles < 300 nm, as detected by the Lighthouse, was 36 n/cm3. Among the monitored processes, the only one showing a clear increase with respect to the background in UPF concentration was CO2_2_ENV_SS, with an average of 82 n/cm3. In contrast, the lowest absolute UPF concentration was observed during the FI_2_ENV_GS process, with an average of 28 n/cm3. Detailed results are available in Supplementary Materials, Tables S2 and S3.
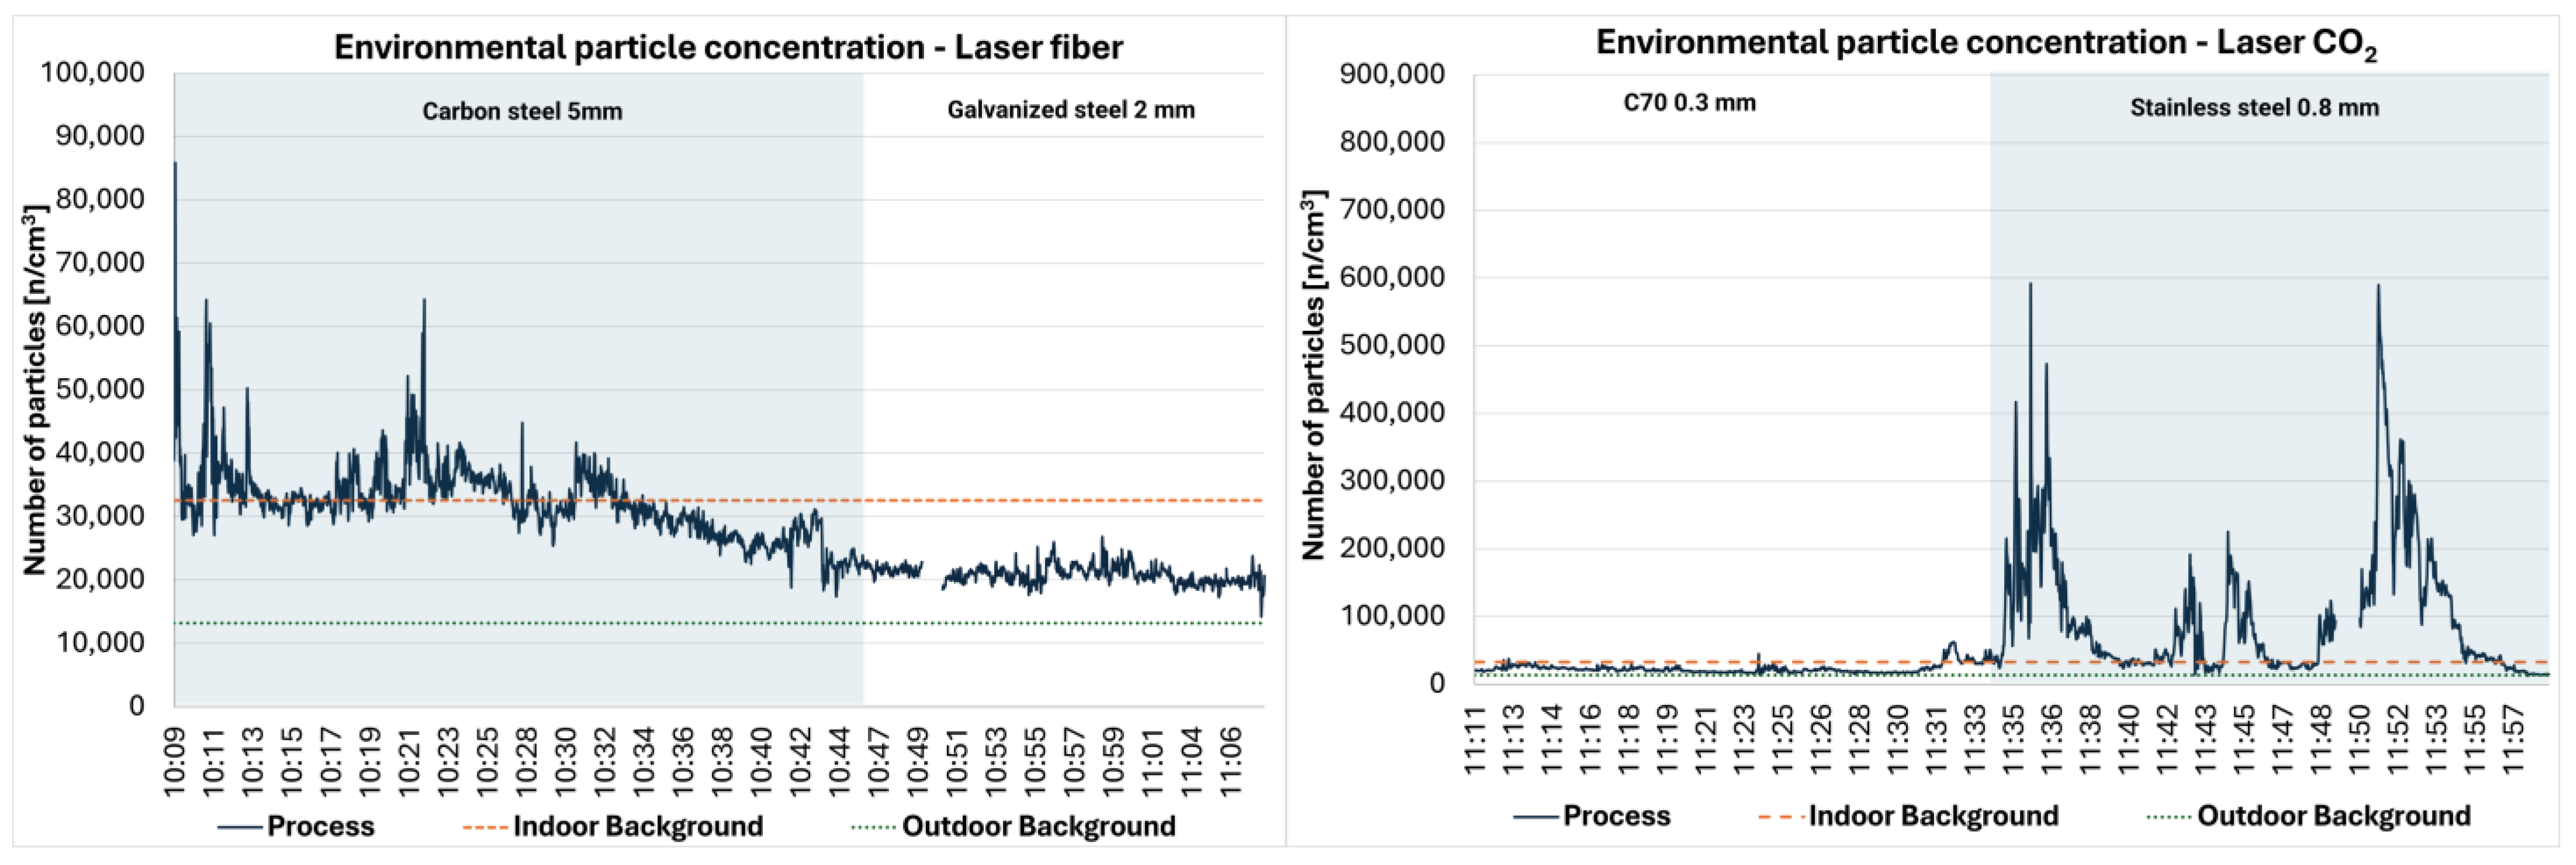
Table 2 summarizes the monitoring results from the first campaign using DiscMini device, while Figure 4 depicts the emission profiles for each process, comparing particle concentration during operations with internal and external average background levels.
Table 2.
Day 1: DiscMini monitoring results (NP 10–300 nm).

Figure 4.
Environmental monitoring pattern of UFP release for laser fiber and CO2 lasers.
The processes CO2_1_ENV_CS and FI_2_ENV_GS did not show an increase in average NP concentrations compared to indoor background levels (namely: 32,569 n/cm3). In contrast, the FI_ENV_1_CS process exhibited average NP levels comparable to the background concentration but showed significant and frequent peaks (85,873 n/cm3), particularly during the initial phase of the cutting operations. Notably, the CO2_2_ENV_SS process demonstrated persistently elevated NP levels, recording the highest average particle number (95,670 n/cm3 as measured by the DiscMini), maximal emissions peak (592,018 n/cm3), and the highest LDSA values (315.6 µm2/cm3). The smallest particle diameter was observed during the CO2_1_ENV_CS process, with an average of 52 nm and a minimum of 36 nm. During Day 1, indoor temperature ranged between 22.6 °C and 24.3 °C with an average of 23.6 °C. Relative humidity ranged from 45.6% to 49.8%, averaging at 47.5%.
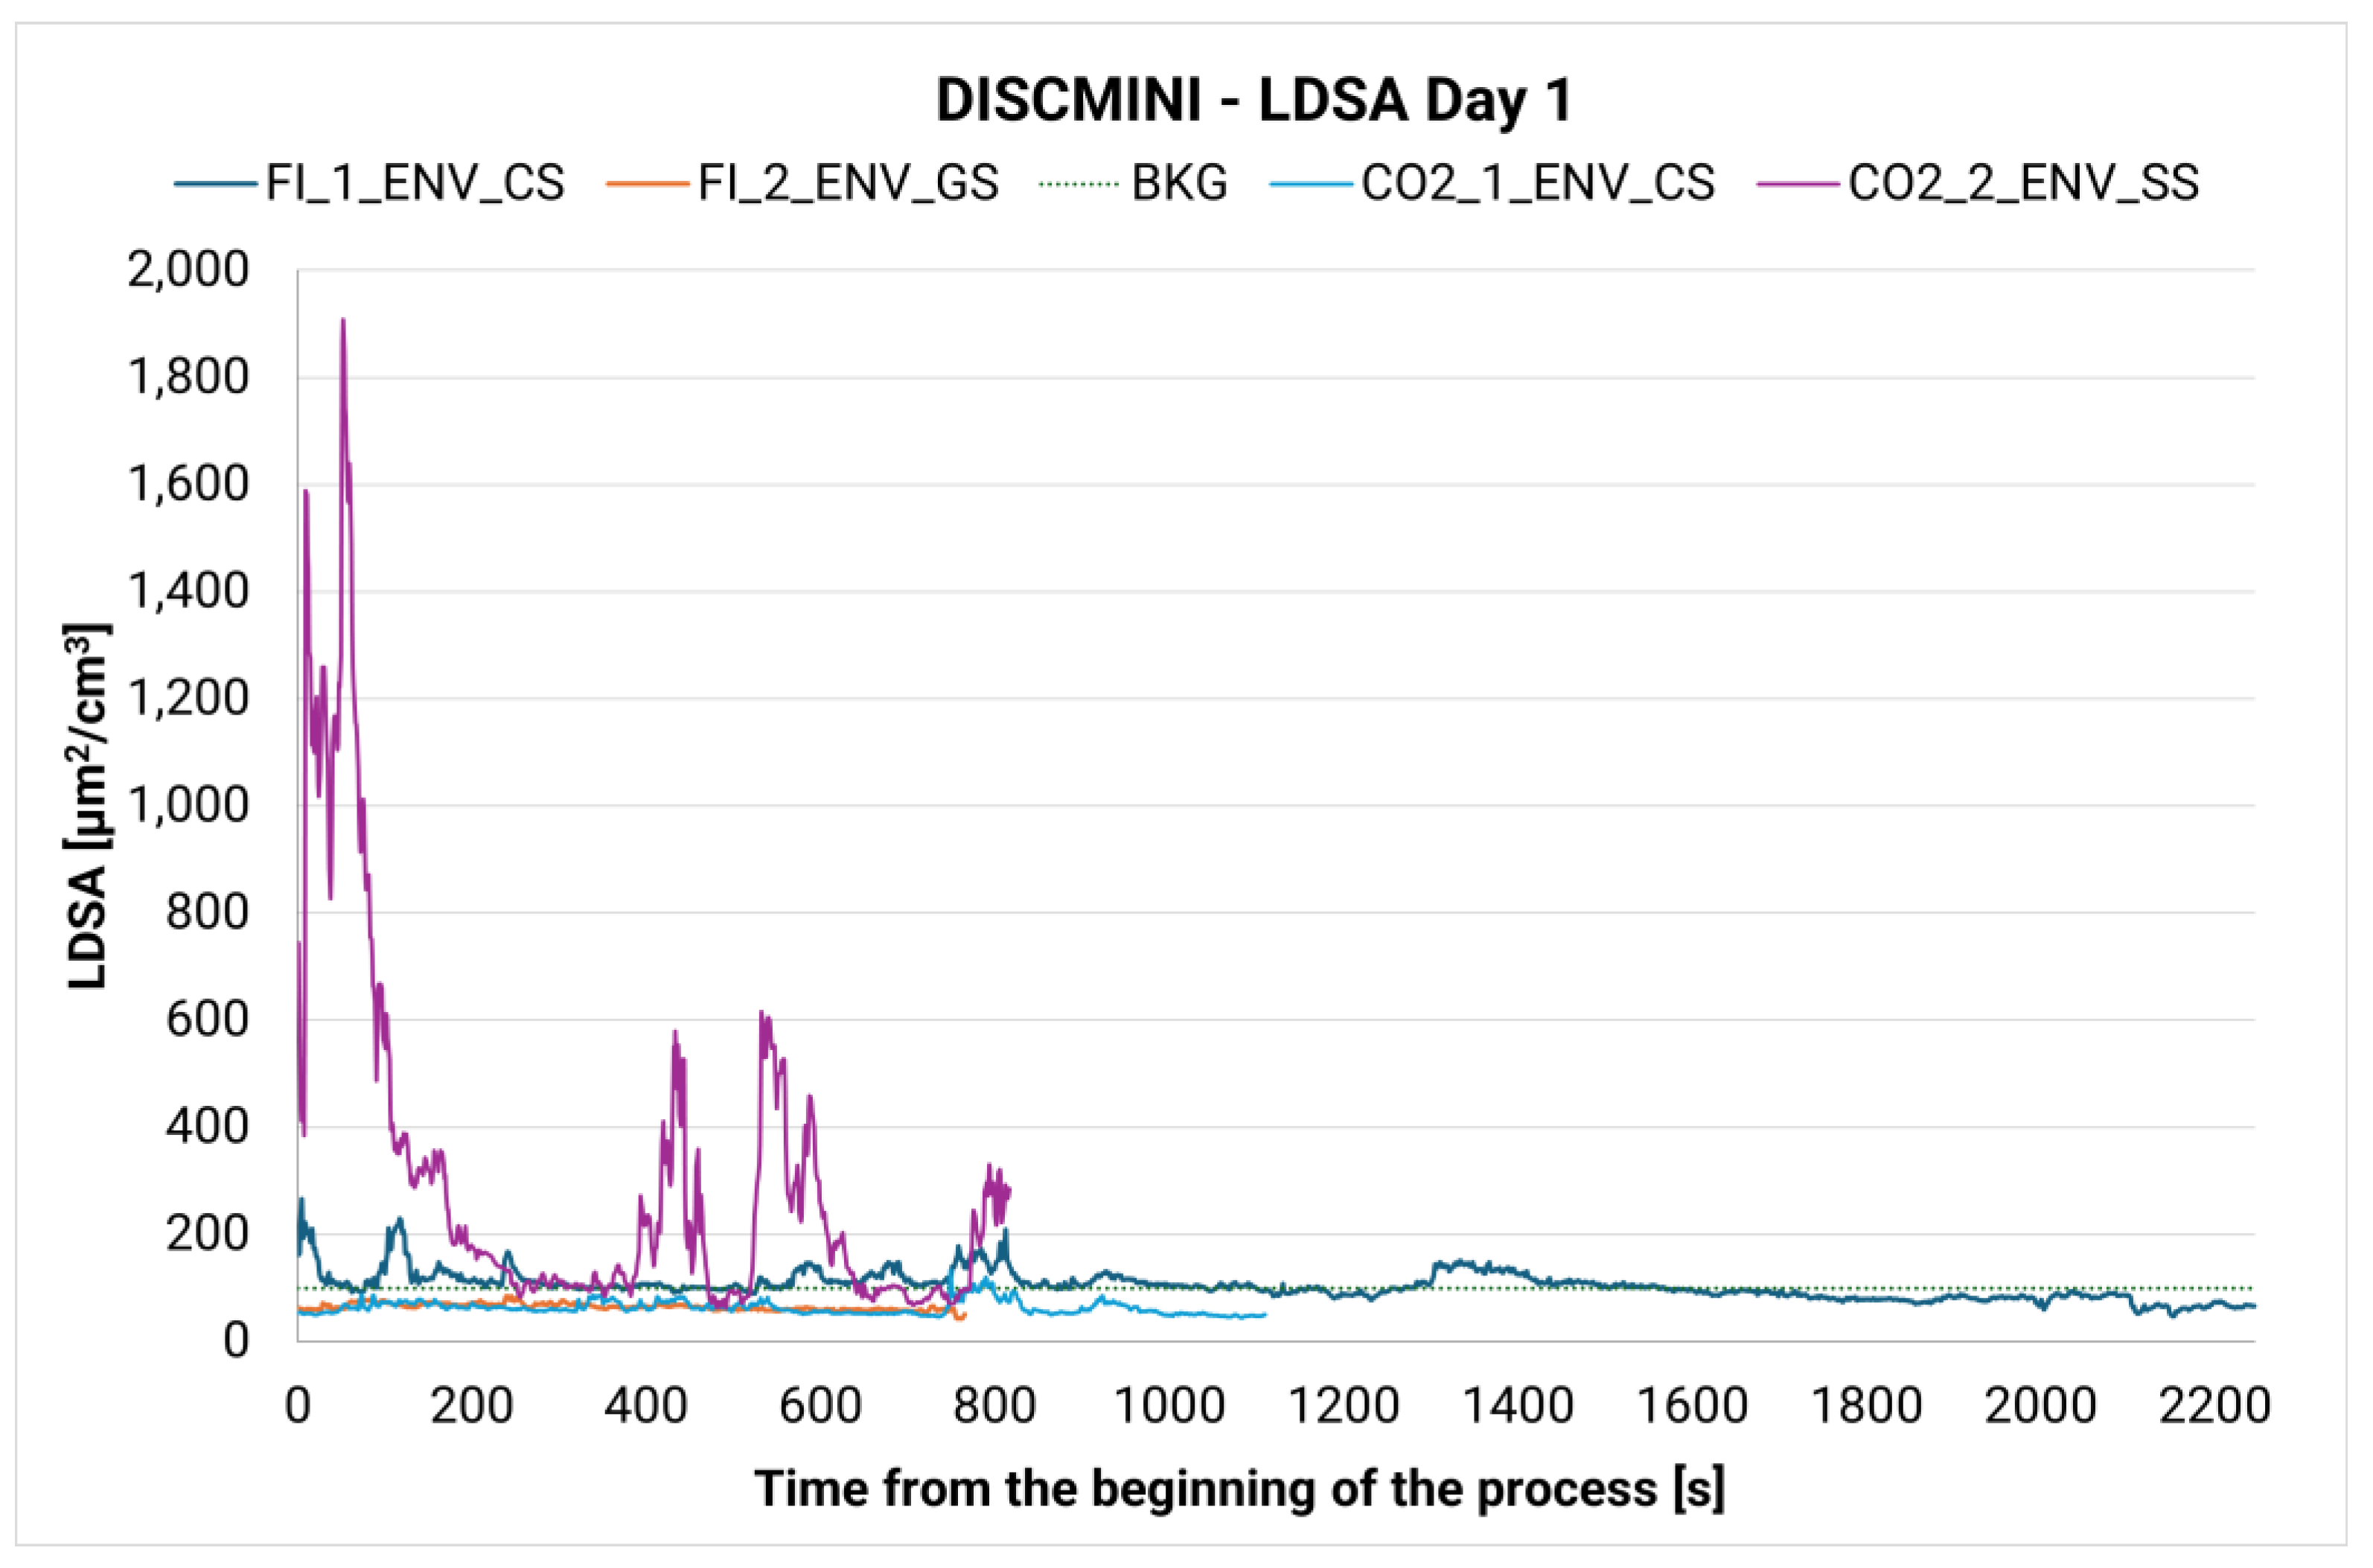
Figure 5 compares LDSA values from environmental monitoring. In line with NP number concentration, only CO2_2_ENV_SS exhibited LDSA levels persistently higher than background levels. In contrast, FI_1_ENV_CS showed notables LDSA spikes, although LDSA average levels remains comparable to the background (BKG). Neither CO2_1_ENV_CS nor FI_2_ENV_GS resulted in elevated average LDSA values compared to the background; in fact, they show lower levels, suggesting limited NP release during these processes.
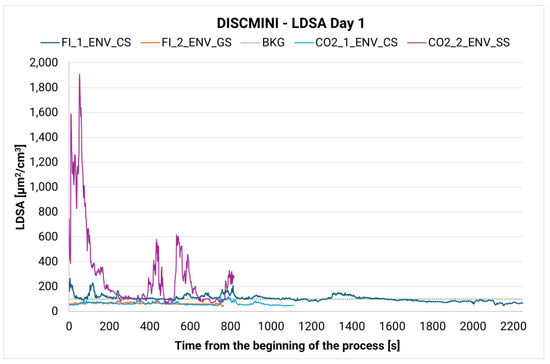
Figure 5.
Day 1—NP environmental monitoring. Comparison of LDSA index for the monitored processes.
3.2. Personal Monitoring
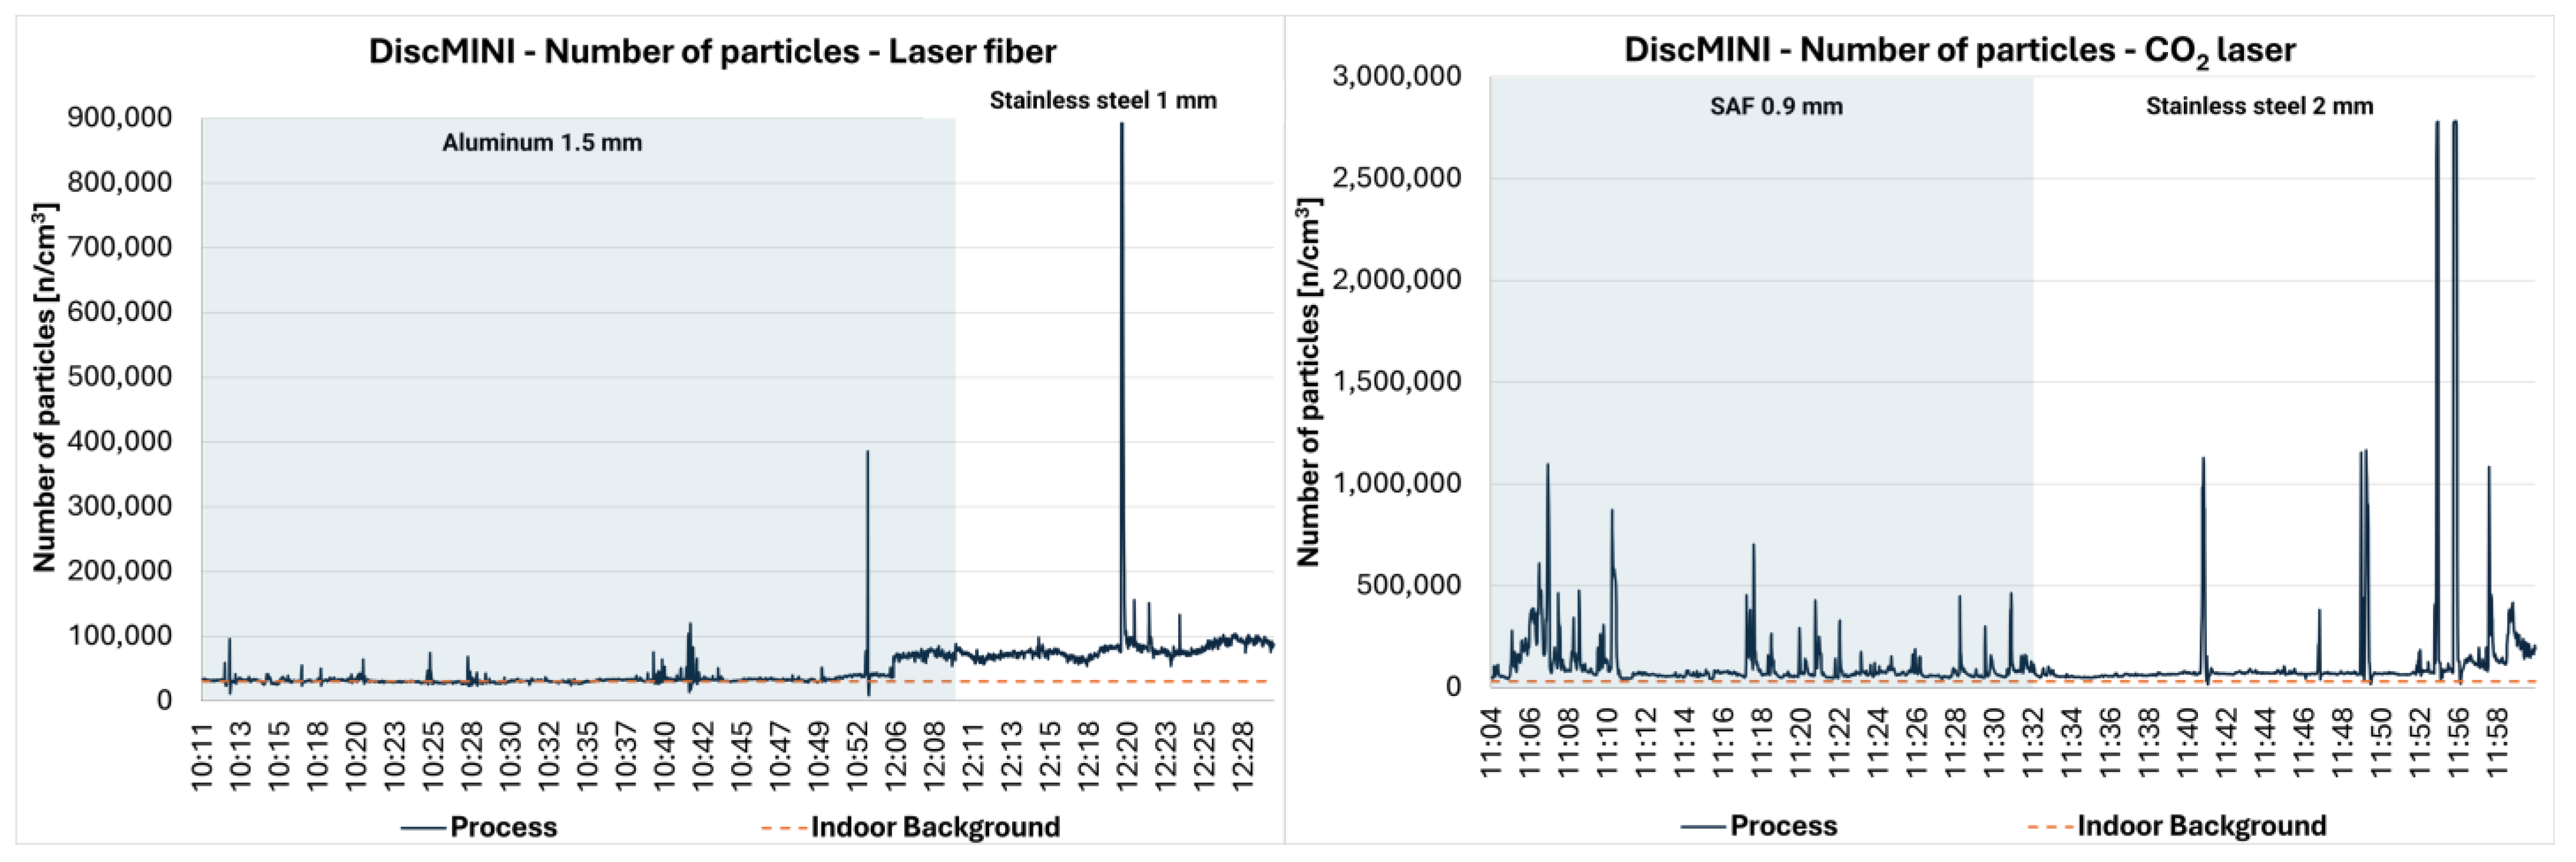
During the second monitoring campaign the DiscMINI was employed as a personal monitoring device. Considering the background concentration level (30,439 n/cm3), all processes exhibited elevated average particle number concentrations (Table 3). FI_3_PER_Al displayed the smallest relative increase (+8%) and was associated with the lowest, though still notable, peak values, reaching a maximal concentration of 385,269 n/cm3. In contrast, the highest particle concentration was observed during CO2_4_PER_SS, which exhibited an average level of 161,960 n/cm3—corresponding to a 5-fold increase relative to the background—and a maximal value of 2,781,962 n/cm3. Both FI_4_PER_SS and CO2_3_PER_SAF showed around a three-fold increase in average particle concentration compared to the background. However, FI_4_PER_SS was characterized by lower average values with respect to CO2_3_PER_SAF but recorded significantly higher peaks (2,661,747 n/cm3 vs. 1,096,557 n/cm3). Figure 6 illustrates the specific pattern of UFP release during the personal monitoring campaign.
Table 3.
Day 2: DiscMini monitoring results.
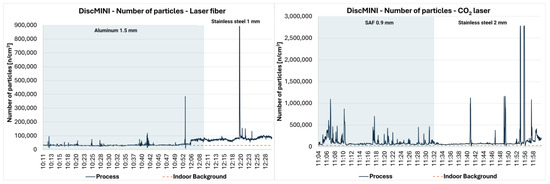
Figure 6.
Personal monitoring pattern of UFP release for laser fiber and CO2 lasers.
In terms of particle size, regardless of the process, the majority of the detected particles fell within the ultrafine range (<300 nm), comprising 88.5% to 89.65% of the total particle count. Additionally, nearly all particles (98–99%) exhibited diameters below 500 nm. Nevertheless, all operations resulted in an increase in average particle diameter with respect to the background, with the exception of CO2_3_PER_SAF which recorded the lowest mean particle size during the second monitoring campaign (48 nm). Indoor temperature varied from 16.4 °C to 19.9 °C with an average of 18.9 °C, while relative humidity ranged from 33.4% to 41.6% with an average value of 38%.
LDSA values were generally consistent with the average particle number concentrations. Compared to the background levels, only FI_3_PER_Al showed a modest increase of 16%, whereas the other processes exhibited more substantial increases: 2.5-fold for CO2_3_PER_SAF, 4-fold for FI_4_PER_SS, and 5-fold for CO2_PER_4_SS. Figure 7 shows a comparative overview of LDSA temporal trends observed during the personal monitoring campaign.

Figure 7.
Day 2—NP personal monitoring. Comparison of LDSA index for monitored processes.
Regardless of the specific laser processing parameters, stainless steel consistently exhibits the highest LDSA values when compared to other feedstocks. This indicates that among all the raw materials analyzed, stainless steel produces the greatest amount of surface area available for deposition within the lungs. Similarly, when comparing different technologies, CO2-based processes result in higher LDSA values than fiber laser (Figure 7).
4. Discussion
The indoor average NP background demonstrated consistent concentrations in both the measurement days (32,569 vs. 30,439 n/cm3). Personal monitoring indicated increased average particle levels and LDSA during all processes and feedstock employed, whereas environmental monitoring showed a notable increase in levels only during CO2_2_ENV_SS. Overall, the findings indicated greater average particle emissions from CO2 laser systems with respect to fiber lasers despite the use of lower laser powers. This discrepancy may be attributed to several factors, namely the nature of the process, the machine design, or the age of construction. Specifically, the monitored CO2 machine was predominantly open and older with respect to the fiber one. These observations are in line with the results of Eriksen et al. [14], which also reported higher particle emissions from CO2 lasers with respect to fiber ones.
Nevertheless, given that the fiber laser operations in the environmental monitoring campaign did not result in an increase in average NP concentration values and that CO2 only exhibited such an increase under specific conditions, the machine itself cannot be the sole determinant factor influencing NP emissions. Indeed, Eriksen Hammer et al. [14] showed that the quantity of particles generated during laser cutting depends not only on the technical specifications of the laser cutter, but also on feedstock nature and the thickness of metal sheet. They highlighted an inverse correlation between plate thickness and particle emissions. This observation is incongruent with the results of our measurements, wherein thinner stainless steel plates (0.8 mm) processed by the CO2 laser system produced higher average particle concentrations compared to thicker plates (2 mm) cut with the fiber laser device. Conversely, personal monitoring conducted as part of this study revealed greater particle emissions for 2 mm stainless steel than for 0.9 mm SAF steel when processed by the same laser device. These discrepancies may be attributed to variations in machine settings, particularly the laser power (respectively, 2500 W vs. 500 W), or to the distinct physical and chemical properties of SAF compared to stainless steel. As noted by Pena et al., excessive thermal energy can lead to metal vaporization rather than fusion, thereby leading to higher particle release [34].
In this study, DiscMINI data collected across all process types and feedstock materials revealed that stainless steel consistently exhibited a significant increase in average nanoparticle number compared to the background, whereas aluminum and C70 were characterized by isolated but notable peaks. These results are in agreement with the findings by Eriksen Hammer et al. [14] and Pena et al. [34], who proposed that feedstocks with lower thermal conductivity tend to produce higher particle emissions, as higher thermal conductivity enables greater energy concentration within a smaller material volume.
Furthermore, when comparing aluminum and stainless steel processed by fiber lasers under comparable conditions—such as laser power (7000–9000 W vs. 6500–9000 W) and speed (50,000/60,000 vs. 60,000 mm/min)—aluminum consistently exhibited lower particle emissions and peaks. This may be attributed to the greater thickness of the aluminum plate and the higher intrinsic thermal conductivity of the material.
All investigated processes exhibited distinct temporal emission patterns characterized by recurrent peaks, likely resulting from the intermittent activation of the laser beam during cutting operations. For CO2 laser processes, and particularly during personal exposure assessments, these peaks were frequently associated with the manual opening of the lateral cutting chamber door by the operator. Comparable concentrations were observed in both environmental and personal monitoring for the fiber laser system when stainless steel was not employed as feedstock. Conversely, CO2 laser operations led to markedly higher NP concentrations and more pronounced peaks in personal exposure monitoring. These findings are consistent with the layout of the operator’s workstation configuration, which, in this scenario, is positioned closer to the laser unit and requires frequent manual intervention through the cutting camera door to oversee the process.
All monitored processes exhibit significantly higher average values of NP number concentration, particle size, and LDSA, compared to the corresponding indoor background average values for the respective days, with the exception of CO2_1_ENV_CS (Supplementary Materials, Tables S4.1–S4.24). These results are largely influenced by the high number of available measurements and the resulting strong statistical power of the study, yet they support the relevance of the observed differences across the various processes.
As highlighted by Paulin et al. [8], no standardized or comprehensive data on average nanoparticle emission from laser cutting processes is available in the literature, thereby precluding any quantitative comparison. The existing literature reports are generally segmented by particle size ranges and fail to offer a holistic characterization of emission profiles. However, a sufficient amount of data is available for alternative high energy processes, such as welding and additive manufacturing.
Although these technologies exploit different technical principles rather than the laser cut, they similarly entail the use of a high-energy source to melt metallic feedstocks. This commonality has been widely recognized as the primary contributor for NP production, which has, in fact, been empirically validated across all three processes—laser cutting, 3D printing, and welding [8,35]. The present study demonstrates that variations in laser cutting system configurations—including technology type, feedstock composition, and sheet thickness—can lead to differences in both the magnitude and temporal patterns of nanoparticle emissions. Comparable emission dynamics were documented in additive manufacturing and welding processes [36].
When comparing the average particle emissions from the present studies with emission benchmarks for welding and 3D printing identified within the literature review [8], the results for stainless steel laser cutting are slightly lower than those documented for gas metal arc welding [37], comparable for tungsten inert gas welding [38] and higher than levels observed in manual metal arc welding [39]. With respect to 3D printing, stainless steel average particle number concentration measured during laser cutting were higher than those reported for laser powder bed fusion technology [40] but lower with respect to direct energy deposition ones [9].
Despite the limited number of studies quantifying exposure in terms of LDSA in the context of welding and 3D printing, the available data is relatively consistent. When comparing LDSA values from stainless steel laser with those from the literature, this process produces lower LDSA levels then gas metal arc welding [41], and comparable values for laser powder bed fusion printing with stainless steel [42].
At present, there are no formally established occupational exposure limits for nanoparticles. However, the Nanosafety Research Centre of the Finnish Institute of Occupational Health (FIOH), has proposed a reference target value of 20,000 particles/cm3 for metals with a density exceeding 6 g/cm3 and 40,000 for less dense materials, as 8-h weighted average concentrations [31,32,33]. The monitoring results from the present study show that the indoor background NP concentrations, measured prior to the initiation of the cutting of operations, already exceeded these recommended reference thresholds. Furthermore, the increase in average particle number concentration—with respect to background levels—was found to exceed 20,000 n/cm3 in several cases, specifically during stainless steel cutting by either fiber and CO2 laser technologies (under both personal and environmental monitoring) and during personal monitoring of SAF processed by CO2 laser (personal monitoring).
Nevertheless, several processes exhibited pronounced peak concentrations, especially during personal monitoring, with values reaching up to 2.7 × 10⁶ particles/cm3. These transient spikes may result in possible short-term exposure risks for the operators, even in processes where no significant increase in average particle number has been detected.
With regard to current safety protocols and the recommended personal protective equipment (PPE) for laser cutting technology, both the European commission and the Italian National Institute for Insurance against Accidents at Work (INAIL) primarily emphasize hazards associated to optical radiation exposure. Accordingly, the prescribed PPE are intended to protect eyes and skin from such radiations and include screens, lenses, and specialized clothing; however, no respiratory PPE is currently mandated [43,44]. The findings of this study contribute to enhance the awareness of the potential occupational risks associated with laser cutting processes deriving from the release of metal and metal oxide nanoparticles, to promote the implementation of more comprehensive safety measures.
Limitations of the Study and Further Developments
This study presents monitoring data from eight laser cutting operations—four using fiber lasers and four using CO2 lasers—conducted over two working days. The selected timeslots, identified in collaboration with the company, are deemed representative of standard industrial operations, which adds relevance to the findings. However, the limited number of measurements introduces potential variability, potentially influenced by factors such as material heterogenicity, process boundary conditions, and operator-specific practices. Consequently, the data may not fully capture the range of exposure scenarios. Furthermore, due to variations in chemical composition, sheet thickness, cutting duration, and machine parameters across the different laser cutting operations, direct comparisons between them were not feasible. Nevertheless, the results represent a preliminary overview of the potential release of NPs during laser cutting processes, serving as a basis for subsequent, more detailed monitoring campaigns aimed at establishing emission reference values and ensuring consistent risk assessment.
To strengthen the findings and support the development of exposure benchmarks, further monitoring is planned under varied conditions, including different materials, laser types, thicknesses, equipment settings, and power levels. This expanded approach will facilitate a more comprehensive understanding of nanoparticle emission characteristics and support the implementation of effective protective strategies for exposed personnel.
5. Conclusions
This study investigated the potential release of particles and NPs during metal sheet laser cutting operations, as well as the potential exposure risk for operators. The results indicate an increased concentration of particles and nanoparticles during laser cutting activities, as evidenced by both environmental and personal monitoring, for the analyzed laser technologies, namely fiber laser and CO2 laser. The majority of the emitted particles were smaller than 300 nm, with the most significant increases detected in the nanoparticle range.
The extent of NP release was found to vary considerably depending on laser technology, type of material and thickness of the metal sheet being processed. Notably, higher concentrations were detected during operations involving CO2 laser systems, which represents a more mature technology.
The results of this study offer a preliminary understanding of the potential exposure to metal and metal oxide NPs among laser cutting operators. Their relevance is underscored by the general lack of monitored data on NPs released from such industrial operations. Considering the widespread adoption of laser cutting technology, the absence of a comprehensive exposure assessment framework may result in a potential underestimation of the risk associated with NP exposure in this occupational setting. Further research is necessary to develop a robust and systematic framework for laser cutting operations, enabling the design of effective safety protocols that should include appropriate respiratory PPE tailored to the assessed level of particle-related risk.
Supplementary Materials
The following supporting information can be downloaded at: https://www.mdpi.com/article/10.3390/pr13061942/s1, Table S1. Nominal chemical composition of feedstocks, Table S2. Overview of the average particle concentration (0.3–10 µm) for the analyzed processes—Day 1, Table S3. Overview of the average particle concentration (0.3–10 µm) for the analyzed processes—Day 2, Table S4.1–S4.24. T-test results for the monitored processes: mean particle number and background particle number.
Author Contributions
Conceptualization, N.P., R.P. and E.O.; methodology, N.P., R.P. and E.O.; formal analysis, R.P. and N.P.; investigation, N.P., R.P. and E.O.; writing—original draft preparation, N.P. and R.P.; writing—review and editing, E.O., F.S. and S.M.C.; visualization, N.P. and R.P.; supervision, E.O. All authors have read and agreed to the published version of the manuscript.
Funding
This research received no external funding.
Data Availability Statement
The original contributions presented in this study are included in the article/Supplementary Material. Further inquiries can be directed to the corresponding author.
Conflicts of Interest
The authors declare no conflicts of interest.
Abbreviations
The following abbreviations are used in this manuscript:
| NP | Nanoparticles |
| UFP | Ultrafine particles |
| IMNP | Incidental metal nanoparticles |
| LDSA | Lung deposited surface area |
| ROS | Reactive oxygen species |
| CO2 | Carbon dioxide |
| FI | Fiber |
| C70—CS | Carbon steel |
| Al | Aluminum |
| SS | Stainless Steel |
| SAF | Sandvik Austenite Ferrite |
| SD | Standard deviation |
| Min | Minimum |
| Max | Maximum |
| BKG | Background |
| PPE | Personal protective equipment |
References
- Sharma, A.; Yadava, V. Experimental Analysis of Nd-YAG Laser Cutting of Sheet Materials—A Review. Opt. Laser Technol. 2018, 98, 264–280. [Google Scholar] [CrossRef]
- Alsaadawy, M.; Dewidar, M.; Said, A.; Maher, I.; Shehabeldeen, T.A. A Comprehensive Review of Studying the Influence of Laser Cutting Parameters on Surface and Kerf Quality of Metals. Int. J. Adv. Manuf. Technol. 2024, 130, 1039–1074. [Google Scholar] [CrossRef]
- Deepak, J.R.; Anirudh, R.P.; Sundar, S.S. Applications of Lasers in Industries and Laser Welding: A Review. Mater. Today Proc. 2023, S221478532300620X. [Google Scholar] [CrossRef]
- He, Y.; Xie, H.; Ge, Y.; Lin, Y.; Yao, Z.; Wang, B.; Jin, M.; Liu, J.; Chen, X.; Sun, Y. Laser Cutting Technologies and Corresponding Pollution Control Strategy. Processes 2022, 10, 732. [Google Scholar] [CrossRef]
- Powell, J.; Kaplan, A. Laser Cutting: From First Principles to the State of the Art. In Proceedings of the Pacific International Conference on Applications of Lasers and Optics, Melbourne, Australia, 19–21 April 2004; Laser Institute of America: Melbourne, Australia, 2004; p. 101. [Google Scholar]
- Cena, L.G.; Chen, B.T.; Keane, M.J. Evolution of Welding-Fume Aerosols with Time and Distance from the Source: A Study Was Conducted on the Spatiotemporal Variability in Welding-Fume Concentrations for the Characterization of First- and Second-Hand Exposure to Welding Fumes. Weld. J. 2016, 95, 280s–285s. [Google Scholar]
- Dugheri, S.; Cappelli, G.; Trevisani, L.; Kemble, S.; Paone, F.; Rigacci, M.; Bucaletti, E.; Squillaci, D.; Mucci, N.; Arcangeli, G. A Qualitative and Quantitative Occupational Exposure Risk Assessment to Hazardous Substances during Powder-Bed Fusion Processes in Metal-Additive Manufacturing. Safety 2022, 8, 32. [Google Scholar] [CrossRef]
- Paulin, N.; Pernetti, R.; Bergamaschi, E.; Oddone, E. Nanoparticles Released during Metal-Processing Operations: A Systematic Review. Clean. Eng. Technol. 2025, 24, 100873. [Google Scholar] [CrossRef]
- Pernetti, R.; Maffia, S.; Previtali, B.; Oddone, E. Assessment of Nanoparticle Emission in Additive Manufacturing: Comparing Wire and Powder Laser Metal Deposition Processes. J. Occup. Environ. Hyg. 2023, 20, 329–335. [Google Scholar] [CrossRef]
- Sousa, M.; Arezes, P.; Silva, F. Occupational Exposure to Ultrafine Particles in Metal Additive Manufacturing: A Qualitative and Quantitative Risk Assessment. Int. J. Environ. Res. Public Health 2021, 18, 9788. [Google Scholar] [CrossRef]
- Zhang, M.; Jian, L.; Bin, P.; Xing, M.; Lou, J.; Cong, L.; Zou, H. Workplace Exposure to Nanoparticles from Gas Metal Arc Welding Process. J. Nanoparticle Res. 2013, 15, 2016. [Google Scholar] [CrossRef]
- Lee, M.-H.; Yang, W.; Chae, N.; Choi, S. Aerodynamic Diameter Distribution of Aerosols from Plasma Arc Cutting for Steels at Different Cutting Power Levels. J. Radioanal. Nucl. Chem. 2020, 323, 613–624. [Google Scholar] [CrossRef]
- Wang, J.; Hoang, T.; Floyd, E.L.; Regens, J.L. Characterization of Particulate Fume and Oxides Emission from Stainless Steel Plasma Cutting. Ann. Work. Expo. Health 2017, 61, 311–320. [Google Scholar] [CrossRef] [PubMed]
- Eriksen Hammer, S.; Halvorsen, J.Ø.; Graff, P.; Ervik, T.K. Characterisation of Particles Emitted during Laser Cutting of Various Metal Sheets and an Exposure Assessment for the Laser Operators. Int. J. Environ. Res. Public Health 2022, 19, 9888. [Google Scholar] [CrossRef] [PubMed]
- ISO. Nanotechnologies—Plain Language Explanation of Selected Terms from the ISO/IEC 80004 Series, 2017. Available online: https://www.iso.org/obp/ui/#iso:std:iso:tr:18401:ed-1:v1:en (accessed on 1 March 2025).
- Bengalli, R.; Gualtieri, M.; Capasso, L.; Urani, C.; Camatini, M. Impact of Zinc Oxide Nanoparticles on an in Vitro Model of the Human Air-Blood Barrier. Toxicol. Lett. 2017, 279, 22–32. [Google Scholar] [CrossRef] [PubMed]
- Kreyling, W.G.; Hirn, S.; Möller, W.; Schleh, C.; Wenk, A.; Celik, G.; Lipka, J.; Schäffler, M.; Haberl, N.; Johnston, B.D.; et al. Air–Blood Barrier Translocation of Tracheally Instilled Gold Nanoparticles Inversely Depends on Particle Size. ACS Nano 2014, 8, 222–233. [Google Scholar] [CrossRef]
- Oberdörster, G. Pulmonary Effects of Inhaled Ultrafine Particles. Int. Arch. Occup. Environ. Health 2000, 74, 1–8. [Google Scholar] [CrossRef]
- Lachowicz, J.I.; Lecca, L.I.; Meloni, F.; Campagna, M. Metals and Metal-Nanoparticles in Human Pathologies: From Exposure to Therapy. Molecules 2021, 26, 6639. [Google Scholar] [CrossRef]
- Mendoza, R.P.; Brown, J.M. Engineered Nanomaterials and Oxidative Stress: Current Understanding and Future Challenges. Curr. Opin. Toxicol. 2019, 13, 74–80. [Google Scholar] [CrossRef]
- Ou, L.; Song, B.; Liang, H.; Liu, J.; Feng, X.; Deng, B.; Sun, T.; Shao, L. Toxicity of Graphene-Family Nanoparticles: A General Review of the Origins and Mechanisms. Part. Fibre Toxicol. 2016, 13, 57. [Google Scholar] [CrossRef]
- Valko, M.; Morris, H.; Cronin, M. Metals, Toxicity and Oxidative Stress. Curr. Med. Chem. 2005, 12, 1161–1208. [Google Scholar] [CrossRef]
- Shvedova, A.A.; Pietroiusti, A.; Fadeel, B.; Kagan, V.E. Mechanisms of Carbon Nanotube-Induced Toxicity: Focus on Oxidative Stress. Toxicol. Appl. Pharmacol. 2012, 261, 121–133. [Google Scholar] [CrossRef] [PubMed]
- Chevallet, M.; Veronesi, G.; Fuchs, A.; Mintz, E.; Michaud-Soret, I.; Deniaud, A. Impact of Labile Metal Nanoparticles on Cellular Homeostasis. Current Developments in Imaging, Synthesis and Applications. Biochim. Et Biophys. Acta (BBA) Gen. Subjects 2017, 1861, 1566–1577. [Google Scholar] [CrossRef] [PubMed]
- Bi, J.; Mo, C.; Li, S.; Huang, M.; Lin, Y.; Yuan, P.; Liu, Z.; Jia, B.; Xu, S. Immunotoxicity of Metal and Metal Oxide Nanoparticles: From Toxic Mechanisms to Metabolism and Outcomes. Biomater. Sci. 2023, 11, 4151–4183. [Google Scholar] [CrossRef]
- Bocca, B.; Leso, V.; Battistini, B.; Caimi, S.; Senofonte, M.; Fedele, M.; Cavallo, D.M.; Cattaneo, A.; Lovreglio, P.; Iavicoli, I. Human Biomonitoring and Personal Air Monitoring. An Integrated Approach to Assess Exposure of Stainless-Steel Welders to Metal-Oxide Nanoparticles. Environ. Res. 2023, 216, 114736. [Google Scholar] [CrossRef]
- Mohammapdour, R.; Ghandehari, H. Mechanisms of Immune Response to Inorganic Nanoparticles and Their Degradation Products. Adv. Drug Deliv. Rev. 2022, 180, 114022. [Google Scholar] [CrossRef]
- Wang, Y.-L.; Lee, Y.-H.; Chou, C.-L.; Chang, Y.-S.; Liu, W.-C.; Chiu, H.-W. Oxidative Stress and Potential Effects of Metal Nanoparticles: A Review of Biocompatibility and Toxicity Concerns. Environ. Pollut. 2024, 346, 123617. [Google Scholar] [CrossRef] [PubMed]
- Wang, T.; Huang, Y.; Zhang, H.; Li, X.; Li, F. Machine Learning Models for Quantitatively Prediction of Toxicity in Macrophages Induced by Metal Oxide Nanoparticles. Chemosphere 2025, 370, 143923. [Google Scholar] [CrossRef]
- Vallabani, N.V.S.; Alijagic, A.; Persson, A.; Odnevall, I.; Särndahl, E.; Karlsson, H.L. Toxicity Evaluation of Particles Formed during 3D-Printing: Cytotoxic, Genotoxic, and Inflammatory Response in Lung and Macrophage Models. Toxicology 2022, 467, 153100. [Google Scholar] [CrossRef]
- Ljunggren, S.A.; Karlsson, H.; Ståhlbom, B.; Krapi, B.; Fornander, L.; Karlsson, L.E.; Bergström, B.; Nordenberg, E.; Ervik, T.K.; Graff, P. Biomonitoring of Metal Exposure During Additive Manufacturing (3D Printing). Saf. Health Work 2019, 10, 518–526. [Google Scholar] [CrossRef]
- IFA. Criteria for Assessment of the Effectiveness of Protective Measures. Available online: https://www.dguv.de/ifa/fachinfos/nanopartikel-am-arbeitsplatz/beurteilung-von-schutzmassnahmen/index-2.jsp (accessed on 2 April 2025).
- VAN Broekhuizen, P.; VAN Veelen, W.; Streekstra, W.-H.; Schulte, P.; Reijnders, L. Exposure Limits for Nanoparticles: Report of an International Workshop on Nano Reference Values. Ann. Occup. Hyg. 2012, 56, 515–524. [Google Scholar] [CrossRef]
- Pena, A.C.; Soler, J.G.; Caicedo, G.R. The Characterization of Aerosols Generated During the Cutting of Metallic Materials with Lasers. Environ. Technol. 1998, 19, 83–90. [Google Scholar] [CrossRef]
- Viitanen, A.-K.; Uuksulainen, S.; Koivisto, A.J.; Hämeri, K.; Kauppinen, T. Workplace Measurements of Ultrafine Particles—A Literature Review. Ann. Work Expo. Health 2017, 61, 749–758. [Google Scholar] [CrossRef]
- Leso, V.; Ercolano, M.L.; Mazzotta, I.; Romano, M.; Cannavacciuolo, F.; Iavicoli, I. Three-Dimensional (3D) Printing: Implications for Risk Assessment and Management in Occupational Settings. Ann. Work Expo. Health 2021, 65, 617–634. [Google Scholar] [CrossRef] [PubMed]
- Cena, L.G.; Chisholm, W.P.; Keane, M.J.; Chen, B.T. A Field Study on the Respiratory Deposition of the Nano-Sized Fraction of Mild and Stainless Steel Welding Fume Metals. J. Occup. Environ. Hyg. 2015, 12, 721–728. [Google Scholar] [CrossRef] [PubMed]
- Miettinen, M.; Torvela, T.; Leskinen, J.T.T. Physicochemical Characterization of Aerosol Generated in the Gas Tungsten Arc Welding of Stainless Steel. Ann. Occup. Hyg. 2016, 60, 960–968. [Google Scholar] [CrossRef]
- Sajedifar, J.; Kokabi, A.H.; Dehghan, S.F.; Mehri, A.; Azam, K.; Golbabaei, F. Evaluation of Operational Parameters Role on the Emission of Fumes. Ind. Health 2018, 56, 198–206. [Google Scholar] [CrossRef]
- Sousa, M.; Arezes, P.; Silva, F. Occupational Exposure to Incidental Nanomaterials in Metal Additive Manufacturing: An Innovative Approach for Risk Management. Int. J. Environ. Res. Public Health 2023, 20, 2519. [Google Scholar] [CrossRef]
- Gomes, J.F.; Miranda, R.M.; Carvalho, P.A.; Quintino, M.L. The Effect of Metal Transfer Modes and Shielding Gas Composition on the Emission of Ultrafine Particles in MAG Steel Welding. Soldag. insp. 2014, 19, 168–176. [Google Scholar] [CrossRef]
- Gomes, J.F.; Miranda, R.M.; Oliveira, J.P.; Esteves, H.M.; Albuquerque, P.C. Evaluation of the Amount of Nanoparticles Emitted in LASER Additive Manufacture/Welding. Inhal. Toxicol. 2019, 31, 125–130. [Google Scholar] [CrossRef]
- European Commission; Directorate-General for Employment, Social Affairs and Inclusion. Non-Binding Guide to Good Practice for Implementing Directive 2006/25/EC “Artificial Optical Radiation”; Publications Office of the European Union: Luxembourg, 2011. [Google Scholar]
- Rubbonello, G. Sicurezza Laser. 2024. INAIL Guideline. Available online: https://www.google.com/url?sa=t&source=web&rct=j&opi=89978449&url=https://www.inail.it/content/dam/inail-hub-site/documenti/catalogo-generale/2024/11/SicurezzaLaser.pdf&ved=2ahUKEwjwwLXVhvuNAxUOgf0HHZh6EesQFnoECBoQAQ&usg=AOvVaw3DwYY5Ptxjj6HgOEOTNcIk (accessed on 2 April 2025).

Disclaimer/Publisher’s Note: The statements, opinions and data contained in all publications are solely those of the individual author(s) and contributor(s) and not of MDPI and/or the editor(s). MDPI and/or the editor(s) disclaim responsibility for any injury to people or property resulting from any ideas, methods, instructions or products referred to in the content. |
© 2025 by the authors. Licensee MDPI, Basel, Switzerland. This article is an open access article distributed under the terms and conditions of the Creative Commons Attribution (CC BY) license (https://creativecommons.org/licenses/by/4.0/).