Abstract
The aim of this study was to analyze the simulation effect of heterogeneous resistance in the municipal sludge-transportation pipeline using the modified Turian-Yuan model. The simulation results of the modified Turian-Yuan model were investigated using five samples of sludge with different volumetric concentrations (0.92%, 1.76%, 2.12%, 2.45%, and 2.98%, respectively); these were compared with those of the Hazen-Williams model and the Darcy-Weisbach model. The results showed that the simulation accuracy of the modified Turian-Yuan model was higher than the results of the others under different volumetric sludge concentrations. Meanwhile, the accuracy of the modified Turian-Yuan model was less affected by the sludge concentration, indicating that the stability of this model was high. In addition, the simulation results of the modified Turian-Yuan model are all better than the level of measured values; this means that the model is relatively safe but may lead to an increase in capital and operational costs. The possible reason for this phenomenon may be the reduction in sludge particle sizes due to shear frictions and the tendency of sludge particles to be spherical in shape.
1. Introduction
For municipal sludge, the pipeline conveying method is preferred because of its advantages of cleanliness, high efficiency, and ease of automatic control; this method has been applied in the United States, Japan, the Netherlands, and other countries [1,2,3,4]. Detailed hydraulic calculations need to be carried out before the construction of sludge-transportation pipelines to determine the optimum sludge concentration, pipeline diameter, and transport flow rate; these values can then be used as the bases for calculating flow resistance and selecting sludge transport equipment. These calculations are extremely important in ensuring the safe, reliable, and economically rational operation of sludge-transportation pipelines [5,6,7,8]. In this process, the accurate calculation of sludge flow resistance is the main basis for the selection of the subsequent design parameters, which is also the core issue of the whole sludge pipeline design. For example, if the resistance simulation value is high and the sludge–conveying equipment is selected on the basis of these calculations, although the safety and reliability of the conveying process can be guaranteed, the high energy consumption of the conveying process will result in an increase in the conveying costs. On the contrary, if the resistance simulation value is low, the safe and reliable operation of the conveying system cannot be guaranteed. Therefore, it is necessary to choose a high-precision sludge pipeline transportation resistance model for the design of the actual sludge-conveying pipeline [9,10,11,12].
The problem of sludge pipeline transportation belongs to the category of solid-liquid two-phase flow. In this process, the intervention of sedimentary particles (i.e., fine particles dispersed in the water flow) increase the viscosity of the carrier; however, under the turbulent action of water flow and their own gravity, coarse particles move in suspension or displacement, which makes the movement of particles extremely complicated. Meanwhile, the exchange of energy and momentum between the solid phase and the liquid phase is constantly carried out. In addition, the properties of solid materials are very different, and there are continuous interactions between solid particles and the pipe wall, which makes it difficult to deeply understand and accurately describe the movement law of solid-liquid two-phase flow [11,12].
At present, most of the resistance models used in sludge pipeline transportation come from scholars’ research results on solid-liquid two-phase flow in their respective fields. On the basis of clear water resistance models, scholars put forward various calculation methods of solid-liquid two-phase flow resistance through experimental testing and analysis. However, due to the different research objects, emphases, and experimental methods adopted by scholars, various conclusions have been drawn in their respective research processes. So far, there is still no unified formula for calculating the resistance of pipeline solid-liquid two-phase flow [12]. Among the researchers in this field, Durand, Newitt, and others have given some universal calculation models of resistance loss [12].
Durand et al. [13] divided the flow pattern of solid-liquid two-phase pipe flow according to the accumulated experimental data and analyzed the law of resistance loss of solid-liquid two-phase media under different flow patterns. They put forward the empirical formula of resistance loss under the heterogeneous suspension flow pattern, namely the famous Durand formula. Newitt et al. [14] extended Durand’s research and established empirical formulas of flow resistance in other flow patterns. The research conducted by Durand and Newitt et al. realized the transformation from the productive experimental stage to the theoretical research stage, marking the beginning of in-depth research on the two-phase flow theory. Influenced by their research results, in the following half century, many scholars devoted themselves to the verification of the Durand formula. However, it has been found that, although the applicable conditions of this formula are relatively broad, they are different from the actual results when applied to engineering practices, so many modified Durand formulas have been produced [15,16,17,18,19,20,21,22].
Accordingly, scholars have carried out different types of experiments according to the characteristics of their respective research fields, which has led to great progress in experimental research. At present, the published research results are mainly on pipeline testing and the analyses of results obtained on coal water slurry. In addition, researchers in countries including Germany and the Netherlands have also carried out research on the pipeline transportation of sediment due to the needs of dredging projects. Matousek Václav [12,23,24,25], Kaushal [26,27,28,29,30,31], and others comprehensively investigated the influence of various influencing factors on the flow resistance characteristics of two-phase medium pipeline transportation. Fangary, Abdel Ghani, and others [32] have investigated the influence of solid particles on flow resistance. Schaan and Sumner [33] have deeply studied the contribution of solid particle shapes to flow resistance.
By combing the current research status of solid-liquid two-phase flow resistance, we have determined that the research results surrounding resistance models cover four aspects, as detailed here.
The first aspect comprises research results which have experiments as the main means of study. Durand [13] and others put forward a formula (i.e., the Durand formula) for calculating the hydraulic gradient of solid-liquid two-phase flow pipelines through extensive repeated experimental research and analysis. In the experiment, sands were used as solid particles, with a density of 2.65 g/cm3 and a particle size of 0.2~25 mm. Meanwhile, diamond sand, with a density of 3.956 g/cm3, and plastic sand, with a density of 1.60 g/cm3, were compared and analyzed in the experiment. The equation shown in Formula (1) was obtained.
where Jw—hydraulic gradient of clear water flow (%);
- C—volume concentration (%);
- J—hydraulic gradient of heterogeneous flow (%);
- g—acceleration of gravity (m/s2);
- vm—average velocity of solid-liquid mixture (m/s);
- D—internal diameter of pipeline (m);
- CD—resistance coefficient;
- δ—the ratio of solid particle density to clear water density;
- KD—coefficient.
After the Durand formula was put forward, relevant scholars carried out similar experimental research with reference to this formula, producing a series of Durand formulas. However, these formulas were all experimental conclusions belonging to empirical formulas, which failed to clearly reveal the interaction mechanism between liquid and solid particles in the process of solid-liquid two-phase flow.
The second aspect comprises research results derived through combining theory with experiment. Newitt [14] and others put forward a formula for calculating hydraulic gradients by analyzing the basic problem of the energy required for conveying solid particles. Their research results were obtained on a certain theoretical basis. Through experiments, they proved that the energy consumed by the suspension of solid particles is equal to the energy provided by water flow; as a theoretical basis, they deduced a formula for calculating the hydraulic gradient of solid-liquid two-phase flow. This analysis method is similar to that of the gravity theory or energy principle in sediment research. Newitt pointed out that the fundamental condition for keeping solid particles suspended in solid-liquid two-phase flow per unit volume is to provide energy that meets the requirements of Formula (2) in unit time.
where Eb—energy required (J);
- Kb—constant;
- q—concentration in the tube (%);
- vi—final settling velocity of single particle (m/s);
- ρs—density of particles (kg/m3); ρ—density of the water (kg/m3); g—acceleration of gravity (m/s2).
Theoretically, this semi-empirical formula proposed by Newitt is controversial. Because the water flow energy directly bears the consumption of the moving part, its turbulence can push the suspended particles to work; this ability is not directly driven by the current energy. In addition, the coefficient in the hydraulic gradient formula is obtained only by using a test with a pipe diameter of 25 mm; its reliability needs to be demonstrated.
The third aspect comprises research results derived using dimensional analyses as the research means [34,35,36]. Taking Turian, Yuan [36], and other experts and scholars as representatives, they put forward a calculation formula with the hydraulic gradient of solid-liquid two-phase flow in various flow states by dimensional analysis; this is the conclusion that can be obtained after the regression analysis of a large amount of experimental data has been performed. The Turian-Yuan model is shown in Formula (3):
where im—sludge hydraulic gradient (%);
- i0—clear water hydraulic gradient (%);
- CV—sludge volumetric concentration (%), and the range of values is 0.008–0.04; CD—particle settling resistance coefficient; when 1000 < Red < 2 × 10⁵, it is generally 0.4–0.43, of which Red is the particle Reynolds number;
- v—conveying velocity (m/s);
- g—acceleration of gravity (m/s2);
- D—pipe diameter (m);
- ρs—solid density (kg/m3);
- ρ—water density (kg/m3).
The above formula obtained by Turian, and Yuan can be applied in most cases. However, it cannot explain the interaction between liquid and solid, nor can it explain the flow mechanism of heterogeneous flow.
The fourth and final aspect comprises research results that are analyzed by pure theory as a means of conducting research. Carstens analyzed the flow mechanism and characteristics of heterogeneous flow, and Ayukanswa studied the theoretical relationship between hydraulic gradient, velocity, and concentration [12]. Roco and other scholars [37] gave their numerical solutions. However, these research results cannot be applied to practical situations.
Through the above summary, it can be found that there are two shortcomings in the calculation of flow resistance in the existing research results: first, all resistance models are based on certain experimental conditions and have certain limitations in application; second, the forms of various resistance models are relatively complicated, and there are many inconveniences in practical application.
The Turian-Yuan heterogeneous resistance model mentioned above is obtained on the basis of the regression analysis of a large amount of experimental data. The model is proposed based on the method of magnitude analysis and is suitable for the calculation of the resistance of sedimentary slurries in multiple flow states. In previous research, when this model has been used to determine the flow resistance of municipal sludge simulations, the exponents of the relevant parameters in the Turian-Yuan model have been corrected after optimization. Therefore, the modified Turian-Yuan model was obtained, as shown in Equation (4). Then, the accuracy of the modified model was verified using data from the experiments conducted indoors [38].
However, the validation process is an indoor ring pipe test; therefore, the parameters, such as the conveying flow rate, the pipe diameter, and the conveying distance, are quite different from those of the sludge transportation pipeline in the actual project. Therefore, the question of whether the modified Turian-Yuan model works for the simulation of flow resistance in real sludge-transportation pipelines needs to be further analyzed and verified [39,40]. In order to complete this validation, this study takes the sludge-transportation pipeline of a wastewater treatment plant as the research object, and compares the flow resistance simulation results of the modified Turian-Yuan model with the measured values of the actual sludge-transportation pipeline to evaluate the simulation accuracy. Meanwhile, the simulation results of the Hazen-Williams model and the Darcy-Weisbach model are added in this study for simultaneous comparative analysis. This experiment is a further test of the effectiveness of the modified Turian-Yuan heterogeneous resistance model. It is a field experiment, which is different from previous small-scale laboratory experiments. This study provides supplementary information for research in the field of solid-liquid two-phase flow; moreover, this study provides a practical resistance calculation model for sludge pipeline transportation engineering, solving the problems of flow resistance calculation and transportation equipment selection.
2. Materials and Methods
2.1. Experimental Sludge
The experimental sludge was prepared by diluting the dehydrated sludge with effluent from a sewage-treatment plant. The moisture content of the original dewatered sludge was 75.2%. According to the volume ratios of effluent to dewatered sludge from the sewage plant, 25.96:1, 13.09:1, 10.69:1, 9.12:1, and 7.32:1, experimental sludge samples with different water contents were obtained, with water contents of 99.08%, 98.24%, 97.88%, 97.55%, and 97.02, respectively. Then, the volumetric concentrations (Cv) for the sludge samples were 0.92%, 1.76%, 2.12%, 2.45%, and 2.98%, respectively. The viscosity coefficients of these five samples were determined at 20 °C. The basic properties of the five kinds of experimental sludge samples are shown in Table 1.

Table 1.
Basic properties of experimental sludge samples.
2.2. Experimental Device
The sludge flow resistance test device used in the experiment is shown in Figure 1. The device consisted of a sludge pool, a sludge pump, a test pipe section, a reflux pipe section, an electromagnetic flowmeter, and pressure sensors.
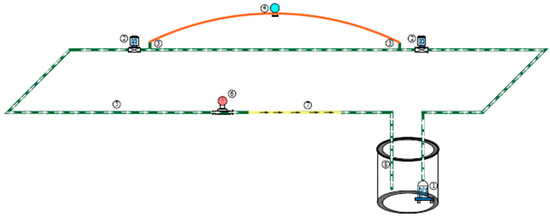
Figure 1.
Schematic diagram of experimental device: 1—sludge pump; 2—control valve; 3—pressure tapings; 4—pressure sensor; 5—flux pipe; 6—electromagnetic flowmeter; 7—observation segment; 8—sludge tank.
The sludge tank had a diameter of 4.0 m, a height of 1.2 m, and a volume of 15.0 m3. A sludge pump, model QW1200–10, with flow of 1200 m3/h, a lift of 10 m, and power of 34 kW, was installed in the sludge tank. The length of the test pipe was 80 m, the pipe diameter was 300 mm, and the ratio of pipe length to pipe diameter was 266:1. Control valves were stalled before and after the test pipe section. An observation segment made of plexiglass with a length of 1 m was arranged on the reflux pipe to observe the flow phenomenon in the pipeline. The reflux pipe was equipped with an electromagnetic flowmeter (4–20 mA + RS485 model, Henan Zhongan Electronic Detection Technology Co., Ltd., Zhengzhou, China). The model of the pressure sensor was RS–YB07.
Sludge particle size was determined using a laser particle size analyzer (BT9300S, Dandong Baite Instrument Co., Ltd., Dandong, China). The sludge particle shape was determined using a high–frequency pulse particle size and shape analyzer (QICPIC–LIXELL, Sympatec GmbH, Clausthal, Germany). The viscosity of sludge was measured using a rotary rheometer (ARES–G2, TA Instruments, Newcastle, DE, USA).
2.3. Experimental Scheme
The sludge pump was submerged below the liquid level of the sludge tank, about 0.2 m away from the bottom of the tank. Sludge was sucked from the bottom and around the sludge pump. The reflux pipeline extended into the sludge tank, and the outlet was about 0.3 m away from the bottom of the tank. The suction of the sludge pump and the hydraulic stirring formed at the outlet of the reflux pipeline were conducted to ensure that the settling sludge particles were evenly mixed with water.
The experiment was carried out under the condition of full flow. For sludge with different volumetric concentrations, the opening of the valve was constantly adjusted to control the flow of sludge in the pipe section. The readings of flowmeter and pressure sensor were recorded for subsequent analysis. The test was conducted at a temperature of 20 ± 0.5 °C. All the above tests were conducted 3 times in parallel. The outcomes of the statistical analyses of the measured pressure results were expressed as mean ± error bars.
3. Results and Discussion
3.1. Analysis on the Simulation Effect of the Modified Turian-Yuan Model
The comparisons of the measured results with the simulation results from the modified Turian-Yuan model, the Hazen-Williams, model and Darcy-Weisbach model are shown in Figure 2, Figure 3, Figure 4, Figure 5 and Figure 6.
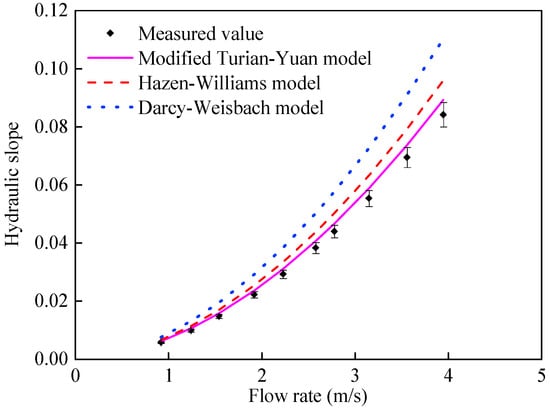
Figure 2.
Simulation results of modified Turian-Yuan model on the resistance of the actual sludge-transportation pipeline (Cv = 0.92%).
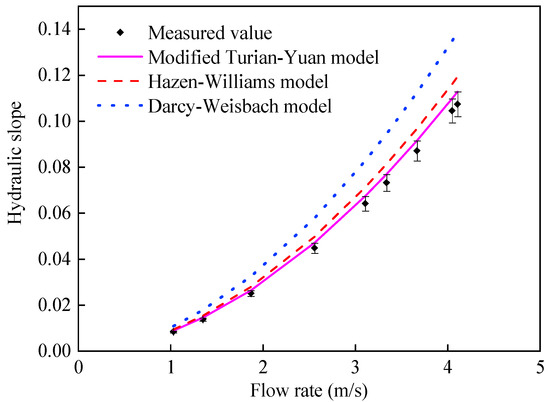
Figure 3.
Simulation results of modified Turian-Yuan model on the resistance of the actual sludge-transportation pipeline (Cv = 1.76%).

Figure 4.
Simulation results of modified Turian-Yuan model on the resistance of the actual sludge-transportation pipeline (Cv = 2.12%).
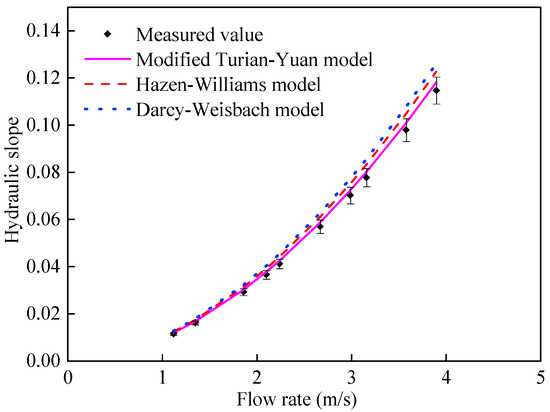
Figure 5.
Simulation results of modified Turian-Yuan model on the resistance of the actual sludge-transportation pipeline (Cv = 2.45%).
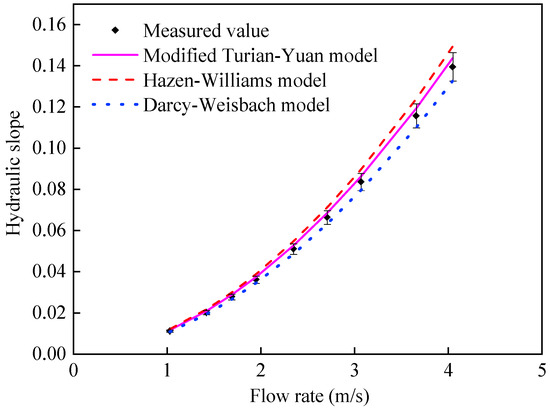
Figure 6.
Simulation results of modified Turian-Yuan model on the resistance of the actual sludge-transportation pipeline (Cv = 2.98%).
As shown in Figure 2, for the sludge with volumetric concentration of 0.92%, the simulated values of the three models (the modified Turian-Yuan model, Hazen-Williams model, and Darcy-Weisbach model) showed the same trend as the measured values and were all higher than them. This indicated that the simulation results of all three models were biased towards safety and were valid. In addition, it can be seen from this figure that the simulation accuracies of all three models were high when the flow velocity was relatively low. However, with an increase in turbulence (the Reynolds number ranged approximately from 478,000 to 956,000), the simulated values of the Darcy-Weisbach model deviated a lot from the measured values, while the deviations of the modified Turian-Yuan and Hazen-Williams models from the measured values were maintained at a relatively low level. Meanwhile, in comparison, the simulated values of the modified Turian-Yuan model were closer to the measured values than those of the Hazen-Williams model. In conclusion, from the perspective of simulation accuracy, the order of accuracy of the three models, in descending order, was as follows: modified Turian-Yuan model > Hazen-Williams model > Darcy-Weisbach model.
As can be seen from the comparison between Figure 3 and Figure 2, for a sludge with a volumetric concentration of 1.76%, the flow resistance increased as the solid content increased in the sludge. The simulations of the three resistance models were all still valid under this condition. Figure 3 showed that the simulation accuracy of the modified Turian-Yuan model is the highest among the three models, followed by the Hazen-Williams model, while the Darcy-Weisbach model had the lowest accuracy. As can be seen in Figure 4, as the sludge concentration further increased, the simulation results of the three models still maintained similar simulation accuracies as when the sludge volumetric concentrations were 0.91% and 1.76%. This time, again, the modified Turian-Yuan model had the highest simulation accuracy, followed by the Hazen-Williams model, and the Darcy-Weisbach model had the lowest accuracy.
It can also be seen from Figure 5 that all three models showed high simulation accuracy when the sludge volumetric concentration was 2.45%. All the simulation results were slightly larger than the measured values. Therefore, all three models were effective for the simulation of sludge flow resistance at this concentration. It can also be found that the modified Turian-Yuan model had the highest simulation accuracy among the three models. In addition, Figure 6 showed that, when the sludge volumetric concentration was 2.98%, the simulated values of the three models were still close to the measured values, indicating that all the three models have high simulation accuracy. However, it can be observed that the simulated values of Darcy-Weisbach model were lower than the measured values; this indicates that, if the Darcy-Weisbach model were to be used for simulating the resistance under this sludge volumetric concentration condition, then the results would be unsafe. In other words, at this time, the Darcy-Weisbach model failed. As for the modified Turian-Yuan model and the Hazen-Williams model, both of them still had good simulation effects, but the accuracy of the improved Turian-Yuan model was higher than that of the Hazen-Williams model.
Meanwhile, in order to further investigate the effect of sludge concentration on the accuracy of the three models, the relationships between the average deviation rate of the simulation results from the three models and the volumetric concentrations are listed in Figure 7, Figure 8 and Figure 9 [40]. It can be seen from these figures that, for five different sludge volumetric concentrations, the average deviation rates of the modified Turian-Yuan model simulation results are significantly smaller than those of the other models. This indicated that the accuracy of the modified Turian-Yuan model is significantly higher than that of the other two models. Meanwhile, it can be observed that the deviation rate of the modified Turian-Yuan model had a relatively smooth trend, which indicates that the accuracy of the modified Turian-Yuan model is less affected by the sludge volumetric concentration, and the stability of the model is higher.
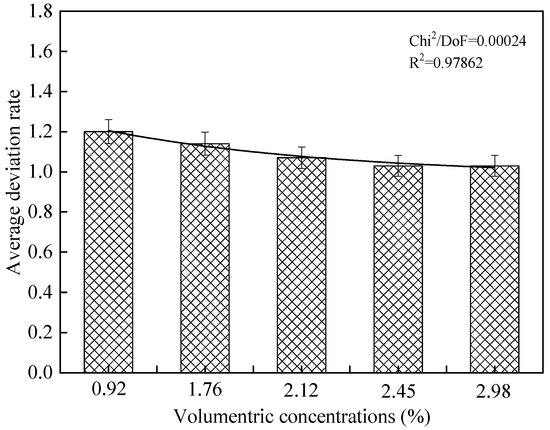
Figure 7.
Simulation result deviation rate of the modified Turian-Yuan model.
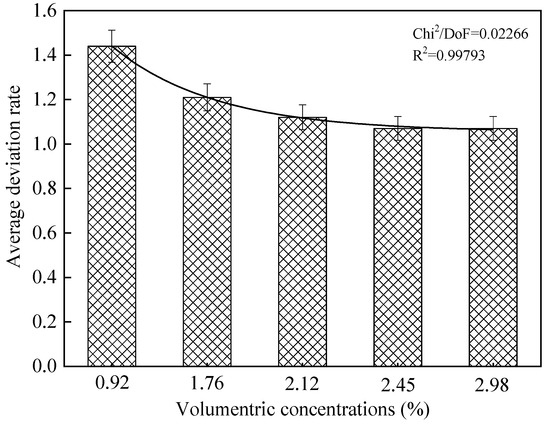
Figure 8.
Simulation result deviation rate of the Hazen-Williams model.
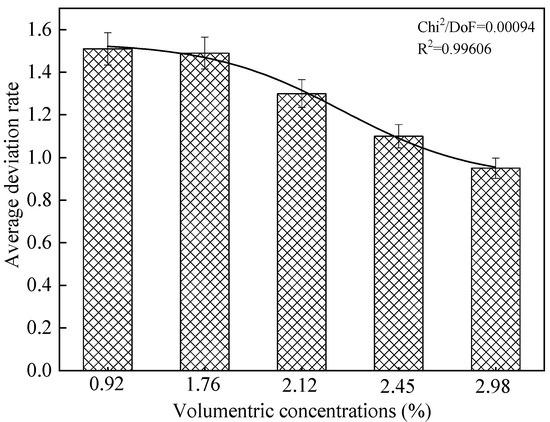
Figure 9.
Simulation result deviation rate of the Darcy-Weisbach model.
3.2. Analysis of Error Sources in the Modified Turian-Yuan Model
From Figure 2, Figure 3, Figure 4, Figure 5 and Figure 6, it can be seen that the resistance simulation results of the modified Turian-Yuan model were all higher than the measured values in the actual sludge-transportation pipeline. This indicated that, on the one hand, the results of the model were safe when used for the resistance simulation; however, on the other hand, the simulation results may have been affected by the interference of some influencing factors [26,27,28]. In order to explore the reasons for this phenomenon, the sizes and shapes of solid particles in the sludge before and after the conveying process were determined. The varied sludge particle sizes are shown in Table 2, and the varied sludge particle shapes are shown in Table 3.
Table 2.
Varied sludge particle sizes before and after conveying.
Table 3.
Varied sludge particle shapes before and after conveying.
As can be seen from Table 2, the sludge particle sizes changed significantly after the test. The cumulative content of the sludge under specific particle size conditions became larger after the test, indicating that the particle sizes were reduced compared with those before the test. This phenomenon was attributed to a variety of frictional effects during transportation, including hydraulic mixing, shear stresses in the water flow, mutual friction between particles, and friction between particles and the wall of the pipeline. As a result, solid particles with smaller sizes more easily formed a more homogeneous flow under the turbulence of the water flow, resulting in smaller flow resistance [24,26,27,28]. This can possibly explain why the measured values were lower than the simulated values attained using the modified Turian-Yuan model.
In addition, as shown in Table 3, along with the reduction in sludge particle sizes, the parameters that characterize the shape of sludge particles had also changed. Firstly, the equivalent area grain size (EQPC) of sludge particles was significantly reduced, which meant that the sizes of the sludge particles were reduced after being transported by the pipeline. The FERET diameter refers to the distance between two boundary parallel lines of the particle projection profile, measured along a certain direction. For a particle, the FERET diameter is different depending on the direction taken. The maximum value is FERET_MAX, the minimum value is FERET_MIN, and the average value is FERET_MEAN. It can be seen from Table 3 that, after transportation, the sludge particles were broken due to shear friction, and the three values of FERET_MAX, FERET_MIM, and FERET_MEAN were all significantly reduced; this indicates that the particle size distribution of the sludge changed significantly after transportation. Sphericity refers to the degree to which the shape of a particle is similar to that of a sphere. The experimental results show that the sphericity of the particles increased after they were transported by the pipeline, i.e., the shapes of the particles tended to be spherical. This smooth particle surface contributed to the reduction in the flow resistance. Aspect ratio is defined as the maximum linearity of particles divided by the minimum linearity. The aspect ratio of spherical particles is 1; the aspect ratio of ribbon-shaped particles is 3~5; the aspect ratio of flaky particles can exceed 10, sometimes reaching 200; the aspect ratio of fibrous particles can reach 1000 [41]. The data in Table 3 show that the aspect ratio of sludge particles increased slightly after transportation. Convexity is used to describe the local shape of the particle surface [42]. Table 3 shows that the convexity of the particle decreased after being transported by pipeline, in other words, the surface of the particle became smoother, which was beneficial to the subsequent reduction in flow resistance. In addition, the image number of the detected sludge samples increased after transportation, indicating that some sludge particles were broken during the transportation process and more fine particles were generated; this finding is consistent with the results shown in Table 2. The above experimental results show that the surfaces of slippery particles tend to be rendered smooth by hydraulic shear friction; this means that the sludge particle shapes tended to be spherical, which is conducive to reducing head loss [27,28].
Based on the above analyses, it can be seen that the simulation accuracy of the modified Turian-Yuan heterogeneous resistance model is high for the pipeline transportation of sludge in a volumetric concentration range of 0.92% to 2.98%. Meanwhile, the average deviation rate of the simulation results of this model is small, indicating that the model is less affected by sludge concentration and that the stability is high.
4. Conclusions
In this study, the effect of the modified Turian-Yuan heterogeneous model in modeling the transportation resistance in a real sludge-conveying pipeline was investigated; accordingly, the following conclusions have been drawn:
The simulation results of five different sludge volumetric concentrations show that, among the three models, the simulation results of the modified Turian-Yuan heterogeneous resistance model were closest to the measured values; the accuracy of the modified Turian-Yuan model was higher than that of the Hazen-Williams model and the Darcy-Weisbach model. Moreover, the accuracy of the modified Turian-Yuan model was less affected by the sludge volumetric concentration in comparison with the other models, and the stability of the model is high.
The simulation results of the modified Turian-Yuan model were larger than the measured values under different sludge concentration conditions. Although this is safe for sludge-conveying pipelines, this overdesign may lead to significantly higher capital and operational costs, which is a limitation of the modified Turian-Yuan model in specific applications. This limitation must be considered before this model is used in applications for predicting resistance in sludge transportation procedures. Possible explanations for this phenomenon include the reduction in sludge particle sizes that occurs due to shear friction, or the spherical shapes of sludge particles; both of these factors lead to smaller flow resistance in sludge-conveying pipelines.
Author Contributions
Conceptualization, J.W.; methodology, J.W.; software, J.W.; validation, X.L.; formal analysis, X.L.; investigation, B.Y.; resources, B.Y.; data curation, B.Y.; writing—original draft preparation, J.W.; writing—review and editing, H.L.; visualization, J.W.; supervision, J.W.; project administration, H.L.; funding acquisition, H.L. All authors have read and agreed to the published version of the manuscript.
Funding
This work was supported by the National Natural Science Foundation of China (No. 52070087) and the Education Department of Jilin Province (No. JJKH20250991KJ).
Data Availability Statement
The original contributions presented in this study are included in the article. Further inquiries can be directed to the corresponding author(s).
Conflicts of Interest
The authors declare no conflicts of interest.
References
- Christian, F.I.; Aldo, T. Uncertainties in key transport variables in homogeneous slurry flows in pipelines. Miner. Eng. 2012, 32, 54–59. [Google Scholar]
- Luk, J.; Mohamadabadi, H.; Kumar, A. Pipeline transport of biomass: Experimental development of wheat straw slurry pressure loss gradients. Biomass Bioenerg. 2014, 64, 329–336. [Google Scholar] [CrossRef]
- Kania, J. Economics of coal transport by slurry pipeline versus unit train: A case study. Energ. Econ. 1984, 6, 131–138. [Google Scholar] [CrossRef]
- Feng, G.; Wang, Z.; Qi, T.; Du, X.; Guo, J.; Wang, H.; Shi, X.; Wen, X. Effect of velocity on flow properties and electrical resistivity of cemented coal gangue–fly ash backfill (CGFB) slurry in the pipeline. Powder Technol. 2022, 396, 191–209. [Google Scholar] [CrossRef]
- Huang, C.; Minev, P.; Luo, J.; Nandakumar, K. A phenomenological model for erosion of material in a horizontal slurry pipeline flow. Wear 2010, 269, 190–196. [Google Scholar] [CrossRef]
- Senapati, P.; Mishra, B.; Parida, A. Analysis of friction mechanism and homogeneity of suspended load for high concentration fly ash & bottom ash mixture slurry using rheological and pipeline experimental data. Powder Technol. 2013, 250, 154–163. [Google Scholar]
- Lahiri, S.; Ghanta, K. Development of an artificial neural network correlation for prediction of hold–up of slurry transport in pipelines. Chem. Eng. Sci. 2008, 63, 1497–1509. [Google Scholar] [CrossRef]
- Xu, J.; Yao, Y.; Yan, H.; Zhou, N.; Su, H.; Li, M.; Liu, S.; Wang, H. Experimental study of pipeline pressure loss laws with large–size gangue slurry during the process of industrial–grade annular pipe transportation. Constr. Build. Mater. 2024, 436, 136993. [Google Scholar] [CrossRef]
- Chen, L.; Duan, Y.; Liu, M.; Zhao, C. Slip flow of coal water slurries in pipelines. Fuel 2010, 89, 1119–1126. [Google Scholar] [CrossRef]
- Samuel, F.; Jozef, S.; Changirwa, R. Oil sands slurry and waste recycling mechanics in a flexible pipeline system. Resour. Conserv. Recy. 2003, 39, 33–50. [Google Scholar]
- Li, M.; He, Y.; Jiang, R.; Zhang, J.; Zhang, H.; Liu, W.; Liu, Y. Analysis of minimum specific energy consumption and optimal transport concentration of slurry pipeline transport systems. Particuology 2022, 66, 38–47. [Google Scholar] [CrossRef]
- Matoušek, V. Research developments in pipeline transport of settling slurries. Powder Technol. 2005, 156, 43–51. [Google Scholar] [CrossRef]
- Durand, R. The Hydraulic Transportation of Coal and Other Materials in Pipes; Colloge of National Coal Board: Buckinghamshire, UK, 1952; pp. 123–130. [Google Scholar]
- Newitt, D.M.; Richardson, J.F. Hydraulic Conveying of Solids. Nature 1955, 175, 800–801. [Google Scholar] [CrossRef]
- Cirpka, O.A.; Schwede, R.L.; Luo, J.; Dentz, M. Concentration statistics for mixing-controlled reactive transport in random heterogeneous media. J. Contam. Hydrol. 2008, 98, 61–74. [Google Scholar] [CrossRef]
- Ghanta, K.C.; Purohit, N.K. Pressure drop prediction in hydraulic transport of bi-dispersed particles of coal and copper ore in pipeline. Can. J. Chem. Eng. 1999, 77, 127–131. [Google Scholar] [CrossRef]
- Shook, C.A.; Daniel, S.M. A variable–density model of the pipeline flow of suspensions. Can. J. Chem. Eng. 1969, 47, 196–200. [Google Scholar] [CrossRef]
- Sundqvist, A.; Sellgren, A.; Addie, G. Pipeline friction losses of coarse sand slurries: Comparison with a design model. Powder Technol. 1996, 89, 9–18. [Google Scholar] [CrossRef]
- Wilson, K.C.; Clift, R.; Addie, G.R.; Maffett, J. Effect of broad particle grading on slurry stratification ratio and scale-up. Powder Technol. 1990, 61, 165–172. [Google Scholar] [CrossRef]
- Christian, F.I. A cost perspective for long distance ore pipeline water and energy utilization. Part I: Optimal base values. Int. J. Miner. Process. 2013, 122, 1–12. [Google Scholar]
- Christian, F.I.; Santiago, M.; Aldo, T. A cost perspective for long distance ore pipeline water and energy utilization. Part II: Effect of input parameter variability. Int. J. Miner. Process. 2013, 122, 54–58. [Google Scholar]
- Lahiri, S.K.; Ghanta, K.C. Prediction of Pressure Drop of Slurry Flow in Pipeline by Hybrid Support Vector Regression and Genetic Algorithm Model. Chin. J. Chem. Eng. 2008, 16, 841–848. [Google Scholar] [CrossRef]
- Matoušek, V. Pressure drops and flow patterns in sand-mixture pipes. Exp. Therm. Fluid Sci. 2002, 26, 693–702. [Google Scholar] [CrossRef]
- Matoušek, V. Predictive model for frictional pressure drop in settling-slurry pipe with stationary deposit. Powder Technol. 2009, 192, 367–374. [Google Scholar] [CrossRef]
- Matoušek, V.; Krupička, J. One-dimensional modeling of concentration distribution in pipe flow of combined-load slurry. Powder Technol. 2014, 260, 42–51. [Google Scholar] [CrossRef]
- Kaushal, D.R.; Kimihiko, S.; Takeshi, T.; Funatsu, K.; Tomita, Y. Effect of particle size distribution on pressure drop and concentration profile in pipeline flow of highly concentrated slurry. Int. J. Multiphas. Flow 2005, 31, 809–823. [Google Scholar] [CrossRef]
- Kaushal, D.R.; Thinglas, T.; Tomita, Y.; Kuchii, S.; Tsukamoto, H. CFD modeling for pipeline flow of fine particles at high concentration. Int. J. Multiphas. Flow 2012, 43, 85–100. [Google Scholar] [CrossRef]
- Kaushal, D.R.; Tomita, Y. Experimental investigation for near-wall lift of coarser particles in slurry pipeline using γ-ray densitometer. Powder Technol. 2007, 172, 177–187. [Google Scholar] [CrossRef]
- Kaushal, D.R.; Tomita, Y.; Dighade, R.R. Concentration at the pipe bottom at deposition velocity for transportation of commercial slurries through pipeline. Powder Technol. 2002, 125, 89–101. [Google Scholar] [CrossRef]
- Kaushal, D.R.; Kumar, A.; Tomita, Y.; Kuchii, S.; Tsukamoto, H. Flow of mono-dispersed particles through horizontal bend. Int. J. Multiphas. Flow 2013, 52, 71–91. [Google Scholar] [CrossRef]
- Kaushal, D.R.; Tomita, Y. Solids concentration profiles and pressure drop in pipeline flow of multisized particulate slurries. Int. J. Multiphas. Flow 2002, 28, 1697–1717. [Google Scholar] [CrossRef]
- Fangary, Y.S.; Abdel ghani, A.S.; El haggard, S.M.; Williams, R.A. The effect of fine particles on slurry transport processes. Miner. Eng. 1997, 10, 427–439. [Google Scholar] [CrossRef]
- Schaan, J.; Sumner, R.J.; Gillies, R.G.; Shook, C.A. The effect of particle shape on pipeline friction for Newtonian slurries of fine particles. Can. J. Chem. Eng. 2010, 78, 717–725. [Google Scholar] [CrossRef]
- Langhaar, H.L.; Boresi, A.P.; Miller, R.E. Periodic excitation of a finite linear viscoelastic solid. Nucl. Eng. Des. 1974, 30, 349–368. [Google Scholar] [CrossRef]
- Langhaar, H.L.; Boresi, A.P. Periodic response of a viscoelastic cooling tower. Nucl. Eng. Des. 1972, 22, 95–123. [Google Scholar]
- Turian, R.M.; Yuan, T. Flow of Slurries in Pipelines. AIChE J. 1977, 23, 232–243. [Google Scholar] [CrossRef]
- Roco, M.C.; Shook, C.A. Computational method for coal slurry pipelines with heterogeneous size distribution. Powder Technol. 1984, 39, 159–176. [Google Scholar] [CrossRef]
- Lu, H.; Chen, L.; Wang, J.; Zhang, X.; Li, G.; Wang, J.; Chen, W.; Yan, B. Using a Modified Turian-Yuan Model to Enhance Heterogeneous Resistance in Municipal Sludge Transportation Pipeline. ACS Omega 2021, 6, 7199–7211. [Google Scholar] [CrossRef]
- Keska, J.K. Experimental investigation of spatial concentration spectra of a solid in a slurry in horizontal pipeline flow. Flow Meas. Instrum. 1994, 5, 155–163. [Google Scholar] [CrossRef]
- Nosrati, A.; Addai–Mensah, J.; Skinner, W. Rheological behavior of muscovite clay slurries: Effect of water quality and solution speciation. Int. J. Miner. Process. 2012, 102–103, 89–98. [Google Scholar] [CrossRef]
- Sun, H.F.; Cao, C.L.; Song, Y.P. Application of laser particle size and shape analyzer in testing grain sizes of sandy deposits. Mar. Geol. Quat. Geol. 2015, 35, 185–192. [Google Scholar]
- Zheng, Z.S.; Qu, X.H. Fractal characteristics and fractal dimension of PIM powder particles. China Mech. Eng. 2003, 14, 436–439. [Google Scholar]
Disclaimer/Publisher’s Note: The statements, opinions and data contained in all publications are solely those of the individual author(s) and contributor(s) and not of MDPI and/or the editor(s). MDPI and/or the editor(s) disclaim responsibility for any injury to people or property resulting from any ideas, methods, instructions or products referred to in the content. |
© 2025 by the authors. Licensee MDPI, Basel, Switzerland. This article is an open access article distributed under the terms and conditions of the Creative Commons Attribution (CC BY) license (https://creativecommons.org/licenses/by/4.0/).