Abstract
Ocean wave energy has emerged as a promising source in the pursuit of sustainable energy solutions, with Oscillating Water Column (OWC) systems standing out due to their simplicity and potential. This study analyzes how the geometric and physical parameters of the OWC chamber influence internal airflow dynamics, a key factor in the performance of the Wells turbine. The methodology includes a mathematical approximation, the definition of chamber geometry, and the design parameters of both the chamber and the Wells turbine. Three configurations were evaluated using Computational Fluid Dynamic (CFD) simulations. The impact of key variables such as chamber inclination and cross-sectional shape on air velocity and pressure at the turbine inlet was assessed. The results indicate that, among cylindrical, inclined cylindrical, and rectangular configurations, the inclined cylindrical chamber design significantly enhances airflow stability and turbine efficiency. These findings offer valuable insights for enhancing the overall performance of OWC based energy systems.
1. Introduction
Fossil fuels continue to play a dominant role in meeting the growing global energy demand. Simultaneously, decarbonization has become a key focus for the public and private sectors, aiming to reduce environmental impacts. Data show that between 2013 and 2023, global energy demand increased by 15%, with renewable energy sources accounting for 40% of the additional demand [1]. The ocean is regarded as one of the most promising renewable energy sources. Multiple technologies have been developed to harness this potential, including buoy systems, marine turbines, and various devices designed to capture energy from water movement [2,3]. Tidal energy, in particular, has garnered significant attention due to its numerous advantages. First, it has a high energy density, approximately ten times greater than solar and wind energy. Second, tidal energy offers an availability rate exceeding 90%, compared to around 20% for solar and wind energy. Finally, the devices used for energy conversion generally produce minimal environmental impact [4,5]. Drew et al. [6] classified tidal energy converters into three categories according to their installation characteristics: attenuator, terminator, and point absorber. Additionally, these converters were classified into four types based on their operating principles: Oscillating Water Column (OWC), submerged pressure differential, overtopping system, and sudden increase in oscillating water. This study focuses specifically on the OWC system, which comprises a fixed chamber where the interaction between air and water drives a Wells turbine to generate electricity.
Several innovative approaches have been explored in OWC technology. One experimental study investigated a triple OWC configuration integrated with a wind turbine. The results demonstrated that the internal air pressure within the OWC significantly influences the water column level. Consequently, this effect can lead to a considerable reduction in power output. However, this loss can be mitigated by optimizing the orifice size of the OWC chamber [7]. Another field study concluded that the design of an OWC system depends on two primary variables: the power conversion efficiency of the device and its operational functionality. These variables highlight the importance of designing systems based on predictable energy output, which can be significantly enhanced through the use of computational modeling techniques [8]. The numerical approach has also been extended to more complex configurations, such as dual OWC systems subjected to irregular wave conditions. One study concluded that while these systems exhibit slightly improved performance under regular wave conditions, their efficiency decreases under resonance conditions, indicating sensitivity to wave variability and structural interactions [9].
The OWC system harnesses the motion of waves within a closed structure to generate an oscillating air column. The confined air is compressed and directed toward a Wells turbine. As the wave recedes, a suction effect occurs, drawing air back through the system in the opposite direction. Owing to the design of the Wells turbine, the shaft maintains a consistent rotational direction regardless of the airflow orientation, enabling continuous energy conversion [10,11]. The Wells turbine is coupled to a generator using a gearbox and the optimization of this system could include fault detection analysis, since the rotational speed is variable [12]. This field of study aims to minimize unplanned downtime, ensure long-term reliable operation, and enhance the productivity of mechanical systems [13].
Energy conversion efficiency determines the quantity and quality of the energy produced. To maximize the performance of an OWC system, it is necessary to modify either the turbine characteristics or the geometric properties of the chamber to optimize airflow and achieve near-resonance conditions with the incident waves, thereby minimizing energy losses [11,14]. These modifications produce varying results depending on the site where the OWC system is deployed. Bingyong and Ringwood highlight that geometric optimization is fundamental in enhancing the hydrodynamic performance of Wave Energy Converters (WECs). Furthermore, this optimization not only improves energy capture under moderate wave conditions but also increases the structural resilience of the system when subjected to extreme sea states [15].
An experimental approach is presented by Wanan Sheng [16], who evaluated the performance of cylindrical OWCs based on the discharge diameters of post-conversion systems. The study demonstrated that a natural period of 2.25 s is optimal for achieving high efficiency levels. The prototype used had an external diameter of 0.316 m and an internal diameter of 0.104 m, forming a cylindrical column, and was tested in a wave tank measuring 25 m in length, 18 m in width, and 1 m in depth. Sheng’s findings confirm that such fixed OWC structures perform significantly better than floating devices in terms of energy capture efficiency. In another experimental study, it was demonstrated that the performance of a cylindrical chamber system equipped with VB-shaped channels remains largely unaffected by variations in wave amplitude when the wave period is held constant. This finding reinforces the significance of the wave period as a critical parameter in the performance analysis and design of OWC systems [17].
In a review conducted by Ming and Dezhi, the authors highlighted the methodologies employed in numerical modeling for hydrodynamic performance analysis of OWC devices. Their study empathized that two-dimensional models offer operational advantages due to their simplicity and the ability to deliver high-quality approximations for simulating pneumatic air columns. The review concludes that further research is required to comprehensively compare the efficiencies of Wells turbines. Additionally, the authors conclude the need for more numerical validations to contrast the experimental works [18].
Despite the numerous studies conducted, research has not yet established standardized conclusions regarding the optimal geometry, orientation, and inclination of the OWC chamber. Ongoing experimental investigations with diverse configurations and design models remain essential to identify new alternatives that can meaningfully enhance the system’s overall performance. Table 1 provides a brief comparison of the most notable elements from the reviewed studies, allowing for the identification of well-explored areas and those that require further investigation.

Table 1.
Overview pf OWC designs, methodologies and main conclusions from the relevant literature.
This study primarily focuses on optimizing airflow within the chamber. Its objective is to review and evaluate the key parameters and characteristics that influence flow development, using Computational Fluid Dynamic (CFD) tools, as a preliminary step before the air reaches the turbine. Proper control of the airflow direction within the chamber enhances the performance of the OWC system and mitigates the adverse effects of fluctuating and cyclic loads on the turbine and shaft.
This work presents a novel approach to optimizing the geometry of the Oscillating Water Column chamber, aiming to maximize airflow efficiency and energy conversion performance. While previous studies have mainly focused on standard geometries, this research compares cylindrical, rectangular, and inclined hydropneumatic chambers through comprehensive CFD simulations. The main contribution of this work is the identification of key design parameters that significantly enhance airflow velocity and pressure distribution, resulting in improved interaction with the Wells turbine. These findings represent a significant step toward the development of more efficient OWC systems.
2. Materials and Methods
Recent developments in tidal energy utilization highlight several considerations depending on the system type due to the diversity of operational principles across onshore, nearshore, and offshore configurations. Offshore systems like WECs typically entail high installation, operation, and maintenance costs. The most extensively studied WECs are categorized as floating or submerged, and further distinguished as rotational or translational devices, including terminator and attenuator systems. Each converter type requires specific wave characteristics, such as direction, amplitude, and period, to achieve optimal performance [15].
Among nearshore systems, one of the most extensively implemented concepts is the point absorber (PA), a type of WEC characterized by dimensions smaller than the incident wavelength. These systems generally provide lower maintenance and operational costs compared to offshore technologies [15].
Onshore systems are installed directly along the coastline, offering advantages such as easier infrastructure development, maintenance access, and lower capital investment compared to offshore and nearshore alternatives. Nevertheless, their performance is inherently limited by the reduced energy content of waves reaching the shore. The OWC system is classified as an onshore technology, with several real-world implementations currently in operation [15].
Harnessing energy from sea and ocean waves requires a thorough understanding of the sequence of energy transformations involved. Tidal and wave energy’s primary appeal lies in the widespread availability of coastal environments and the predictable, cyclical nature of ocean dynamics. In developing regions, such as South America, the ocean is increasingly seen as a promising energy source to supply areas with limited access to conventional power grids.
The fundamental operating principle of the OWC system can be divided into three main stages. The first involves converting wave energy into mechanical energy through the interaction between ocean waves and the structure. In this phase, the geometric optimization of the chamber plays a critical role in achieving a favorable hydrodynamic performance. The second stage consists of transforming mechanical energy into electrical energy, typically through the operation of an air turbine, most commonly the Wells turbine. The final stage focuses on enhancing the quality and stability of the electrical output through power electronics.
2.1. Mathematical Approximation
The pneumatic chamber analyzed in this study has been the subject of research by several authors. López et al. [11] emphasize the impact of innovative geometries designed to reduce energy losses and improve the system’s ability to resonate with incident waves. Their findings were derived using a mathematical model based on the Navier–Stokes equations for incompressible fluids, which are presented in Equations (1) and (2).
where represents the water density, the particle velocity, the pressure, the dynamic viscosity, and g the gravitational acceleration.
In this study, an OWC system with a stepped front bottom is proposed to maximize the piston-like action generated by the water volume surpassing the step. This configuration enhances energy conversion by optimizing the relationship between the capture width and the oscillation period range. The proposed design was compared with three alternative OWC configurations.
The first configuration features a front wall attached to the original structure, creating a U-shaped geometry that increases the oscillation frequency of the water column by channeling the flow into a wider chamber. The second alternative is an L-shaped geometry, incorporating a channel toward the incoming wave front. This design improves system resonance and offers greater adaptability to rigid configurations, as it presents broader ranges of oscillation periods and amplitudes. The third configuration involves modifications to the inclination, length, and opening angle of the structural wall of a classic OWC system, resulting in improved performance compared to the original design.
All configurations were analyzed under identical physical, environmental, and climatic conditions, as these external factors, often specific to each location, can significantly influence system behavior. While the optimal performance levels were achieved when the OWC’s water intake was positioned closer to the seabed, this approach presents increased challenges for installation and maintenance due to the inherent rigidity of traditional OWC structures. Among the configurations studied, the L-shaped geometry demonstrated the best performance in optimizing system operation concerning wave amplitude.
In another study, Nader [19] reports that optimizing the OWC system geometry can be achieved by adjusting the angles of the chamber’s structural plates. Specifically, it was found that when the plates are inclined downward at angles of less than 90 °C, an inverse relationship exists with the airflow exiting the chamber. Furthermore, favorable results were observed when the front and rear plates were configured to remain parallel.
According to Saddam [20], the efficiency of an OWC system is defined in Equation (3) as the product of the electrical power obtained after the energy conversion process from the pneumatic energy generated by wave-induced air compression to the mechanical energy that drives the turbine, and finally to the electrical energy produced by the generator.
Pneumatic efficiency, as defined by Parra [21], corresponds to the power output at the air chamber outlet, and is expressed through a specific formulation in Equation (4).
where represents the oscillation period, is the instantaneous pressure inside the chamber, Schamber denotes the volumetric flux through the water plane area, and Vfs refers to the velocity at the free surface of the water.
Wave power can be developed using Equation (5).
where represents the water density, g is the gravitational acceleration, H denotes the wave height, and corresponds to the group velocity at a given finite water depth.
Finally, it is necessary to understand the modeling of wavelength in Equation (6).
where T denotes the incident wave period, and represents the local water depth. The Appendix A explains how the design and modeling variables are estimated, in conjunction with the equations presented.
2.2. Parameters of Design
The design parameters used in this study are based on the work of Sadam et al. [20], which evaluated the OWC configuration to enhance both power output and overall efficiency. The primary parameters considered in the analysis are each defined as a function of the water height. Specifically, the chamber width is set as 0.92 h (where h is the water) and 0.42 L (where L is the wavelength). The air chamber height is defined as 3B (with B being the chamber width). The submerged front wall height ranges between 0.35 h and 0.45 h, the opening length ranges from 0.65 h to 0.8 h, and the inclination angle varies between 45° and 55°.
2.3. OWC Geometric Designs
The dimensional relationships considered in the study by Ding et al. [15] focus on optimizing the chamber geometry to enhance the dynamic performance of OWC systems. Their evaluation suggests that, for the specific conditions analyzed, the chamber should exhibit the following dimensional ranges: a width between 10 and 12 m, a wall thickness between 0.5 and 3 m, and a draft between 3 and 5 m.
Figure 1 illustrates the design of the cylindrical chamber, which is an adaptation of the configuration proposed by Rozali et al. [22]. This design features a circular profile inlet with an inclination angle of 15°, intended to enhance the capture of incident waves. The chamber’s cross-sectional area is gradually reduced along its length to increase wave velocity and improve air column compression. The circular geometry has demonstrated favorable performance even under low-amplitude wave conditions. Additionally, the smooth momentum of the water is attributed to the consistent wave amplitude distribution induced by the transverse geometric configuration.

Figure 1.
Geometric design of the cylindrical chamber in the OWC system.
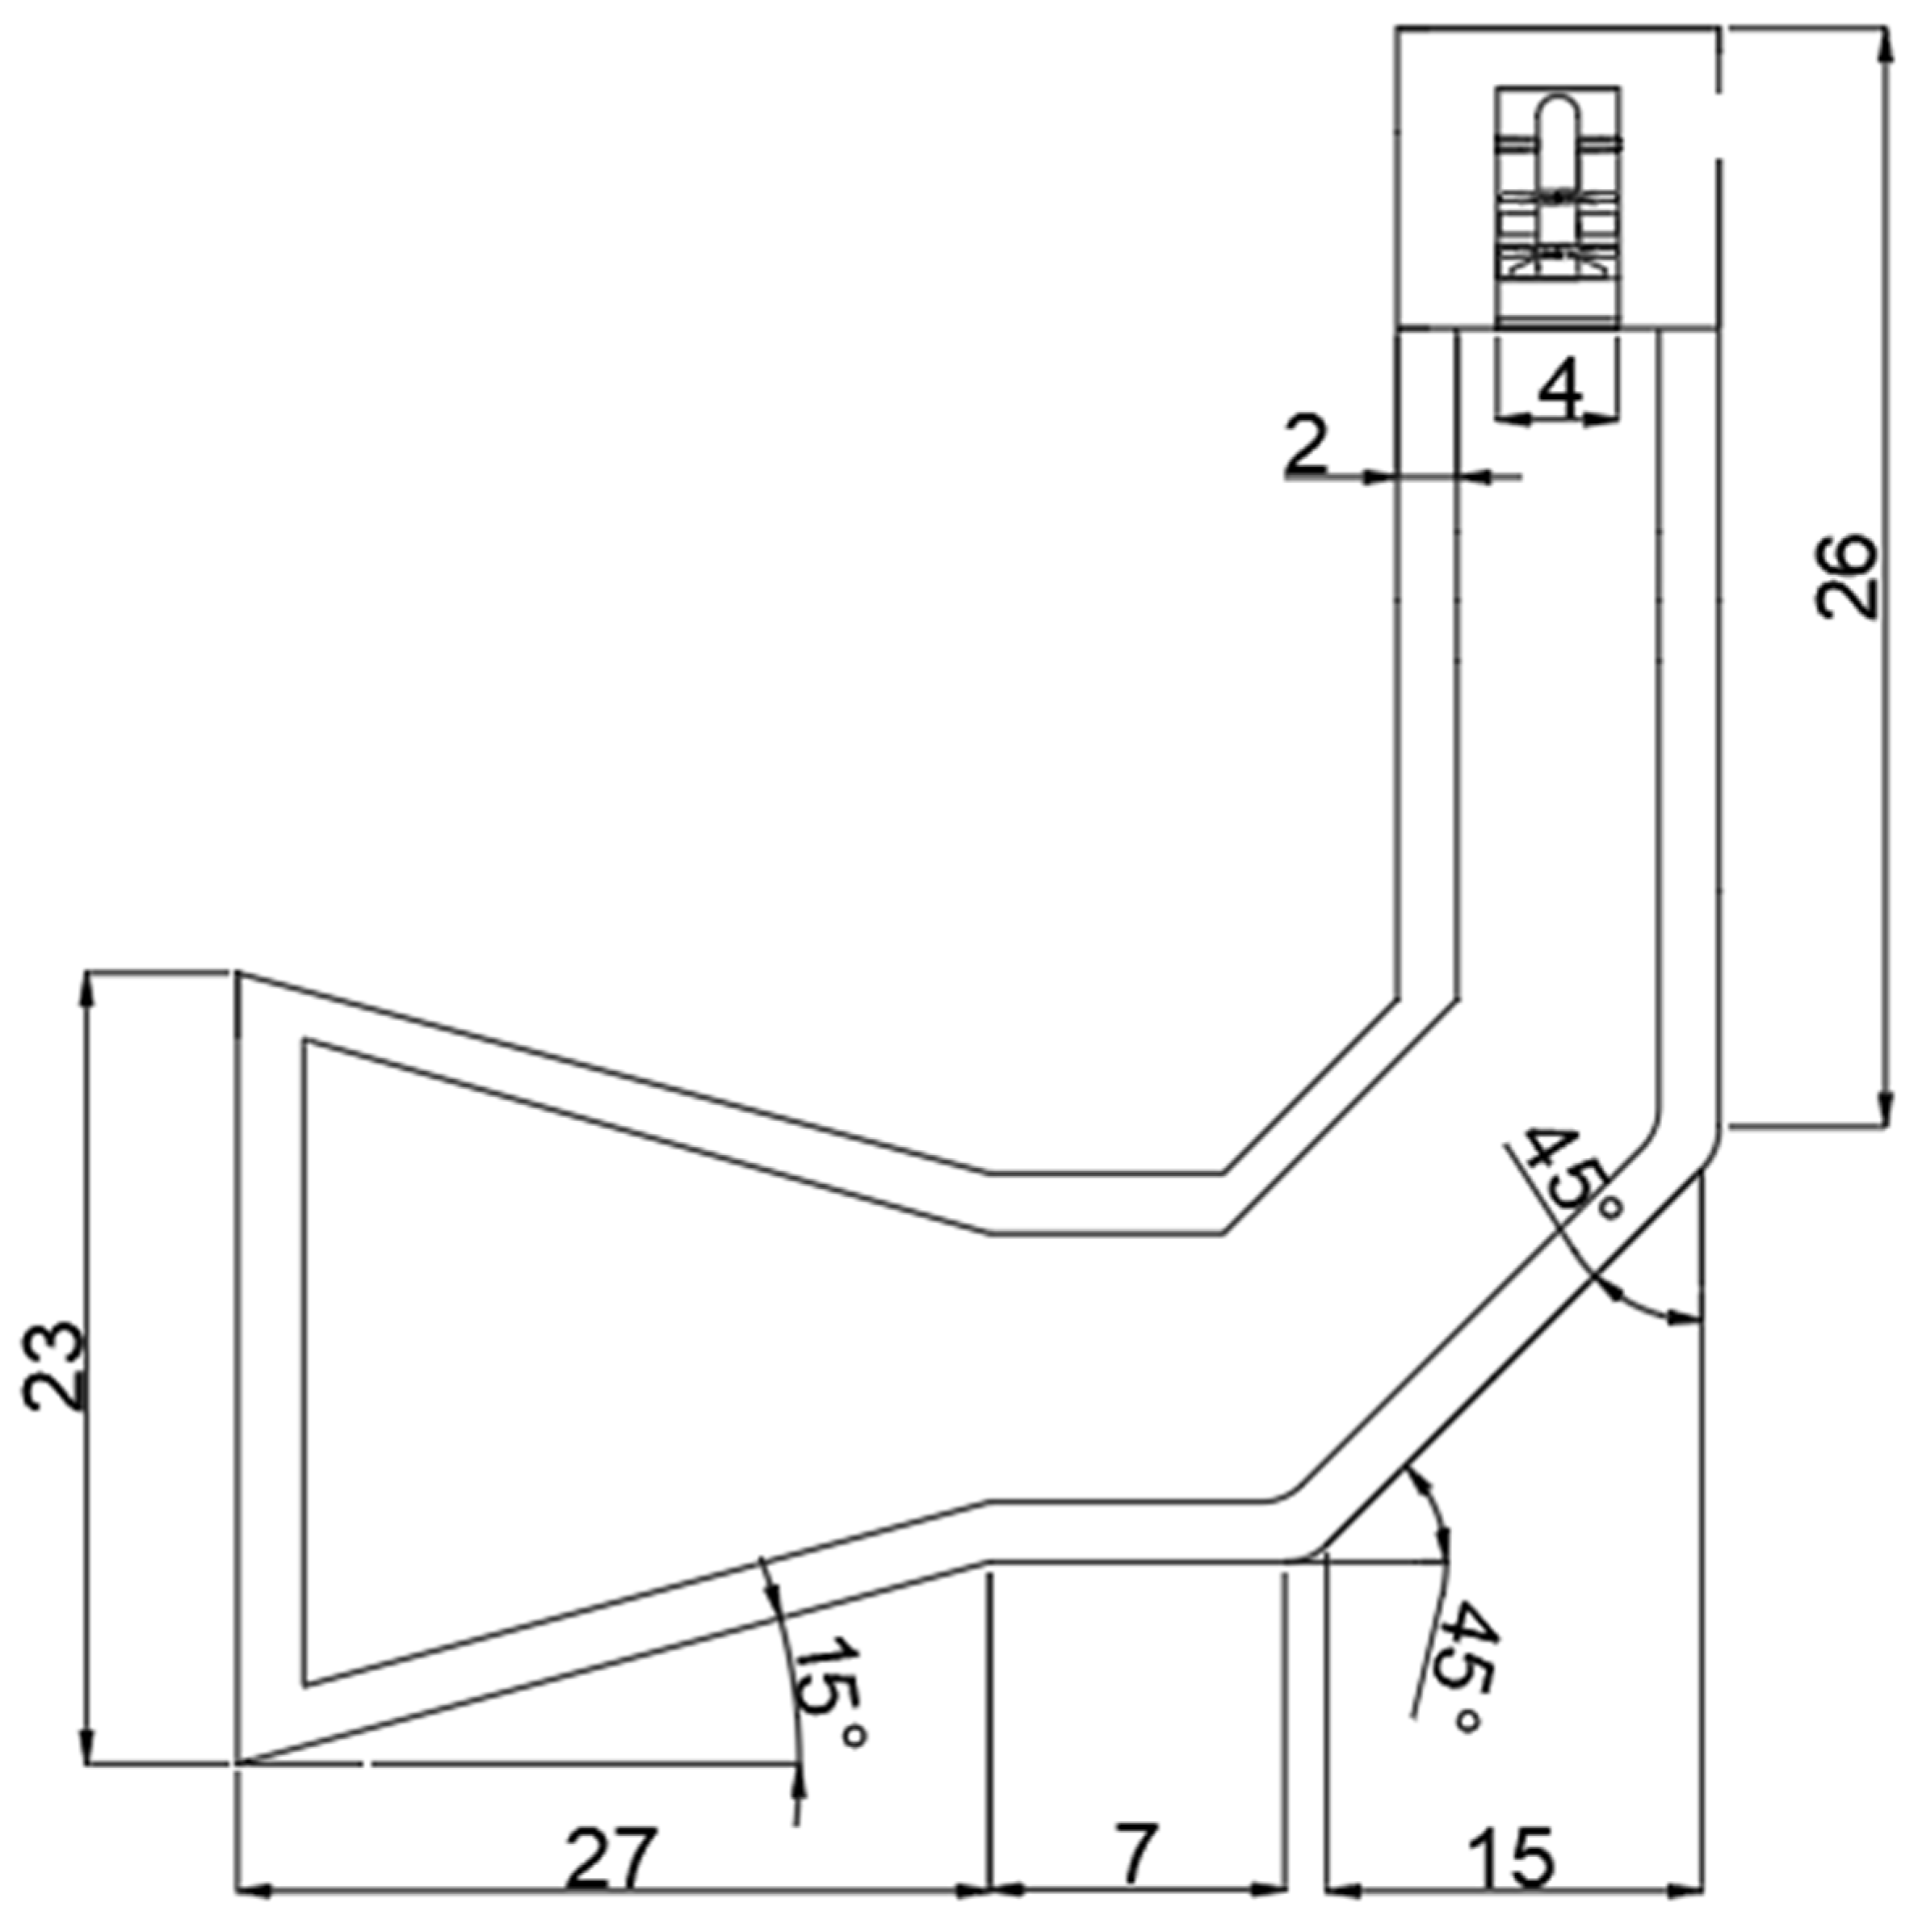
Figure 2, adapted from the work of Sadam et al. [20], incorporates a water inlet with a 55° inclination to promote smooth and uniform flow into the chamber. The chamber adopts a circular cross-section that minimizes friction-related energy losses to enhance efficiency. The upper part of the chamber transitions into a conical section, gradually reducing the cross-sectional area to accelerate the airflow using the Venturi effect, ultimately directing it through a circular orifice connected to the Wells turbine. This configuration is recommended over rectangular geometries due to its superior aerodynamic and hydrodynamic performance.
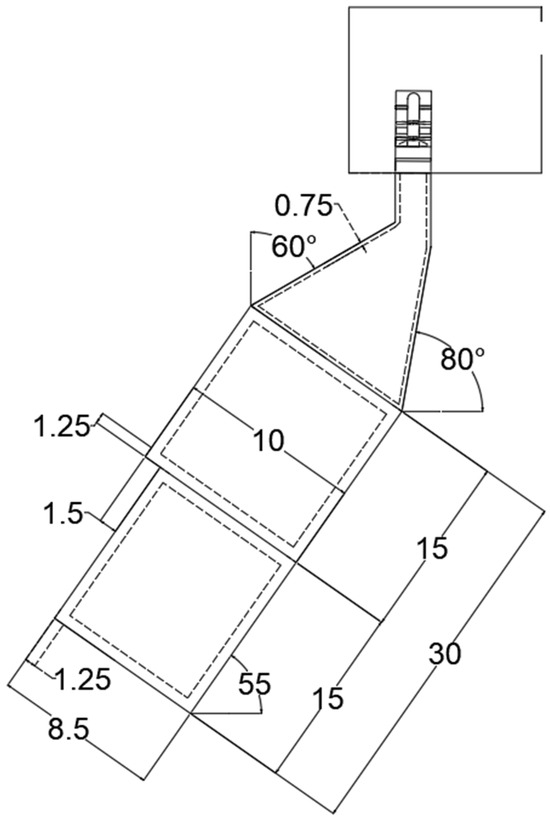
Figure 2.
Geometric design of the inclined cylindrical chamber in the OWC system.
Figure 3’s design alternative is based on the work developed by Ram et al. [23]. It consists of an air chamber with a rectangular cross-section that transitions into a cylindrical form in the upper section, where the turbine is installed. The proposed geometry seeks to improve both the air and water flow within the chamber. An inclination angle of 45° is incorporated to reduce wave reflection, enhance internal flow dynamics, and maintain the fluid’s dynamic pressure at approximately 33%, as reported by Ram.
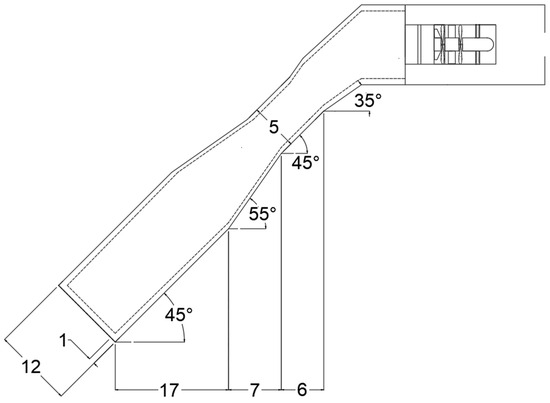
Figure 3.
Geometric design of the rectangular chamber transitioning to a cylindrical shape.
Table 2 presents a comparative analysis of each proposed model’s advantages and disadvantages, highlighting each configuration’s capacity to stabilize key operational variables.
Table 2.
Evaluation of the advantages and disadvantages of the analyzed systems.
2.4. Wells Turbine Design
A Wells turbine is a bidirectional element capable of rotating in a single direction regardless of the airflow direction. This characteristic offers significant operational advantages and has led to extensive research into blade geometry. Ahmed, among other authors, has emphasized the efficiency of airfoil profiles such as the NACA 0015, which is employed in the present OWC design. The NACA 0015 profile provides notable benefits, including a 33% increase in the operational range, attributed to the delayed onset of flow blockage and the reduction in reverso flow over the blade surface. The parameters adopted for designing the Wells turbine are summarized in Table 3.
Table 3.
Wells turbine design parameters.
2.5. Computational Fluid Dynamic Configuration
The CFD simulation setup was based on the parameters outlined in Table 4, which presents the main configuration factors considered for the analysis.
Table 4.
Computational fluid dynamic parameters.
3. Approximations to Optimize Oscillating Water Column System
A key factor in enhancing the efficiency of the OWC system is the design of the chamber’s duct geometry. Several studies have proposed approximations to address this aspect. However, further research is required to gain a deeper understanding of its behavior under fluid dynamics. Sadam et al. [20] designed an air chamber with a circular transverse section to study the uniform flow achieved with this configuration. The results indicate that this design is suitable for low-wave energy climates. Furthermore, the authors affirm that the air chamber is one of the primary factors in achieving optimal efficiency in the OWC system. Liu et al. [24] designed a scaled OWC wave energy converter, where the chamber was structured with a simplified rectangular shape in the transverse section. The results indicated that the turbine was oversized, making the efficiency analysis of the OWC challenging and leading to non-optimized efficiencies in the chamber–turbine configuration.
Another critical factor to consider is the slope of the chamber. This parameter is a key factor in the design of OWC models, as it can reduce wave reflection upon impact or interaction with the structure. The fundamental objective of this design consideration is to ensure a continuous water column to drive the turbine. Studies, such as those conducted by Ram et al. [25], have verified that incorporating an inclination angle between 90° and 55° in the capture chamber can lead to a 200% reduction in dynamic pressure within the air chamber. Most experimental studies have focused on this range.
The third crucial factor is the duct diameter. Palet et al. [23] indicated that the nozzle of the duct functions to accelerate the flow velocity and redirect it to maximize its impact on the airflow of the Wells turbine. However, if the duct diameter is too small, the flow velocity may increase to levels where cyclic loads could lead to critical failures in the turbine.
The literature includes a variety of studies examining specific components of the OWC structure. Rozali et al. [22] studied the impact of the air duct shape on the performance of the OWC system, comparing rectangular, oval, and circular transverse sections. The results indicate that the pressure distribution varies significantly, with pressure drops being lower in the oval and circular sections compared to the rectangular section. Regarding the mechanical behavior analysis, the oval design exhibited the best performance, followed by the circular design, with the rectangular design performing the least effectively. The oval design achieved the highest turbine rotation, enhancing the system’s overall efficiency.
Ding et al. used a different approach [26]. They modified the OWC system’s infrastructure by altering the chamber width, the front wall thickness, and the front wall draft. The optimized model exhibited increased relative amplitude and reduced energy dissipation, resulting in higher efficiency than the rectangular configuration.
Similarly, in a study conducted by Saddam et al. [10], an air chamber with a cylindrical configuration, an upper conical section, and an inclined angle was designed. The results demonstrated that the proposed design reduced energy losses at corners and sharp edges. Additionally, the oscillatory motion of the water column was enhanced, leading to an overall increase in the device’s efficiency.
4. Results
The results’ analysis is structured in three phases. The first phase focuses on calculating the water column height. In order to develop a fluid dynamic evaluation involving both water and air interfaces, it was essential to determine the interface level using three variables. The independent variable is the wave period, which governs the overall behavior of the system, while the dependent variables are the wavelength and the k factor. The k factor relates the water column height to the wave amplitude and incorporates the ratio between the inlet and chamber areas, as expressed in Equation (6). Since each design presents different inlet and chamber dimensions, a unique characteristic curve is obtained for each configuration. The second phase addresses the design of the Wells turbine based on established aerodynamic and mechanical parameters. This section highlights the key design considerations for power transmission and turbine efficiency. The turbine is a standard element across all evaluated OWC configurations, and it is one of the fundamental parts in the energy conversion system. The third phase presents the simulation results, which analyze system performance across a wave period range from 4 to 18 s. The velocity and pressure vector fields are examined, with representative graphs shown for a 12 s’ period. The analysis begins with water flow behavior, followed by airflow dynamics. These results contribute to the development of scalable and full-scale models for future applications. By relying on computational analysis, this study offers a simplified and idealized approach to understanding fluid behavior within the OWC chambers. The proposed configurations can help reduce development time and costs by focusing on system efficiency.
4.1. Calculation of the Oscillating Water Column Height
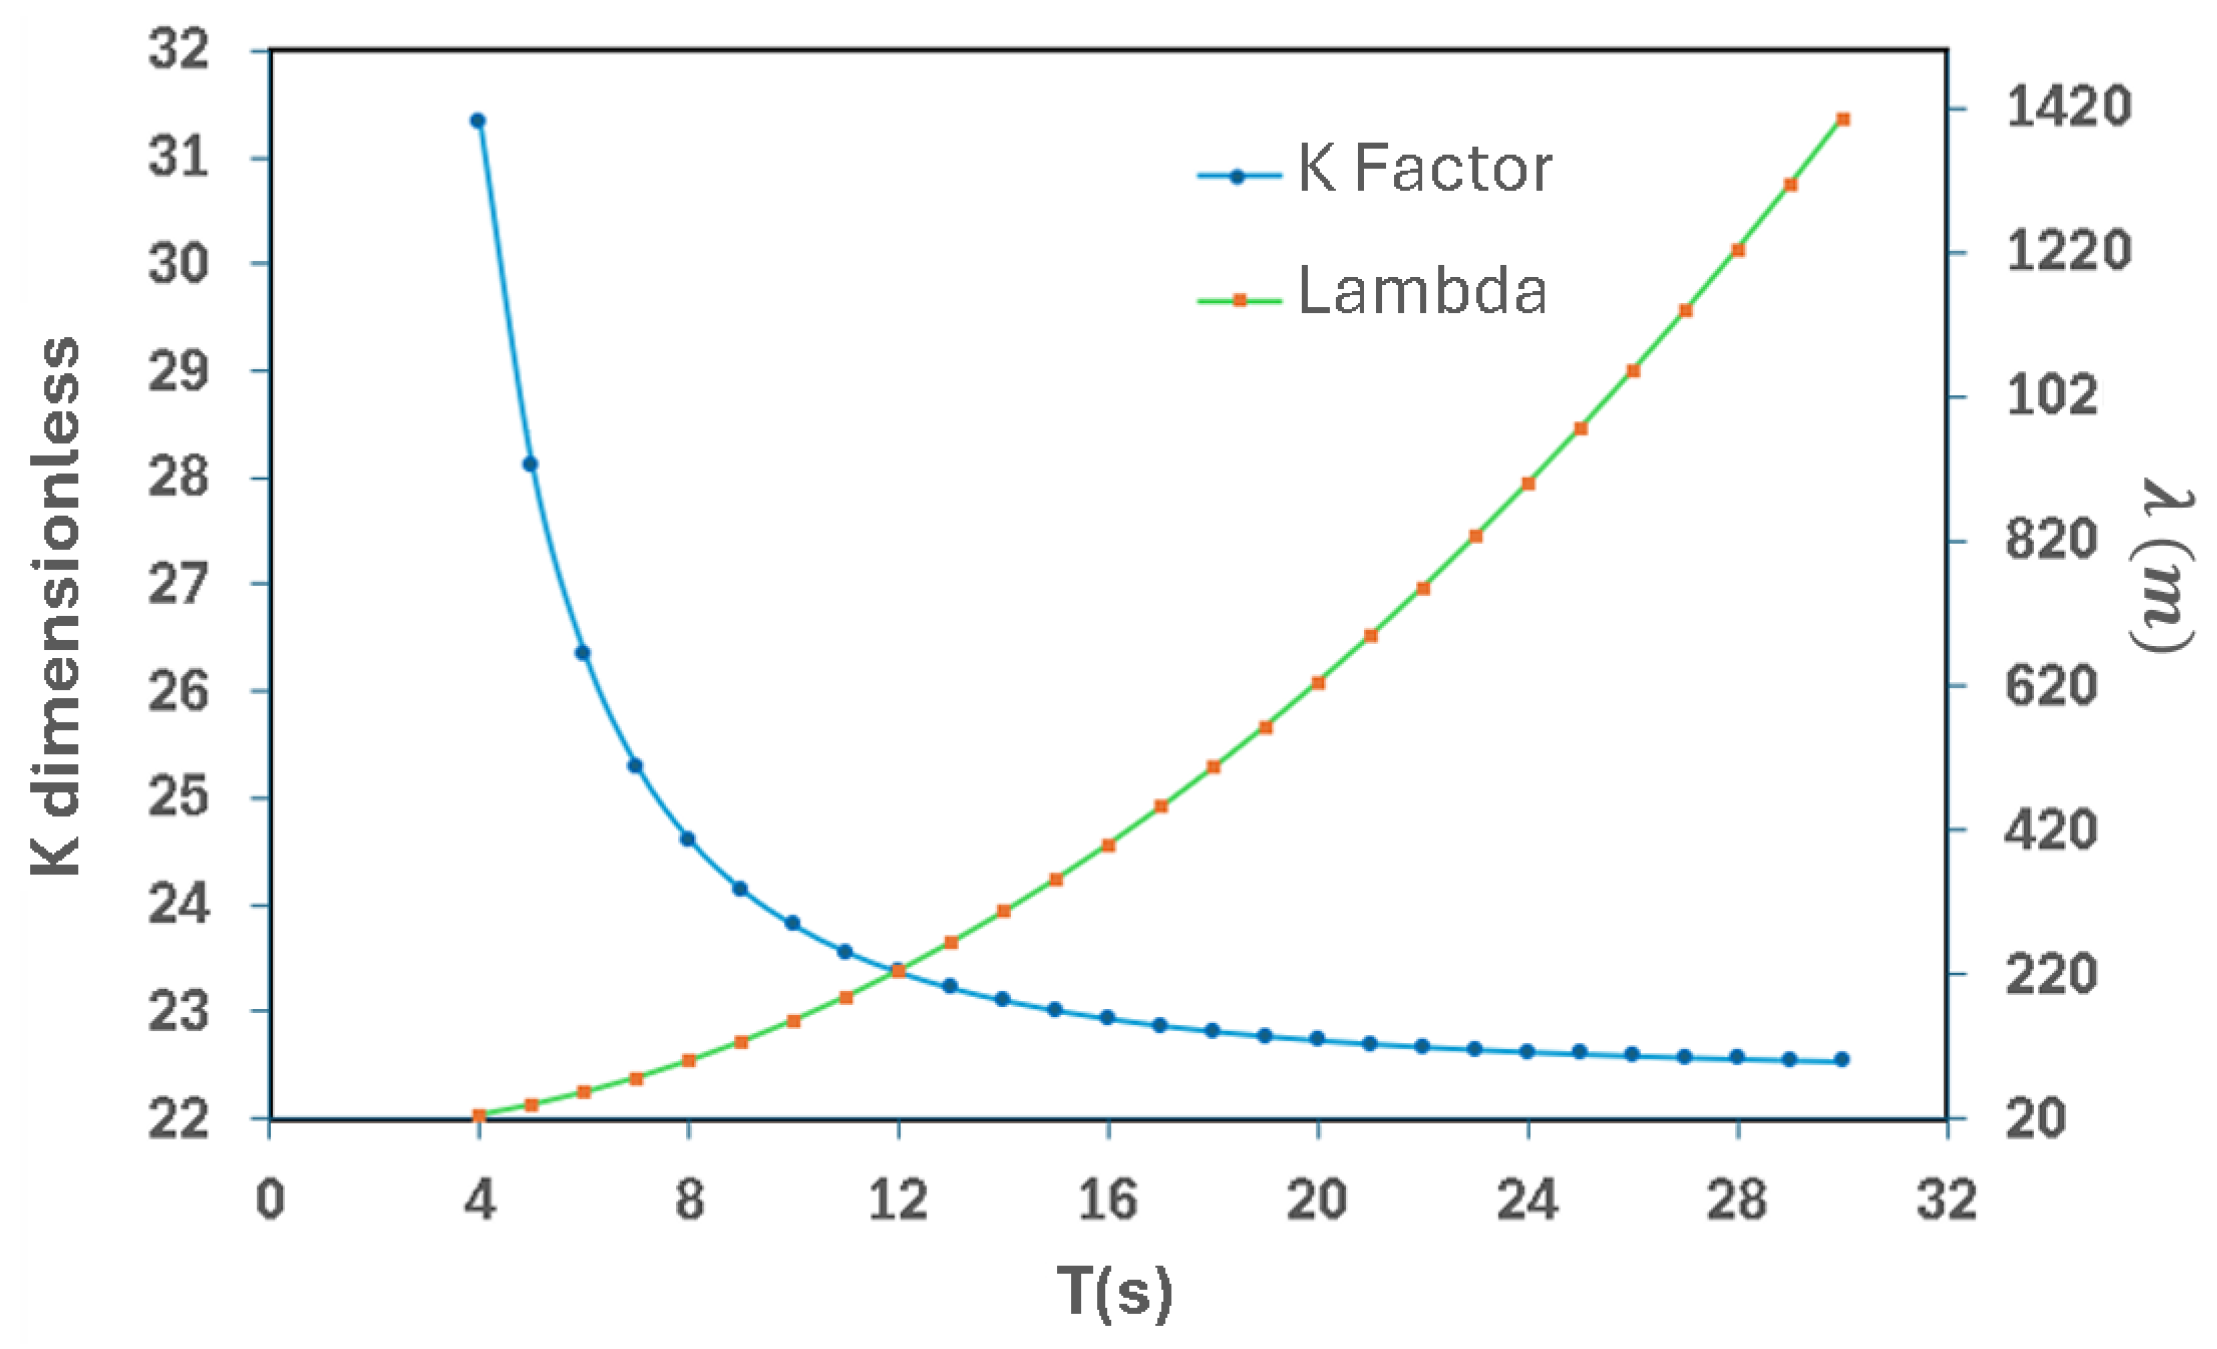
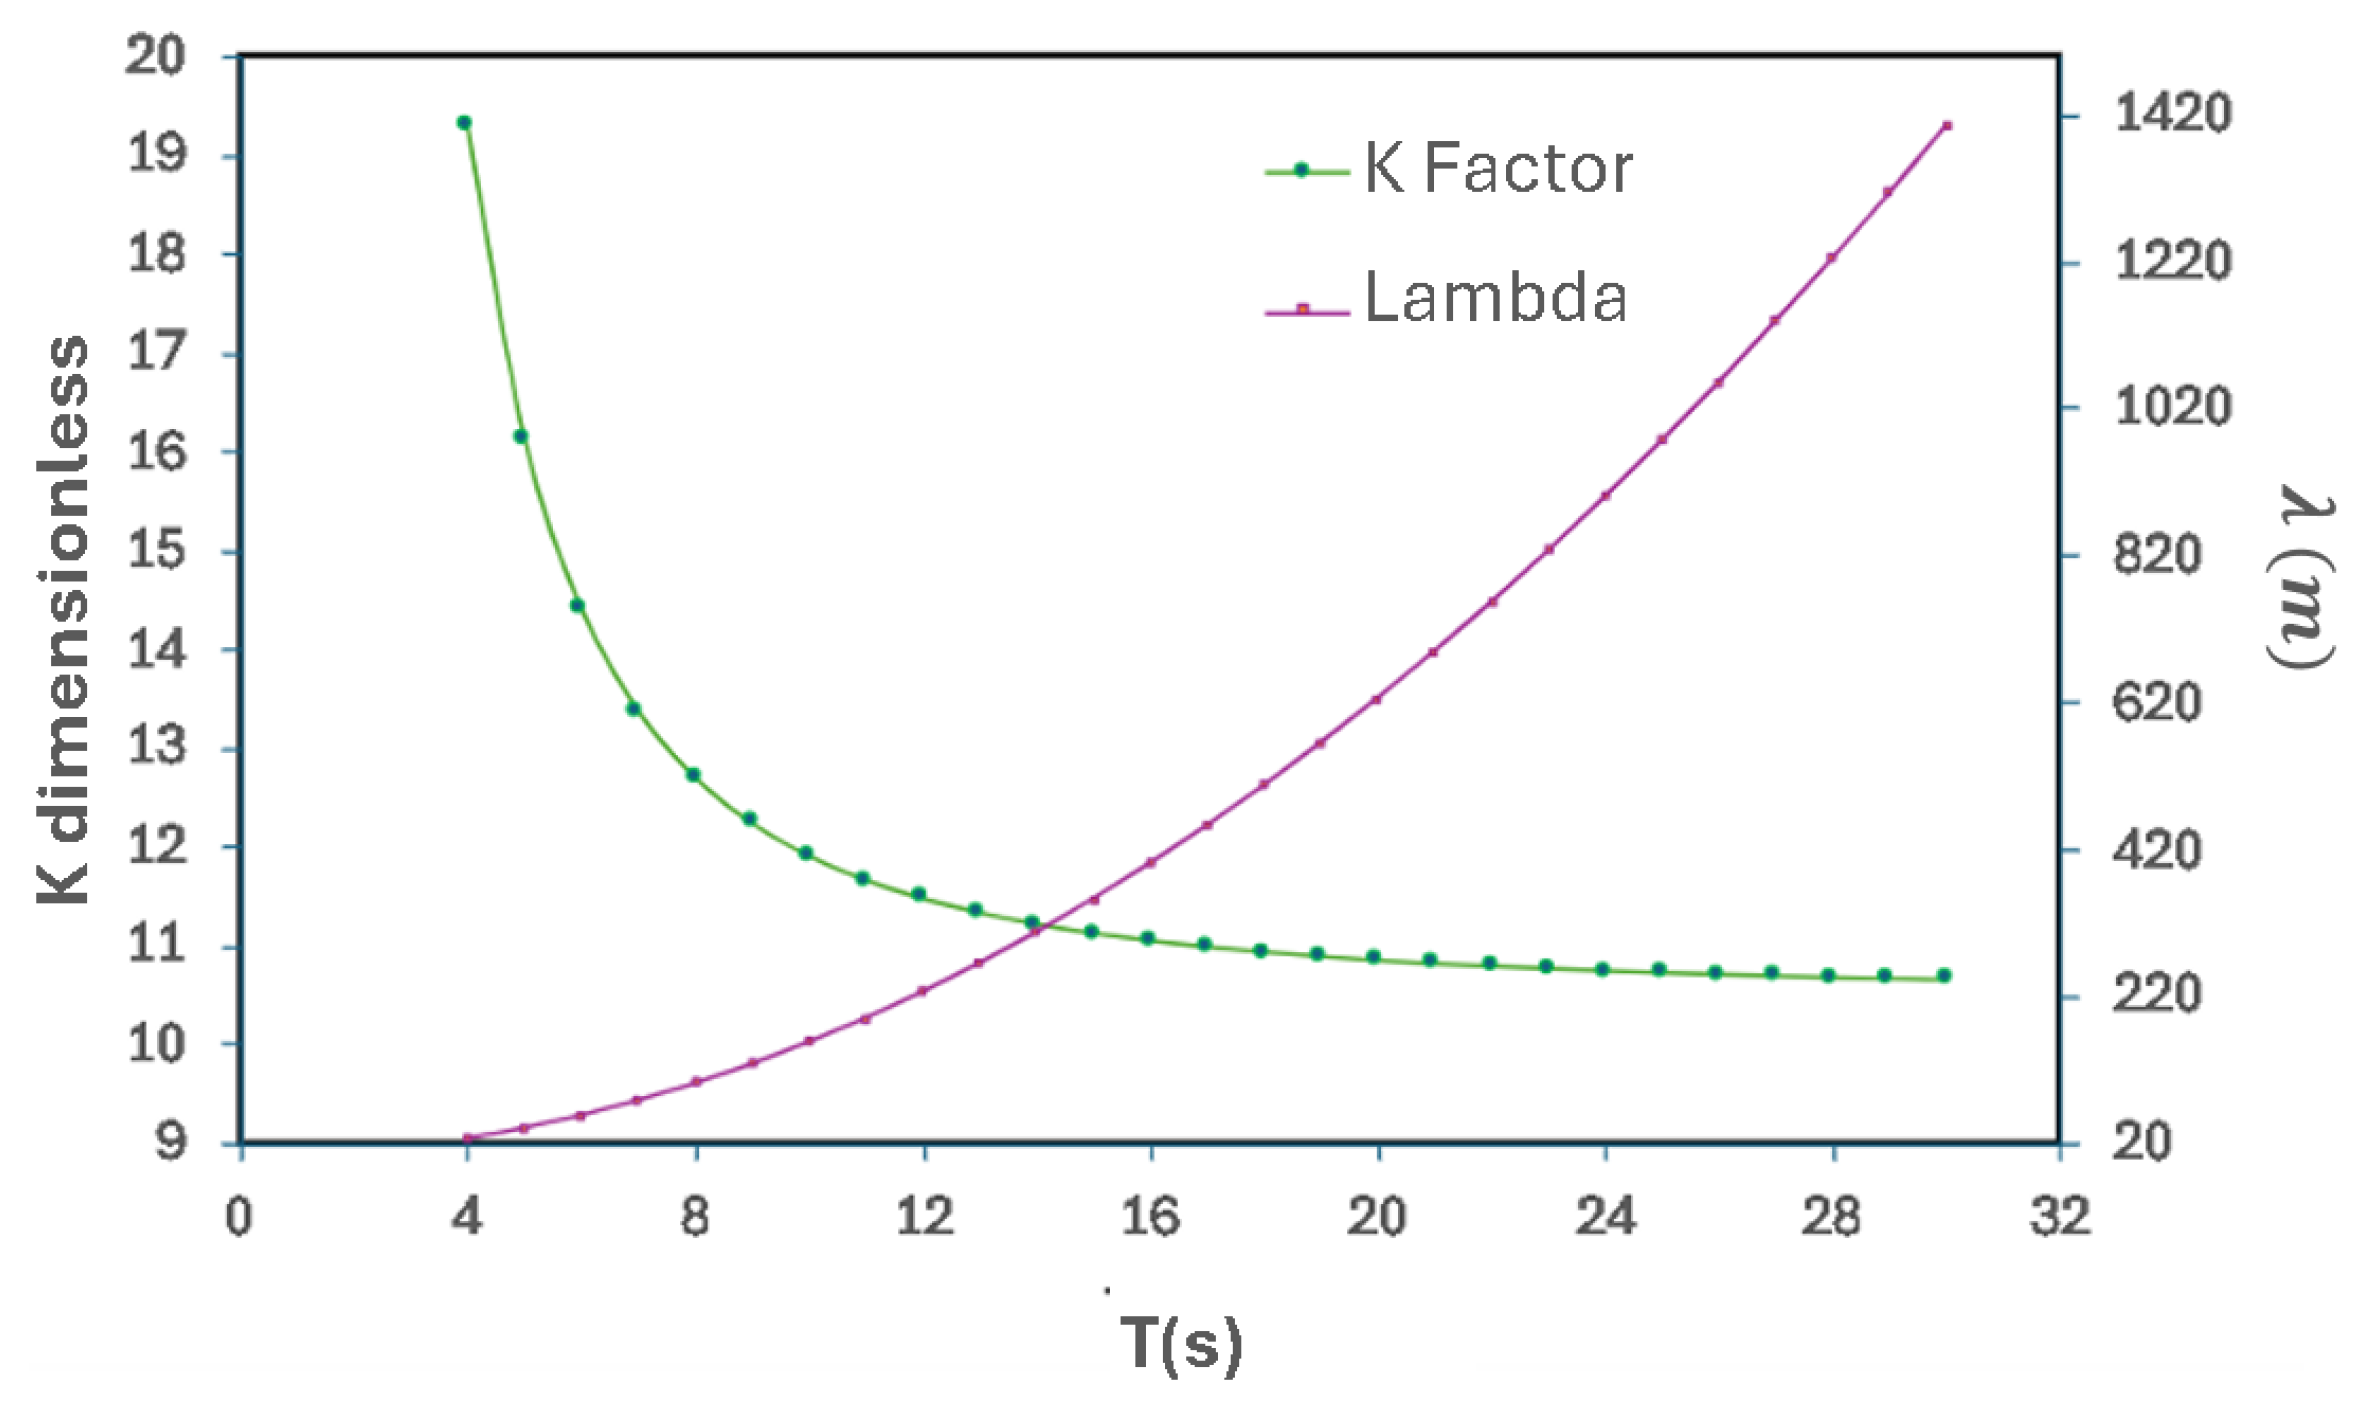
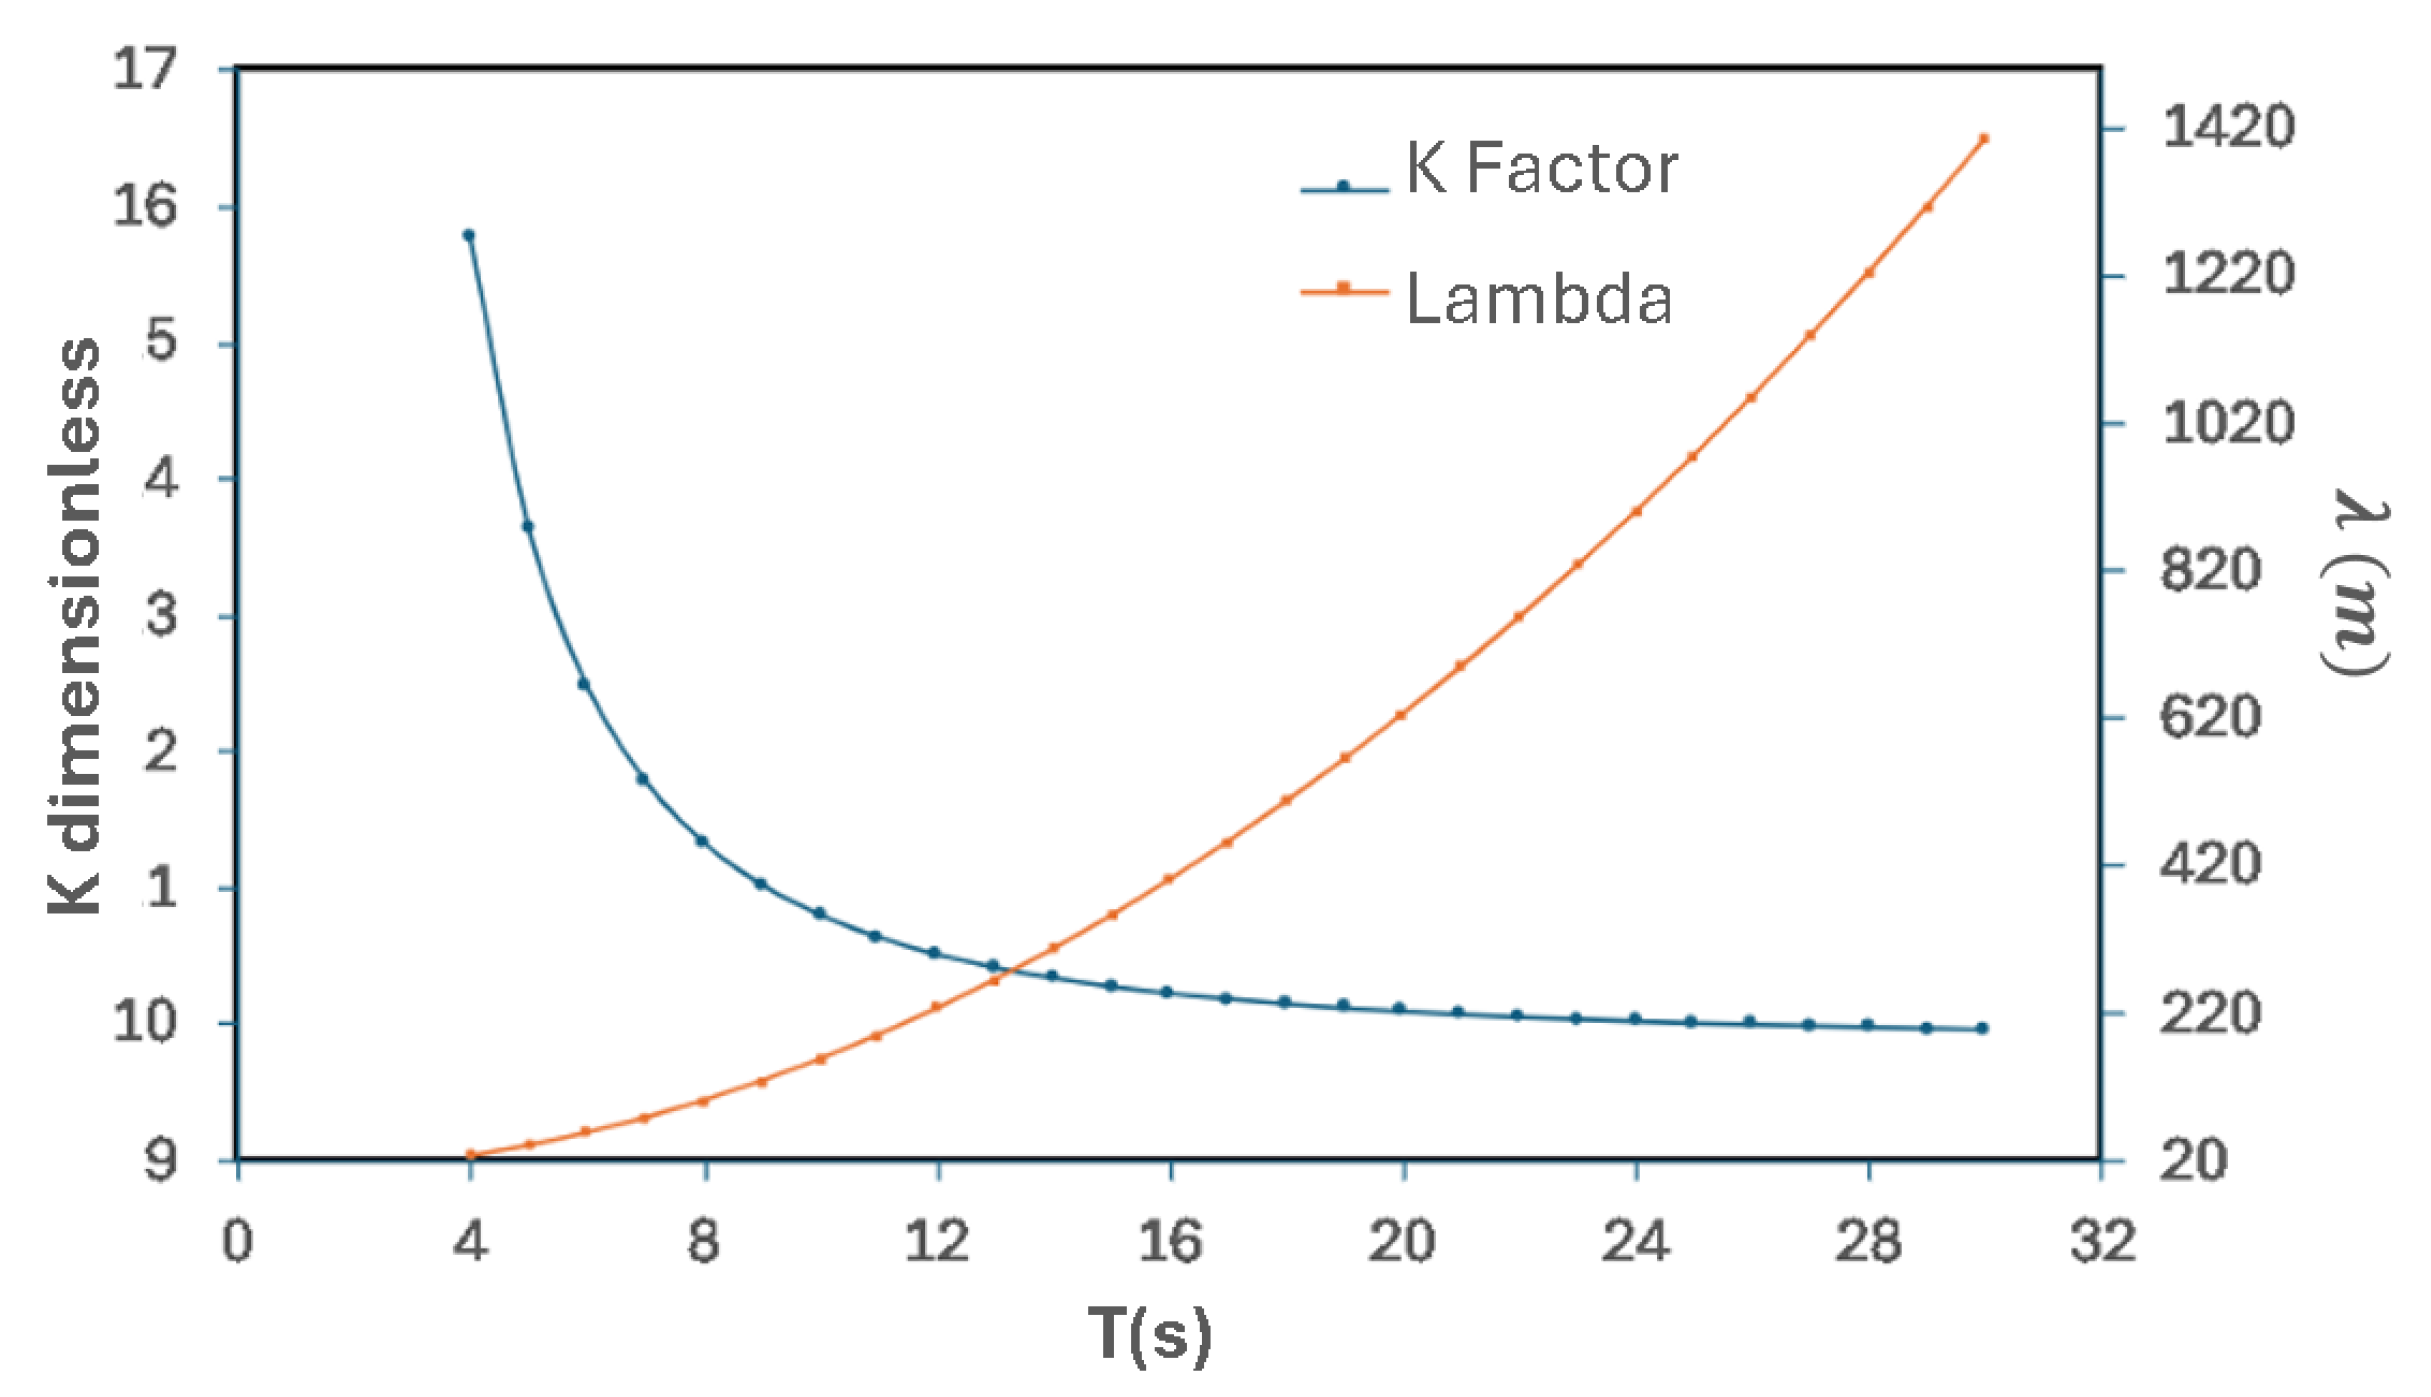
The level of the water/air interface was measured to determine the maximum and minimum heights of the water column of the chamber during the section stage, which are critical for defining the position of the water/air interface in the CFD simulations. The basic relation between wave height and amplitude is directly proportional. K is a dimensionless factor that incorporates geometric parameters and depends on the characteristics of the waves and other sea conditions. The data and relationships were recognized in Figure 4, Figure 5 and Figure 6, considering two variables: wave period and wavelength. Wavelength was employed as the iteration variable, enabling the dynamic behavior of the water column to be characterized. This approach ensures that each model remains reproducible under realistic operational conditions.
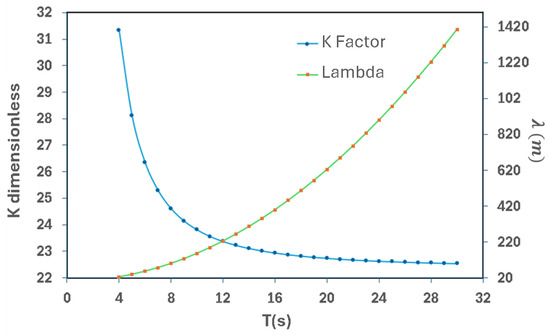
Figure 4.
K-factor and wavelength curve as a function of wave period for an inclined cylindrical chamber.
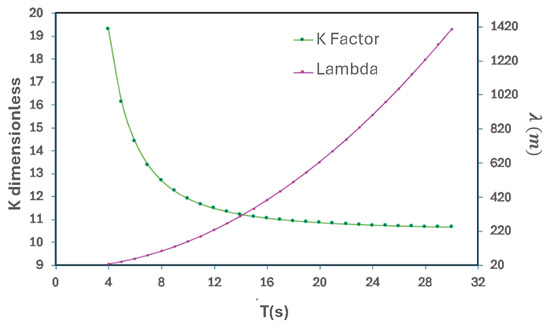
Figure 5.
K-factor and wavelength curve as a function of wave period for a cylindrical chamber.
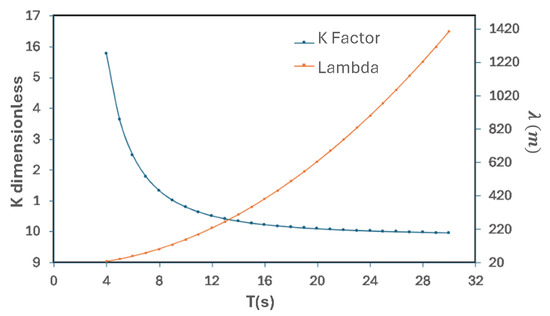
Figure 6.
K-factor and wavelength curve as a function of wave period for a rectangular chamber.
4.2. Calculation of the Wells Turbine
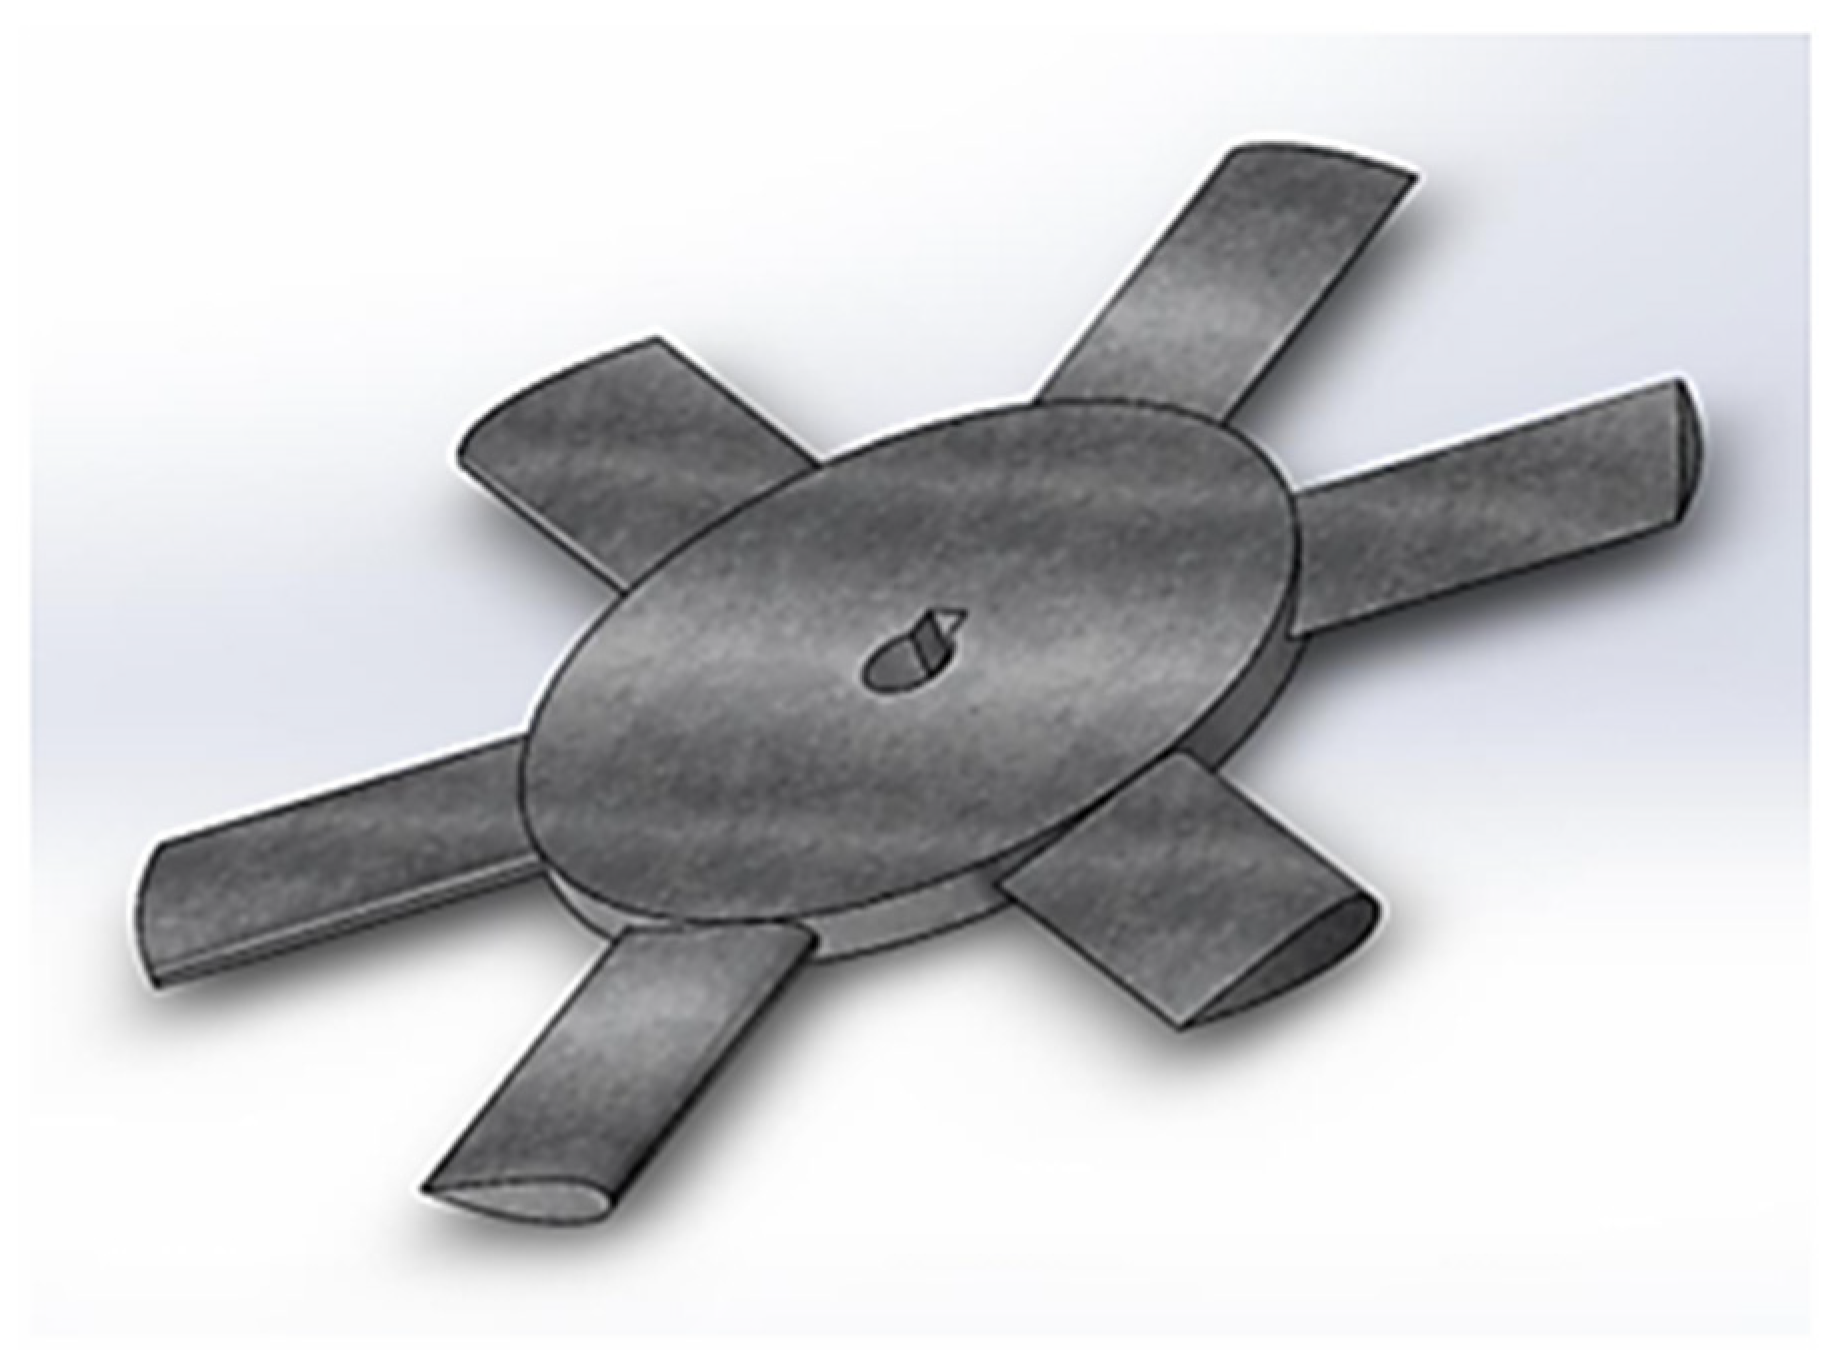
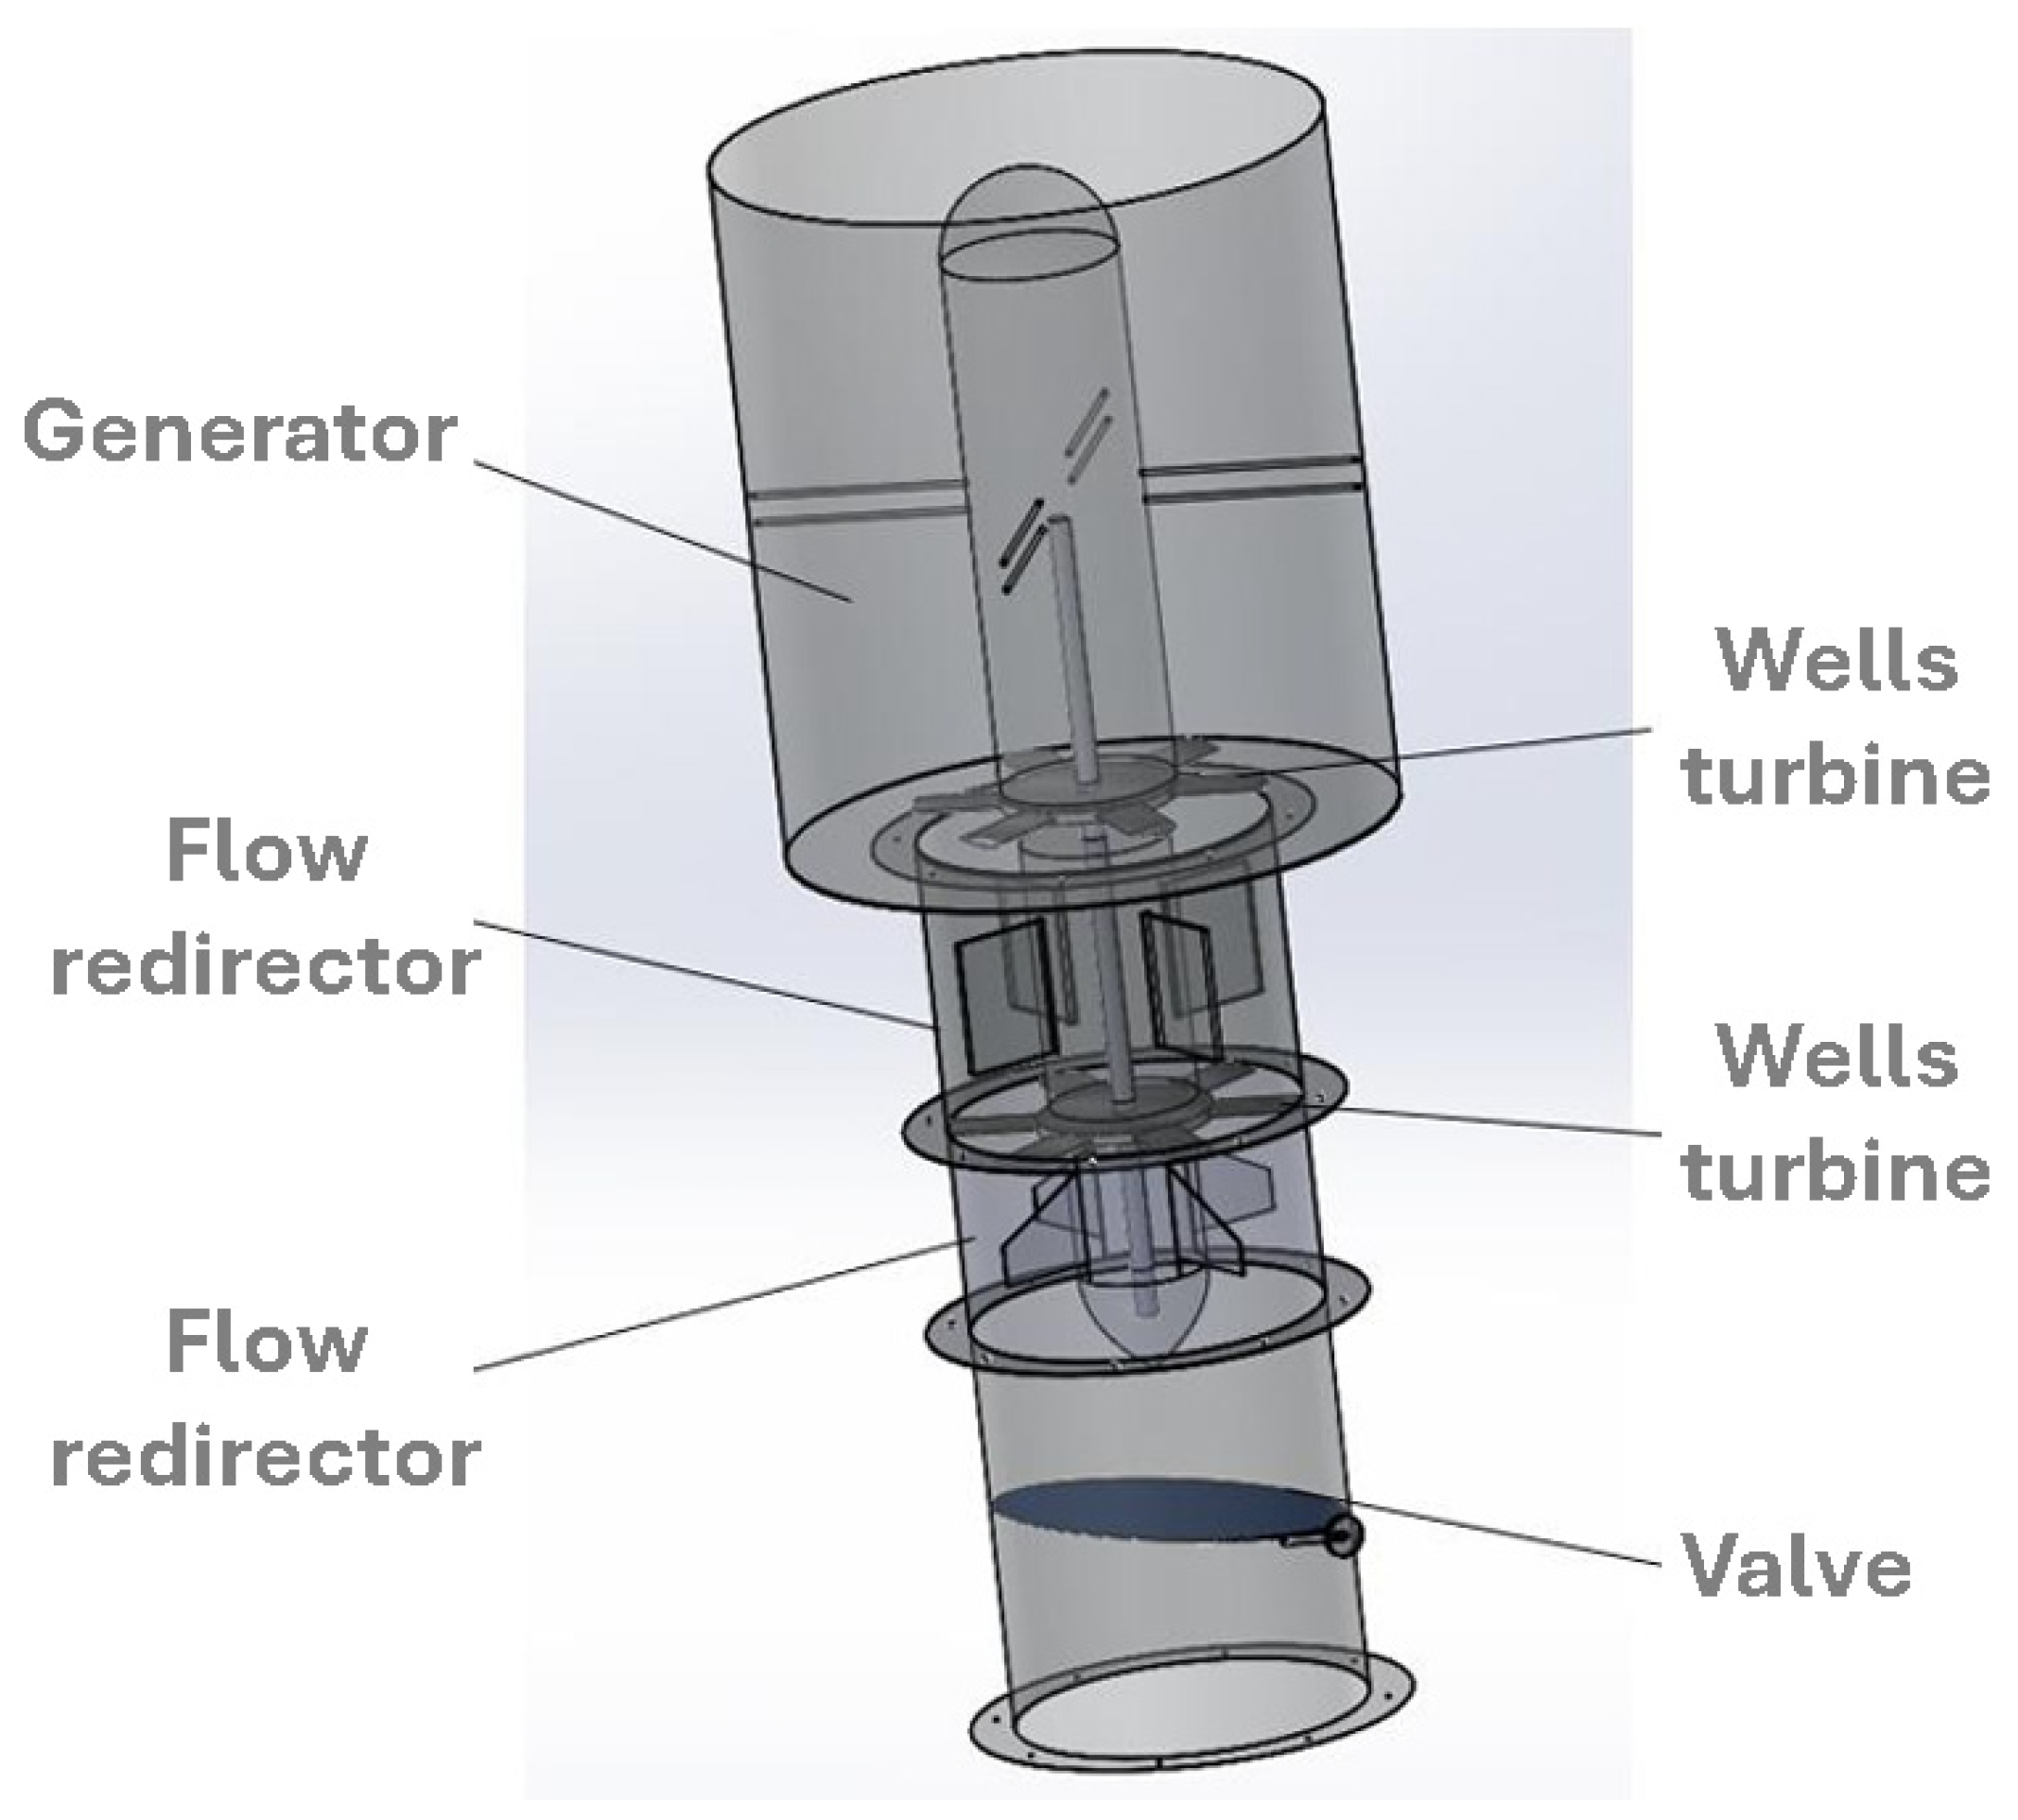
The Wells turbine design is based on the NACA 0015 airfoil profile. The final concept is presented in Figure 7, with the detailed assembly design shown in Figure 8. A six-blade configuration was adopted, with the transverse turbine adapted to fit within the containment chamber. Figure 8 illustrates two concepts of Wells turbines connected via a common shaft, each equipped with a flow redirector at the ends to optimize airflow. At the downstream end of the turbine assembly, an electric generator is installed to convert mechanical energy into electrical energy. A check valve is incorporated to regulate airflow, allowing it to be blocked when maintenance operations are required. The moving components are supported by thin structural elements that ensure precise alignment and centering of the entire assembly.
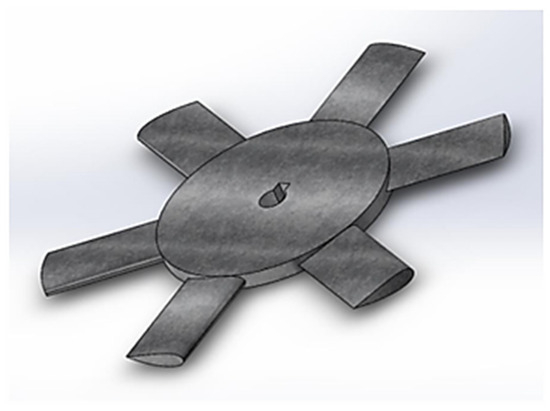
Figure 7.
Design of a Wells turbine with six blades, based on the NACA 0015 airfoil classification.
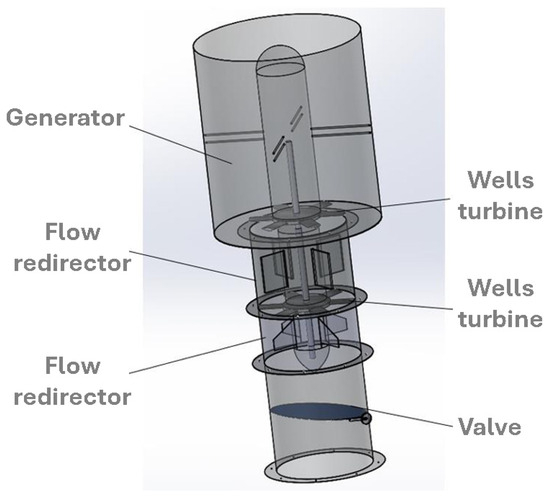
Figure 8.
Three-dimensional design of the assembly integrating the Wells turbine and generator.
4.3. Simulation Results
For each chamber, two analyses were conducted: one considering the maximum and the other the minimum. In each analysis, two stages were performed: the first stage focused on the behavior of the water, and the second stage on the behavior of the air. The selected water heights correspond to the extreme wave periods, with a maximum period of 18 s and a minimum period of 4 s. The analysis focuses exclusively on pressure and flow velocity. The profiles of each variable are represented through a vector field diagram.
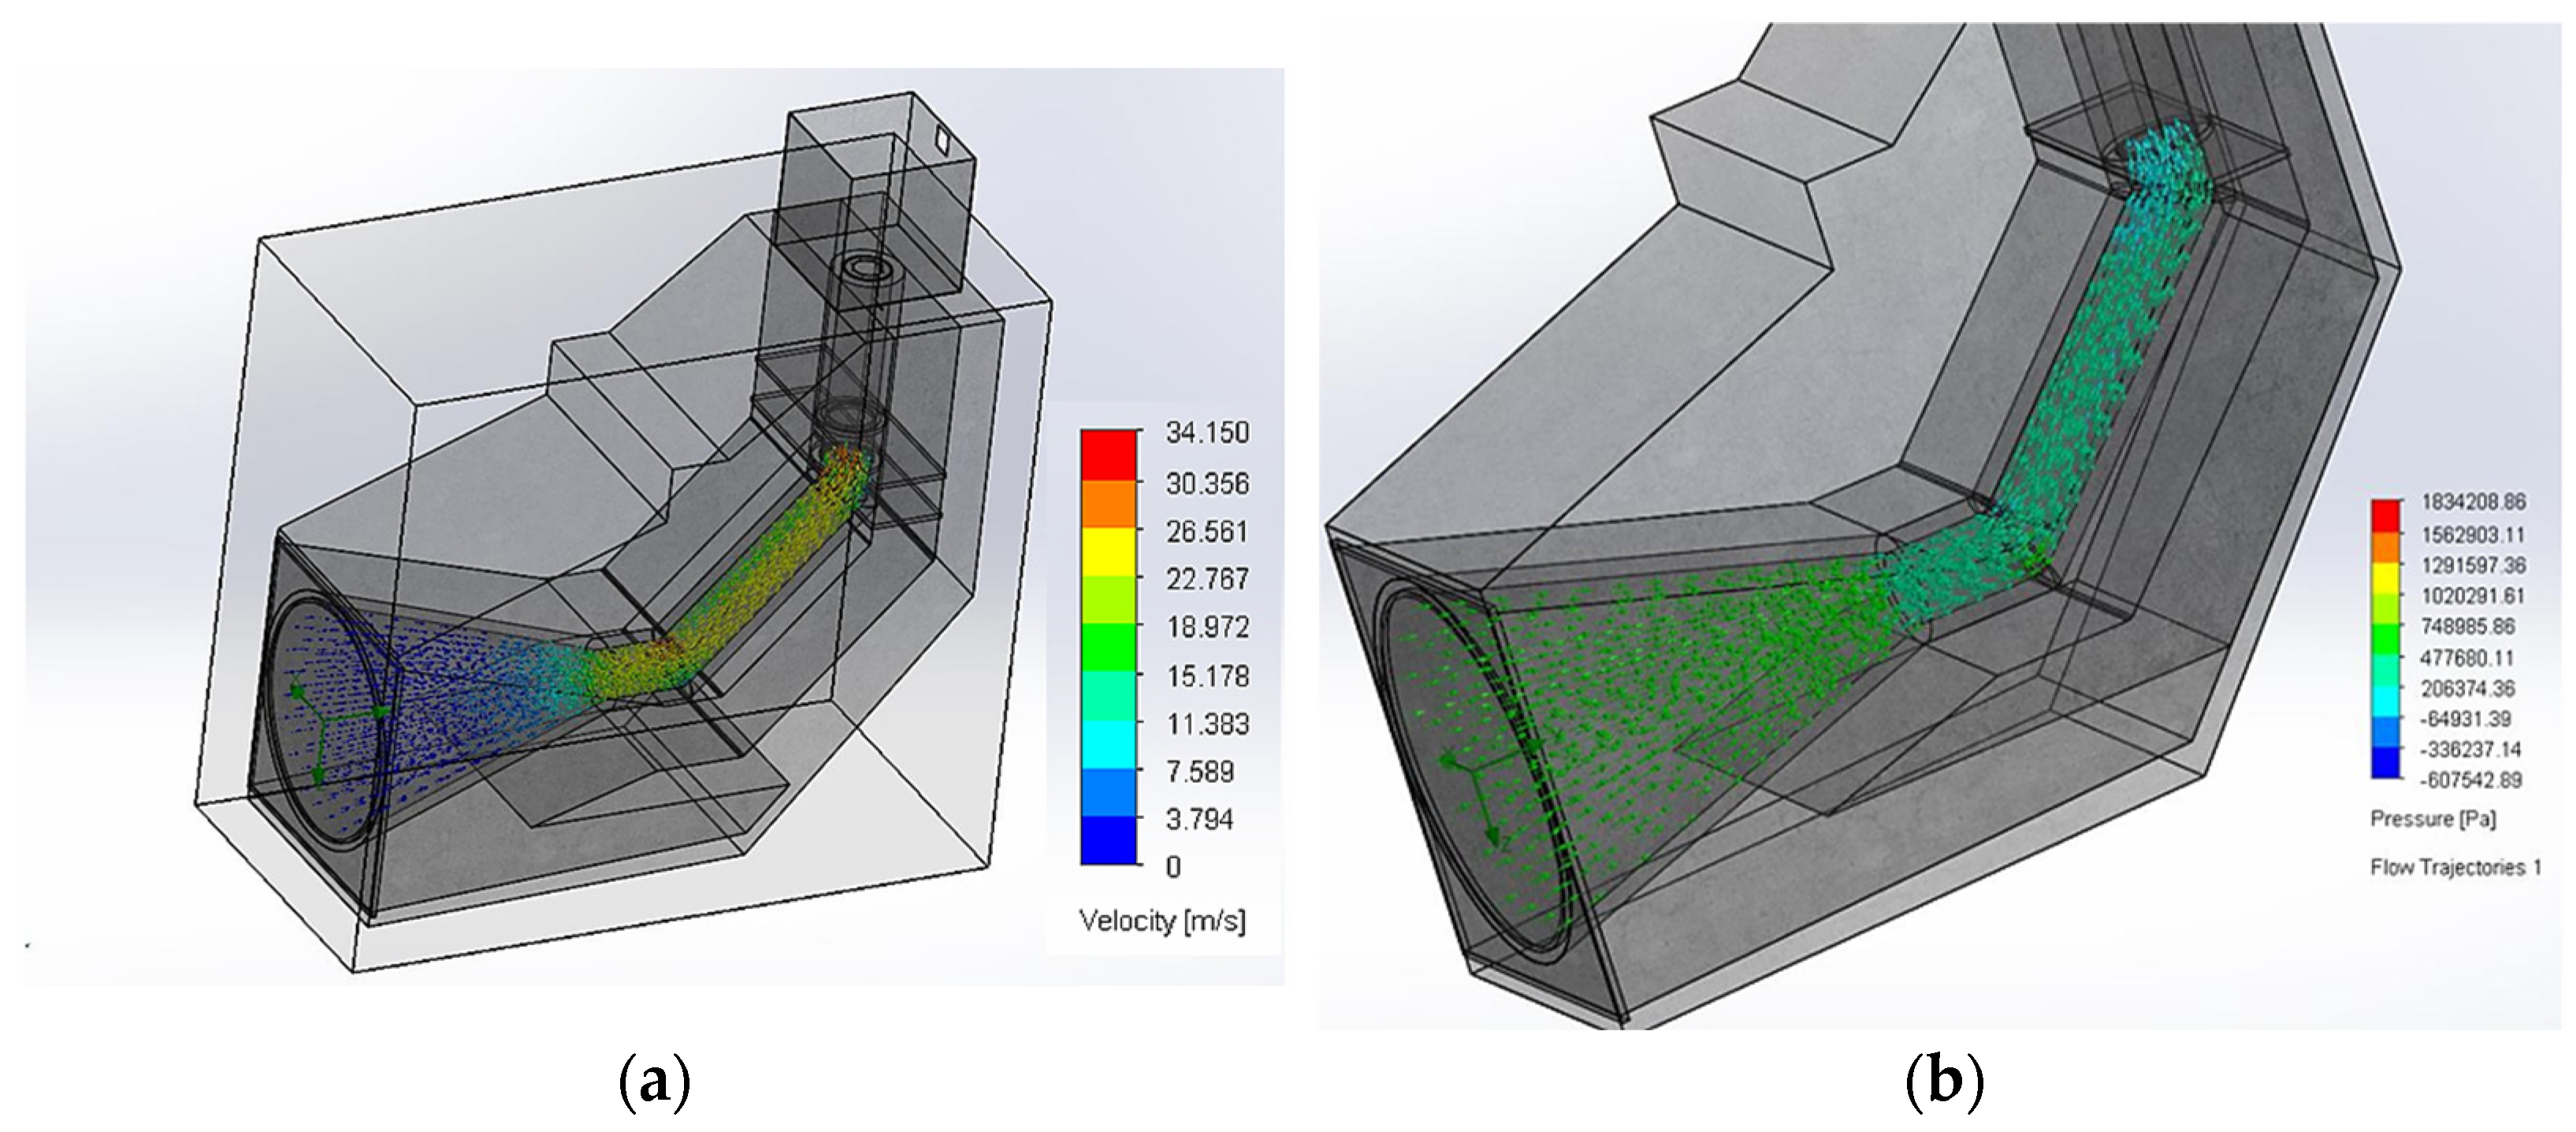
The first configuration corresponds to the inclined cylindrical chamber. In this case, it is observed that an inlet velocity of 1 m/s increases to 2 m/s upon reaching the water/air interface. An average flow velocity of 1.12 m/s is recorded within the liquid phase. The changes in velocity and acceleration are concentrated primarily in the throttling region located at the final section of the chamber. Regarding the pressure distribution, a relatively higher pressure is identified near the interface, which progressively decreases toward the outlet section. Figure 9a presents the flow’s velocity field, while Figure 9b illustrates the pressure vector field.
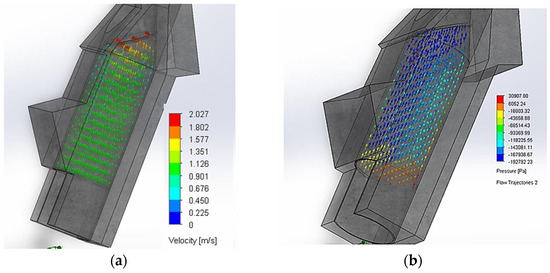
Figure 9.
(a) Computational analysis of the water velocity behavior inside the chamber when the water column height reaches 20 m. (b) Computational analysis of water pressure distribution inside the chamber for inclined cylindrical configuration.
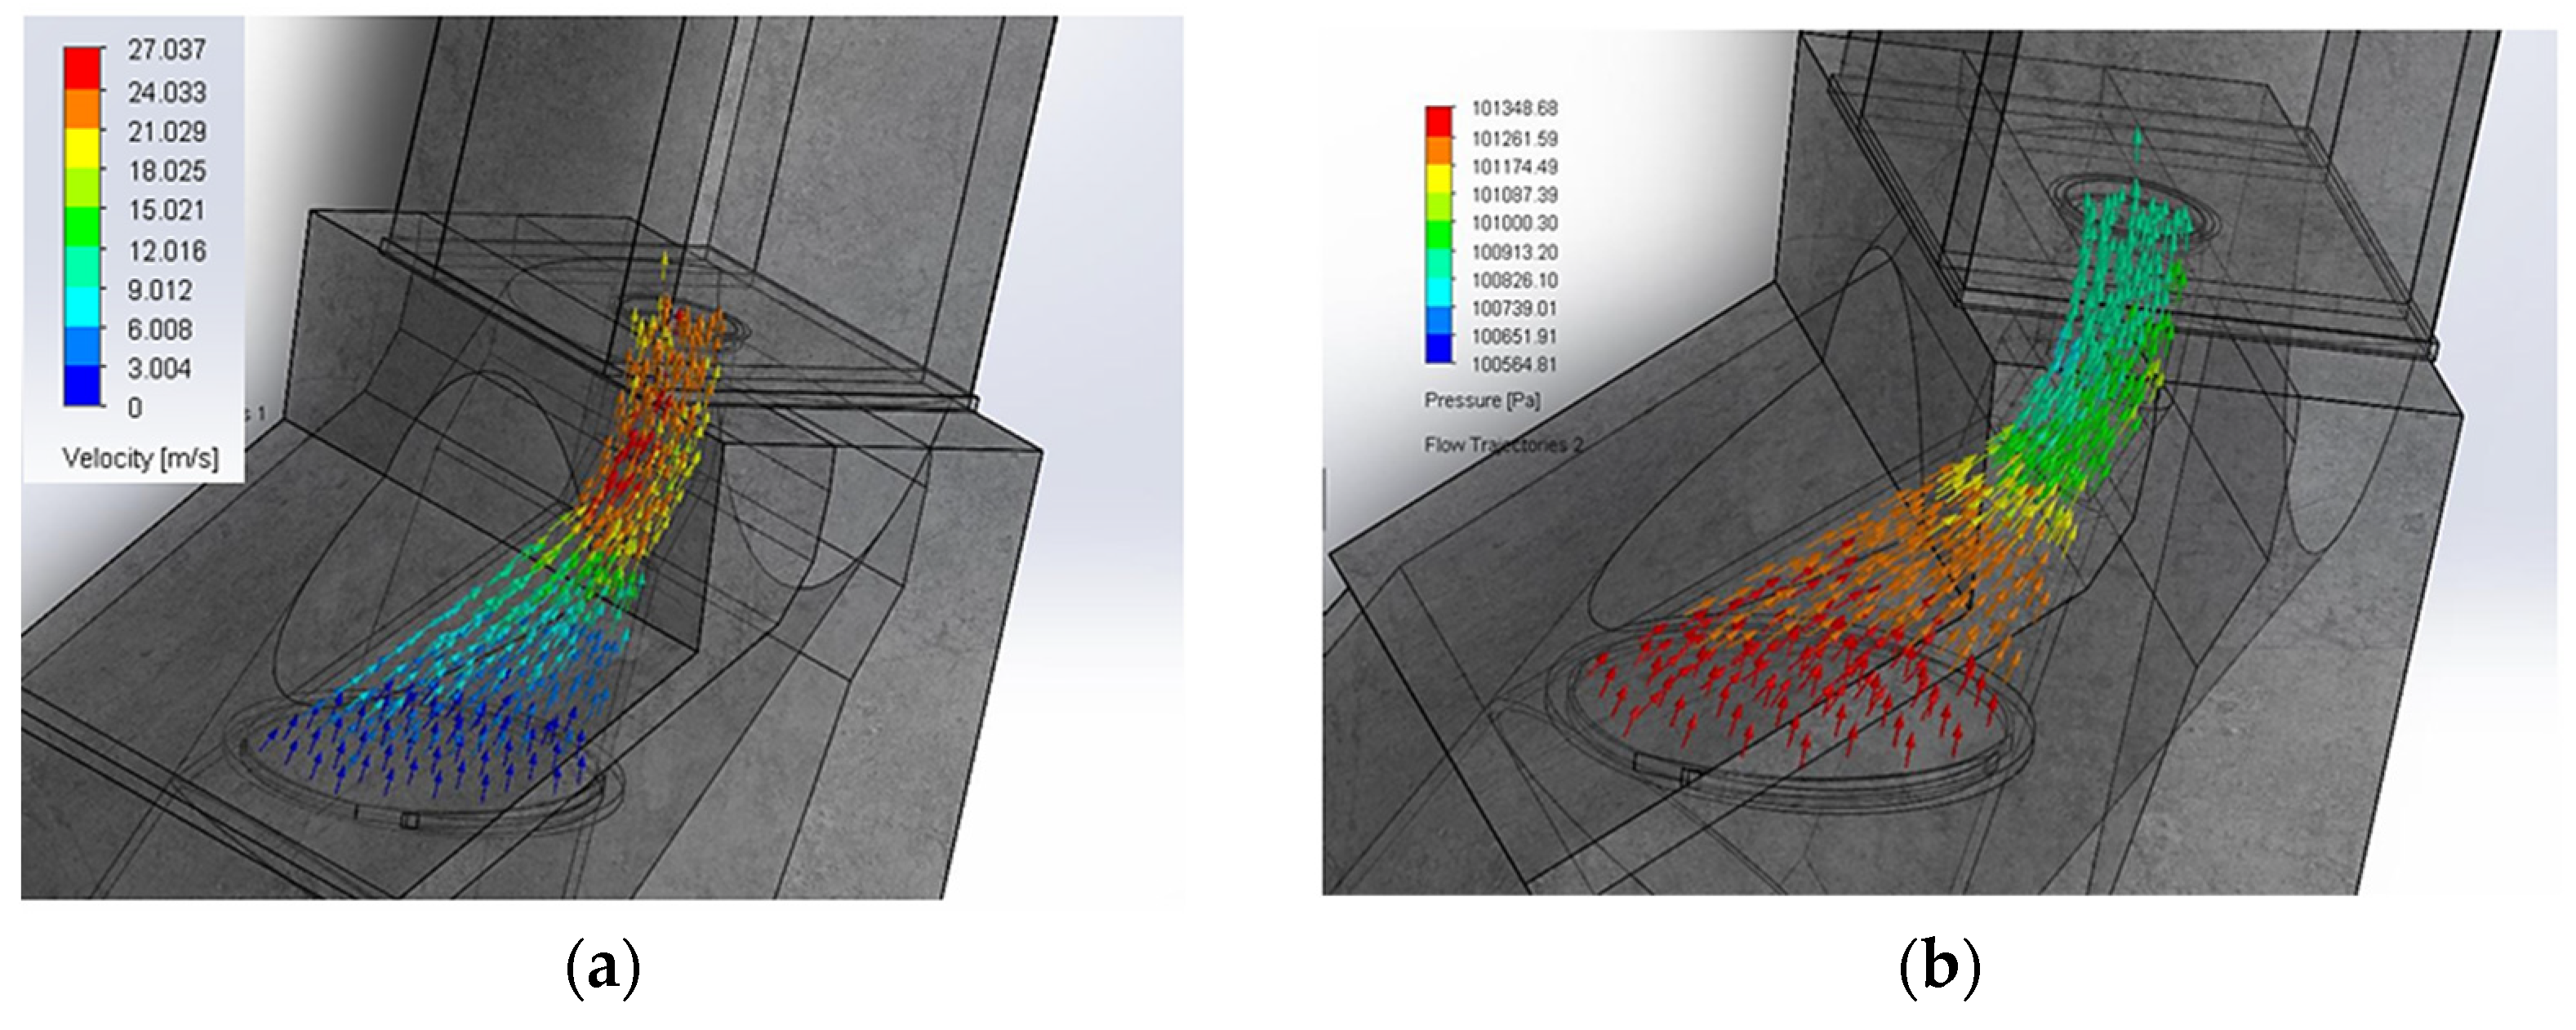
In the second scenario, the analysis focuses on the air flow. Figure 10a shows the flow acceleration at the Wells turbine housing chamber entrance, with average velocities reaching 24 m/s. The throttling and change in cross-sectional area produce an additional increase in air velocity, averaging around 20 m/s. Regarding pressure, Figure 10b illustrates a significant reduction associated with the change in cross-section. Moreover, periodic stresses are generated at the transition zone due to the abrupt variation in geometry.
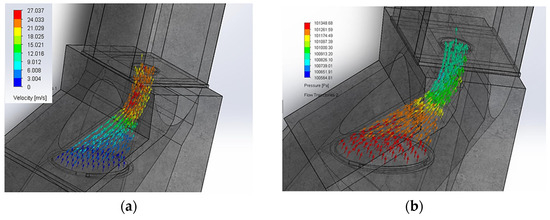
Figure 10.
(a) Computational analysis of the air velocity behavior inside the chamber for an inclined cylindrical configuration. (b) Computational analysis of air pressure concentration inside the chamber for inclined cylindrical configuration.
The second configuration analyzed corresponds to the cylindrical chamber. Figure 11a presents the behavior of the water flow velocity at the water/air interface. It is observed that the flow development from the end of the conical section toward the interface enhances the conversion of kinetic energy within the transported flow. With an inflow velocity of 1 m/s, an average flow velocity of approximately 22 m/s is achieved. Figure 11b shows the corresponding pressure distribution, where stress concentrations are identified at points of directional change due to a slight increase in pressure.

Figure 11.
(a) Computational analysis of the water velocity behavior inside the chamber when the water column height reaches 10 m for the cylindrical configuration. (b) Computational analysis of water pressure distribution inside the chamber for cylindrical configuration.
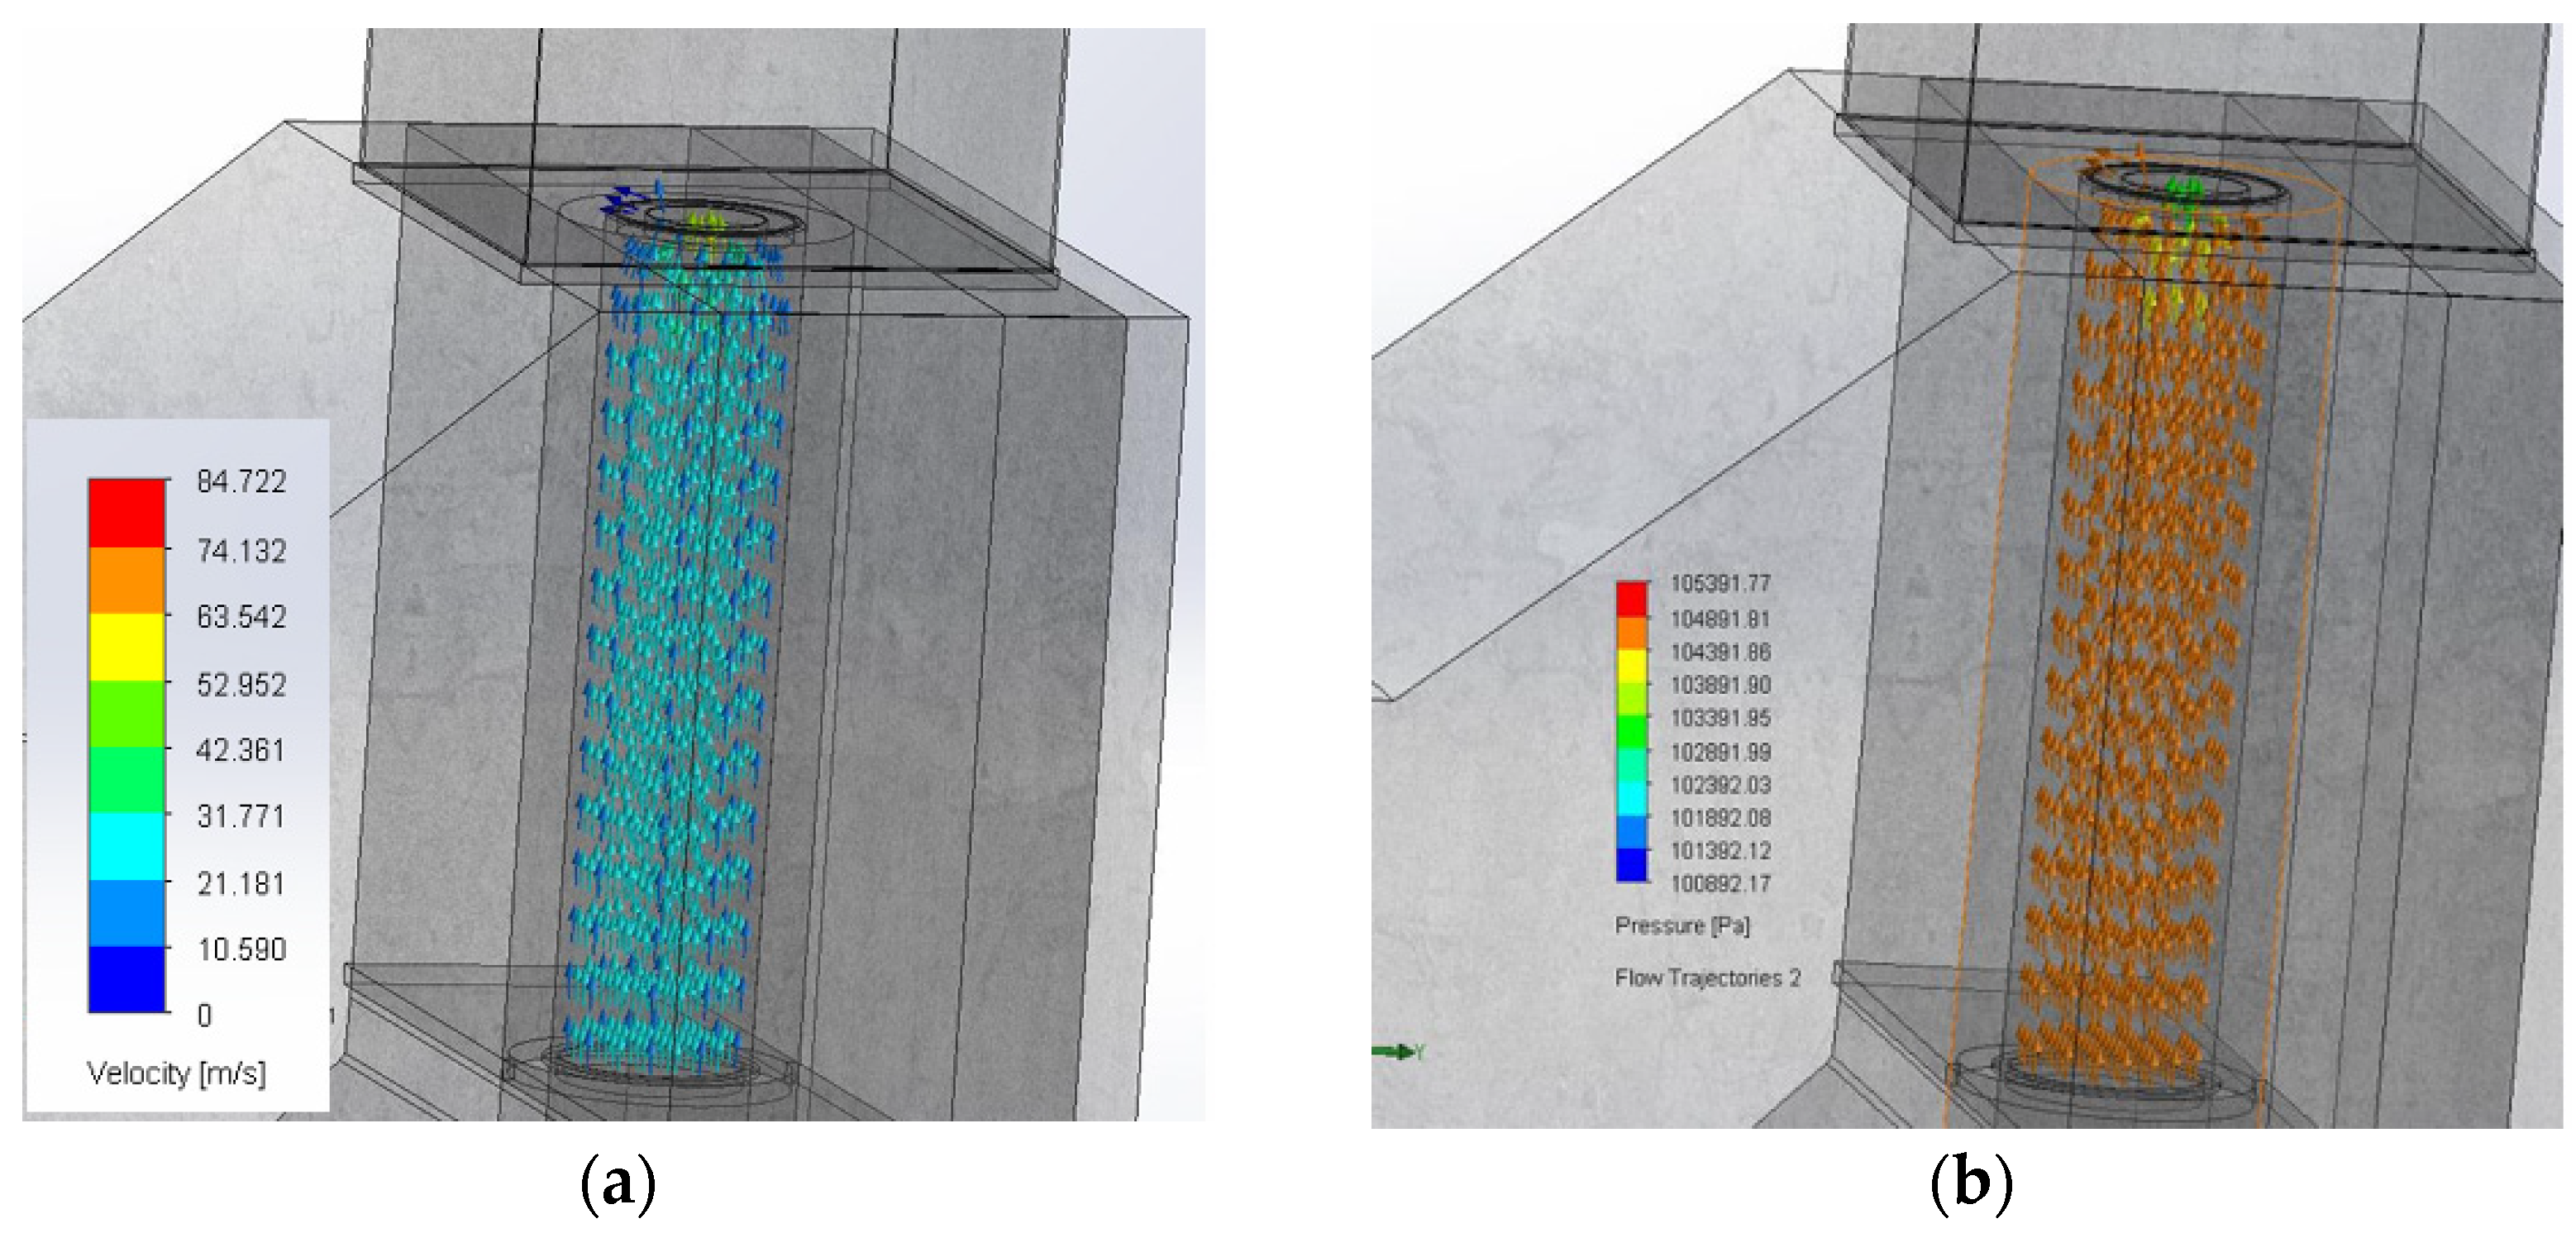
In analyzing the air or pneumatic phase behavior, the flow velocity in Figure 12a remains nearly constant before entering the Wells turbine, indicating minimal energy losses throughout the transport process. Similarly, in terms of pressure in Figure 12b, the magnitude remains largely conserved, with only a slight reduction detected immediately before the turbine, attributable to the change in the cross-sectional area.
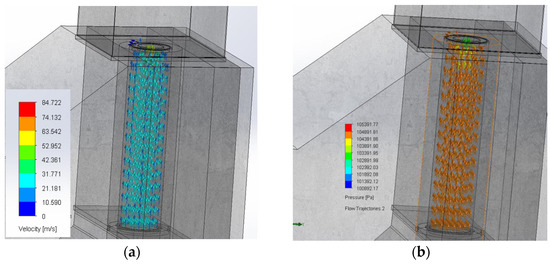
Figure 12.
(a) Computational analysis of the air velocity behavior inside the chamber when the height of the air column reaches 10 m for the cylindrical configuration. (b) Computational analysis of air pressure distribution inside the chamber for cylindrical configuration.
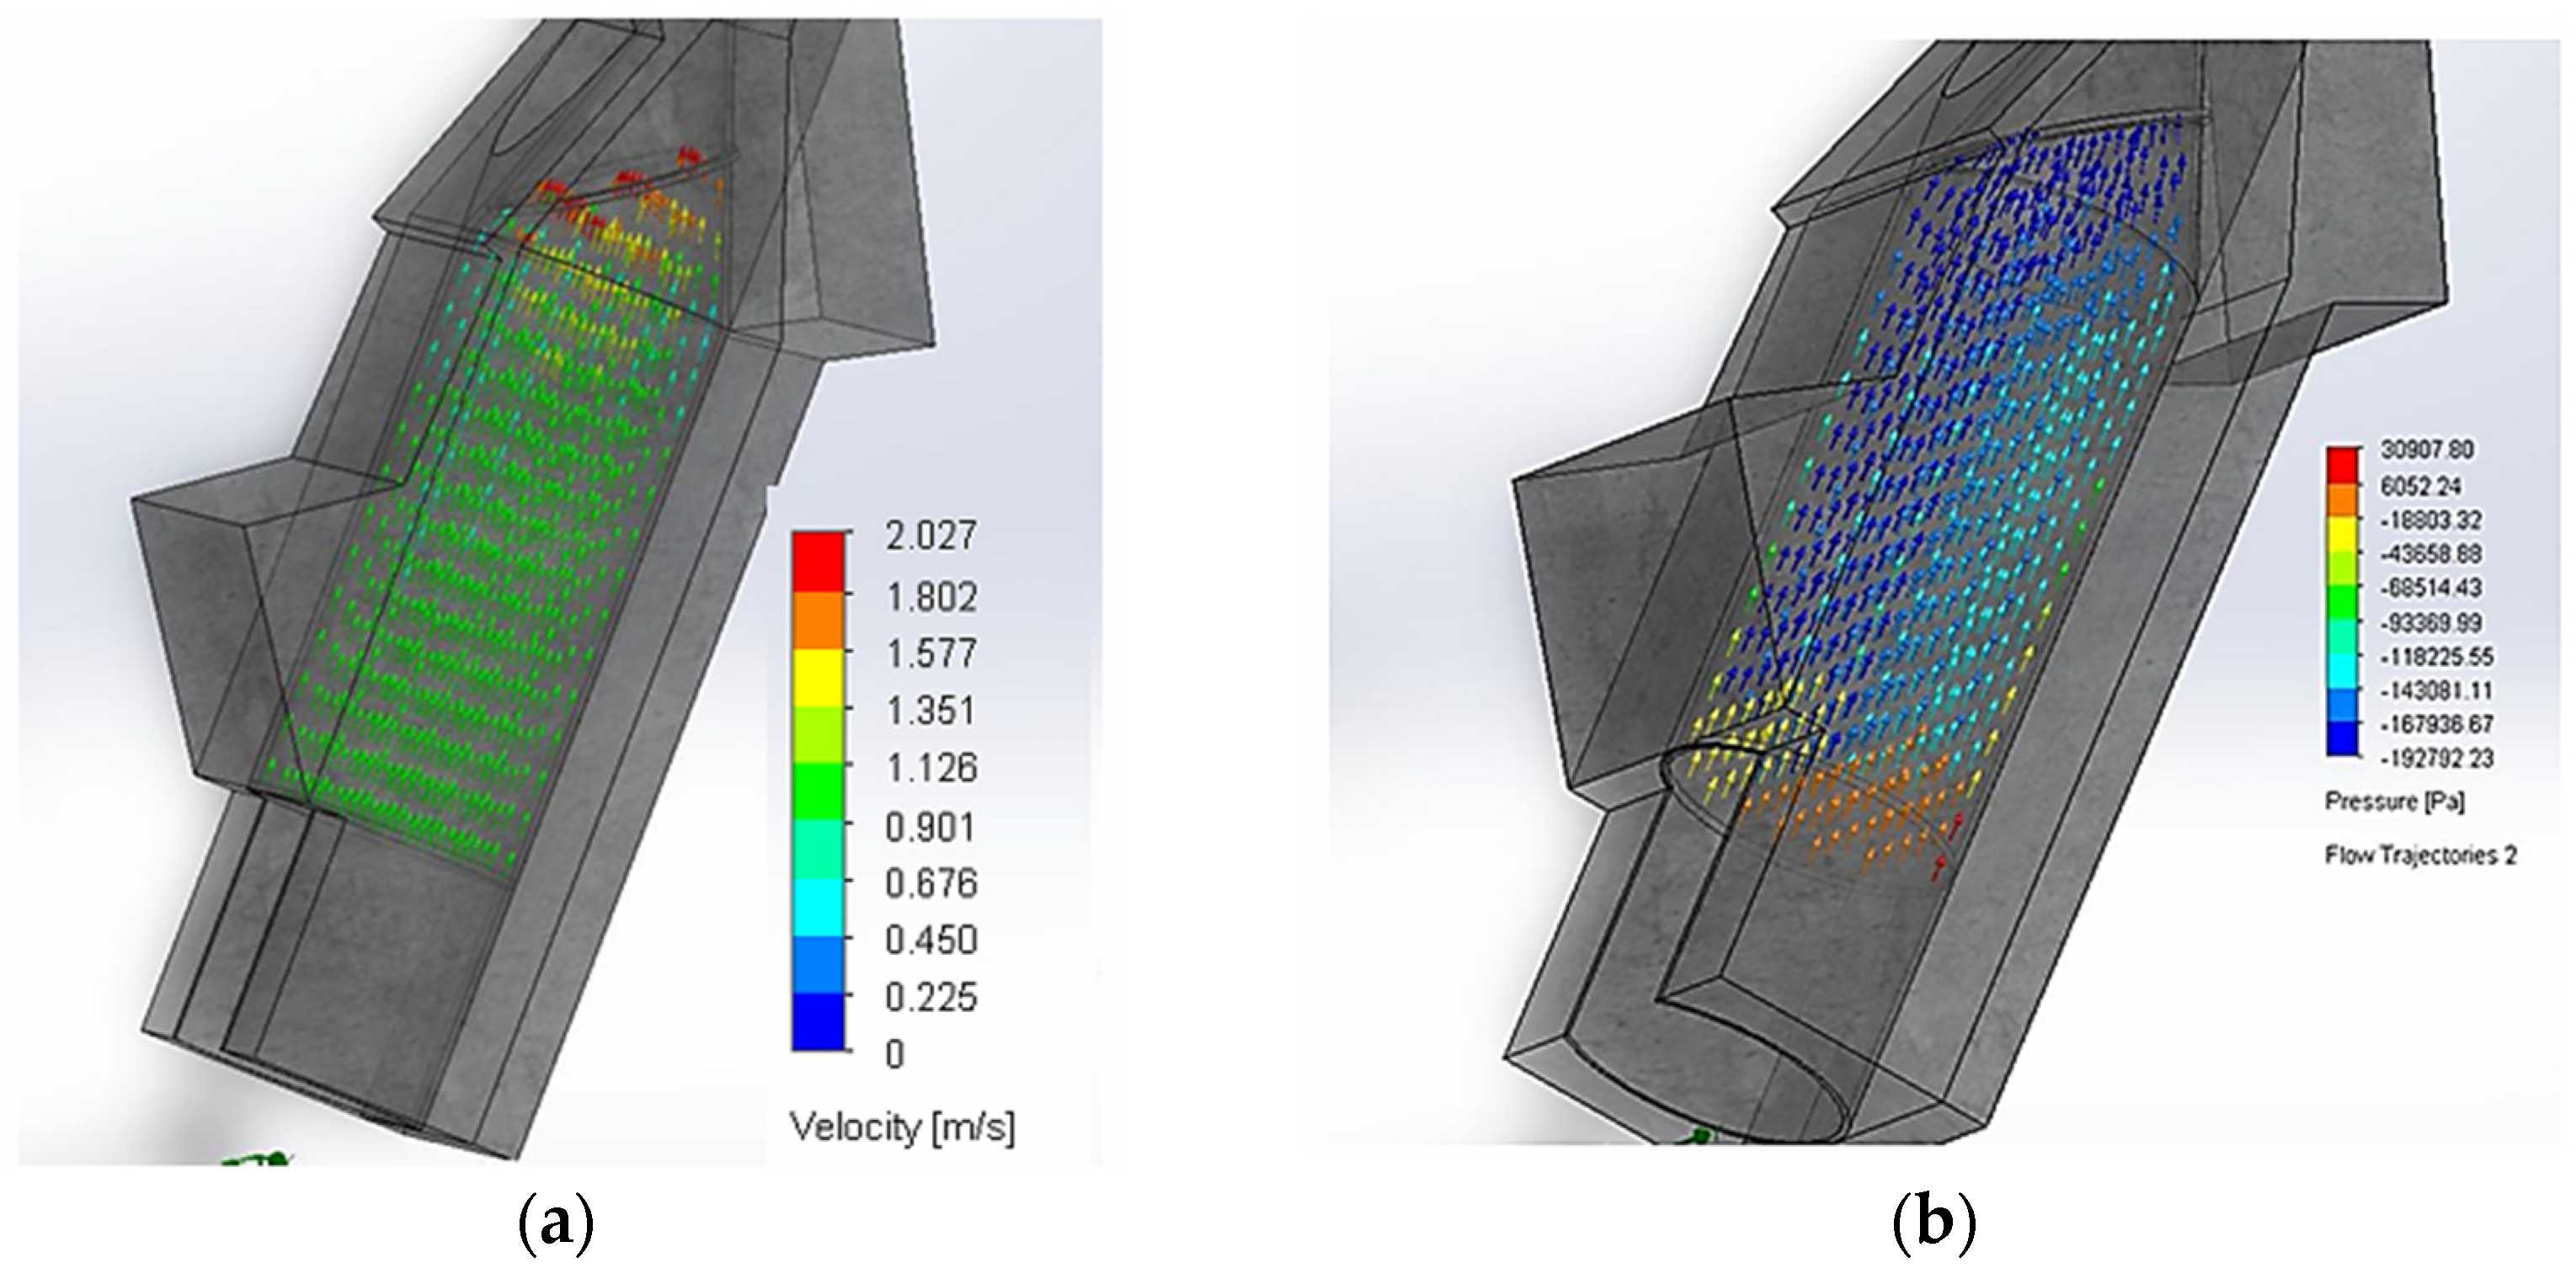
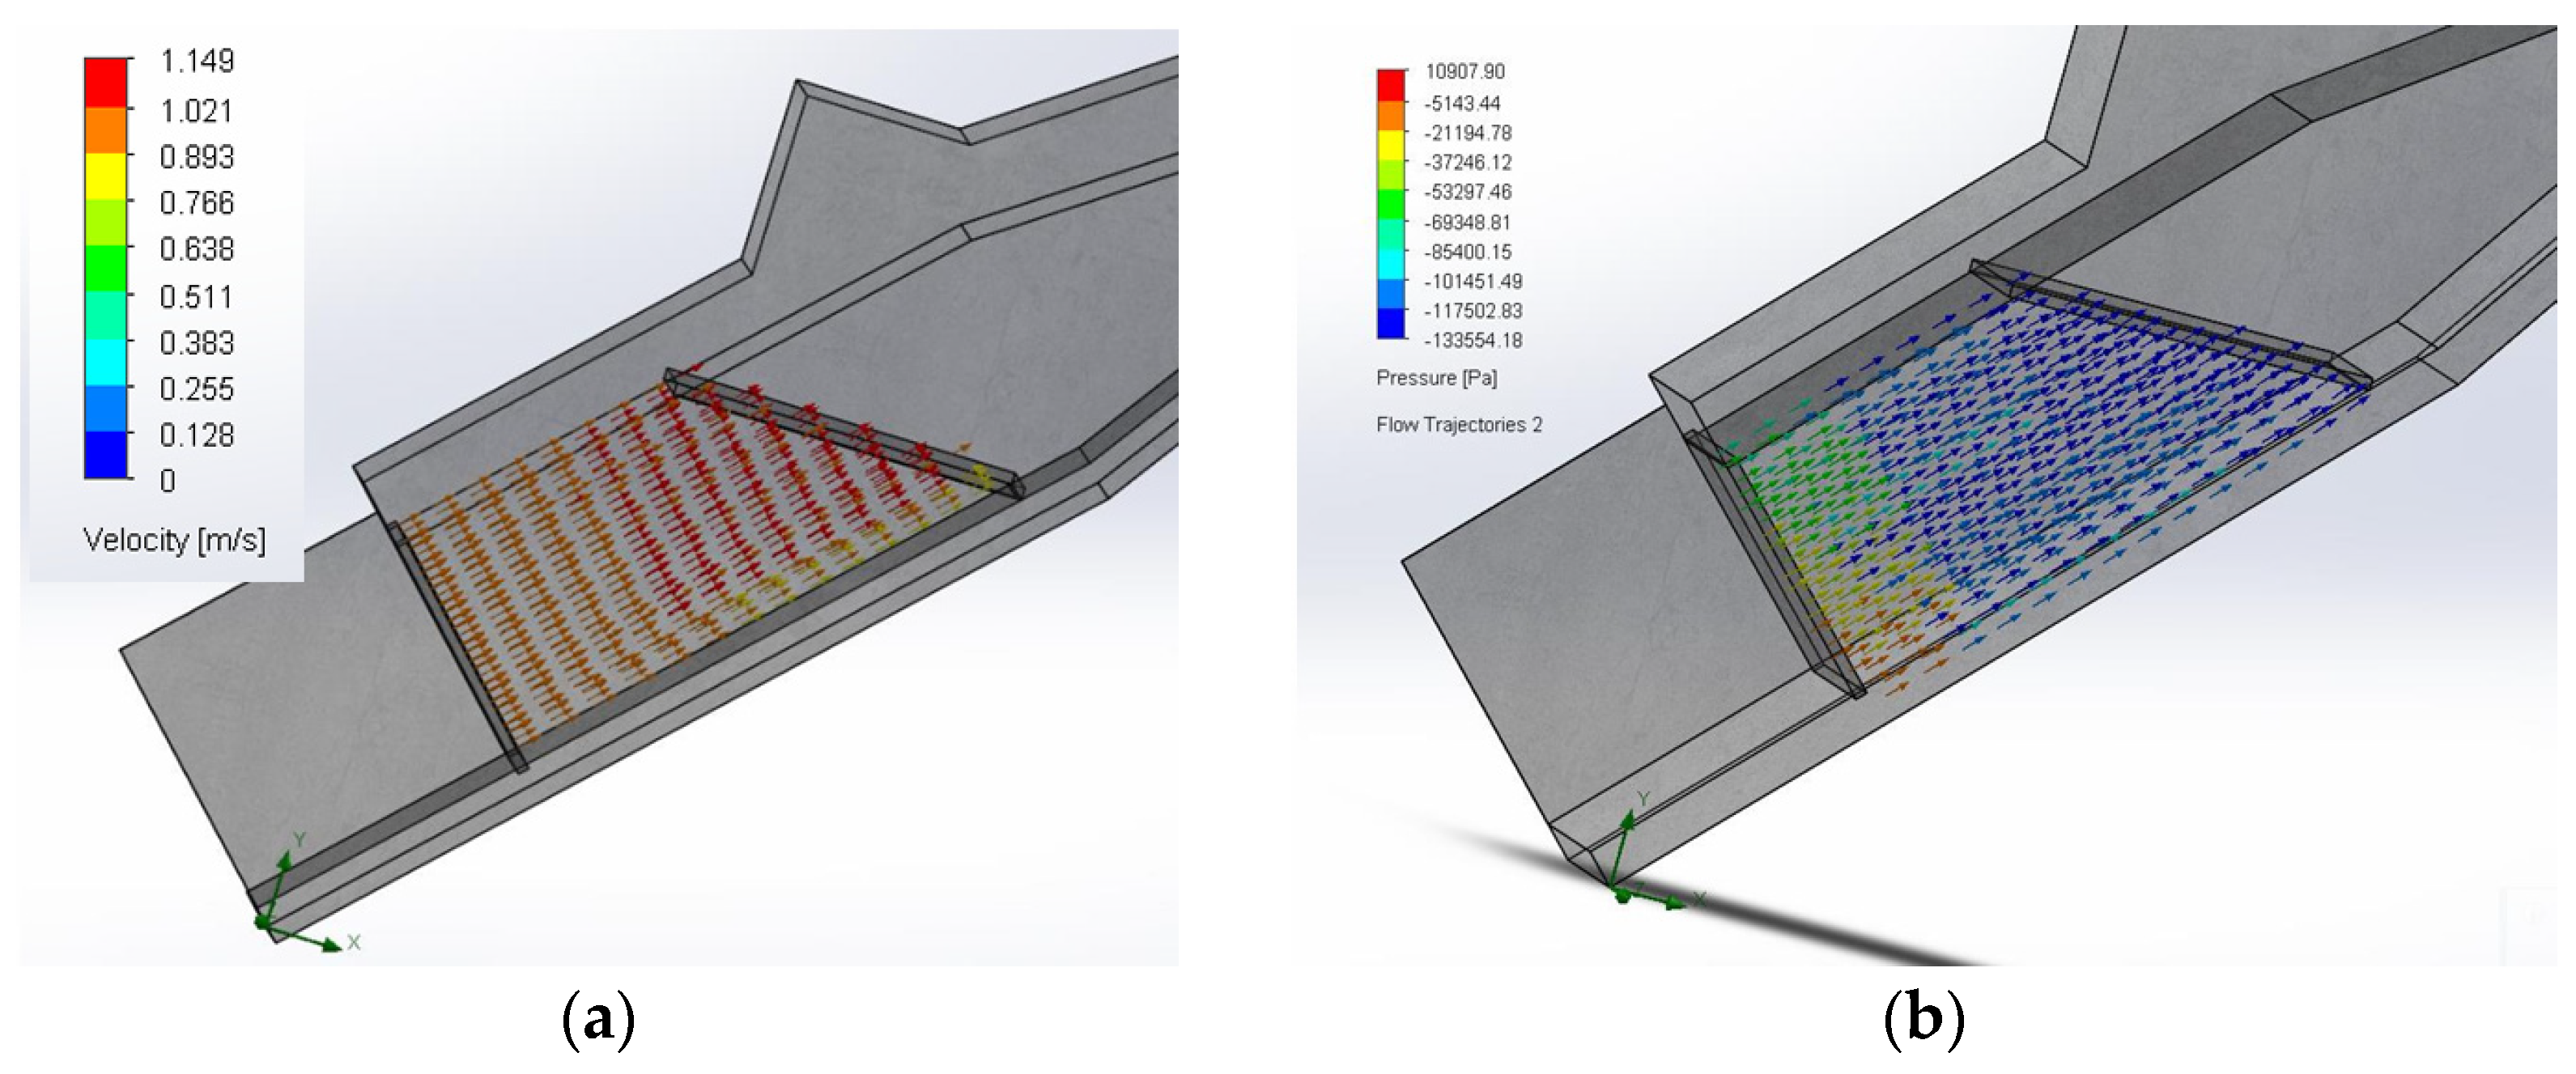
The third configuration corresponds to the rectangular chamber. In this case, Figure 13a presents the water flow analysis, where an increase in velocity of approximately 0.5 m/s is observed at the cross-section changes. Due to the horizontal nature of the interfacial medium in the rectangular chamber, modeling was performed using an inclined control boundary. Regarding the pressure parameter, Figure 13b shows that the pressure is initially non-uniform at the inlet but stabilizes as the flow develops along the chamber.
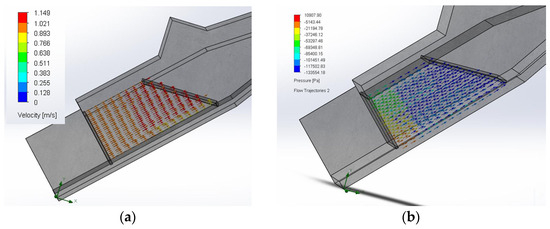
Figure 13.
(a) Computational analysis of the water velocity behavior inside the chamber when the height of the air column reaches 10 m for the rectangular configuration. (b) Computational analysis of water pressure distribution inside the chamber for rectangular configuration.
In the pneumatic section, Figure 14a shows that the air velocity vector field remains constant up to the turbine inlet, reaching an average velocity of approximately 17 m/s. The pressure vector field, presented in Figure 14b, indicates a stable distribution in the flow development zone, transitioning from a higher-pressure gradient to a lower one as the flow approaches the turbine inlet. Additionally, in Figure 14b, it is evident that there is a corresponding decrease in pressure in the region where the fluid accelerates, which is attributed to the formation of vortices that contribute to localized pressure drops.
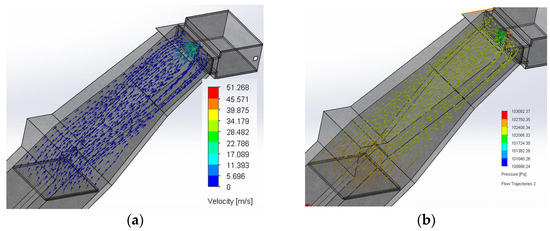
Figure 14.
(a) Computational analysis of the air velocity behavior inside the chamber when the height of the air column reaches 10 m for the rectangular configuration. (b) Computational analysis of air pressure distribution inside the chamber for rectangular configuration.
Table 5 presents the analysis’s separation into two sections: water and air. The results shown correspond to the consolidated cases obtained after the CFD simulations.
Table 5.
Summary of the velocity effects for each camera and the oscillating column’s maximum and minimum.
5. Discussion
The first point of discussion is the cylindrical chamber. Figure 9a shows that at the circular inlet of the chamber, the incoming waves have a velocity of 1 m/s. As the flow passes through the nozzle, the water velocity increases to 9 m/s, stabilizing at approximately 24 m/s. Notably, a velocity reduction of 3 m/s occurs at the corners of the lower wall due to curvature changes in the cross-sectional geometry that can be seen in Figure 10a. The increase in the height of the water column leads to a higher impulse velocity imparted to the air column, resulting in greater power delivered to the turbine. The water in Figure 9b, which progressively decreases along the flow path, generates and average pressure differential of 120,000 Pa, indicating that a corresponding reduction in pressure potential energy must balance the increase in kinetic energy.
The second point of this study is the inclined cylindrical chamber. In Figure 11a, it is observed that the flow velocity remains constant until it reaches the nozzle inlet. From this point, the velocity increases, reaching values of 2 m/s and 5.8 m/s for the minimum and maximum heights of the Oscillating Water Column, respectively. Figure 11b shows that the pressure can reach negative values, a phenomenon attributed to the chamber design, which accelerates the fluid to the extent that the static pressure becomes lower than the dynamic pressure. A negative pressure value indicates a pressure below standard atmospheric pressure (101 kPa), commonly called vacuum pressure, characteristic of the suction and extraction phenomena in Oscillating Water Column systems. Furthermore, the increase in fluid velocity within the air chamber as the cross-sectional area decreases can be explained by the flow continuity equation, where the area and velocity are inversely proportional: as the cross-sectional area decreases, the flow velocity increases. In contrast, the volumetric flow rate remains constant across each duct section.
The third point is the analysis of the rectangular chamber. In Figure 12a, it is observed that, due to the absence of significant changes in the cross-sectional area, the rate of increase in velocity is low. Furthermore, unlike the cylindrical chamber configuration, the water column in the rectangular chamber does not reach a considerable height, resulting in minimal velocity variation, negatively impacting the chamber’s overall efficiency. In Figure 12b, the predominance of blue vectors, with velocities below 5.7 m/s, indicates that the air velocity remains largely constant throughout the flow path. At the turbine inlet section, the fluid experiences a notable increase in velocity, with vectors reaching magnitudes of 14 m/s and 25 m/s. This behavior can be explained by the principle of mass conservation, as described by the continuity equation.
The next point refers the data presented in Table 5. The analysis reveals differences in hydrodynamic and aerodynamic performance across the evaluated configurations. Under minimum water height conditions, the cylindrical chamber exhibits the highest water velocities, reaching a peak of 32.39 m/s, in contrast to the inclined and rectangular chambers, which peak at only 2.03 m/s and 1.15 m/s, respectively. However, vector field analysis indicates that the inclined chamber maintains a more stable flow, suggesting a higher concentration of energy conversion and improved transfer efficiency. As the water height increases, the vertical chamber continues to dominate in terms of velocity, with minimum speeds increasing from 1.60 to 11.80 m/s, underscoring its high sensitivity to wave energy input. In comparison, the inclined chamber shows a moderate response, while the rectangular chamber demonstrates minimal velocity gains, indicating suboptimal fluid dynamics for effective energy capture.
Continuing with Table 5, the analysis of air velocity emphasizes the influence of chamber geometry on system performance. The inclined cylindrical chamber shows a minimum air velocity of 16.71 m/s, even at low water levels, indicating efficient airflow initiation and a stable operational behavior. In contrast, the cylindrical chamber reaches the highest air velocities, peaking at 89.76 m/s. The rectangular chamber, despite exhibiting lower water velocities, supports air velocities up to 51 m/s. These values could still present structural challenges due to abrupt flow changes and less uniform distribution. The results shows that the inclined cylindrical configuration offers the most stable performance, combining airflow efficiency and operational safety.
The work developed has certain limitations due to the idealizations implemented. The model assumes direct wave fronts and an idealized behavior of the water and air columns inside the chambers, resulting in results that represent a high-fidelity but ideal approximation. Furthermore, the evaluation is conducted under a constant wave period conditions; incorporating a dynamic analysis with variable wave periods could improve efficiency during specific intervals and account for near-zero velocities when wave activity is minimal. Additionally, the mesh resolution used in the simulations is adequate for capturing vector and pressure fields but does not reach the finest level of detail possible with more refined meshing techniques.
6. Conclusions
Three chamber configurations were analyzed, considering inclination angles and aperture dimensions. The results revealed a significant increase in air velocities directed toward the turbine while maintaining values within the optimal range for efficient Wells turbine operation. The inclined cylindrical chamber showed favorable geometry, maximizing air velocity at the chamber outlet and enhancing turbine performance. Furthermore, considering the k factor, this configuration proved effective under shorter wave periods compared to the cylindrical and rectangular chambers, which is advantageous in environments with lower wavelengths. In addition, the velocity and pressure field vectors showed a consistently proportional distribution throughout the air movement phase. This configuration reached airflow velocities of up to 24 m/s near the outlet, providing sufficient kinetic energy to initiate and sustain turbine rotation efficiently.
Angles between 45° and 55°, geometric configurations (conical, circular, and rectangular), and wall thicknesses ranging from 0.5 to 1.5 m were evaluated to identify the chamber design that best met the operational requirements for optimal Wells turbine performance. The inclined cylindrical chamber, characterized by a wall thickness of 1 m, an inclination angle of 55°, and an opening width of 9 m, was the most suitable configuration for achieving these objectives. Among the configurations analyzed, the cylindrical chamber exhibited the highest velocity amplification, with a rate of increase of 27, compared to 7 and 1.14 for the inclined cylindrical and rectangular chambers, respectively. Table 5 clearly shows that the inclined cylindrical chamber provides greater velocity stability in both water and air phases. This reflects an effective interaction with two critical fronts: the incident wave and the internal air column. The reduced fluctuation in velocity contributes to a more stable flow, minimizing the amplitude-related cyclic stresses on the structure and enhancing overall system durability. Therefore, the inclined cylindrical chamber demonstrates the best balance between efficiency, technical, and environmental viability.
Author Contributions
Conceptualization, M.E.-A.; methodology, N.Y.-C.; software, N.V.-M.; validation, J.B.-M.; formal analysis, M.E.-A.; investigation, B.O.-S.; resources, B.O.-S.; data curation, J.B.-M.; writing—original draft preparation, B.O.-S.; writing—review and editing, M.E.-A.; visualization, N.V.-M.; supervision, N.Y.-C.; project administration, M.E.-A.; funding acquisition, M.E.-A. All authors have read and agreed to the published version of the manuscript.
Funding
This study was funded by Corporación Ecuatoriana para el Desarrollo de la Investigación y Academia—CEDIA. I+D+I-XVIII-2023-57-Energía Undimotriz.
Data Availability Statement
The raw data supporting the conclusions of this article will be made available by the authors on request.
Acknowledgments
The authors would like to thank Corporación Ecuatoriana para el Desarrollo de la Investigación y Academia—CEDIA for the financial support given to the present research, development and innovation work through its I+D+I-XVIII-2023-57-Energía Undimotriz.
Conflicts of Interest
The authors declare no conflict of interest.
Abbreviations
The following abbreviations are used in this manuscript:
| OWC | Oscillating Water Column |
| CFD | Computational Fluid Dynamic |
| WEC | Wave Energy Converter |
| PA | Point Absorber |
Appendix A
Efficiency Calculations
Based on the simulation results, the system’s efficiency is calculated by considering the input and output power, which require the values of velocity and pressure within the air chamber. The capture efficiency is determined using Equations (3)–(5). The analysis focuses on the inclined cylindrical chamber configuration, with a selected wavelength of 76.50 m and an average wave period of 7 s. This period is chosen to assess the power output under minimal wave conditions. A wave height of 1.74 m is considered as a conservative average value, from which the wave front power per meter of wave crest is calculated.
The analysis is conducted under deep-water wave conditions.
For the calculation of pneumatic power, the analysis considers the data corresponding to the minimum height of the water column, approximately 20 m, as this condition yielded the best results in terms of air velocity. A pressure differential of 100 kPa is assumed, representing a theoretical value under low to moderate wave conditions. In this context, S denotes the chamber outlet area, and v represents the average air exit velocity through the duct. Since the analysis is stationary, Equation (4) is resumed to find the pneumatic power.
Finally, using Equation (3) with and .
Wave capture efficiency is evaluated under the assumption that both the generator and the turbine operate as ideal elements.
References
- International Energy Agency. World Energy Outlook 2024; International Energy Agency: Paris, France, 2024; Available online: www.iea.org/reports/world-energy-outlook-2024 (accessed on 31 March 2025).
- López, I.; Andreu, J.; Ceballos, S.; Martínez de Alegría, I.; Kortabarria, I. Review of Wave Energy Technologies and the Necessary Power-Equipment. Renew. Sustain. Energy Rev. 2013, 27, 413–434. [Google Scholar] [CrossRef]
- Copping, A.; Battey, H.; Brown-Saracino, J.; Massaua, M.; Smith, C. An International Assessment of the Environmental Effects of Marine Energy Development. Ocean Coast. Manag. 2014, 99, 3–13. [Google Scholar] [CrossRef]
- Langhamer, O.; Haikonen, K.; Sundberg, J. Wave Power—Sustainable Energy or Environmentally Costly? A Review with Special Emphasis on Linear Wave Energy Converters. Renew. Sustain. Energy Rev. 2010, 14, 1329–1335. [Google Scholar] [CrossRef]
- Copping, A.E.; Hemery, L.G.; Overhus, D.M.; Garavelli, L.; Freeman, M.C.; Whiting, J.M.; Gorton, A.M.; Farr, H.K.; Rose, D.J.; Tugade, L.G. Potential Environmental Effects of Marine Renewable Energy Development—The State of the Science. J. Mar. Sci. Eng. 2020, 8, 879. [Google Scholar] [CrossRef]
- Drew, B.; Plummer, A.R.; Sahinkaya, M.N. A Review of Wave Energy Converter Technology. Proc. Inst. Mech. Eng. Part A J. Power Energy 2009, 223, 887–902. [Google Scholar] [CrossRef]
- Fenu, B.; Bonfanti, M.; Bardazzi, A.; Pilloton, C.; Lucarelli, A.; Mattiazzo, G. Experimental Investigation of a Multi-OWC Wind Turbine Floating Platform. Ocean Eng. 2023, 281, 114619. [Google Scholar] [CrossRef]
- Carrelhas, A.A.D.; Gato, L.M.C.; Henriques, J.C.C. Peak Shaving Control in OWC Wave Energy Converters: From Concept to Implementation in the Mutriku Wave Power Plant. Renew. Sustain. Energy Rev. 2023, 180, 113299. [Google Scholar] [CrossRef]
- Fu, L.; Ning, D.; Wang, R.; Mayon, R. Numerical and Experimental Study on Hydrodynamic Performance of a Land-Based Dual-Chamber OWC Device under Irregular Waves. Renew. Sustain. Energy Rev. 2025, 207, 114895. [Google Scholar] [CrossRef]
- Jayashankar, V.; Anand, S.; Geetha, T.; Santhakumar, S.; Jagadeesh Kumar, V.; Ravindran, M.; Setoguchi, T.; Takao, M.; Toyota, K.; Nagata, S. A Twin Unidirectional Impulse Turbine Topology for OWC Based Wave Energy Plants. Renew. Energy 2009, 34, 692–698. [Google Scholar] [CrossRef]
- López, I.; Carballo, R.; Fouz, D.M.; Iglesias, G. Design Selection and Geometry in OWC Wave Energy Converters for Performance. Energies 2021, 14, 1707. [Google Scholar] [CrossRef]
- Zhi, S.; Wu, H.; Shen, H.; Wang, T.; Fu, H. Entropy-Aided Meshing-Order Modulation Analysis for Wind Turbine Planetary Gear Weak Fault Detection under Variable Rotational Speed. Entropy 2024, 26, 409. [Google Scholar] [CrossRef] [PubMed]
- Zhao, D.; Shao, D.; Cui, L. CTNet: A Data-Driven Time-Frequency Technique for Wind Turbines Fault Diagnosis under Time-Varying Speeds. ISA Trans. 2024, 154, 335–351. [Google Scholar] [CrossRef] [PubMed]
- Hong, K.; Shin, S.-H.; Hong, D.-C.; Choi, H.-S.; Hong, S.-W. Effects of Shape Parameters of OWC Chamber in Wave Energy Absorption. In Proceedings of the ISOPE International Offshore and Polar Engineering Conference (ISOPE), Lisbon, Portugal, 1–6 July 2007; p. ISOPE-I. [Google Scholar]
- Guo, B.; Ringwood, J.V. A Review of Wave Energy Technology from a Research and Commercial Perspective. IET Renew. Power Gener. 2021, 15, 3065–3090. [Google Scholar] [CrossRef]
- Sheng, W. An Experimental Study for Improving Performance of a Cylindrical OWC WEC with a Heave Plate. Renew. Sustain. Energy Rev. 2025, 214, 115517. [Google Scholar] [CrossRef]
- Ulm, N.; Huang, Z.; Cross, P. Experimental Study of a Fixed OWC-Type Wave Energy Converter in Irregular Wave Conditions. Sci. Rep. 2025, 15, 9420. [Google Scholar] [CrossRef]
- Zhao, M.; Ning, D. A Review of Numerical Methods for Studying Hydrodynamic Performance of Oscillating Water Column (OWC) Devices. Renew. Energy 2024, 233, 121177. [Google Scholar] [CrossRef]
- Dizadji, N.; Sajadian, S.E. Modeling and Optimization of the Chamber of OWC System. Energy 2011, 36, 2360–2366. [Google Scholar] [CrossRef]
- Abbasi, S.S.; Min, T.H.; Shafiai, S.H.; Theng, S.Y.; Heng, L.C. Design Enhancement of an Oscillating Water Column for Harnessing of Wave Energy. ARPN J. Eng. Appl. Sci. 2017, 12, 4791–4795. [Google Scholar]
- Parra-Quintero, J.; Rubio-Clemente, A.; Chica, E. Simulación Numérica de Una Columna de Agua Oscilante Para Las Condiciones de Ola Del Océano Pacífico Colombiano. Tecnológicas 2023, 26, e2630. [Google Scholar] [CrossRef]
- Rozali, R.H.; Mustapa, M.A.; Ramli, M.A.H.; Mansor, M.N.; Kamal, I.Z.M.; Mohamed, E.A.A.E. Design an Optimum Air Duct for Oscillating Water Column Wave Energy Device. J. Adv. Res. Appl. Sci. Eng. Technol. 2023, 34, 164–176. [Google Scholar] [CrossRef]
- Patel, S.K.; Ram, K.; Ahmed, M.R.; Lee, Y.-H. Performance Studies on an Oscillating Water Column Employing a Savonius Rotor. Sci. China Technol. Sci. 2011, 54, 1674–1679. [Google Scholar] [CrossRef]
- Liu, Z.; Xu, C.; Qu, N.; Cui, Y.; Kim, K. Overall Performance Evaluation of a Model-Scale OWC Wave Energy Converter. Renew. Energy 2020, 149, 1325–1338. [Google Scholar] [CrossRef]
- Ram, K.R.; Ahmed, M.R.; Zullah, M.A.; Lee, Y.-H. Experimental Studies on the Flow Characteristics in an Inclined Bend-Free OWC Device. J. Ocean Eng. Sci. 2016, 1, 77–83. [Google Scholar] [CrossRef]
- Ding, J.; Pang, S.; Chen, Z. Optimization of the Chamber of OWC to Improve Hydrodynamic Performance. Ocean Eng. 2023, 287, 115782. [Google Scholar] [CrossRef]


Disclaimer/Publisher’s Note: The statements, opinions and data contained in all publications are solely those of the individual author(s) and contributor(s) and not of MDPI and/or the editor(s). MDPI and/or the editor(s) disclaim responsibility for any injury to people or property resulting from any ideas, methods, instructions or products referred to in the content. |
© 2025 by the authors. Licensee MDPI, Basel, Switzerland. This article is an open access article distributed under the terms and conditions of the Creative Commons Attribution (CC BY) license (https://creativecommons.org/licenses/by/4.0/).