Article

Numerical Investigation on the Dynamic Sealing Performance of Stepseal Based on a Mixed-Lubrication Model

1
State Key Laboratory of Intelligent Coal Mining and Strata Control, Beijing 100013, China
2
Graduate School, China Coal Research Institute, Beijing 100013, China
3
Beijing Tianma Intelligent Control Technology Co., Ltd., Beijing 101399, China
4
College of Mechanical and Electronic Engineering, Shandong University of Science and Technology, Qingdao 266590, China
*
Author to whom correspondence should be addressed.
Processes 2025, 13(6), 1717; https://doi.org/10.3390/pr13061717
Submission received: 30 April 2025 / Revised: 22 May 2025 / Accepted: 28 May 2025 / Published: 30 May 2025
(This article belongs to the Special Issue Reliability and Engineering Applications (Volume II))

Abstract

:
The dynamic sealing performance of Stepseal® is vital to the reliability and remaining life of Stepseal. In this study, experimental and numerical investigations were performed for characterizing the dynamic sealing behavior of a typical Stepseal. A specific test rig was designed in order to experimentally obtain the dynamic friction force of the Stepseal, in accordance with the ISO7986 standard. A partial mixed-lubrication model, with the integration of inverse hydrodynamic lubrication and Greenwood–Williamson (G–W) surface contact model, was developed to numerically describe the dynamic sealing performance of the Stepseal. The effect of speeds and pressures on the predicted contact pressure as well as the film thickness of the Stepseals was discussed. A comparison between the experimental results and numerical predictions, in terms of the friction forces, shows that the partial mixed-lubrication model can provide reasonable accuracy for characterizing the dynamic sealing performance of the Stepseal.

1. Introduction

Seals serve as critical components in hydraulic systems, playing a vital role in regulating pressure and fluid volume within operational environments [1,2,3]. Among these sealing solutions, Stepseals demonstrate exceptional performance through enhanced dynamic sealing efficiency, reduced friction coefficients, and effective leakage prevention mechanisms. These advantages have led to their predominant application in reciprocating pump gland assemblies, as documented in studies [4,5,6]. Notably, operational challenges observed in hydraulic equipment frequently originate from interfacial interaction characteristics between Stepseal elements and piston rod surfaces. This operational dependency underscores the necessity for comprehensive research into the contact mechanics of Stepseal configurations to optimize system reliability and performance.
Recent advancements in the simulation of lubrication and sealing performance for reciprocating seals have demonstrated significant progress in theoretical modeling and experimental validation. Scholars widely employ coupled finite element analysis (FEA) and fluid dynamics approaches, integrating the Greenwood–Williamson (G–W) contact model to construct mixed-lubrication numerical models for simulating complex interfacial behaviors. For instance, Li et al. (2024) [7] proposed a transient elastohydrodynamic lubrication (EHL) model for Glyd-ring seals in high-water-based piston pumps, accounting for sinusoidal variations in piston rod velocity. Using FEA and finite volume methods, they revealed dual-peak characteristics in asperity contact pressure distribution and oil film squeeze effects, with experimental validation showing friction prediction errors below 5.12%. Similarly, Yang et al. (2021) [8] developed a mixed EHL model for skeleton reciprocating oil seals, identifying positive correlations between leakage rate, surface roughness, and velocity, while inversely relating leakage to fluid viscosity. Their numerical results aligned closely with high-speed ratio test bench experiments. Such studies transcend traditional full-film lubrication theory by coupling microcontact mechanics with macroscopic deformation analysis, significantly enhancing prediction accuracy for sealing performance.
Methodologically, current research exhibits diversification, with the integration of inverse hydrodynamic lubrication (IHL) and direct EHL theories emerging as a novel direction. Zhang and Feng (2022) [9] combined the computational efficiency of IHL with the G–W contact model to establish a thermal mixed-lubrication model, incorporating frictional heating effects. Their findings highlighted that elevated temperatures reduce oil film thickness, increasing asperity contact ratios and triggering a positive feedback loop between friction-induced heat and viscosity degradation. Kim et al. (2023) [10] further demonstrated that for U-cup seals, when the film parameter Λ < 3, asperity contact friction contributes over 80% of the total friction, with temperature rise causing up to 20.9% deviations in leakage predictions. Notably, experimental validation remains central to these studies. For example, Li et al. (2017) reduced average friction prediction errors from 62.6% (full-film models) to 10.5% using a mixed-lubrication model validated via a bidirectional sensor test platform [11]. However, existing research still lacks in-depth exploration of transient pressure fluctuations, time-dependent material properties, and multiscale surface morphology, coupling critical areas for future investigation.
Based on the prior comprehensive research of various scholars, this paper further analyses the interface performance of the plunger pair seal of the emulsion pump. Under the conditions of high speed, high frequency, high pressure, and low viscosity medium, a comparison is made between the stern seal in the mixed-lubrication model and the seal test bench.
A previous study experimentally and numerically investigated the static contact behavior of a typical Stepseal, i.e., a Turcon 2K Stepseal RSK300500 (TRELLEBORG, Trelleborg, Sweden) [12]. In this study, a series of tests was carried out to characterize the dynamic sealing performance of the Stepseal under different speeds and pressures using a specific test rig. A partial mixed-lubrication model, with the integration of inverse hydrodynamic lubrication and G–W surface contact model, was developed for predicting the dynamic sealing performance of the Stepseal. The distributions of the static stress, contact pressure, and film thickness were predicted using the partial mixed-lubrication model. The effect of the speeds and pressures on the sealing performance was discussed. The numerical predictions, in terms of the friction forces, were validated by the test results.

2. Experimental

The test rig was designed to measure the friction force of the tested Stepseal, as shown in Figure 1. The test rig consisted primarily of a crank-connecting rod mechanism, a pressurized seal testing chamber, a sliding guidance component, a pressure-supplying component, and a PLC control system. The testing pressure can be in the range from 0 MPa to 45 MPa, and an accumulator was used for stabilizing the testing system pressure [13].
The displacement and velocity of the rod in the testing chamber can be obtained from the dynamic analysis of the crank-connecting rod mechanism, as shown in Equations (1) and (2).
d = r 1 cos α + λ 4 ( 1 cos 2 α )
ν = r ω sin ϕ + λ 2 sin 2 ϕ
where r is the crank radius, ω is the angular velocity, λ is the ratio of the connecting rod length L to the crank radius r, and φ is the transmission angle. The parameters of the test rig are given in Table 1.
The displacement and velocity obtained from Equations (1) and (2), are shown in Figure 2. The testing program is referenced with the ISO7986-1997 [14] requirements. Based on ISO7986 [14], the inherent friction force, which refers to the friction force of auxiliary components such as the support ring and others under different reciprocating speeds when there is no pressure, should be tested at the beginning of each test program. The contact friction force can be assumed as the difference between the tested total friction force and the inherent friction force [15,16]. The results of the inherent friction force are given in Figure 3.

3. Mathematical Model

3.1. Solid Mechanics

The Turcon® 2K Stepseal RSK300500 (TRELLEBORG, Trelleborg, Sweden) was investigated in this study. Its geometric dimensions and material properties were characterized in prior work using a Z005 (ZwickRoell, Ulm, Germany) tensile-compression testing machine integrated with a VML400 3D (Ji-Thai Group, Taiwan, China) optical measurement system. For the O-ring, the Mooney–Rivlin hyperelastic constitutive model was employed to fit the uniaxial tensile test data, while a linear elastic relationship was adopted to derive the material constants of the PTFE-based seal component. A comprehensive description of these methodologies, including experimental protocols and parameter calibration, has been previously published in our earlier work [12]. The material constants obtained from curve fitting to the uniaxial tensile tests of the O-ring and PTFE-based seal ring were given in Table 2 and Table 3. Among them, the parameters in Table 2 are used to describe the superelastic model of NBR (M-R model), and the parameters in Table 3 are used to describe the linear elastic interval model of PTFE.
From a macroscopic perspective, the force conditions of the reciprocating sealing system of the plunger pair can be classified into the following types of forces: the oil film pressure generated due to the hydrodynamic pressure principle, the contact stress between the plunger and the rough peak of the sealing surface, and the preload force during the interference fit installation of the sealing ring. The effective sealing of the lip is achieved under the combined action of three forces.
According to the sealing structure of the plunger pair, the stern seal can be simplified to a two-dimensional axisymmetric model. According to the actual working conditions, when the plunger pump is in operation, the Stepseal is subjected to two types of loads: installation and pressure loading. The O-ring undergoes significant deformation, causing the rectangular ring to press against the plunger rod to prevent fluid leakage. The macroscopic deformation analysis of the Stepseal sealing model was carried out by using the finite element software ANSYS 2020R1 to obtain the von Mises stress of the seal, the contact length L of the sealing area and the static contact pressure Psc, laying the foundation for the subsequent analysis of the steady-state characteristics of the mixed lubrication.

3.2. Fluid Mechanics

The plunger pair seal of the emulsion plunger pump is exposed to high pressure, high speed, and high water-based working conditions. Frequent suction and discharge of liquid often lead to the occurrence of fluid cavitation. When the fluid pressure in the sealing area is less than the cavitation pressure, cavitation occurs in the sealing area, forming a coexistence of gas and liquid, which will lead to a decline in the performance of the hydraulic system, as well as adverse phenomena such as noise and vibration. The JFO cavitation theory can better solve the problem of mass conservation after the formation of gas–liquid two-phase flow. According to the JFO theory, when cavitation occurs in the sealed area, the sealed area can be divided into the cavitation area and the complete fluid area. Both of these areas and their boundaries follow the law of conservation of mass [17,18,19]. Based on this, the Reynolds equation considering the cavitation phenomenon can be obtained.
When the plunger pump is in operation, the plunger rod moves at a relative speed u relative to the stern seal, and a one-dimensional steady-state Reynolds equation considering roughness and cavitation effects can be obtained [20,21].
d d X ϕ xx H 3 e α ^ F Φ d F Φ d X = 6 U d d X 1 + 1 F Φ H T + ϕ scx
where φxx, φscx are the pressure flow factor and shear flow factor, respectively. F is the cavitation index. Φ is the fluid pressure of the oil film/density function.
For the liquid region,
φ ≥ 0, F = 1 and Pf = Φ;
For the cavitation region,
φ ≥ 0, F = 0 and Pf = 0, =1 + Φ
The boundary conditions are
P = P s e a l e d x ^ = 0 1 x ^ = 1
The average truncated film thickness, assuming a Gaussian distribution, can be calculated by Equation (5)
H T = H 2 + H 2 e r f H 2 + 1 2 π e H 2 2

3.3. Contact Mechanics

The Greenwood and Williamson (G–W) surface contact model [22] is used to calculate the contact pressure between the Stepseal and rod with the consideration of surface roughness effect [20,21,22], as given by
p c = 4 3 E 1 υ 2 η σ 3 2 R 1 2 1 2 π d z d 3 2 e z 2 2 d z
where ƞ is the density of roughness, E is the equivalent Young’s modulus of the sealing ring (PTFE), ν is the Poisson’s ratio of the sealing ring (PTFE), and R is the roughness radius. σ is the RMS roughness of the asperities.

3.4. Deformation Mechanics

The normal deformation of the oil film thickness in the sealed area is usually at the micrometer level. It is assumed that the influence of the microscopic deformation in this area on the macroscopic deformation of the sealing ring can be ignored [23,24,25]. The microelastic deformation of the film thickness is the result of the combined action of the supporting force composed of the fluid pressure Pf and the contact pressure Pc of the micro-convex body and the static contact pressure Psc of the sealing element under compression loading. According to the small deformation theory, the normal deformation of any node in the sealed area is linearly related to the applied load, that is, the change in the film thickness at any node is the sum of the normal deformations produced by the loads at all nodes in the sealed area at that point [26,27]. Then, the film thickness at any point in the sealed area can be expressed as:
H i = H s + j = 1 n k i j Δ P j
Δ P = P f + P c P s c
where Hs is the initial film thickness, k is the deformation coefficient matrix. (k)ij is the normal deformation caused by the i-th node when the unit load is applied to the k-th node. Psc is the static contact pressure, which can be extracted from ANSYS software [28,29].
The sealed contact surface and the sealing medium (such as the solid surface in the elastic lubricating film) are idealized as homogeneous, continuous, and isotropic elastic semi-infinite bodies. It is assumed that they undergo linear elastic deformation under contact load and satisfy small deformation and no physical force [30,31]. The displacement Green’s function integral of the two-dimensional elastic half-space is analyzed by using the half-space theory, and the surface deformation under a distributed load is described as
ν ( x ) = 4 π E p ( s ) ln x s d s
Among them, the static contact pressure is extracted from ANSYS. An approximate solution formula for the static oil film thickness obtained by substituting the static contact pressure into Equation (6) for linear regression is as follows:
H s = 1.0641 + ( 3.6305 5.0684 log 10 I ) 1 / 2
Among them, I = p s c 4 3 E 1 υ 2 σ ¯ 3 2 .

3.5. Auxiliary Calculation

3.5.1. Reciprocating Seal Friction Force

The total friction force of the reciprocating seal consists of two parts: contact shear stress caused by mutual contact of rough surfaces and viscous shear stress caused by fluid motion [32]. Among them, the contact shear stress and viscous shear stress are, respectively, τ c τ v
τ c = f p c u u
τ v = μ u h ϕ f ϕ f s + ϕ f p h 2 d p f d x
where ϕf, ϕfs and ϕfp are the shear stress factors [33,34].
The reciprocating seal friction force can be expressed as
F f = π D R o d 0 L τ v + τ c d x

3.5.2. Reciprocating Seal Leakage

Combined with the influence of cavitation effect, the expression of reciprocating seal leakage rate is
q = ϕ x h 3 12 μ d p f d x + u 2 1 + 1 F Φ h T + σ ϕ s c x
In the formula, the first term is the Poiseuille flow caused by pressure difference, and the second term is the Couette flow caused by shear velocity. It can be seen that the leakage rate is determined by the Poiseuille flow and the Couette flow [32].

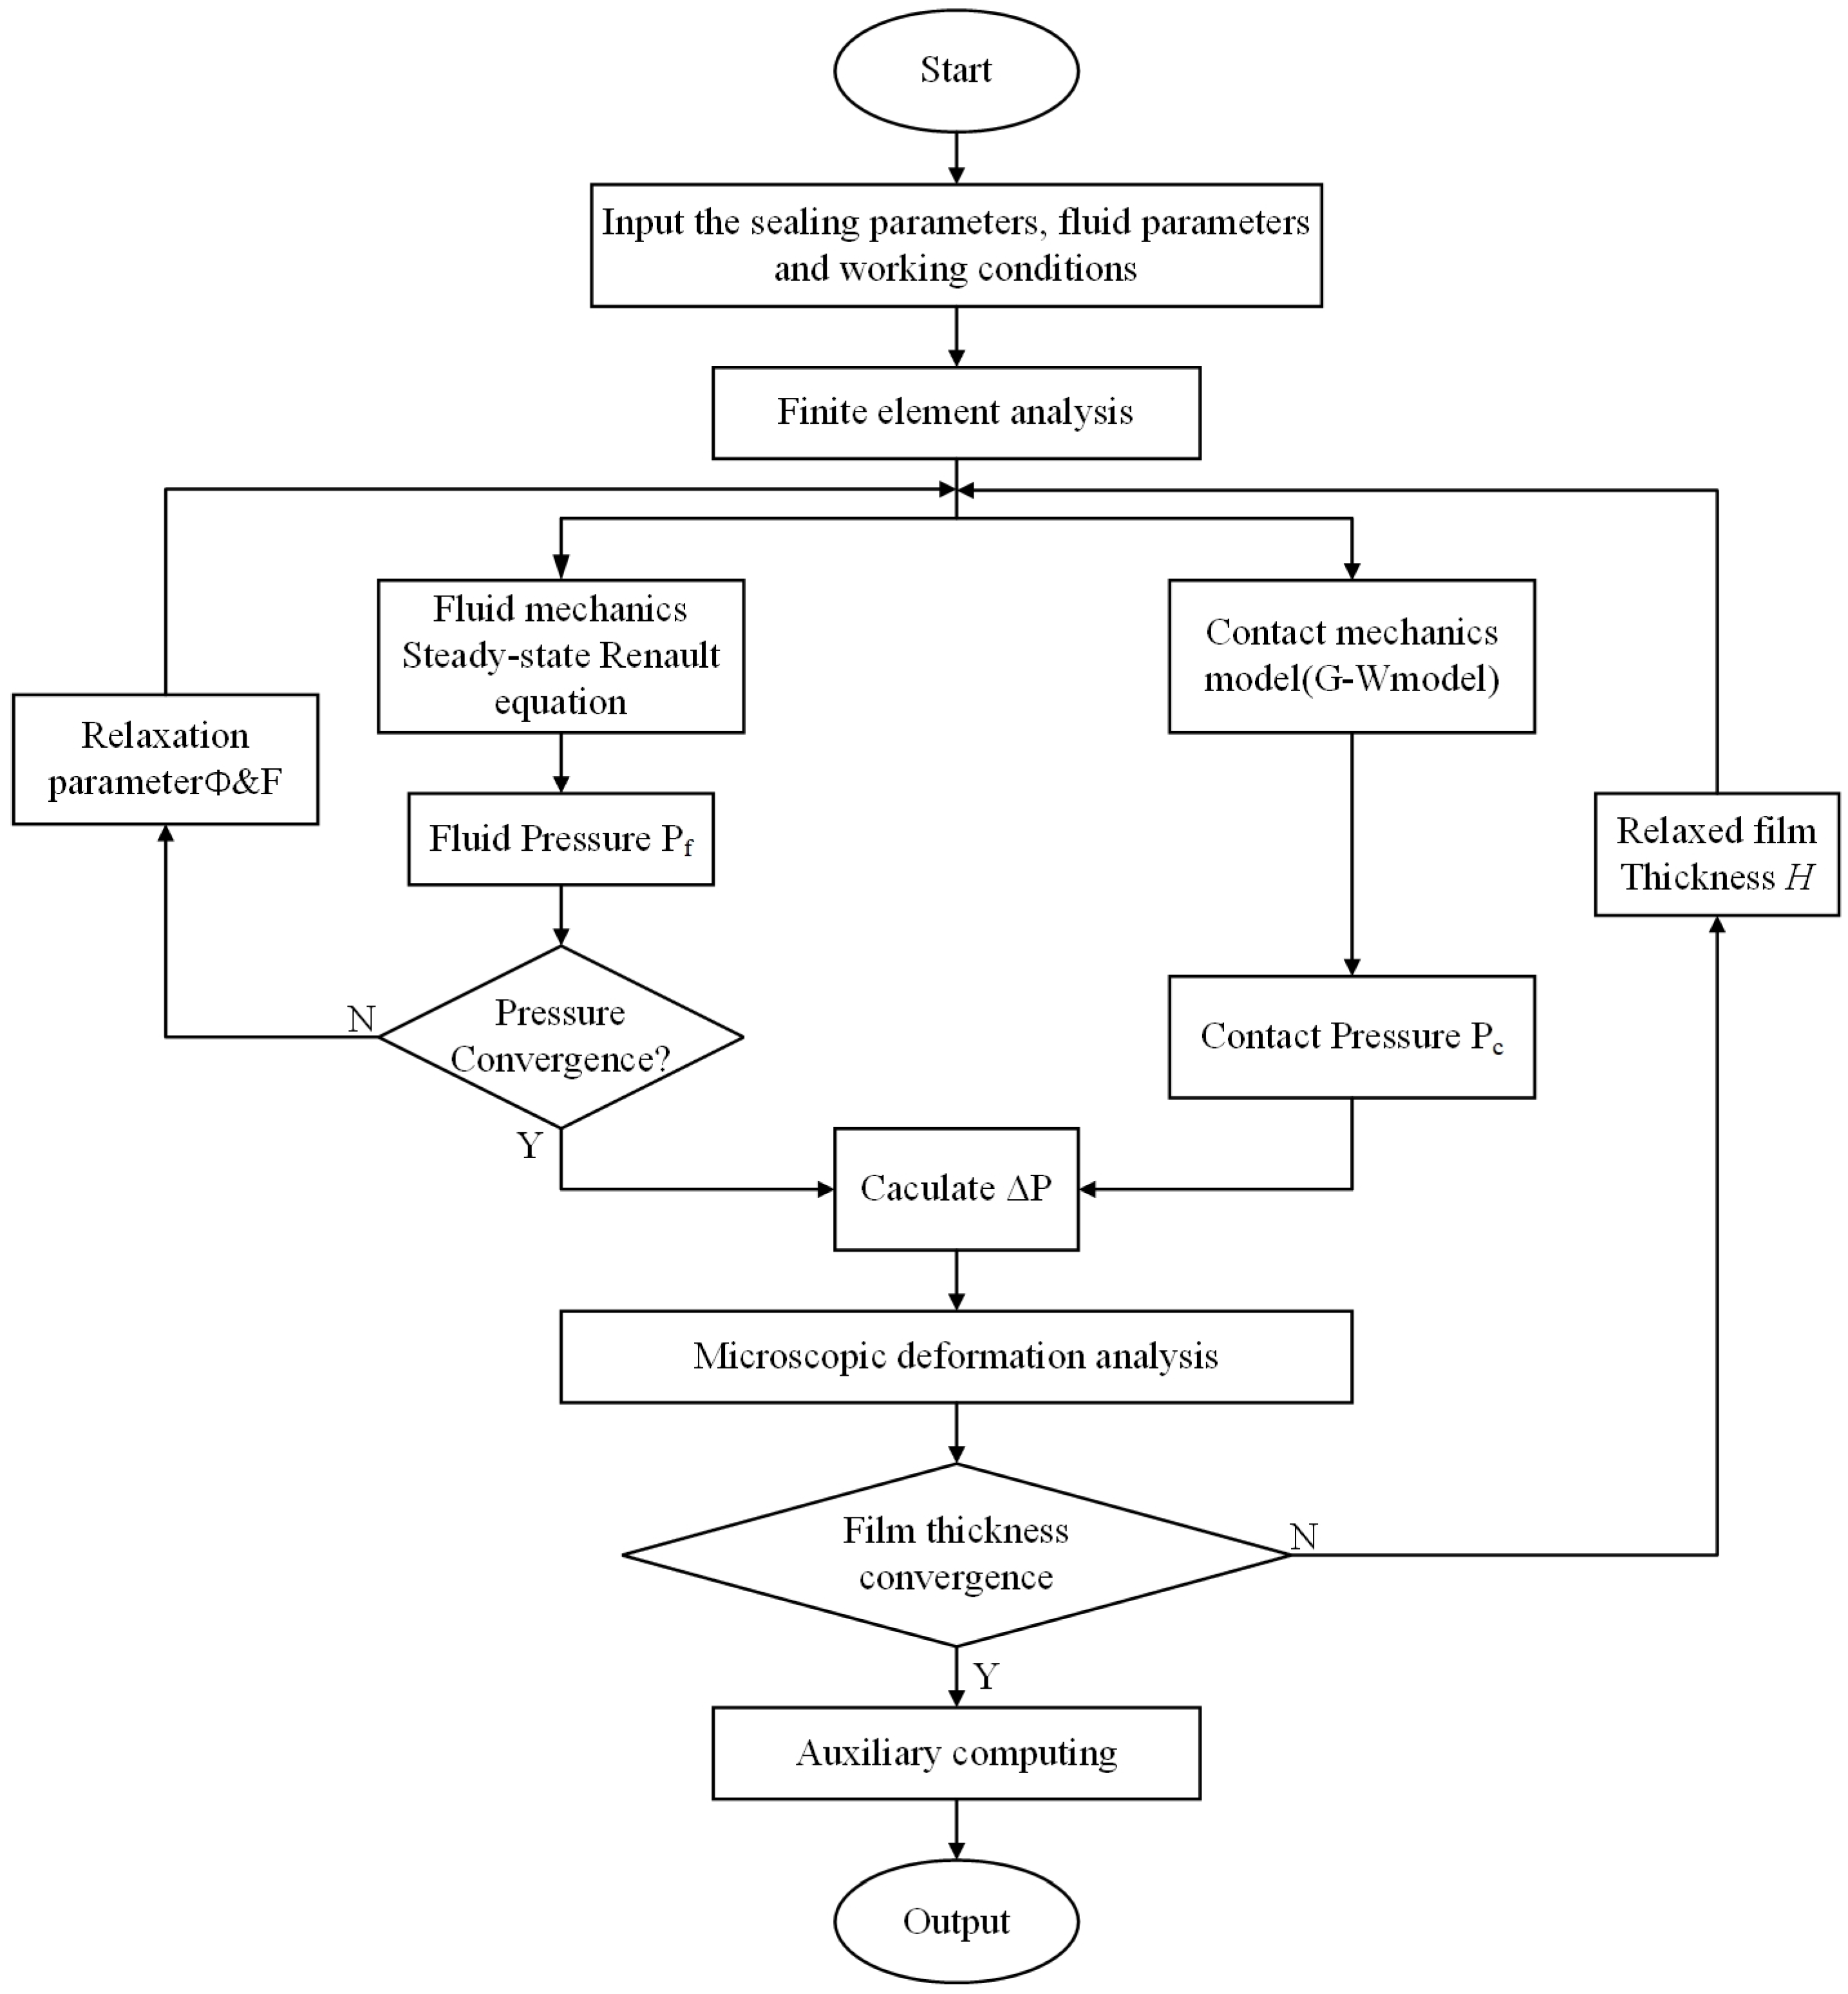
3.6. Computational Scheme

The Reynolds equation is written in the form after being discretized by the finite volume method, and the tridiagonal matrix algorithm is used to calculate the equations. Figure 4 shows the numerical algorithm of the single-stage steady-state mixed lubrication. The calculation includes the Reynolds equation, micro-convex contact equation, micro-deformation equation, and macro-deformation analysis of the Stepseal under installation and pressurization. Firstly, the finite element model of Stepseal is solved by ANSYS software, and the contact length L and static contact pressure Psc of the contact area between the rectangular ring and the plunger rod are extracted by APDL command as the initial values of the numerical solution. Secondly, the numerical calculation includes the pressure convergence cycle (internal cycle) and the film thickness convergence cycle (external cycle). In the internal cycle, the steady-state Reynolds equation, discretized by the finite volume method, is solved according to the parameters such as the initialized film thickness and pressure to obtain the fluid pressure PF. The fluid pressure converges into the external cycle, otherwise it relaxes Π and F. The oil film thickness is calculated by external circulation: firstly, the contact equation of micro-convex body is calculated according to the film thickness to obtain the contact pressure Pc, then the pressure difference P among fluid pressure, contact pressure and static contact pressure is calculated, the pressure difference is brought into the microscopic deformation equation to calculate the new oil film, and the convergence judgment of the film thickness is carried out. When the film thickness converges, the auxiliary calculation results, such as friction force and leakage, are output; otherwise, the film thickness is relaxed until the whole calculation process is completed.
In the iterative process, the pressure convergence error errr_p is smaller than the pressure convergence accuracy p. Similarly, the film thickness convergence error errr_h is smaller than the pressure convergence accuracy h. Where the convergence error expression is as follows:
e r r _ p = i m p f k + 1 p f k p f k + 1 ε p
e r r _ h = i m h k + 1 h k h k + 1 ε h

4. Results and Discussion

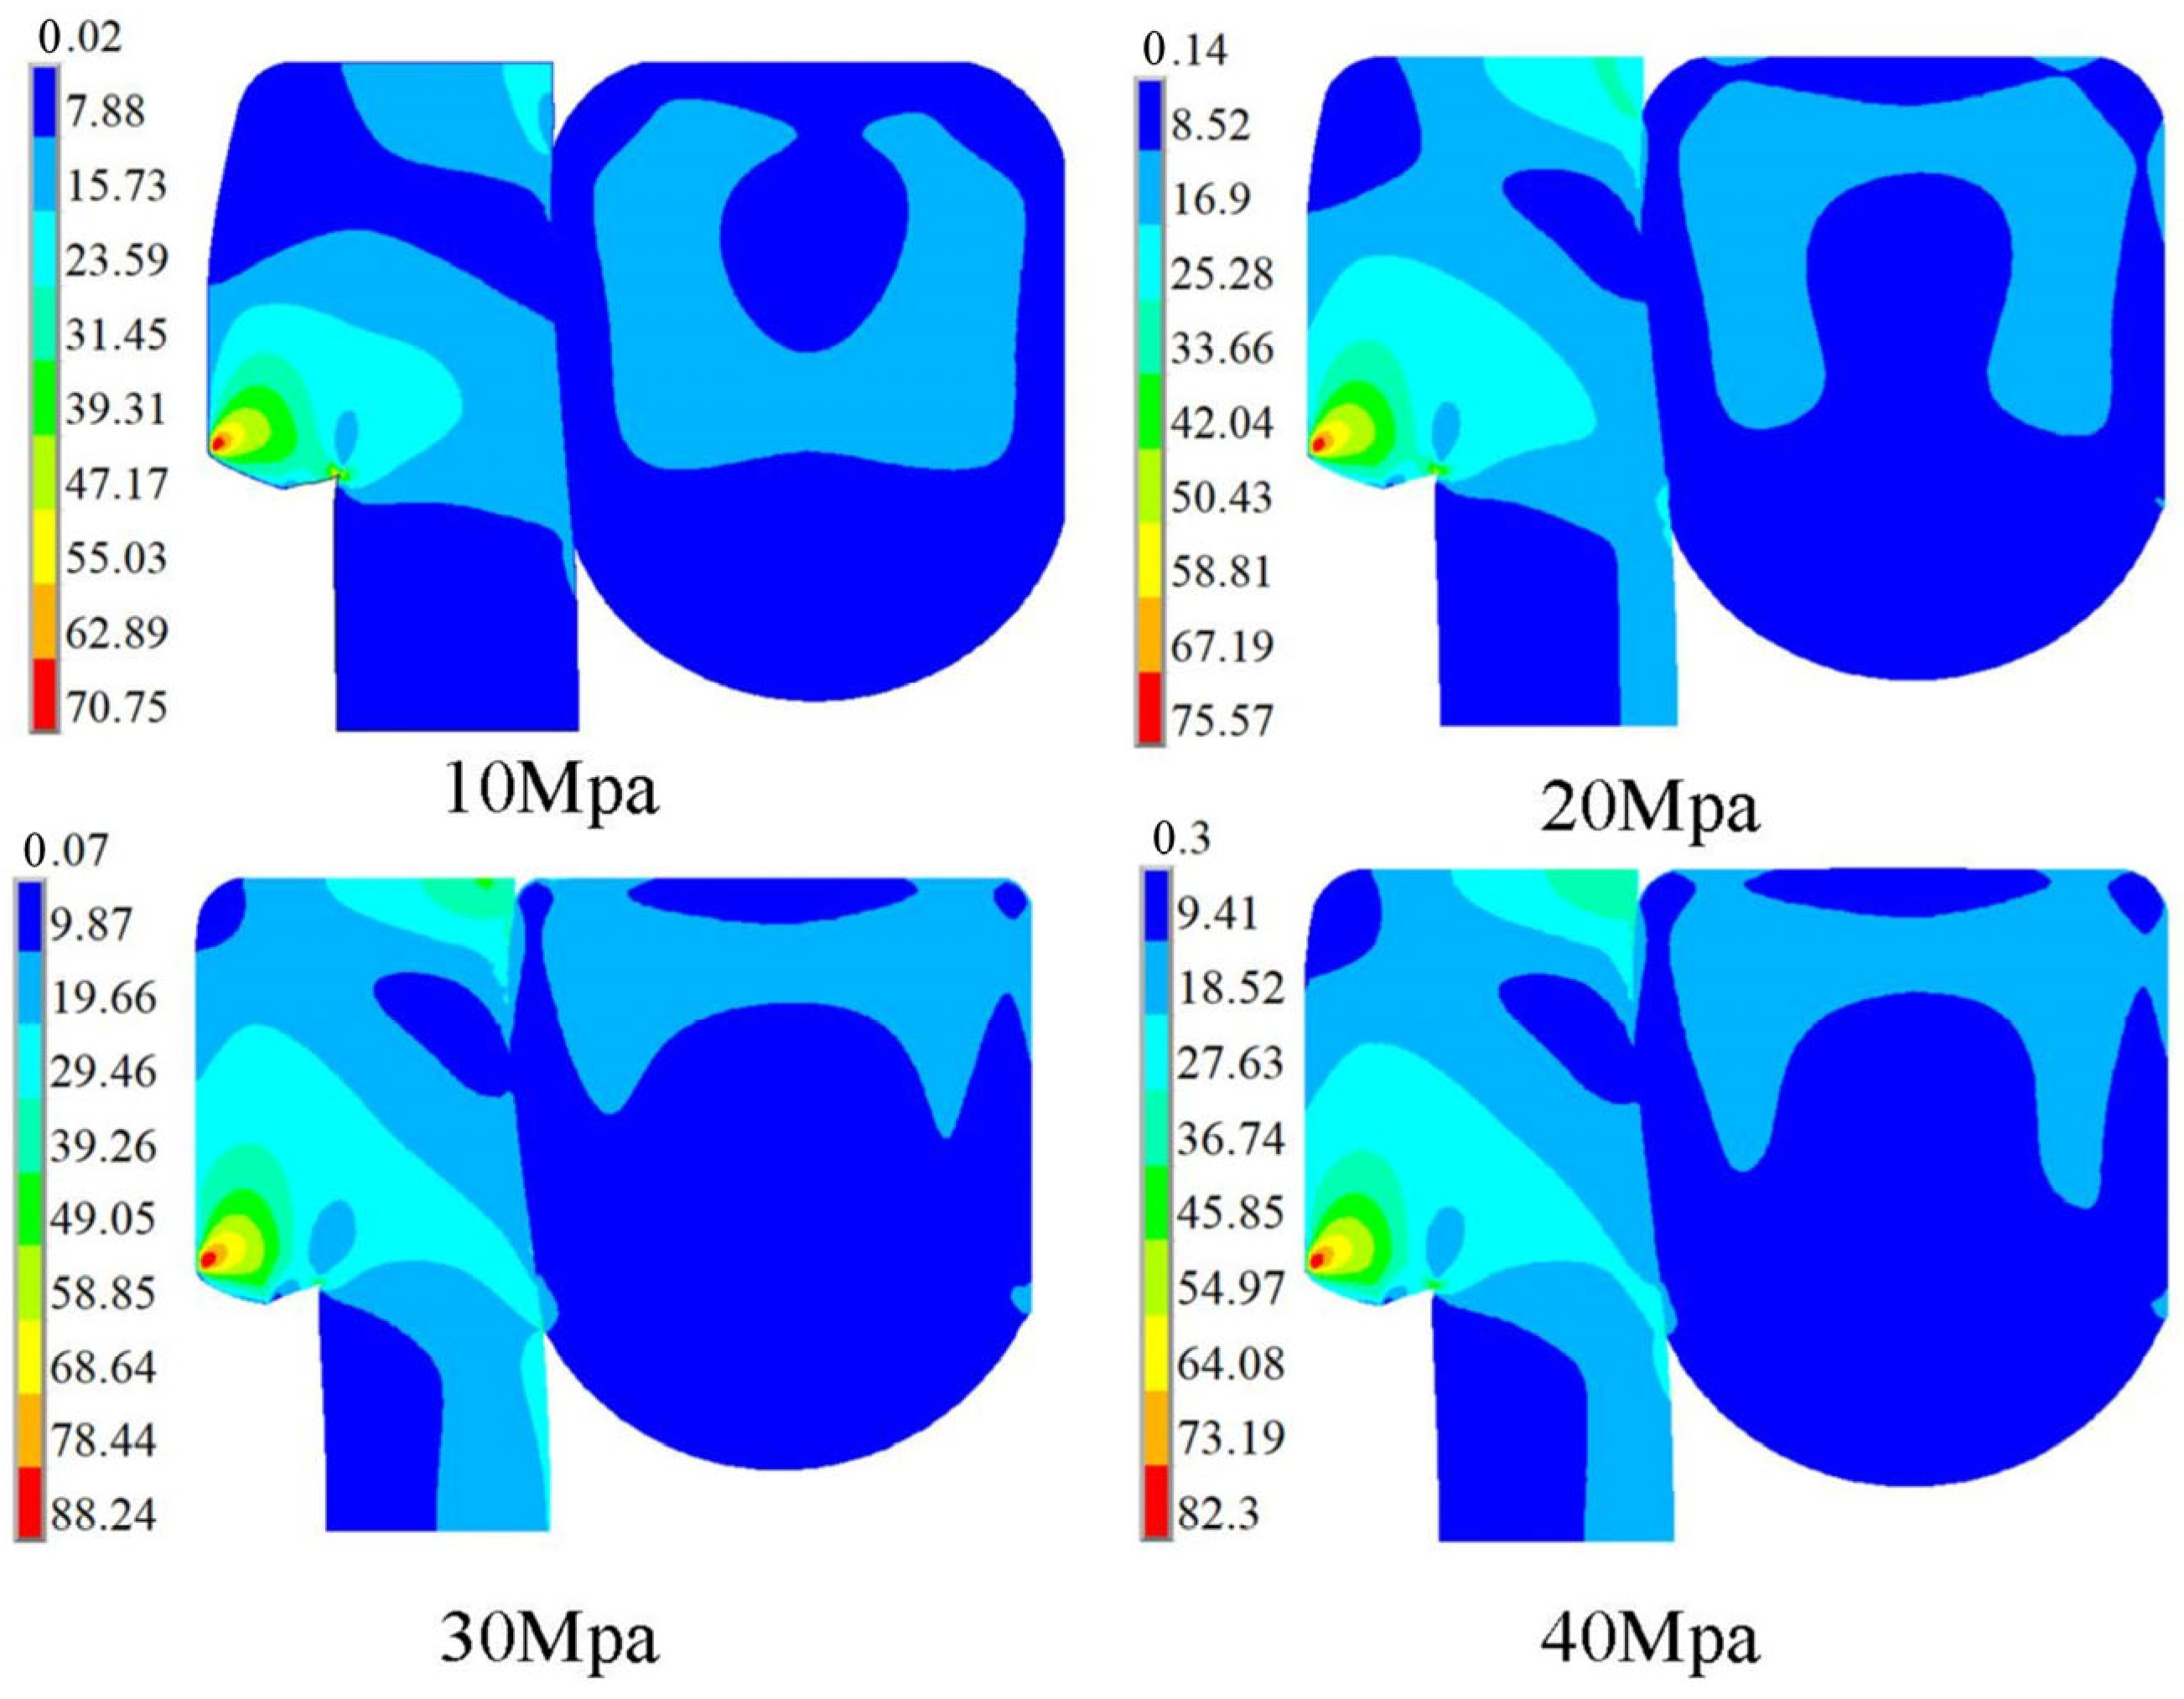
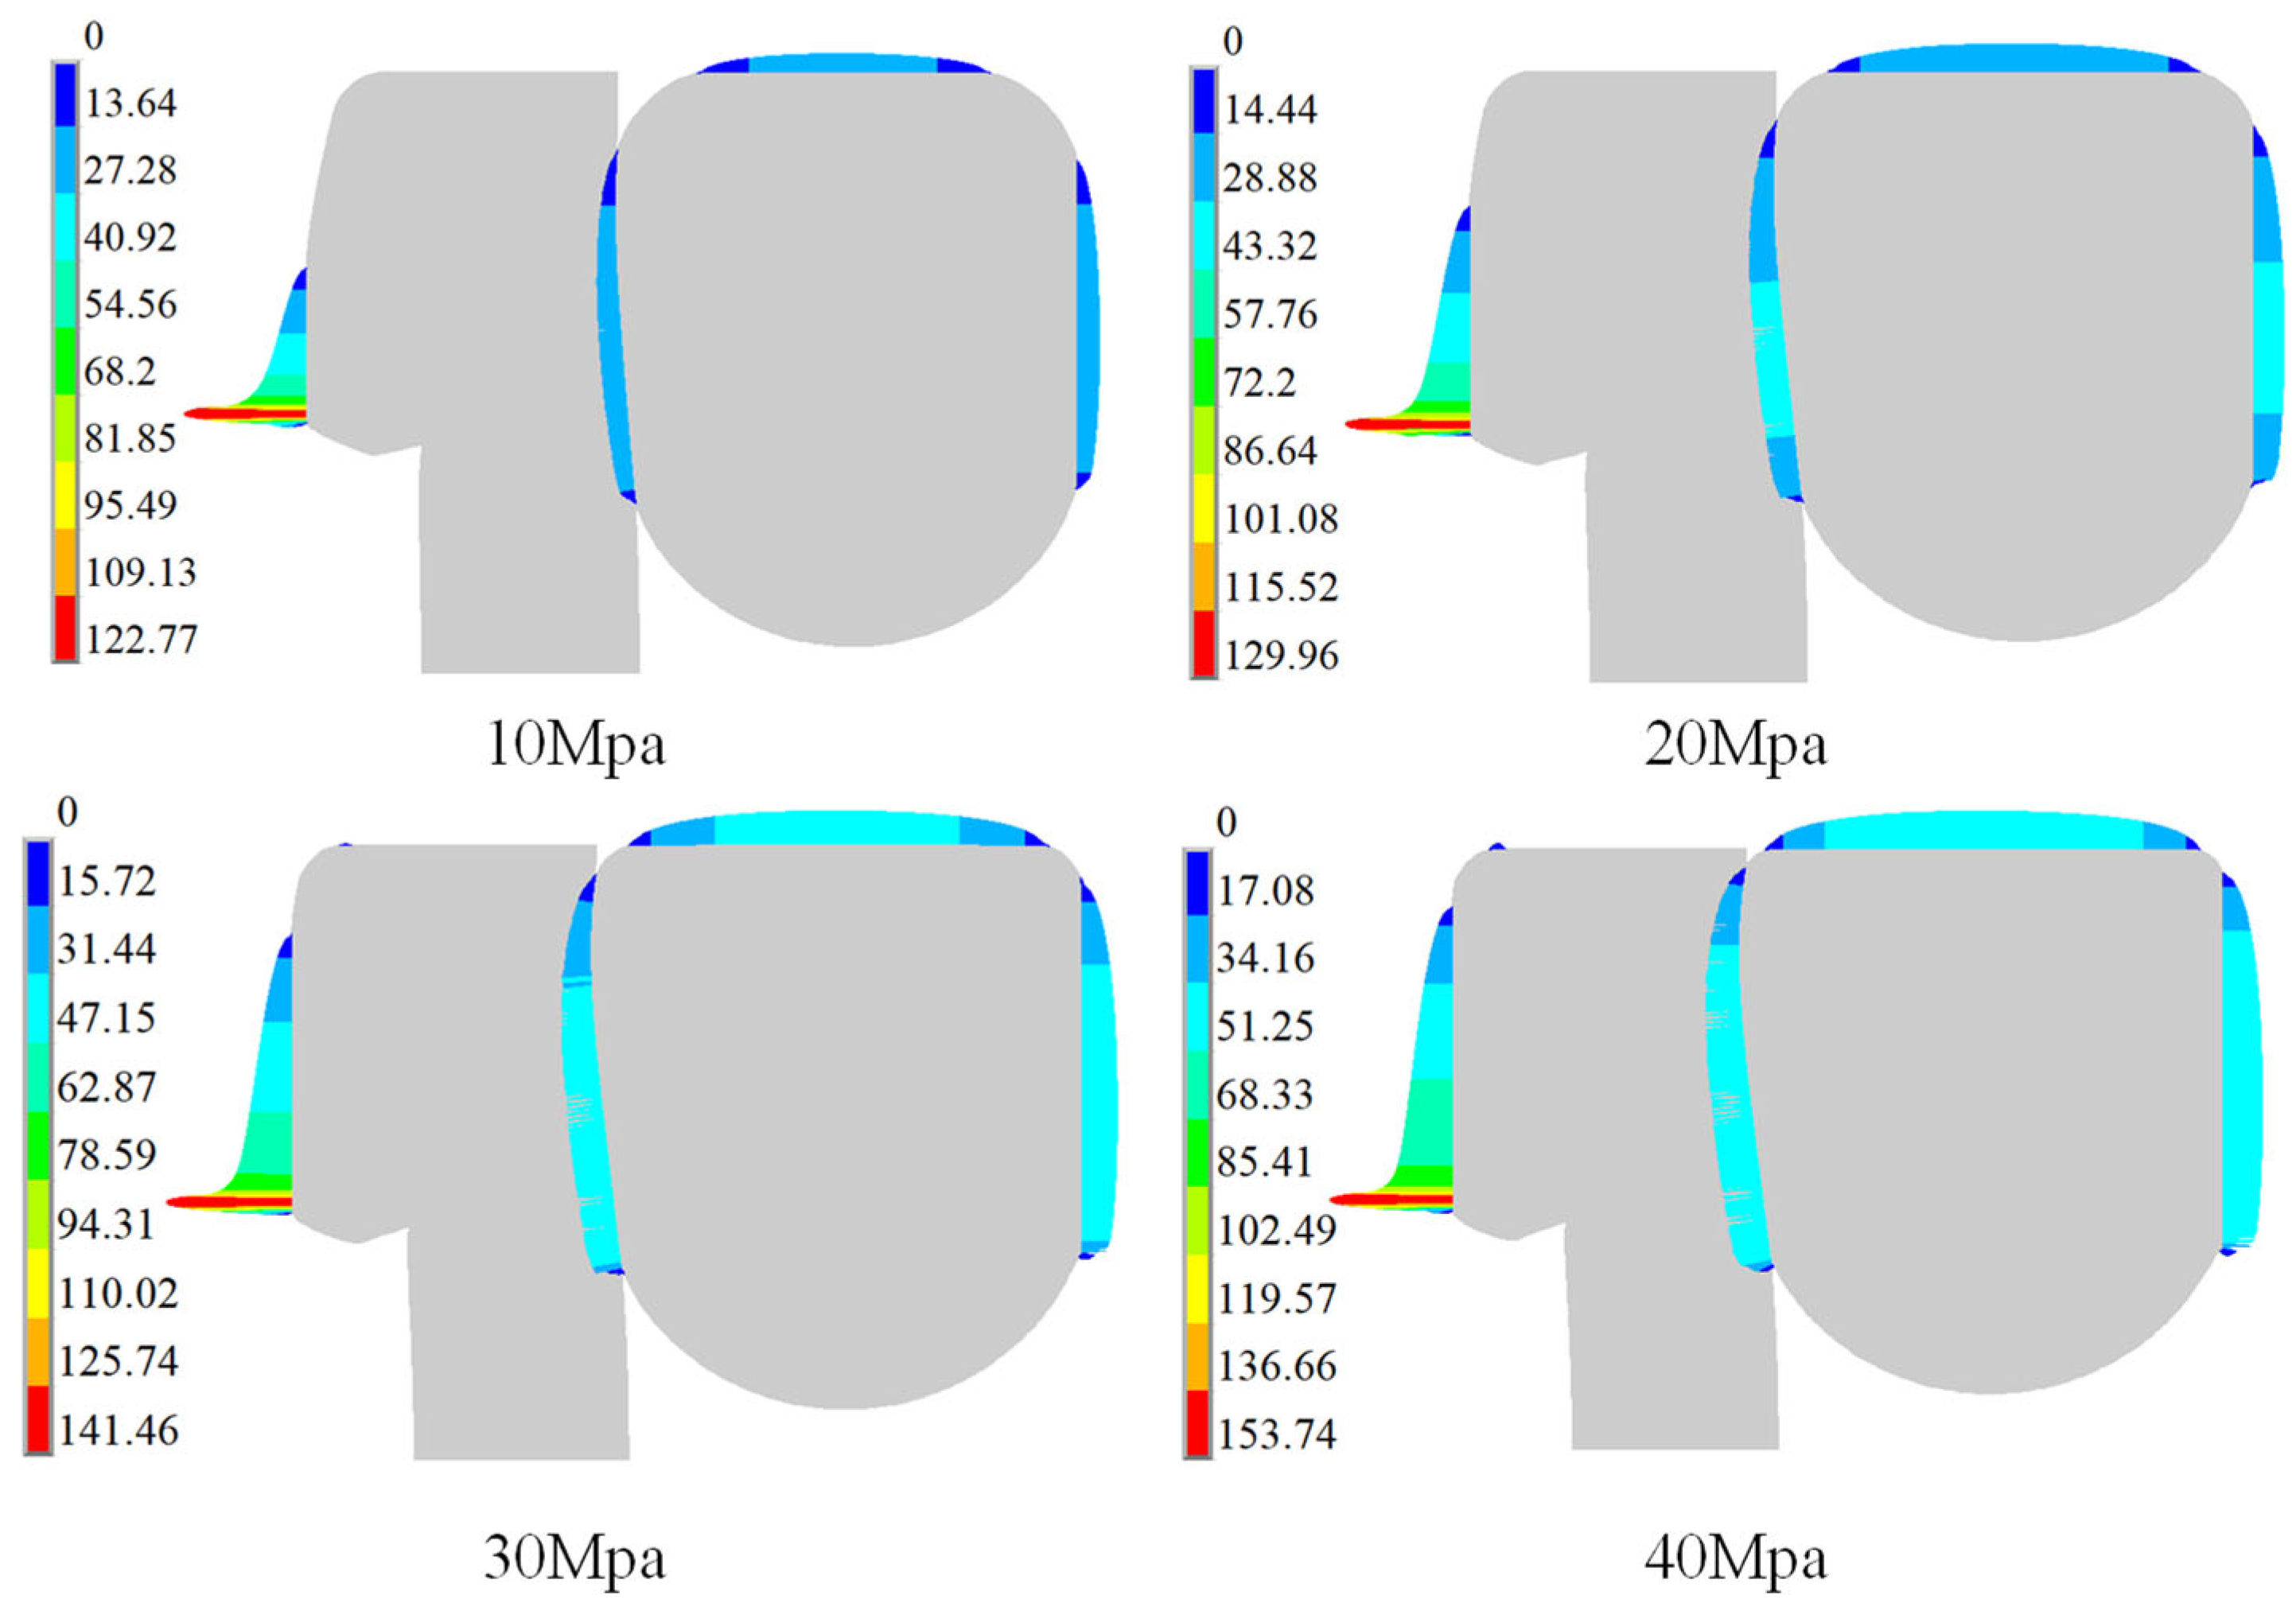
4.1. Static Stress Distributions

Figure 5 and Figure 6 show the von Mises static stress and contact pressure distributions of the Stepseal under different working pressures, in a range of 10 MPa to 40 MPa, respectively. It can be seen in Figure 5 and Figure 6, under the compression state, especially the O-ring, that the maximum stress area is concentrated near the lip of the step slip ring.
Under the combined action of pre-compression and seal pressure, the O-ring produces large deformation and squeezes the sliding ring. The contact pressure occurs at the contact interface between the sliding ring and the plunger, and its distribution is shown in Figure 6. It can be seen that the contact pressure of the lip increases with the sealing pressure.
By analyzing the simulation results of the von Mises stress distribution law and contact characteristics of the fluid sealing pressure on the combined sealing structure of the stern seal, it can be known that the von Mises stress near the lip of the slip ring is the largest, which makes the lip part of the PTFE slip ring prone to local damage phenomena such as wear and seizing, and is the main part where the stern seal is damaged. This, in turn, affects the service life of the sealing elements. However, the von Mises stress value of the O-ring is relatively small and shows no significant change with the increase in installation interference and sealing pressure. It only plays an auxiliary sealing role. The greater the fluid pressure sealed by the stern seal, the greater the maximum von Mises stress of the sealing structure, the peak static contact pressure, and the contact length of the sealing area.

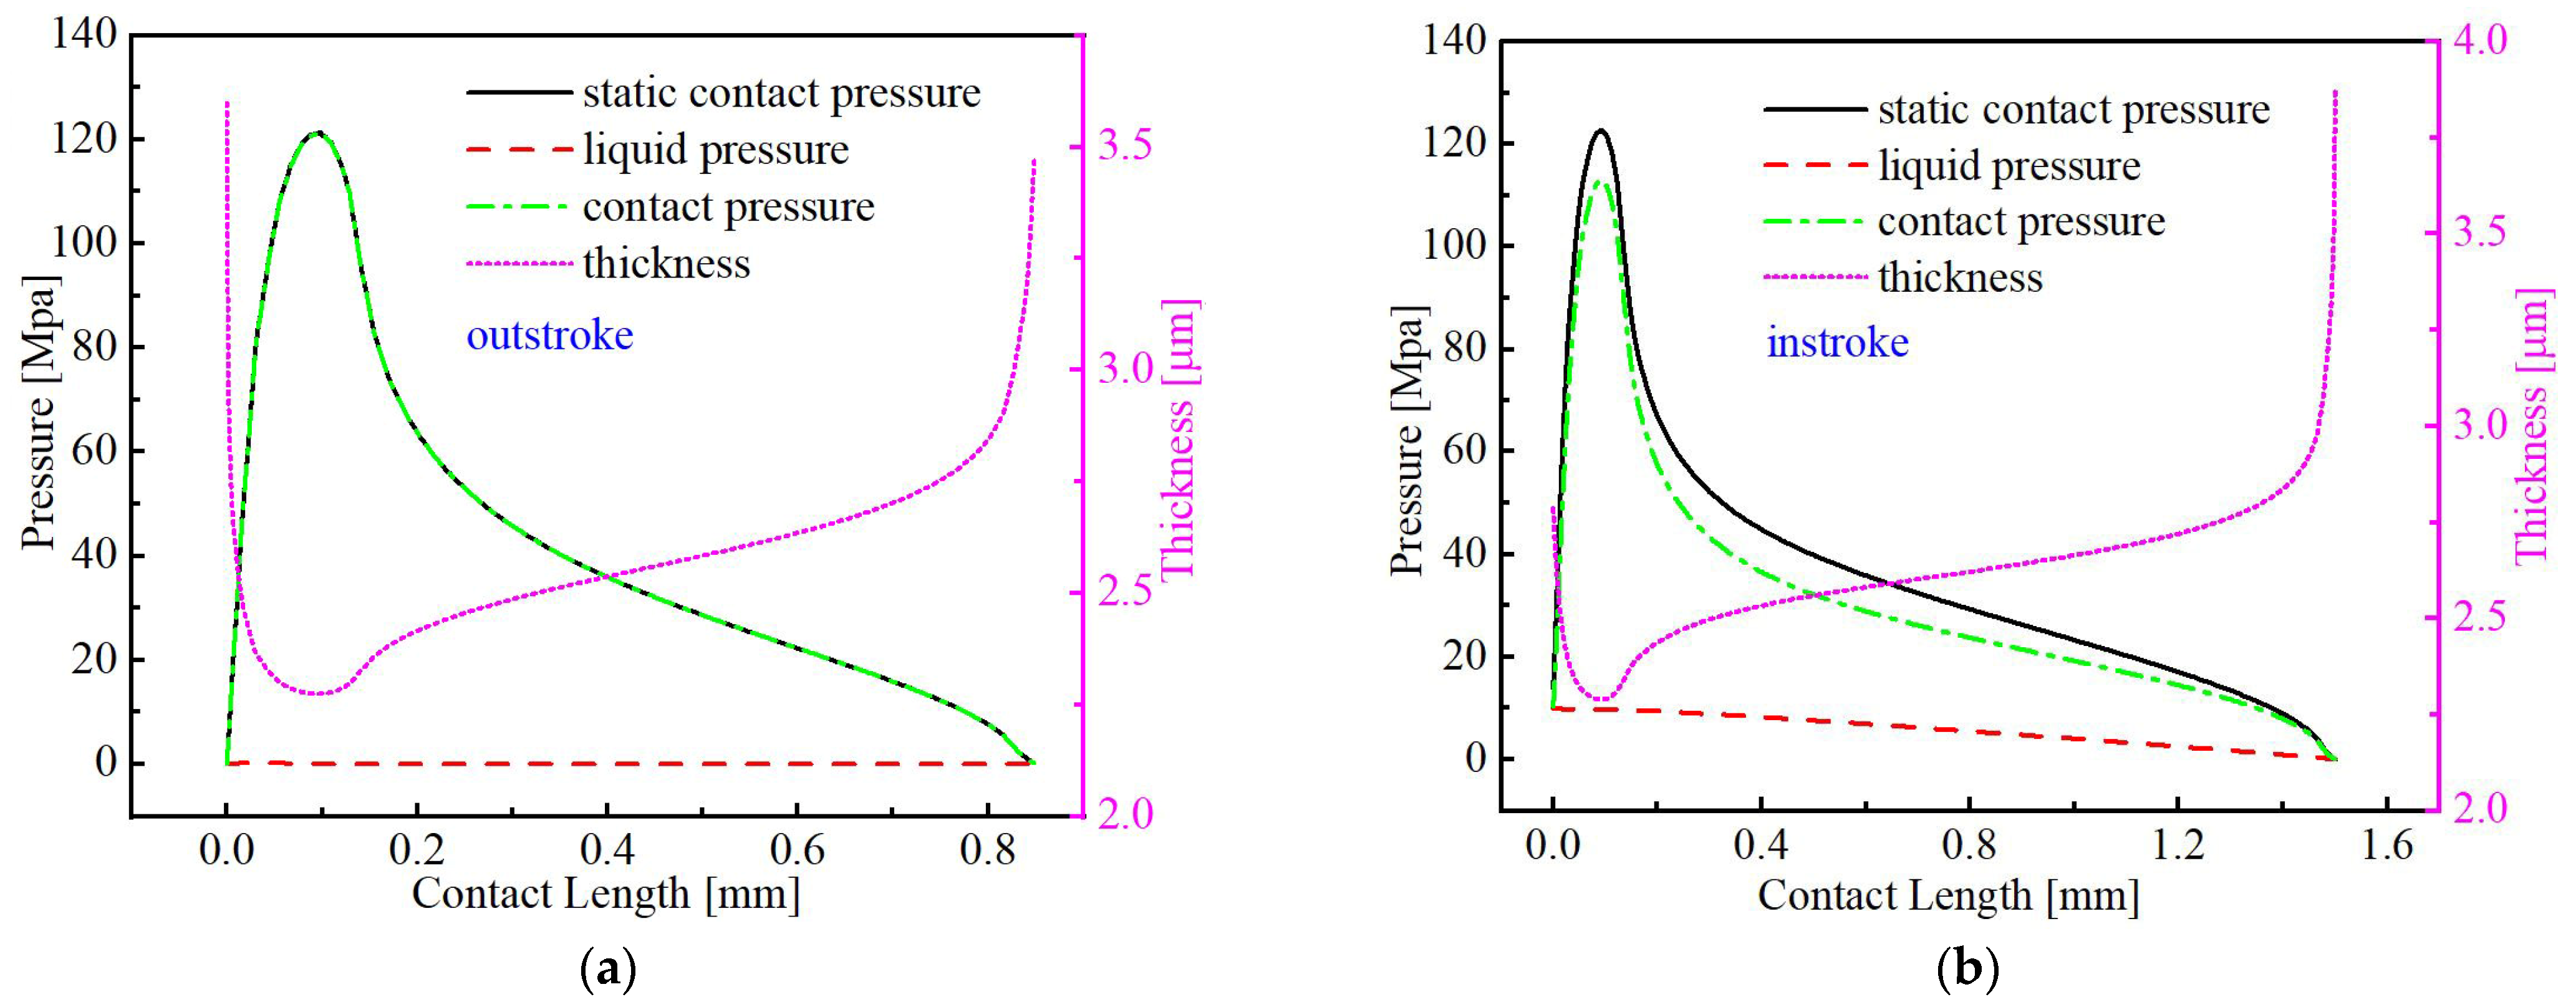
4.2. Contact Pressure and Film Thickness Distribution

Figure 7 shows the distribution of the static contact pressure, the roughness contact pressure, the fluid pressure, and the membrane thickness along the contact area of the plunger pair during the internal and external travel. As can be seen from Figure 7, the thickness of the oil film in both the inner and outer travel is less than 4 μm, indicating that the sealing contact zone is in a mixed lubrication state.
During the retraction phase (plunger suction cycle), the interfacial static stress and asperity-generated contact pressure exhibit congruent profiles, revealing that surface microgeometry characteristics predominantly govern seal integrity in this operational stage, with minimal hydrodynamic contributions. Conversely, in the compression phase (plunger discharge cycle), progressive pressure attenuation occurs across the sealing interface from the fluid boundary to ambient exposure. Both mechanical contact stress and surface roughness-induced pressure demonstrate analogous non-linear progression patterns—characterized by rapid ascent followed by asymptotic decay—along the tribological interface. This phenomenon confirms the synergistic yet hierarchical interaction between hydrodynamic conditions and asperity-mediated contact mechanics, wherein surface roughness-derived pressure maintains principal influence over sealing functionality.
As evidenced by the interfacial dynamics presented in Figure 8, the lubricant film within the sealing zone undergoes rapid thinning followed by progressive thickening along the tribological interface, culminating in accelerated film regeneration near the atmospheric boundary. Increased reciprocation speed induces marginal augmentation of film thickness while maintaining consistent interfacial contact morphology. This phenomenon is attributed to intensified hydrodynamic pressurization under elevated cyclic velocities, which simultaneously enhances lubricant entrainment and stabilizes the contact pattern configuration.

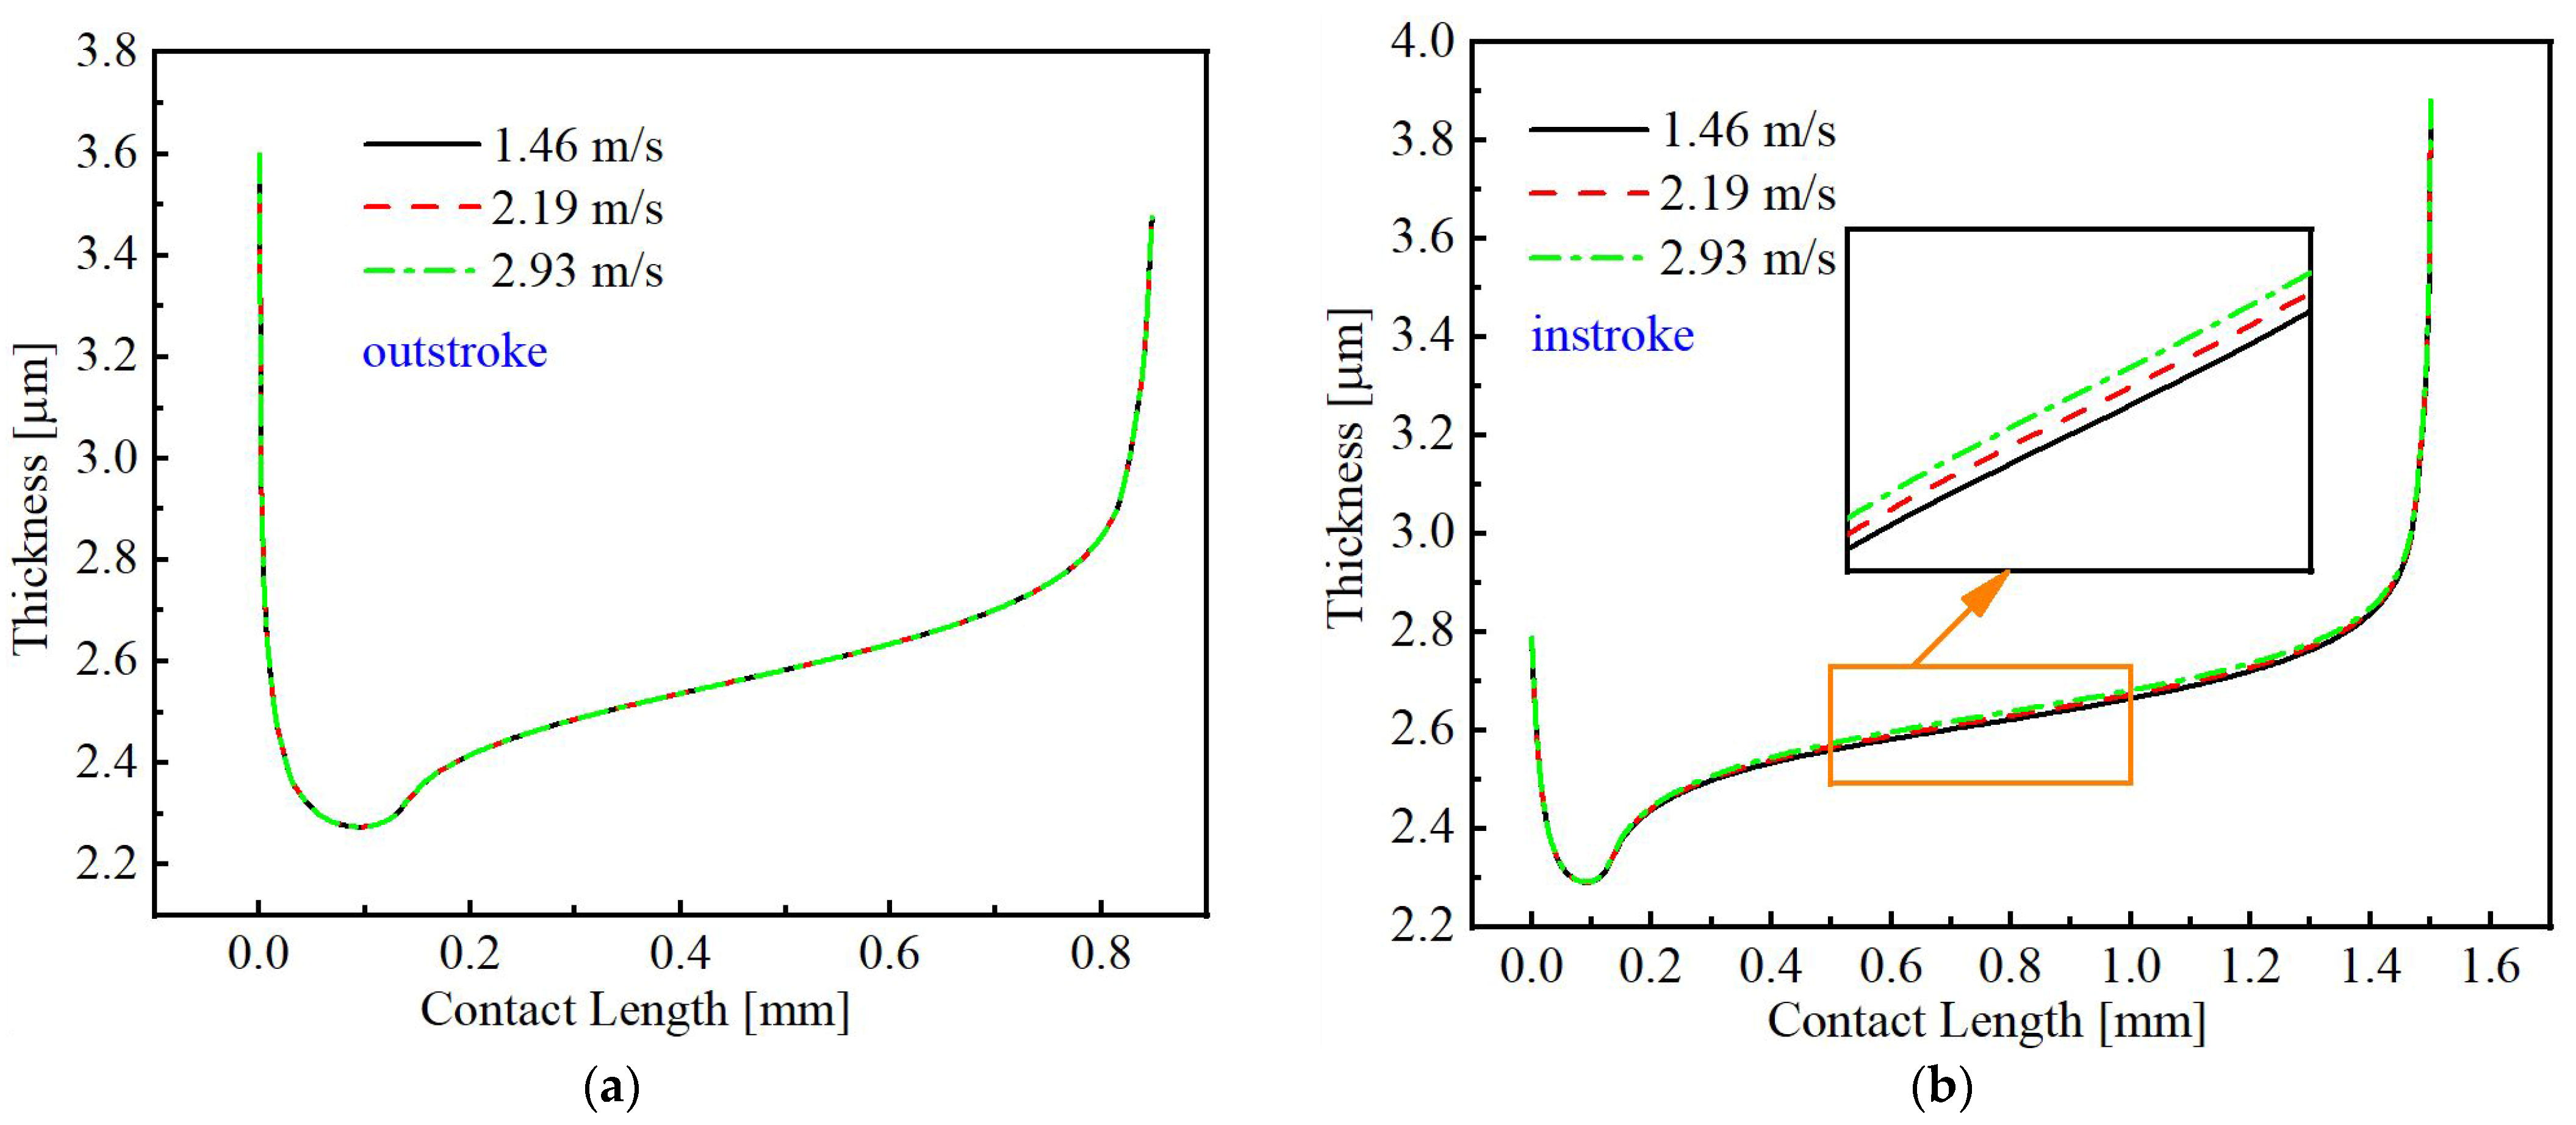
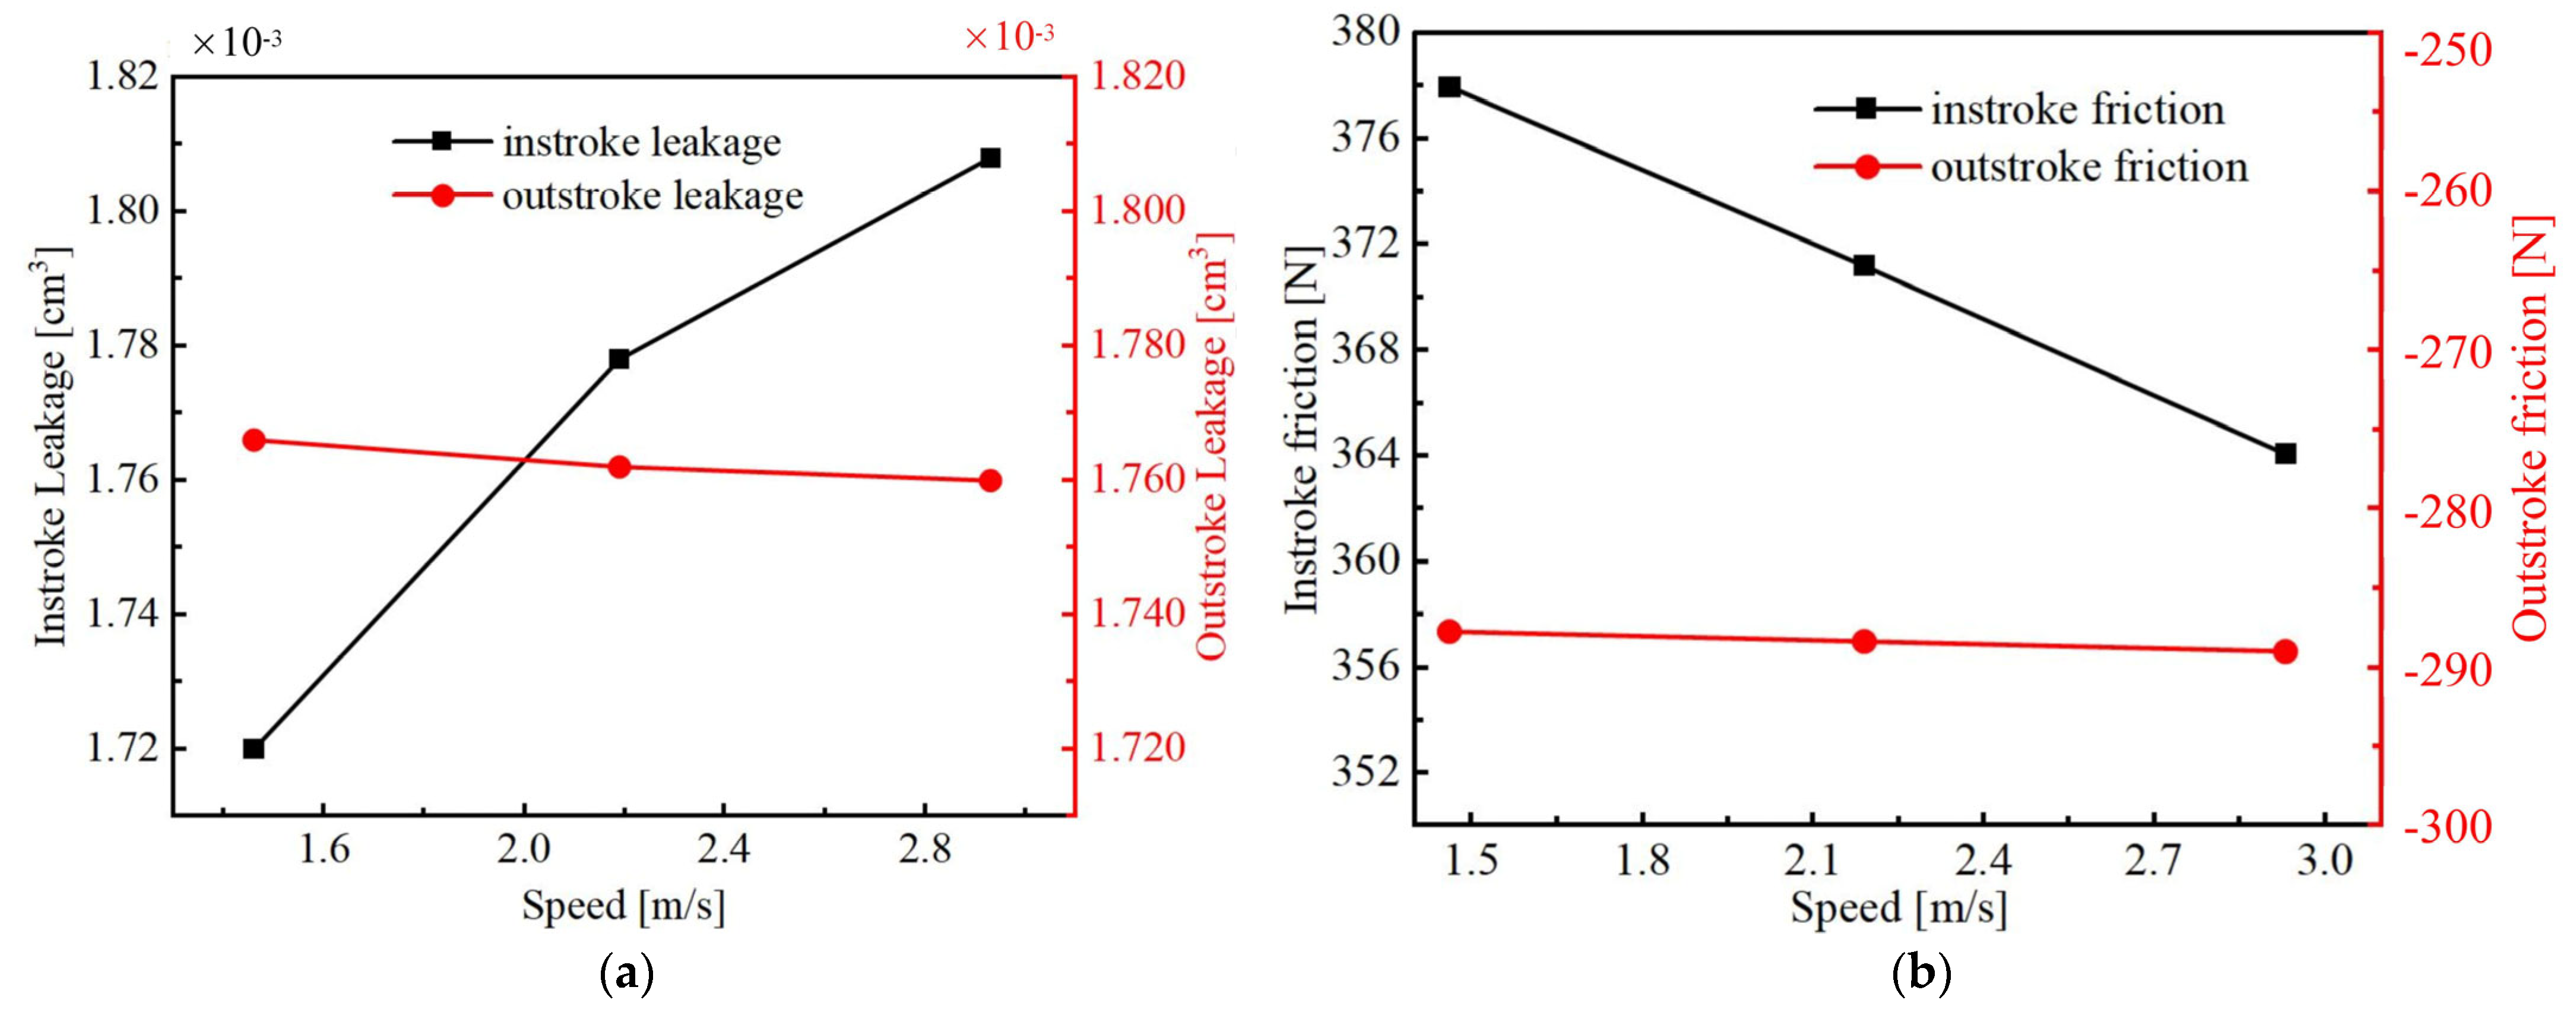
4.3. Effect of Different Sealing Pressure and Reciprocating Speed

It can be seen from Figure 9 that in the inner stroke, there is no significant difference in the thickness of the minimum oil film, but the length of the contact area of the lubricating oil film increases significantly.
Figure 10 shows the variation rules of leakage and seal friction in the internal and outer travel of reciprocating seals at different reciprocating speeds. As can be seen from the figure, when the reciprocating velocity of the plunger increases, in terms of leakage, the instroke gradually increases while the outstroke remains almost unchanged. Regarding friction, where positive and negative represent the direction of the force, the friction in the instroke gradually decreases. The outstroke remains almost unchanged. It should be noted here that the leakage of the internal stroke is dominated by the inward shear flow, while the external stroke is dominated by the outward leakage. According to the value, the inward and outward leakage are basically consistent, indicating that in a reciprocating process, the special sealing performance is good, and the faster the outward leakage is, the smaller it is.
Elevated reciprocation velocities induce proportional frictional reduction across both compression and extension cycles. This tribological behavior stems from hydrodynamic intensification mechanisms activated by enhanced cyclic motion, where amplified lubricant film pressurization effectively diminishes solid-phase interactions at the sealing interface. Specifically, the velocity-dependent augmentation of elastohydrodynamic lift forces promotes interfacial separation, thereby transitioning frictional dominance from boundary lubrication regimes to viscous shear-controlled mechanisms.
According to Figure 11, the increase in the seal pressure causes an approximately linear increase in the friction in the internal travel, but the outer travel does not change significantly, and is lower than the instroke, where positive and negative represent the direction of the force. This is due to the large sealing pressure of the sealing ring in the inner travel, and the static contact pressure increases significantly with the increase in the sealing pressure, which leads to increased friction. During the outer travel, the sealing pressure is kept at a small constant pressure, and the friction remains basically unchanged. In addition, with the increase in the seal pressure, the inward leakage decreases during the internal stroke, and the external travel leakage does not change. It indicates that the increased seal pressure increases the outward leakage. At 40 MPa, the outward leakage of the plunger in a single reciprocating process is 1.75 minus the inward leakage, 1.62, and the net leakage is 0.13 × 10⁻³ mL.

4.4. Comparison Between the FE Predictions and Experimental Results

According to the mixed-lubrication theoretical model described in the previous part of the experiment, the theoretical calculations and experimental test results are analyzed under the same working conditions. The friction force results obtained from the experiment are compared with the theoretical calculation values to verify the validation of the theoretical calculation method.
As shown in the Figure 12, they represent the average friction force measured in the experiment and the friction force results calculated by the numerical model under different reciprocating speeds and different medium pressures when the medium temperature is 20 °C, respectively. From the results, it can be seen that the friction force of the reciprocating seal is negatively correlated with the reciprocating speed and positively correlated with the medium pressure. The variation trends of the experimental average friction force with the reciprocating speed and the oil pressure are basically consistent with the solution results of the numerical model. However, as can be seen from the figures, there is a certain error between the experimentally measured values and the theoretically calculated values. When the experimental variable is the medium pressure, the average error reaches 21.72%, and when the experimental variable is the reciprocating speed, the average error reaches 9.02%.
The possible reasons for the generation of the differences between the FE predictions and experimental results are analyzed as follows: Firstly, the idealized assumptions in the theoretical model. There are some assumptions and simplifications in the derivation process of the Reynolds equation, such as the inertial force, the viscoelasticity of the sealing ring, and the transient effects in actual operation. In addition, some systematic errors during the assembly and processing of the test bench could be responsible.

5. Conclusions

(1) The interfacial sealing region operates under a mixed-lubrication regime. During the extension cycle, the asperity-mediated contact pressure demonstrates identical magnitude with static interfacial stress, revealing that surface topography parameters predominantly govern sealing efficacy in this phase, with negligible hydrodynamic contributions. Conversely, in the retraction cycle, a progressive pressure gradient forms from the liquid interface to atmospheric exposure. Both mechanical contact stresses and asperity-induced pressures exhibit analogous parabolic distributions characterized by rapid escalation followed by asymptotic decay. This phenomenon confirms the coupled influence of hydrodynamic conditions and surface asperity interactions on sealing dynamics, though tribological surface characteristics remain the primary determinant of interfacial sealing behavior.
(2) At the same reciprocating speed, the friction force between the inner and outer strokes of the reciprocating sealing system increases with the increase in the oil pressure. Under the same oil pressure, the frictional force between the inner and outer strokes of the reciprocating sealing system decreases as the reciprocating speed increases. Under the same oil pressure and reciprocating speed, the friction force of the outstroke of the reciprocating sealing system is greater than that of the instroke.
(3) At the same reciprocating speed, the minimum oil film thickness of the inner and outer strokes decreases as the oil pressure increases. At the same oil pressure, the minimum oil film thickness of the inner and outer strokes increases with the increase in the reciprocating speed. At the same reciprocating speed, the leakage of the inner and outer strokes of the reciprocating sealing system decreases with the increase in the oil pressure. When the oil pressure is the same, the leakage of the inner and outer strokes of the reciprocating sealing system increases with the increase in the reciprocating speed.
(4) The experimental friction forces under different reciprocating speeds and oil pressures agree well with the numerical predictions, which verifies the validity of the numerical method.

Author Contributions

Conceptualization, R.L.; methodology, R.L.; software, T.C.; validation, J.L., X.G., Y.L. and H.L.; formal analysis, F.L.; investigation, T.C.; resources, R.C.; data curation, T.C.; writing—original draft preparation, R.L.; writing—review and editing, H.L.; visualization, W.L.; supervision, W.W.; project administration, W.W.; funding acquisition, R.L. All authors have read and agreed to the published version of the manuscript.

Funding

This research was supported by the CCTEG Project (2023-TD-MS015, 2023-TD-QN004) and TMIC Project (2022TM-167M) in China.

Data Availability Statement

The original contributions presented in this study are included in the article. Further inquiries can be directed to the corresponding author.

Conflicts of Interest

Author Ran Li, Wenshu Wei, Rongming Chen, Jianfeng Li, Yuehua Lai, Hao Liu and Xiangyu Geng were employed by the company Beijing Tianma Intelligent Control Technology Co. The remaining authors declare that the research was conducted in the absence of any commercial or financial relationships that could be construed as potential conflicts of interest. The authors declare that this study received funding from CCTEG Project (2023-TD-MS015, 2023-TD-QN004) and the TMIC Project (2022TM-167M).

Abbreviations

The following abbreviations are used in this manuscript:
C10 C01 dMooney–Rivlin model coefficients
rcrank radius
λthe ratio of the connecting rod length L to the crank radius r
Lrod length
φtransmission angle
φxxpressure flow factor
φscxshear flow factor
Fhe cavitation index
Φfluid pressure of oil film/density function
PfDimensionless fluid pressure
HDimensionless oil film thickness
HTDimensionless true film thickness
Pccontact pressure
ƞ density of roughness
Eequivalent Young modulus
νPoisson’s ratio
Rroughness radius
σRMS roughness
Hsinitial film thickness
kdeformation coefficient matrix
Pscstatic contact pressure
τ c contact shear stress
τ v viscous shear stress
ϕf ϕfs ϕfpshear stress factors
pffilm fluid pressure
Ffreciprocating seal friction force
qLeakage rate
uDimensionless speed
μDynamic viscosity

References

  1. Müller, H.K.; Nau, B.S. Fluid Sealing Technology—Principles and Applications; China Machine Press: Beijing, China, 2002; pp. 27–29. [Google Scholar]
  2. Nau, B. An historical review of studies of polymeric seals in reciprocating hydraulic systems. Proc. Inst. Mech. Eng. Part J J. Eng. Tribol. 1999, 213, 215–226. [Google Scholar] [CrossRef]
  3. Nikas, G. Eighty years of research on hydraulic reciprocating seals: Review of tribological studies and related topics since the 1930s. Proc. Inst. Mech. Eng. Part J J. Eng. Tribol. 2010, 224, 1–23. [Google Scholar] [CrossRef]
  4. Miller, J.E. The Reciprocating Pump Theory Design and Use; Wiley: New York, NY, USA, 1987. [Google Scholar]
  5. Li, R.; Wei, W.; Liu, H.; Geng, X.; Wang, D.; Ye, J.; Chen, R.; Li, S.; Wang, W.; Wu, H.; et al. Tribological behavior of tribo-pairs in water hydraulic radial piston pumps. Proc. Inst. Mech. Eng. Part L J. Mater. Des. Appl. 2023, 237, 1603–1623. [Google Scholar] [CrossRef]
  6. Li, R.; Wei, W.; Liu, H.; Geng, X.; Cui, J.; Guo, Z.; Li, D.; Yu, T.; Wang, D.; Yuan, X.; et al. Design and experimental validation of a valve-distributed water radial piston pump. Proc. Inst. Mech. Eng. Part C J. Mech. Eng. Sci. 2024, 238, 5488–5497. [Google Scholar] [CrossRef]
  7. Li, Y.; Yu, L.; Jiang, H.; Zhao, E. Transient sealing characteristics of Glyd-ring in the high water-based piston pair under reciprocating pump conditions. Tribol. Int. 2024, 192, 109293. [Google Scholar] [CrossRef]
  8. Yang, H.L.; Li, X.; Sun, W.; Deng, F.; Du, J. Mixed EHL numerical analysis and leakage experiment of skeleton reciprocating oil seal. Ind. Lubr. Tribol. 2021, 73, 660–665. [Google Scholar] [CrossRef]
  9. Zhang, M.; Feng, Y. Numerical model of mixed lubrication and experimental study of reciprocating seal based on inverse lubrication theory. Lubricants 2022, 10, 153. [Google Scholar] [CrossRef]
  10. Kim, B.; Suh, J.; Lee, B.; Chun, Y.; Hong, G.; Park, J.; Yu, Y. Numerical analysis via mixed inverse hydrodynamic lubrication theory of reciprocating rubber seal considering the friction thermal effect. Appl. Sci. 2023, 13, 153. [Google Scholar] [CrossRef]
  11. Li, X.; Suo, S.; Guo, F.; Wu, C.; Jia, X. A study of reciprocating seals with a new mixed-lubrication model based on inverse lubrication theory. Lubr. Sci. 2018, 30, 126–136. [Google Scholar] [CrossRef]
  12. Li, R.; Wei, W.; Cao, T.; Chen, R.; Li, J.; Lai, Y.; Liu, H.; Geng, X.; Liu, F.; Li, W. Prediction of the Contact Behavior of Stepseals: Experimental and Numerical Investigations. Processes 2024, 12, 2212. [Google Scholar] [CrossRef]
  13. Li, R.; Wei, W.; Li, S.; Liu, Y.; Liu, H.; Wu, H.; Wang, W.; Ye, J.; Tian, C.; Wang, D.; et al. Fracture toughness testing and prediction for ceramic materials using in large-flow-rate emulsion pumps. Int. J. Mech. Eng. Appl. 2019, 7, 46–53. [Google Scholar] [CrossRef]
  14. IOS 7986-1997; Hydraulic Fluid Power—Sealing Devices—Standard Test Methods to Assess the Performance of Seals Used in oil Hydraulic Reciprocating Applications. ISO: Geneva, Switzerland, 1997.
  15. Li, R.; Hyde, T.; Sun, W.; Dogan, B. Modelling and data interpretation of small punch creep testing. In Proceedings of the ASME 2011 Pressure Vessels and Piping Conference, Baltimore, MD, USA, 17–21 July 2011; pp. 1119–1127. [Google Scholar]
  16. Hyde, T.; Stoyanov, M.; Sun, W.; Hyde, C.J. On the interpretation of results from small punch creep tests. J. Strain Anal. Eng. Des. 2010, 45, 141–164. [Google Scholar] [CrossRef]
  17. Nikas, G.K. Elastohydrodynamics and mechanics of rectangular elastomeric seals for reciprocating piston rods. J. Tribol. 2003, 125, 60–69. [Google Scholar] [CrossRef]
  18. Yang, B.; Salant, R.F. Numerical analysis compares the lubrication of U seal and step seal. Seal. Technol. 2009, 2009, 7–11. [Google Scholar] [CrossRef]
  19. Heipl, O.; Murrenhoff, H. Friction of hydraulic rod seals at high velocities. Tribol. Int. 2015, 85, 66–73. [Google Scholar] [CrossRef]
  20. Dowson, D.; Higginson, G. A numerical solution to the elasto-hydrodynamic problem. J. Mech. Eng. Sci. 1959, 1, 6–15. [Google Scholar] [CrossRef]
  21. Johannesson, H.L.; Kassfeldt, E. Calculation of the pressure distribution in an arbitrary elastomeric seal contact. Wear 1989, 130, 3–15. [Google Scholar] [CrossRef]
  22. Xiang, C.; Guo, F.; Jia, X.; Wang, Y.; Huang, X. Thermo-elastohydrodynamic mixed-lubrication model for reciprocating rod seals. Tribol. Int. 2019, 140, 105894. [Google Scholar] [CrossRef]
  23. Wang, J. Research on the Lubrication and SealingPerformance of Reciprocating Seals on Radial HydraulicPiston Pump with High Water-Based Liquid. Ph.D. Thesis, Taiyuan University of Technology, Taiyuan, China, 2020. [Google Scholar]
  24. Wang, B.Q.; Peng, X.D.; Meng, X.K. Simulation of the effects of non-Newtonian fluid on the behavior of a step hydraulic rod seal based on a power law fluid model. J. Zhejiang Univ. Sci. A 2018, 19, 824–842. [Google Scholar] [CrossRef]
  25. Zhang, X.; Wang, G.; Xia, P.; Li, H.P.; He, M. Finite element analysis and experimental study on contact pressure of hydraulic support bud-shaped composite sealing ring. Adv. Mech. Eng. 2016, 8, 1–9. [Google Scholar] [CrossRef]
  26. Ran, H.; Wang, S.; Liu, D. A multiscale wear model for reciprocating rod stepseal under mixed lubricating conditions based on linear elasticity. Proc. Inst. Mech. Eng. Part J J. Eng. Tribol. 2021, 235, 161–180. [Google Scholar] [CrossRef]
  27. Rivlin, R.S. Large elastic deformation of isotropic material-IV: Further developments of the general theory. Phil. Trans. R. Soc. A 1948, 241, 379–397. [Google Scholar]
  28. Miller, K. Testing Elastomers for Hyperelastic Material Models in Finite Element Analysis; UK and International Press: London, UK, 1999. [Google Scholar]
  29. Yang, B.; Salant, R. Elastohydrodynamic lubrication simulation of O-ring and U-cup hydraulic seals. Proc. Inst. Mech. Eng. Part J J. Eng. Tribol. 2011, 225, 603–610. [Google Scholar] [CrossRef]
  30. Dassault Systèmes. Abaqus 2022 Online Documentation. Available online: https://www.3ds.com/zh-hans/ (accessed on 20 April 2025).
  31. Liu, G.; Dai, K.; Lim, K.; Gu, Y. A point interpolation mesh free method for static and frequency analysis of two-dimensional piezoelectric structures. Comput. Mech. 2002, 29, 510–519. [Google Scholar] [CrossRef]
  32. Patir, N.; Cheng, H. Application of average flow model to lubrication between rough sliding surfaces. J. Lubr. Technol. 1979, 101, 220–229. [Google Scholar] [CrossRef]
  33. Thatte, A. Multi-Scale Multi-Physics Model and Hybrid Computational Framework for Predicting Dynamics of Hydraulic Rod Seals. Ph.D. Thesis, Georgia Institute of Technology, Atlanta, GA, USA, 2010. [Google Scholar]
  34. Huang, Y. Elastohydrodynamic Model of Hydraulic Rod Seals with Various Rod Surfaces. Ph.D. Thesis, Georgia Institute of Technology, Atlanta, GA, USA, 2014. [Google Scholar]
Figure 1. Sealing test device. (a) Schematic diagram of the experimental setup; (b) physical picture of the test device.
Processes 13 01717 g001
Figure 2. The variation of plunger speed and displacement: (a) The variation of plunger speed; (b) the variation of plunger displacement.
Processes 13 01717 g002
Figure 3. Inherent friction force.
Processes 13 01717 g003
Figure 4. The numerical algorithm of the single-stage steady-state mixed lubrication.
Processes 13 01717 g004
Figure 5. The von Mises static stress of the Stepseal under different working pressures.
Processes 13 01717 g005
Figure 6. The static contact pressure of the Stepseal under different working pressures.
Processes 13 01717 g006
Figure 7. The distribution of the static contact pressure, the roughness contact pressure, the fluid pressure, and the membrane thickness: (a) outer trip (plunger suction stage); (b) internal stroke (plunger discharge stage).
Processes 13 01717 g007
Figure 8. Oil film thickness distribution at different speeds: (a) outer trip (plunger suction stage); (b) internal stroke (plunger discharge stage).
Processes 13 01717 g008
Figure 9. The distribution of oil film thickness under different sealing pressures: (a) outer trip (plunger suction stage); (b) internal stroke (plunger discharge stage).
Processes 13 01717 g009
Figure 10. The performance law of sealing parameters at different reciprocating speeds: (a) The variation of frictional leakage with velocity; (b) the variation of frictional force with velocity.
Processes 13 01717 g010
Figure 11. The performance rules of sealing parameters at different sealing pressures: (a) The variation of frictional leakage with velocity; (b) the variation of frictional force with velocity.
Processes 13 01717 g011
Figure 12. Comparison between simulation and experiment: (a) Simulation result; (b) experimental result.
Processes 13 01717 g012
Table 1. The parameters of the test rig.
ParametersValueUnitPhysical Meaning
r70mmcrank radius
λ0.2Dimensionlessratio of the connecting rod length
L350Mmrod length
Φ±10°transmission angle
Table 2. Material constants of NBR.
ParametersValueUnitPhysical Meaning
C100.58544664MPaShear stiffness term
C011.18450931MPaStrain-stiffening term
d0.001MPa−1Volumetric penalty factor
Table 3. Material constants of PTFE.
ParametersValueUnitPhysical Meaning
E289GPaYoung’s modulus
μ0.46DimensionlessPoisson’s Ratio
Disclaimer/Publisher’s Note: The statements, opinions and data contained in all publications are solely those of the individual author(s) and contributor(s) and not of MDPI and/or the editor(s). MDPI and/or the editor(s) disclaim responsibility for any injury to people or property resulting from any ideas, methods, instructions or products referred to in the content.

