Abstract
In the operation period of long-distance water delivery tunnels, safety may be impacted by the risks that arise from different aspects including the complex geological conditions with fault fracture zones and karst caves, the diverse environment affecting structural safety and stability, and the construction defects of tunnels. It is crucial to assess and mitigate potential risks to ensure operation safety. To address this challenge, this study presents a systemic risk assessment for the operation safety of a real project of a water delivery tunnel. The potential risks of this project were first summarized based on the analytical hierarchy process (AHP), and a model that integrates the AHP and fuzzy comprehensive evaluation (FCE) was built to effectively quantify and categorize risks for the project in its operation stage. Results of the assessment indicate that the risk of this tunnel operation can be classified at a moderate grade with a calculted specific risk score of 43.935, with the high-risk factors including segment lining cracking, flow control, and regular maintenance. In response to the high-risk factors, the preventative and control measures are proposed to guide effective risk management. The model presented offers an efficient risk assessment tool for water delivery tunnels, aiding decision makers making more rational management decisions in complex and uncertain environments.
1. Introduction
Facing serious water shortages in the local regions of China, more and more long-distance water delivery projects for the efficient utilization and allocation of water resources have been constructed in recent years [1,2]. These projects not only play a crucial role in alleviating uneven water distribution but also introduce a series of new technical and management challenges [3,4,5]. In particular, the long-distance water delivery tunnels built using a tunneling boring machine (TBM) have been successfully passed through the complex and variable geological conditions such as fault fracture zones and karst caves. This brings the problems of segment assembly defects during construction [6,7], operational challenges such as water pressure [8], surrounding rock geology [9,10], and environmental conditions [11,12], which pose severe challenges to the safety and stability of the structure. Therefore, risk assessment during the construction and operational phases of tunnel projects is critical.
Risk assessment is a crucial systematic analysis method in engineering, and its importance has increased over time. This not only identifies and evaluates potential risk factors but also provides a scientific decision for optimizing engineering management [10,11,12,13,14]. Specifically, in hydraulic structures, scholars frequently utilize various methods, including the analytical hierarchy process (AHP) and fuzzy comprehensive evaluation (FCE), to assess project risks to prevent high-risk events and mitigate their potential hazards [15,16,17,18].
In the multilevel assessment of the structural health of the Shanghai subway tunnels during their operational phase, a tunnel health assessment method based on a multilevel evaluation system was proposed, providing a practical assessment framework for structural health monitoring [19]. The AHP was used to establish a risk factor evaluation index system with geology, mechanics, and operations as influencing factors during tunnel excavation. This system quantitatively assesses the risks associated with the formation of a shield tunneling face, enhances the understanding of risk factors, and proposes corresponding preventive measures [20]. To explore the operational risks of the water lifting, water transmission, and water storage systems in the Eastern Route Project of the South-to-North Water Diversion, the AHP was employed to categorize and rank the operational risks of these three systems [21]. Using fuzzy mathematics theory and expert evaluation methods [22], the tunnels were assessed for risk grades, and the results were highly consistent with experimental comparisons. The improved fuzzy analytical hierarchy process was used to predict risks related to tunnel structure safety, enhancing the consistency of expert judgments and promoting its application in more complex systems [23,24]. The baseline weights of dynamic risk assessment indicators in engineering were also built using the AHP combined with the adjustment based on monitoring data. A fuzzy evaluation matrix for construction risk membership degrees was obtained using the FCE, and segmental value assignment was applied to analyze the results [25]. The system reliability analysis in geotechnical engineering for the unsaturated soil nailing wall systems using random finite element methods and the slope system based on sequential compounding methods further highlight the importance and applicability of system-level risk models in complex engineering environments [26,27]. Although scholars have achieved the objective of risk evaluation using the AHP, FCE, or in combination with other methods, these singular approaches often fail to fully address the uncertainties and multidimensional risk factors present in complex systems.
Therefore, a risk management model for tunnels was established by integrating the AHP with fuzzy set theory, which effectively determined the priority of identified hazardous areas and provided the optimal countermeasures [28]. To reduce the risks associated with the construction of shield tunnels in karst strata, a risk assessment framework for first-level indicators, including karst geological conditions, hydrogeological conditions, tunnel design, and shield construction, was developed using a cloud model and the fuzzy AHP [29]. To optimize risk-grading standards in tunnel engineering, a new risk evaluation framework was proposed combing the MIVES multi-criteria decision-making method with the AHP [30]. To enhance the safety of tunnel construction, a hybrid dynamic risk assessment method combining the AHP with a trapezoidal cloud model (TCM) and Bayesian network (BN) was developed [31]. Additionally, fuzzy DEMATEL and AHP methods have been used to analyze geological risks in tunnel projects [32]. To optimize the management of hydrogeological burst hazards in tunnels, the weights calculated by the AHP combined with fuzzy decision methods were used to rank management strategies [33]. Furthermore, a risk assessment model that integrates the AHP with catastrophe theory was established to improve the prediction of extreme disasters [34]. To enhance the precision and adaptability of assessments, the existing AHP model was improved by incorporating fuzzy theory for more flexible risk forecasting [35]. By combining the fuzzy AHP with set pair analysis, a comprehensive risk assessment model for long highway operational tunnels was created that merges subjective weighting with objective evaluations, thereby improving the accuracy of risk assessments in long highway operational tunnels [36]. These evaluations effectively anticipate and control issues such as lining structure damage and water leakage, ensuring the safe operation of tunnels and the long-term stability of projects [37]. However, existing approaches still have certain limitations when dealing with complex uncertainties, making it challenging to simultaneously account for both the hierarchical weighting of risk factors and the impact of fuzziness. Therefore, further optimization of risk assessment models to enhance their accuracy and adaptability during the construction and operation phases remains a critical area for in-depth research.
In view of the backdrops, this study introduces the AHP-FCE risk assessment model that integrates the AHP and FCE to be a comprehensive evaluation method for the safety evaluation of a water delivery tunnel operation. The AHP method establishes a multilevel analytical structure, decomposes complex decision-making problems into various components, and assigns weights to these components through pairwise comparisons, facilitating the quantification of subjective judgments in the decision-making process. In contrast, the FCE method utilizes fuzzy mathematics to handle and analyze data characterized by uncertainty or ambiguity, allowing risk assessment to more comprehensively reflect the complexity and uncertainty of real situations. By combining these two methods, it is possible to establish a hierarchical structure of risk factor weights and mitigate the adverse effects of fuzzy judgments on the results. This makes it so that the risks can be identified and assessed more accurately, and targeted strategies and measures for risk prevention and treatment can be determined, thereby significantly enhancing the safety and stability of hydraulic tunnel projects.
2. Project Overview
2.1. General Discription
The water delivery tunnel of the West Route for Anyang City is a diversion of the South-to-North Water Diversion Project, which runs across hilly terrain with a total length of 13.18 km. The project includes several sections, including the TBM excavation tunnel, TBM launch, TBM exit, and tunnel outlet sections, as shown in Figure 1, for the overall layout of the tunnel. Among them, the TBM excavation section has a total length of 11.82 km with a gradient of 0.01%. The tunnel cross-section is circular with an excavation diameter of 4.33 m and a designed cross-sectional diameter of 3.5 m. Each ring was constructed using four hexagonal honeycomb segments, each 0.3 m thick, arranged in a staggered seam pattern [6,7]. The gaps between the segments and the surrounding rock were filled with pea-gravel grouting, and unpressurized gravity water flow was delivered inside the tunnel.
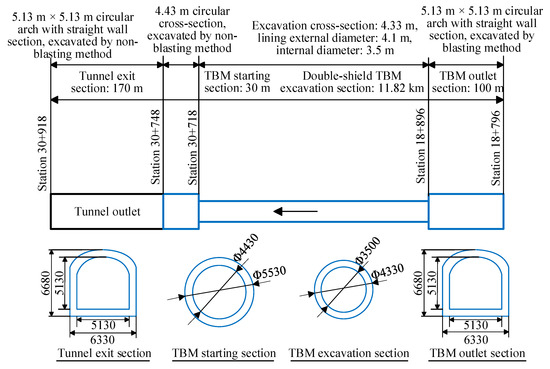
Figure 1.
General layout of the tunnel.
The main section of the tunnel is characterized by a low mountain terrain with a ground elevation ranging from 245.6 m to 409.42 m and a topography rising gradually from east to west and peaking in the central region. Valleys exist at the surface of 13 locations along the tunnel alignment. The remaining areas are mountainous, with the ground elevation for the drilling and blasting construction section ranging from 245.6 m to 298.9 m; for the TBM excavation section, the elevation ranges from 272.45 m to 409.42 m. The surface rocks are primarily limestone, with a quaternary covering layer found in specific areas, such as valleys and gentle slopes.
2.2. Geological Conditions
2.2.1. Engineering Geology
There are 16 fault fracture zones within the TBM excavation alignment. These zones are characterized by fractured surrounding rocks with poor stability, which are unfavorable for shield tunneling. Additionally, the potential presence of both upper and lower karst caves along the tunnel alignment has a significant impact on TBM excavation. According to the specification of China code GB 50487 for the hydrogeological classification of rock mass used in tunnel engineering [38], 61.11% of the total length of the surrounding rock categories belongs to the III class, which is mostly intact mass with relatively hard rocks or interbedded soft and hard rocks; 24.46% belongs to IV-class rock, which is mostly intact to fragmented mass with relatively soft rocks or interbedded soft and hard rocks; and 13.98% belongs to V-class rock, which is fragmented mass with relatively soft rocks. The statistics for the surrounding rock classification and geological conditions for the TBM shield tunneling section are summarized in Table 1.

Table 1.
Statistical results of the grades of surrounding rock for the tunnel.
2.2.2. Hydrogeology
Along the tunnel alignment, groundwater mainly exists in the form of fissured aquifers within the bedrock and water stored in bedrock fractures. Based on on-site engineering investigations and nearby well surveys, the results show that the groundwater level along the tunnel alignment ranges from 100 m to 150 m in elevation, lying below the tunnel alignment. It primarily resides in the weathered zone of the rock mass and has relatively low water content.
There are several valleys along the surface, some of which have shallow burial depths and may experience surface water infiltration, as well as water from the upper fissures. This can lead to dripping or seepage during tunnel construction and operation. Additionally, owing to the typically fractured nature of hard-rock formations, there is a possibility of significant water inflow when surface water accumulates in the valleys during the rainy season.
2.3. Risk Factor System Set
The risk evaluation indicators for this project were determined using a risk checklist and expert surveys. These indicators are then grouped into a set of factors affecting the overall evaluation object, denoted as U = {u1, u2, u3, …, un}. The subset u1 = {u11, u12, u13, …, u1m} represents m factors under the influence of n factors, which are the secondary indicators, and so on for other levels. In the FCE method, the factors at each level correspond to the indicators at each AHP level. Using the AHP, the various indicators affecting the evaluation object are combined and ranked to form a hierarchical system, transforming subjective analysis into comparable indicators that allow for scientific computation of their respective weights [39].
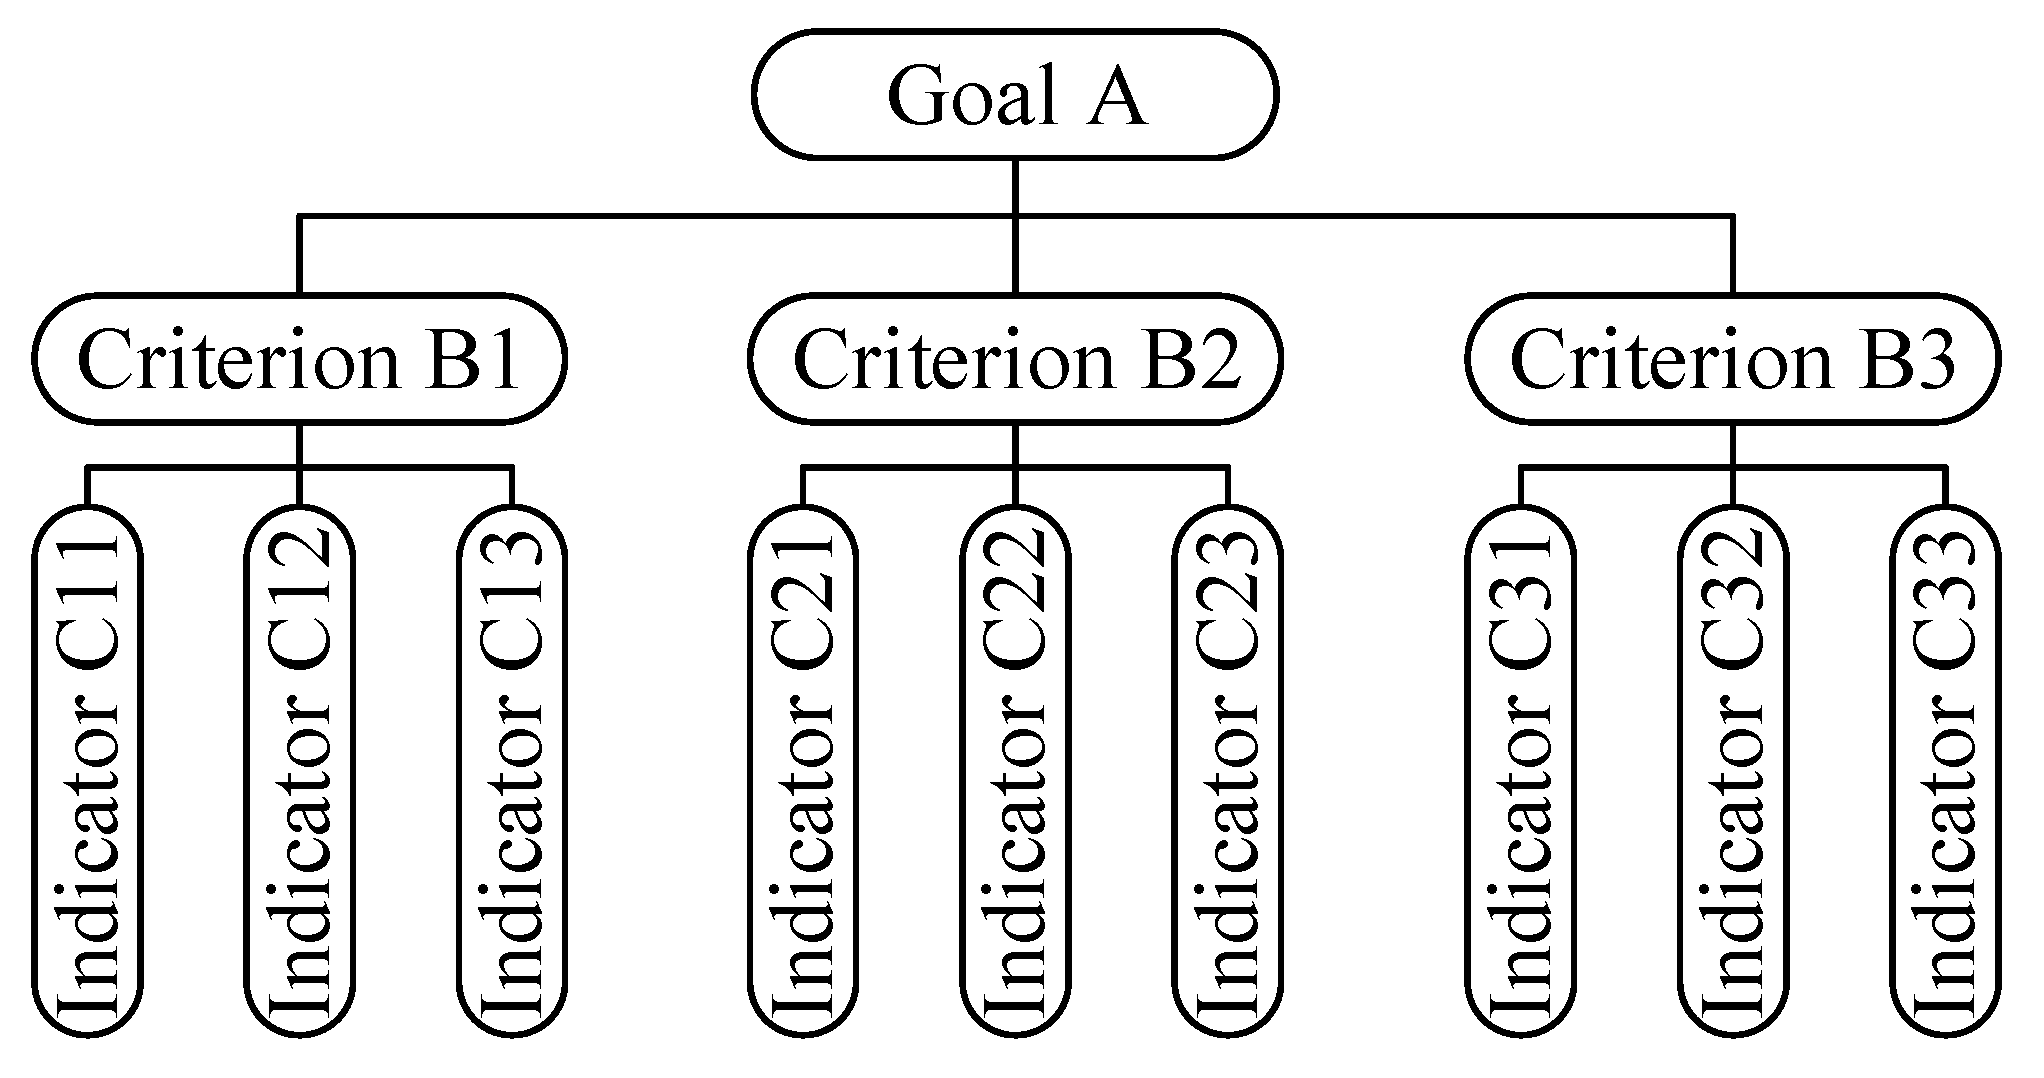
When the AHP is used to address decision-making problems, an indicator system should be established based on the actual situation of the problem. A structural model for the AHP should be constructed that consists of the goal, criteria, and indicator layers [40], as shown in Figure 2.
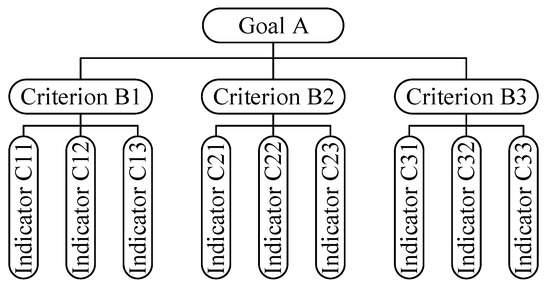
Figure 2.
AHP model hierarchy diagram.
3. AHP-FCE Risk Assessment Model
3.1. Evaluation Comment Set
The evaluation comment set was created by assigning a level of importance to each indicator and ultimately selecting the ideal outcome. The evaluation comment set is denoted as V = {v1, v2, v3, …, vn}, where n represents the number of evaluation levels.
In this study, based on existing research [41,42,43] and the specific tunnel project, the risk levels for the water delivery tunnel are categorized as level I (very low), level II (low), level III (moderate), level IV (high), and level V (very high). The risk acceptance criteria are presented in Table 2.
Table 2.
Risk acceptance criteria.
Engineering risk assessment involves analyzing the risk sources that affect the project and determining their impact. The risk levels were categorized into the above five levels. Therefore, the evaluation comment set for risk is V = {very high, high, moderate, low, very low}, with corresponding grade indicators of 95, 75, 55, 35, and 15, respectively. The risk-level classifications are presented in Table 3.
Table 3.
Risk level grading scale.
3.2. Fuzzy Relationship Matrix
After establishing the factor set U and evaluation comment set V, the fuzzy matrix R is constructed by assessing the degree of membership of the evaluated target in the evaluation subset from the perspective of individual factors. Specifically, the membership degree of the U to the j-th element in the evaluation comment set V is denoted as Rij. The fuzzy set is
By conducting a comprehensive analysis of m elements, an m × n matrix R is obtained, which is the following fuzzy relationship matrix:
3.3. Weights of Evaluation Factor Set
3.3.1. Judgment Matrix
Based on the established hierarchical structural model, judgment matrices were constructed for the criteria and indicator layers through pairwise comparisons. During the factor comparison, the experts assigned scores on a scale of 1–9. The evaluation scales are presented in Table 4.
Table 4.
Evaluation scale of analytic hierarchy process.
The comparison scale aij obtained through calculations represents the elements of the judgment matrix for this level of indicators. aij is the element value in the i-th row and j-th column of the matrix. The matrix structure is as follows:
In which > 0, = 1/aji, = 1.
3.3.2. Indicator Weights
The weights of the indicator factors are determined by calculating the eigenvector of the judgment matrix. The eigenvector is calculated using the summation method.
- Normalization of matrix elements
The elements of the judgment matrix were normalized using the following formula:
Each element of the judgment matrix is normalized to obtain , which leads to the normalized judgment matrix .
- 2.
- Calculating the weight vector of the normalized matrix
The average value of the elements in each row of the normalized matrix is calculated to obtain the weight vector wi, with the formula as follows:
3.3.3. Maximum Eigenvalue of Judgment Matrix
Using the judgment matrix A and the normalized matrix weight vector wi, the maximum eigenvalue of the judgment matrix is calculated using the following formula:
3.3.4. Consistency Check
Based on the maximum eigenvalue and the order of the judgment matrix n, the consistency index CI of the judgment matrix is calculated using the following formula:
The consistency ratio CR of the judgment matrix A is calculated as follows:
where RI is the average random consistency index, which can be found from Table 5 based on the order of the judgment matrix.
Table 5.
Values of average random consistency indicators.
Based on the calculation, if CR < 0.1, the judgment matrix A satisfies the consistency requirement. Otherwise, it does not satisfy the consistency requirement.
3.3.5. Calculating the Overall Weights
Based on the results of the above calculations of the judgment matrix A, the corresponding normalized matrix weight vector , and the maximum eigenvalue = 3.0092, CI = 0.0046, CR = 0.0088, the overall weight of each indicator in the indicator layer can be obtained by multiplying the calculated weight of each criterion layer indicator by the corresponding indicator layer weight.
3.4. Fuzzy Comprehensive Evaluation
3.4.1. Result Vector
Based on the AHP discussed above, the weight vector W = (w1, w2, w3, …, wn) can be determined. Combining this with the fuzzy relationship matrix R, which is obtained through expert scoring and calculations using the FCE method, the operation between the weight vector W and the fuzzy relationship matrix R is denoted as B.
After completing the operation between the weight vector W and the fuzzy relationship matrix R, the fuzzy comprehensive evaluation result vector is obtained. The fuzzy membership degree must be determined before performing the FCE calculation. There are four common rules for calculating fuzzy membership degrees, namely M(∧, ∨), M(•, ∨), M(∨, ⊕), and M(•, ⊕) models. In this case, the fourth calculation rule was used.
3.4.2. Analysis of the Result Vector
From the previous step, the evaluation result vector B was obtained. If the content generated by B is applied to the entire evaluation level process, the parameter column vector Vj corresponding to each level must be set as follows:
This allows for the determination of the evaluation results for the level parameters as follows:
P reflects the inductive information provided by the fuzzy subset B and the level parameter vector C.
Therefore, by combining the previously established risk-level classifications and acceptance criteria, the result vector, risk score, and risk level in the risk evaluation results can be calculated.
4. Risk Assessment for Tunnel Operation
4.1. Operation Risk Factor System Set
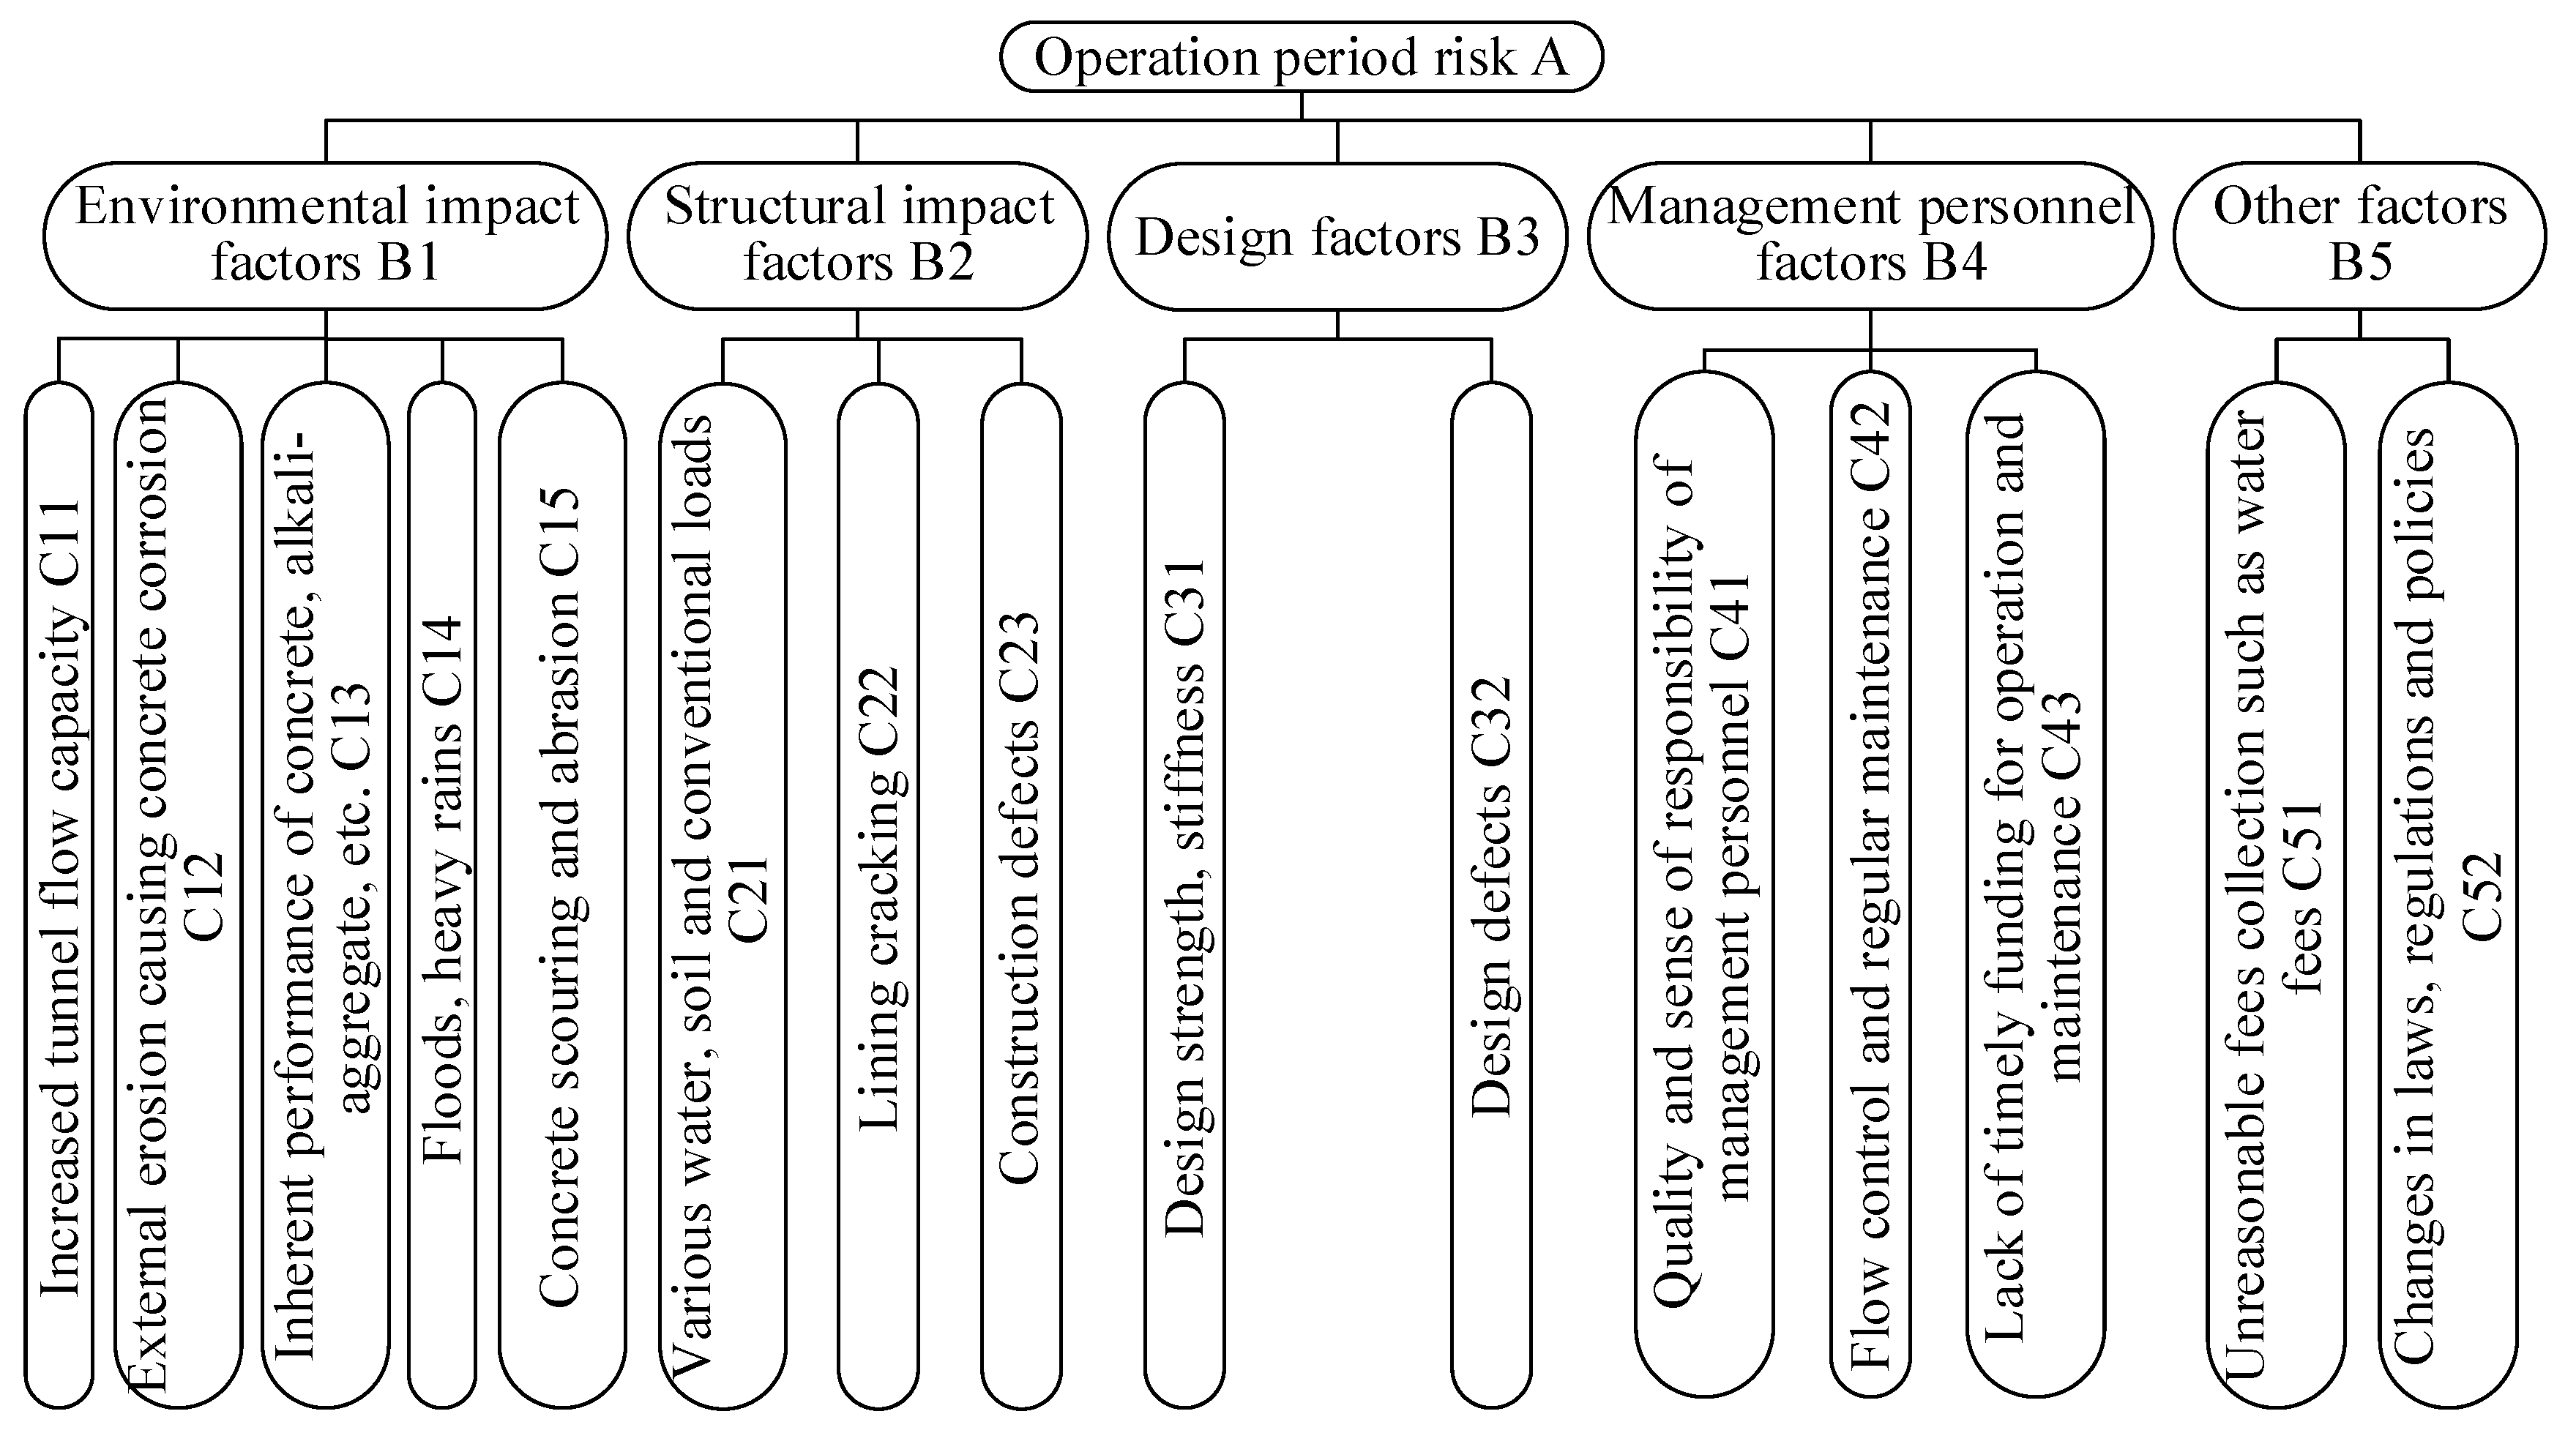
Based on the project engineering data and operation risks identified through the risk checklist method and expert surveys, this section selects five first-level risks and fifteen second-level risks in the operation risk category as the main influencing factors for the AHP analysis of the tunnel operation. The hierarchical structural model is illustrated in Figure 3, which means that the operation period risk A is determined by the weighted fuzzy comprehensive evaluation for B-level indicators in a parallel configuration, and the second-level risk indicators (C-level) under each B-level indicator are considered in a series configuration. This series-parallel structure reflects both the dependency within subsystems and the aggregated impact at the system level.
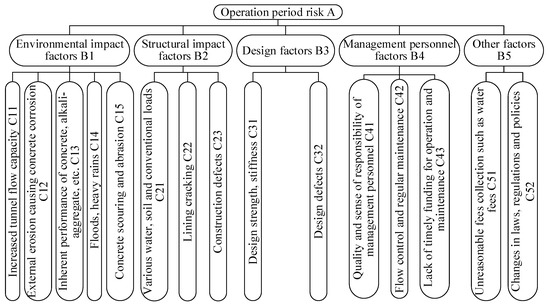
Figure 3.
Hierarchical structure model of risk analysis in tunnel operation period.
4.2. Evaluation Comment Set and Judgment Matrix
To ensure objectivity and accuracy, experts and management personnel from five units involved in the project, including survey, design, supervision, construction and operation, were selected, totaling 10 individuals. The experts were surveyed using questionnaires to collect evaluation scores for the second-level risk indicators of tunnel operation risks. The survey participants were all personnel directly involved in the tunnel project, each possessing solid professional expertise and industry experience.
As mentioned in Section 3.1, the safety levels were divided into five categories that are represented by the evaluation comment set V = {very high, high, moderate, low, very low}. After collecting the questionnaires, the results were organized and analyzed, yielding the evaluation results for the second-level risk indicators with the average score and standard deviation, as shown in Table 6. Subsequently, the comprehensive evaluation method was used to assess the factors affecting the risks.
Table 6.
Expert scores for risk factors in the operational period.
The established second-level risk indicators were 15 in total. Based on this, the fuzzy judgment matrix Ri for the criteria layer is calculated as follows:
The fuzzy judgment matrix for environmental impact factor B1 is
The fuzzy judgment matrix for structural impact factor B2 is
The fuzzy judgment matrix for design factor B3 is
The fuzzy judgment matrix for management personnel factor B4 is
The fuzzy judgment matrix for other factors B5 is
4.3. Weights of Evaluation Factor Set for the Tunnel
Based on the scoring performed by the 10 experts using the 1–9 scale method for the risk factors during tunnel operation, the weight values for each risk indicator were calculated. After organizing the data, the relative importance of each indicator at the criteria and indicator layers was determined using Formula (4) to obtain the normalized judgment matrix, and Formula (5) was used to obtain the weight vector Wi; the results are summarized in Table 7. For instance, the normalized matrix yields a row average of 0.1107 for B1, which corresponds to W1 = 0.1107.
Table 7.
A standard layer weight calculation.
It is noteworthy that the relative importance values in the B-level matrix were derived from expert consensus. For example, B1 was rated 2.0 times more important than B5, reflecting the belief that environmental conditions such as erosion and material degradation have a greater influence on tunnel operational risk than uncertainly external factors like policy changes. However, due to the matrix normalization and the influence of all pairwise comparisons, the final weight of B1 is only slightly higher than that of B5 after the calculations using Formulas (4) and (5). This demonstrates that the “2.0” input does not directly produce a double weight, which only contributes proportionally within a multi-criteria system.
For the B1 indicator layer, the weight calculation and consistency check are shown in Table 8. The maximum eigenvalue = 5.1301, and the eigenvector is W1 = (0.1360, 0.2571, 0.3404, 0.0865, 0.1801). After performing the consistency check, CI = 0.0325 and CR = 0.0290 < 0.1, indicating that the calculation results met the required consistency. Finally, using Table 8, Table 9, Table 10, Table 11 and Table 12, the weights of the various indicator factors were determined, and the statistical results of the indicator factor weights are presented in Table 13.
Table 8.
Weight calculation for B1 indicator layer.
Table 9.
Weight calculation for B2 indicator layer.
Table 10.
Weight calculation for B3 indicator layer.
Table 11.
Weight calculation for B4 indicator layer.
Table 12.
Weight calculation for B5 indicator layer.
Table 13.
Weight of risk assessment indicators in tunnel operation period.
From Table 13, it can be seen that the risks with the greatest impact on risk management relates to lining cracking (C22, 0.2030), flow control and regular maintenance (C42, 0.1646), construction defects (C23, 0.1162), design defects (C32, 0.1155), and delayed operation and maintenance funding (C43, 0.0628). These factors should be prioritized in risk management.
4.4. Fuzzy Comprehensive Evaluation of the Tunnel
4.4.1. Risk Assessment of the Criteria Layer Factors
Using Formula (9), the evaluation result vector is calculated as follows:
From Table 14, which shows the evaluation results of criterion layer factors, the environmental impact factors and the design factors are evaluated as minor risks, while the structural impact factors and the management personnel factors are moderate risks and the other factors are a minor risk.
Table 14.
Evaluation results of criterion layer factors in tunnel operation period.
4.4.2. Fuzzy Comprehensive Evaluation of Goal Layer
Similarly, the fuzzy comprehensive evaluation matrix for the goal layer is
Based on the FCE result vector, the calculated risk score for the tunnel operation was 43.935, with the evaluation result being Level 3, that is, moderate risk. This indicates that the tunnel can be operated under normal conditions, although certain risk factors such as segment lining cracking and inadequate flow control and maintenance may raise a tangible threat to operation. However, if not properly resolved in time, in the long term, a potential cumulative vulnerability of a moderate risk level could gradually lead to structural degradation or functional impairment. Therefore, appropriate measures should be taken to treat these risks.
4.5. Risk Treatment Measures
Through analysis and calculation, the final evaluation result of the operational risk for the water delivery tunnel of the West Route Project for Anyang City is moderate risk. The structural impact factors and management personnel factors were both evaluated as moderate risk. From the evaluation process and results, it is evident that significant risks exist in lining cracking, flow control, and regular maintenance. It can be observed that the higher risk factors in the operation phase are likely to lead to tunnel leakage. Therefore, it is essential to manage and prevent these risks.
- (1)
- Lining cracking
Lining cracking can lead to tunnel water leakage, which not only results in water supply loss but also adversely affects the foundation support structure. Since such defects are difficult to detect and address once the tunnel is operational, preventive measures should be implemented before the tunnel becomes operational after construction. The treatment of cracks depends on their width and can be classified into surface treatment, low-pressure grouting, and filling methods. If the crack width is less than 0.2 mm, only surface treatment is required. If the crack width is between 0.2 mm and 0.3 mm, surface treatment and grouting treatment are both necessary. When the crack is wider than 0.3 mm, a filling method should be applied.
- (2)
- Flow control and regular maintenance
After the tunnel is put into operation, flow control and regular maintenance impact the proper stress distribution of the segment rings and the timely handling and repair of severe internal issues. These are critical for ensuring the normal operation of the tunnel and water conveyance capacity. Therefore, during the operation, it is important to strengthen the standardized training of operators, strictly control the amount of water flow inside the tunnel, ensure that regular maintenance is performed quickly and properly to resolve issues, and ensure the safe water supply capacity of the tunnel.
5. Conclusions
Based on the results of this study, the following conclusions can be drawn:
- A detailed risk assessment of a water delivery tunnel in its operational phase was performed using an integrated fuzzy hierarchical analysis model. The risk weights of each risk factor are determined, and the risk levels and grades for the goal and criterion layers are calculated.
- For the tunnel of a real project, the operation risk score is 43.935, which indicates a moderate risk level at Level 3. This shows that under current normal operation, the potential risks do not cause an immediate danger but pose a possible threat to long-term operation. Based on the subsystem risk analysis, structural impact factors and management personnel factors are in the moderate-risk category. This provides targets for taking appropriate strategic maintenance to prevent the risk from escalating to a higher and intolerable level.
- The higher-risk factors in the tunnel operation are segment lining cracking, flow control, and regular maintenance. Segment lining cracking may result in water leakage, while flow control and regular maintenance are important to keep the tunnel in a good state of operation. This provides a target of prevention for the pretreatment of these adverse risks.
- The model proposed in this study can be extended to other tunnels or infrastructures for systemic risk analysis, especially when dealing with multidimensional uncertainty. Future studies can incorporate real-time monitoring data and dynamic Bayesian inference to enhance adaptability.
Author Contributions
Conceptualization and methodology, C.L. and S.Z.; validation and formal analysis, P.S. and X.W.; resource and data curation, Y.H. and Q.C.; writing—original draft preparation, X.W. and P.S.; writing—review and editing, C.L. and Y.H.; supervision, S.Z.; project administration, Q.C.; funding acquisition, S.Z. All authors have read and agreed to the published version of the manuscript.
Funding
This research was funded by the Fund for First-Class Discipline Innovation Team of Henan, China (grant no. CXTDPY-6).
Data Availability Statement
The original contributions presented in this study are included in the article. Further inquiries can be directed to the corresponding authors.
Conflicts of Interest
Authors Yintao He and Qixing Che were employed by the Zhongzhou Water Supply Holding Company Limited. The remaining authors declare that the research was conducted in the absence of any commercial or financial relationships that could be construed as a potential conflict of interest.
References
- Chen, Z.; Chen, Y.; Xue, G.; Yao, G.; Zhang, Y.; Zhao, S. Research on the layout form-finding and positioning technique of prestressed strands in prestress concrete lining for water conveyance tunnel. J. North China Univ. Water Resour. Electr. Power 2022, 43, 6–12. [Google Scholar]
- Dong, P.; Li, C.; Wang, Z.; Liu, B.; Liu, S.; Ma, Q. Seepage-stress coupled simulation of shield tunnelling of the Hanjiang to Weihe river valley water diversion project phase II under high groundwater level. J. Water Resour. Water. Eng. 2022, 33, 202–209. [Google Scholar]
- Zhang, Z.; Wang, B.; Wang, X.; He, Y.; Wang, H.; Zhao, S. Safety risk assessment of TBM tunnel construction based on fuzzy evidence reasoning. Processes 2022, 10, 2597. [Google Scholar] [CrossRef]
- Han, T.; Huang, F.; Zheng, J.; Zhu, J.; Lin, T. Reinforcement construction and monitoring analysis of arch springing collapse of tunnel. Chin. J. Rock Mech. Eng. 2011, 30, 3443–3449. [Google Scholar]
- Yao, Z.; Xiong, Y.; Fu, L.; Quan, Y.; Niu, W.; Hu, L. Failure mechanism and support technology of surrounding rocks in lithologic interface area of deep-buried tunnel bored by tunnel boring machine. Tunn. Constr. 2023, 43, 102–111. [Google Scholar]
- Li, F.; Si, P.; He, Y.; Wang, H.; Zhang, Z.; Zhao, S. Numerical analysis of the single-directionally misaligned segment behavior of hydraulic TBM tunnel. Buildings 2024, 14, 2198. [Google Scholar] [CrossRef]
- Li, F.; Si, P.; He, Y.; Wang, H.; Zhang, Z. Case studies of the load-bearing performance of shield tunnel segment with misaligned defects. Sci. Rep. 2024, 14, 17370. [Google Scholar] [CrossRef]
- Xie, J.; Huang, X.; Jin, G.; Zhang, Z. Seepage characteristics and mechanical response of shield tunnels under localized leakage and exosmosis. Rock Soil Mech. 2023, 44, 202–209. [Google Scholar]
- Si, Z.; Huo, X.; Xin, L. Influence of surrounding rock temperature on the temperature and temperature stress of concrete lining in water conveyance tunnels. J. Water Resour. Water. Eng. 2021, 32, 151–157. [Google Scholar]
- Wang, H.; Gong, L.; Kang, C.; Yang, Y.; Wang, Z. Numerical simulation of drift ice impact on the water diversion tunnels in cold regions. J. Water Resour. Water. Eng. 2020, 31, 90–97. [Google Scholar]
- Lu, A.; Xiao, H.; Shen, X.; Fu, Y. Design and construction technology of slurry shield used in Shiziyang water conveyance tunnel. Mod. Tunn. Technol. 2020, 57, 226–237. [Google Scholar]
- Huang, X.; Li, B.; Wang, X.; Wu, S.; Wang, R. Risk assessment of metro tunnel shield construction on adjacent buildings and structures. Highway 2023, 68, 350–357. [Google Scholar]
- Zhang, J.; Wen, T.; Zheng, W. Editorial on the research topic: Investigation, monitoring, stability and risk assessment of geohazards. Front. Earth Sci. 2025, 13, 1552845. [Google Scholar]
- Dong, F.; Wang, S.; Yang, Y.; Ren, M.; Demisa, M.; Zhang, R. Research on dynamic fuzzy prediction method for surrounding rock stability of mountain tunnels throughout the construction period. Tunn. Undergr. Space Technol. 2025, 158, 106390. [Google Scholar] [CrossRef]
- Li, D.; Li, J.; Zhang, L.; Tang, X. Research status and prospect of risk control of hazards in hydraulic geotechnical engineering. Sci. Found. Chin. 2023, 37, 1027–1038. [Google Scholar]
- Liu, K.; Liu, S.; Chen, Y.; Ma, F.; Wang, H.; Xie, H. Dynamic bayesian network model for the safety risk evaluation of a diversion tunnel structure. J. Tsinghua Univ. (Sci. Tech.) 2023, 63, 1041–1049. [Google Scholar]
- Wang, F.; Zheng, S.; Zhu, X. Safety and health evaluation hydraulic steel gate based on game TOPSIS. Water Resour. Power 2021, 39, 199–202. [Google Scholar]
- Wang, L.; Wang, R.; Zhao, R. Study on comprehensive evaluation and judgment of shield tunneling safety risk in hydraulic engineering. Yellow River 2021, 43, 142–148. [Google Scholar]
- Sun, M. Multi-level evaluation method for metro tunnel structural health and engineering application. Urban Mass Transit 2021, 24, 1–6. [Google Scholar]
- Ding, X.; Xie, A.; Yang, H.; Li, S. Quantifying multifactor effects on mud cake formation risk for a tunnel boring machine with the analytical hierarchy process. Buildings 2023, 13, 355. [Google Scholar] [CrossRef]
- Geng, L.; Liu, H.; Jiang, B.; Li, A.; Song, X. Operating risk analysis on the east route of South North Water Diversion Project. Hydro-Sci. Eng. 2010, 1, 16–22. [Google Scholar]
- Chu, H.; Xu, G.; Yasufuku, N.; Yu, Z.; Liu, P.; Wang, J. Risk assessment of water inrush in karst tunnels based on two-class fuzzy comprehensive evaluation method. Arab. J. Geosci. 2017, 10, 179. [Google Scholar] [CrossRef]
- Liu, K.; Chen, Y.; Wang, H.; Xie, H.; Liu, Z. Reducing inconsistencies of FAHP in structural safety assessment of diversion tunnels. Appl. Soft Comput. 2023, 146, 110642. [Google Scholar] [CrossRef]
- Pi, Y.; Sun, Z.; Lu, Y.; Xu, J. A novel model for risk prediction of water inrush and its application in a tunnel in Xinjiang, China. Front. Earth Sci. 2024, 12, 1404133. [Google Scholar] [CrossRef]
- Wang, J.; Cao, A.; Wu, Z.; Sun, Z.; Lin, X.; Sun, L.; Liu, W.; Liu, X.; Li, H.; Sun, Y.; et al. Dynamic risk assessment of ultra-shallow-buried and large-span double-arch tunnel construction. Appl. Sci. 2021, 11, 11721. [Google Scholar] [CrossRef]
- Khosravi-Hajivand, A.; Johari, A. Unsaturated soil nailing wall system reliability analysis using random finite element. Comput. Geotech. 2024, 173, 106554. [Google Scholar] [CrossRef]
- Johari, A.; Rahmati, H. System reliability analysis of slopes based on the method of slices using sequential compounding method. Comput. Geotech. 2019, 114, 103116. [Google Scholar] [CrossRef]
- Kwon, K.; Kang, M.; Kim, D.; Choi, H. Prioritization of hazardous zones using an advanced risk management model combining the analytic hierarchy process and fuzzy set theory. Sustainability 2023, 15, 12018. [Google Scholar] [CrossRef]
- Meng, G.; Ye, Y.; Wu, B.; Luo, G. Risk assessment of shield tunnel construction in karst strata based on fuzzy analytic hierarchy process and cloud model. Shock Vib. 2021, 2021, 7237136. [Google Scholar] [CrossRef]
- David, B.; Francesc, P.; Ana, B.; Antonio, A.; Pablo, P. A systematic review on MIVES: A sustainability-oriented multi-criteria decision-making method. Build. Environ. 2022, 223, 109515. [Google Scholar]
- Chen, H.; Shen, G.; Feng, Z.; Yang, S. Safety risk assessment of shield tunneling under existing tunnels: A hybrid trapezoidal cloud model and Bayesian network approach. Tunn. Undergr. Space Technol. 2024, 152, 105936. [Google Scholar] [CrossRef]
- Yang, Z.; Hua, S.; Ning, T.; Juan, B.; Han, X. Risk assessment for geological exploration projects based on the Fuzzy-DEMATEL method. Int. J. Adv. Comput. Sci. Appl. 2024, 15, 151278. [Google Scholar] [CrossRef]
- Wen, Z.; Xiong, Z.; Lu, H.; Xia, Y. Optimisation of treatment scheme for water inrush disaster in tunnels based on fuzzy multi-criteria decision-making in an uncertain environment. Arab. J. Sci. Eng. 2019, 44, 8249–8263. [Google Scholar] [CrossRef]
- Zhu, J.; Li, T. Catastrophe theory-based risk evaluation model for water and mud inrush and its application in karst tunnels. J. Cent. South Univ. 2020, 27, 1587–1598. [Google Scholar] [CrossRef]
- Jiang, P.; Liao, Q.; Li, J.; Wu, F.; Chen, Y.; Ji, X. Fuzzy attribute interval modeling for risk evaluation of water inrush in deep and long tunnels and engineering applications. Pol. J. Environ. Stud. 2024, 34, 1581–1591. [Google Scholar] [CrossRef]
- Zhao, Y.; Qiu, R.; Chen, M.; Xiao, S. Research on operational safety risk assessment method for long and large highway tunnels based on FAHP and SPA. Appl. Sci. 2023, 13, 9151. [Google Scholar] [CrossRef]
- Wang, Z.; Li, B. Stability analysis of slope and diversion water tunnel of hydropower station under strong earthquake. Geotech. Geol. Eng. 2021, 39, 2041–2049. [Google Scholar] [CrossRef]
- GB 50487-2008; Code for Engineering Geological Investigation of Water Resources and Hydropower. China Plan Press: Beijing, China, 2008.
- Mao, J. The improvement and empirical research of the methods of constructing rural revitalization evaluation index system. J. Lanzhou Univ. Soc. Sci. 2021, 49, 47–58. [Google Scholar]
- Tang, D. Research on the route selection of high-speed railway based on analytic hierarchy process. J. Railw. Eng. Soc. 2022, 39, 14–18. [Google Scholar]
- Wang, Y.; Li, J.; Zhou, Y. Risk assessment of tunnel water inrush and burst mud by AHP-fuzzy. Chin. J. Undergr. Space Eng. 2021, 17, 1257–1263. [Google Scholar]
- Liu, J.; Zhao, Y.; Lv, G.; Liu, S.; Liu, C. Research on risk classification and assessment method for tunnels crossing under high-speed railway subgrade. Mod. Tunn. Technil. 2020, 57, 8–16. [Google Scholar]
- Ding, Z.; Zhang, X.; Zhou, L.; Chen, Z. Research and prospect of interaction between close bridge pile and metro tunnel. J. Zhejiang Univ. 2018, 52, 1943–1953. [Google Scholar]

Disclaimer/Publisher’s Note: The statements, opinions and data contained in all publications are solely those of the individual author(s) and contributor(s) and not of MDPI and/or the editor(s). MDPI and/or the editor(s) disclaim responsibility for any injury to people or property resulting from any ideas, methods, instructions or products referred to in the content. |
© 2025 by the authors. Licensee MDPI, Basel, Switzerland. This article is an open access article distributed under the terms and conditions of the Creative Commons Attribution (CC BY) license (https://creativecommons.org/licenses/by/4.0/).