Abstract
Electron paramagnetic resonance (EPR) examination of the effect of storage conditions on properties and contents of free radicals formed in the pharmaceutical preparation containing spironolactone, taking into account physical factors such as UVA radiation and the higher temperature, was conducted. The changes in amplitude (A), integral intensity (I) and EPR linewidth (ΔBpp) of the EPR spectra and free radical contents were determined. It was obtained that free radicals are formed during storage of this preparation under three different treatments: 50 °C, under UVA radiation, and under UVA radiation and a temperature of 50 °C. During storage, the preparation containing spironolactone should be protected from temperatures 50 °C and from UVA radiation. A higher content of free radicals is formed in the tested preparation exposed to both UVA and a temperature of 50 °C, than in the preparation exposed only to UVA or only to a temperature of 50 °C. Similar integral intensities (I) were obtained for the tested preparation exposed to a temperature of 50 °C or exposed to UVA radiation. Fast spin-lattice relaxation processes occur in all tested pharmaceutical preparation samples containing spironolactone. The usefulness of EPR spectral analysis in the study of free radicals formed in pharmaceutical preparations has been confirmed.
1. Introduction
Drugs should be stored under conditions in which their chemical structure is not disturbed [1,2,3,4,5]. Storage conditions should be selected individually for a given drug so that the interaction of the environment does not cause the breaking of chemical bonds and the generation of free radicals in the given substance. Free radicals have unpaired electrons in molecules, which are responsible for reactions with other compounds [6,7,8,9,10,11,12,13,14,15]. In free radical reactions, unpaired electrons are paired. Free radicals in reactions can give up an excess electron to another molecule or gain an electron by forming a chemical bond [1,9,10].
Free radicals reduce the stability of drugs and they may also influence their pharmacological action. Free radicals as the reactive molecules with unpaired electrons, and they may cause destabilization of drugs. The cyclic chain reactions involving free radicals may appear. The reactions between all the products of these reactions are possible. Free radicals are active in reactions with the others free radicals and with diamagnetic—nonradical —molecules. Free radicals may react with oxygen molecules present in the pharmaceutical preparation environment. New types of free radicals can be expected to be generated as products of these reactions. Pharmaceutical substances should be stored in such a way as to avoid the formation of free radicals.
Preparations containing free radicals are paramagnetic, and they have an ordered magnetic moment in a magnetic field [16,17]. Free radicals in magnetic field absorb microwaves, which is the basis of the study using electron paramagnetic resonance (EPR) spectroscopy [16,17,18,19,20,21,22,23]. According to the quantum foundations of the EPR phenomenon, the energy of microwave radiation is absorbed by unpaired electrons of free radicals when it is exactly adapted to the energy level difference of the unpaired electrons of free radicals. Free radical testing using the EPR method is possible when the following equation is fulfilled [18,20,21]:
where ΔE is the energy difference between two energy levels of unpaired electrons, h is Planck’s constant, ν is the microwave frequency, μB is Bohr’s magneton, and Br is the resonance magnetic induction.
ΔE = hν = gμBBr
In this work, the EPR method was used in studies of a pharmaceutical preparation containing spironolactone. According to the International Council for Harmonisation (ICH) guidelines for storage, the quality and safety of drug substances requires their stability. According to the producer the tested pharmaceutical preparation containing spironolactone and excipients should be stored at a temperature below 25 °C. It was investigated how uncontrolled exposure to environmental factors is dangerous to the stability of the structure of the tested pharmaceutical product.
It was checked whether, under the influence of external factors acting during storage on this preparation, free radicals are formed in its structures. The EPR method was proposed as a conservative method with respect to the sample and due to the direct nature of the study of free radicals.
The primary objective of this work is to determine the effect of storage conditions on the properties and content of free radicals generated in a pharmaceutical preparation containing spironolactone, taking into account physical factors such as UVA radiation and elevated temperature. The partial aims of this research were to determine the effect of the following conditions on the EPR spectra of the tested pharmaceutical preparation containing spironolactone: (a) the higher temperature of 50 °C, (b) UVA radiation, and (c) UVA radiation and the higher temperature of 50 °C. The research objectives were achieved using EPR spectroscopy in the X-band (9.3 GHz), assuming that the changes in EPR spectra reflect changes in parameters such as amplitude (A), integral intensity (I) and EPR linewidth (ΔBpp).
The diuretic drug spironolactone was selected for the study, as it occurs in the form of a solid and may be unintentionally exposed to the negative impact of physical factors such as elevated temperature or UVA radiation during storage or transport. It was checked whether free radicals appear under these conditions in a pharmaceutical preparation containing spironolactone. Studies on the susceptibility of free radicals of spironolactone to elevated temperature and UVA radiation using the EPR method have not been conducted by other authors so far.
Spironolactone is a diuretic drug from the group of aldosterone antagonists: a steroid hormone of the adrenal cortex that regulates water and electrolyte balance [23,24,25,26,27,28,29,30,31,32,33,34,35]. Aldosterone retains sodium ions and water in the body with increased excretion of potassium and hydrogen ions. Spironolactone is a potassium-sparing diuretic that prevents aldosterone from binding to its receptors [23]. Use of this drug increases the amount of sodium excreted in the urine and the volume of water excreted, without increasing potassium excretion. Spironolactone has a diuretic effect after 12 h, but the full therapeutic effect appears slowly (after several days). The effect lasts for 2–3 days after discontinuation of the drug [26].
The indications for the use of spironolactone include primary and secondary hyperaldosteronism, arterial hypertension, hypokalaemia [25], oedema of cardiac, hepatic and renal origin, myasthenia [27,28,29,30,31], liver cirrhosis and nephrotic syndrome [31]. In cases of oedema, spironolactone is often used in combination therapy with thiazides and loop diuretics to reduce oedema [25]. Spironolactone has additional progesterone and antiandrogenic effects that can be used in cases of hirsutism and polycystic ovary syndrome in women [25].
2. Materials and Methods
2.1. Samples: Characterization and Preparation
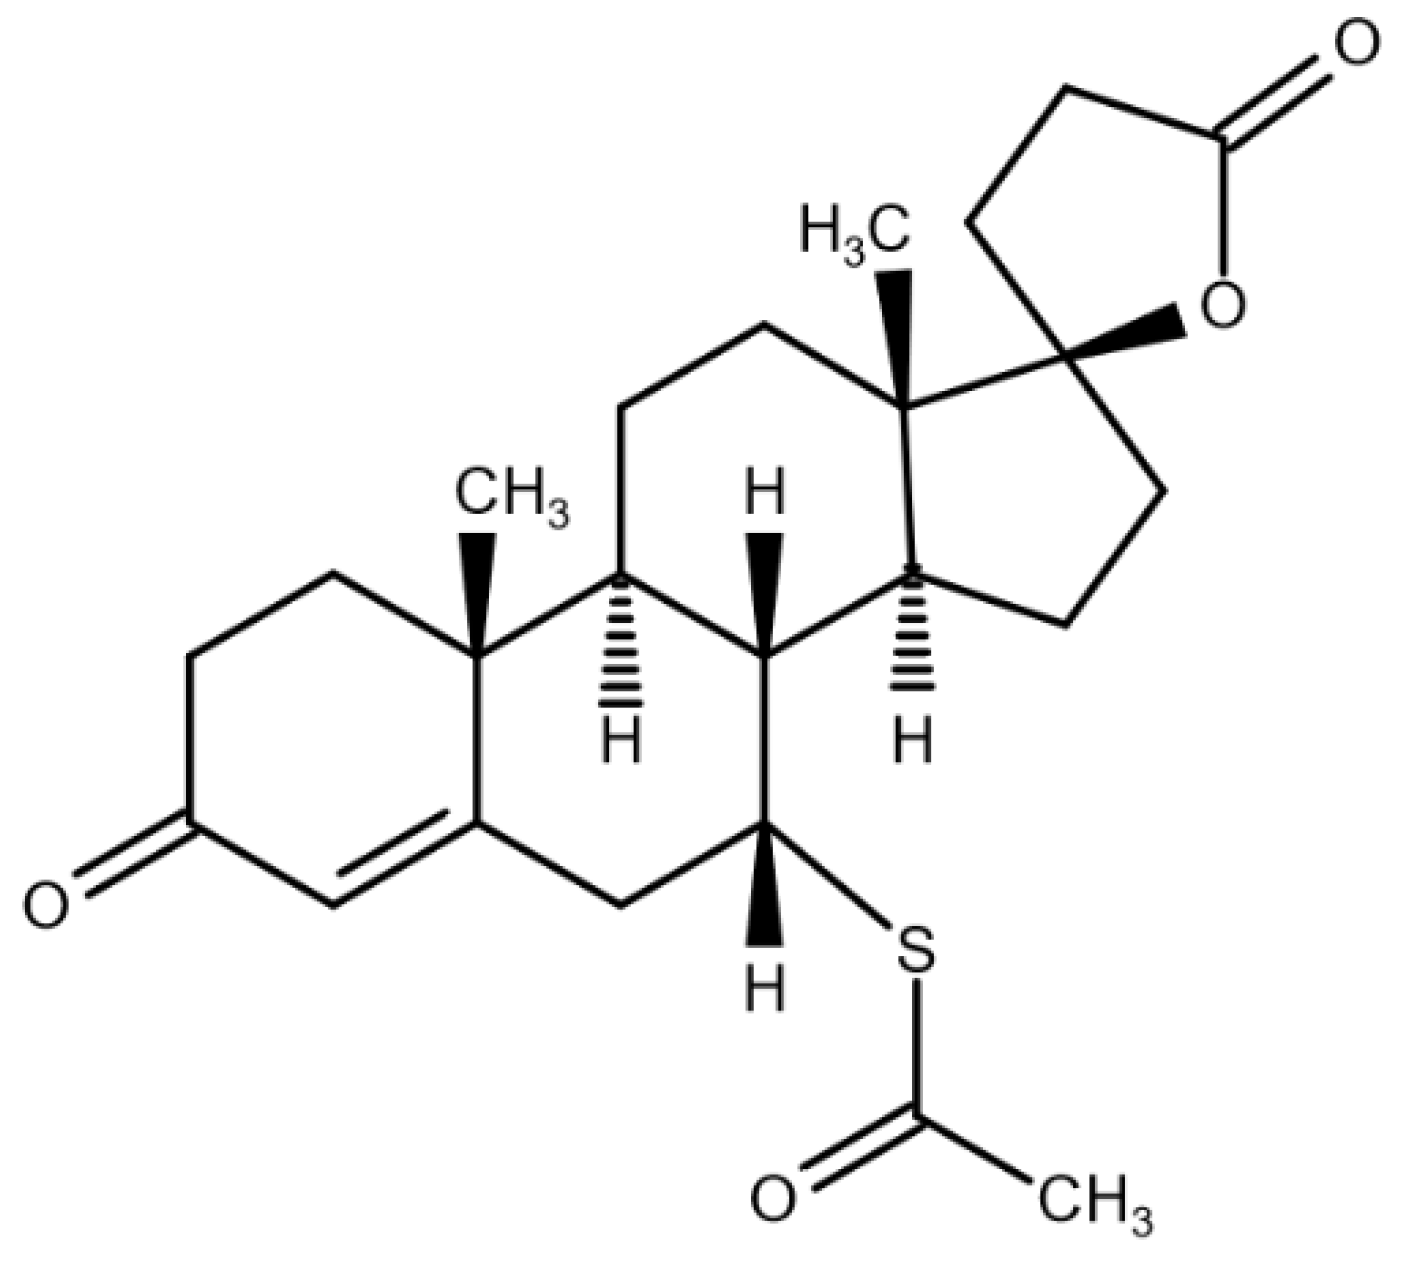
The pharmaceutical preparation contains spironolactone as the active substance and excipients. The chemical structure of spironolactone (C24H32O4S) is shown in Figure 1 [23]. The tested samples were in the form of a powdered solid.

Figure 1.
Chemical structure of spironolactone [23].
The influence of physical factors on the formation of free radicals in a pharmaceutical preparation containing spironolactone was investigated. The preparation was tested under the following treatments: (a) storage at room temperature, (b) exposed to a higher temperature of 50 °C, (c) exposed to UVA radiation and (d) exposed to UVA radiation and higher temperature of 50 °C. The time of action of the elevated temperature of 50 °C was 30 min. The time of exposure of the preparation to UVA radiation was also 30 min. Additionally, the preparation exposed to UVA radiation for 30 min was then exposed to an elevated temperature of 50 °C for 30 min.
The same time of exposure to elevated temperature and UVA radiation was selected for the tested preparation, which allows for a comparison of the generation of free radicals by various physical factors. This time was 30 min, because the exposure of a pharmaceutical preparation to a given factor is unacceptable if, even in a short time, free radicals are generated in the preparation.
To study the effect of an elevated temperature of 50 °C on the preparation containing spironolactone, the chamber of a professional thermal sterilizer from Memmert (Schwabach, Germany), which operates using dry hot air circulation, was used. The temperature during sample preparation was constant, and the temperature distribution in the chamber was uniform.
In the study, the Medisun 250 lamp from Schulze & Bohm (Brühl, Germany) was used as a source of UVA radiation. A thin layer of powder, about 1 mm thick, of the pharmaceutical preparation containing spironolactone was placed in Petri dishes with a diameter 9 cm, at a distance of 30 cm from the Medisun 250 lamp. This lamp has four radiators with a power of 40 mW and emits radiation with a wavelength of 315–380 nm.
In order to perform the EPR tests, samples of a pharmaceutical preparation containing spironolactone were placed in thin-walled glass measuring tubes with an outer diameter of 3 mm. The masses of the samples in the glass tubes were 0.02–0.04 g. The masses were determined using a scale from Sartorius (Göttingen, Germany).
2.2. Spectrometer and Recorders Used in This Research
The studies of free radicals generated by physical factors in a pharmaceutical preparation containing spironolactone were carried out using a paramagnetic resonance electron spectrometer with 100 kHz magnetic modulation from Radiopan (Poznań, Poland), cooperating with a rapid numerical data acquisition system Rapid Scan Unit from Jagmar (Kraków, Poland).
The microwave block contains a klystron, which generates microwaves. Microwave radiation from the X band with a frequency of 9.3 GHz was used. The microwave frequency was determined with a MCM 101 recorder from EPRAD (Poznań, Poland). The total power of the klystron is 70 mW. The microwave power was changed using an attenuator, which is located at the output of the microwave block.
During recording of the EPR spectra, samples of the pharmaceutical preparation were placed in the spectrometer resonator between the poles of an electromagnet, which was the source of the magnetic field. The magnetic induction of the field was determined by a meter from EPRAD (Poznań, Poland), using the phenomenon of nuclear magnetic resonance (NMR).
2.3. EPR Spectra Measurements at Different Microwave Power Levels
EPR spectra of a pharmaceutical preparation containing spironolactone were measured using microwave power settings ranging from 2.2 mW to 70 mW. During the measurements, the attenuation of microwaves was changed to obtain the appropriate power. Attenuations from 15 dB to 0 dB were used. Smaller attenuations correspond to higher microwave power values.
The relationship between microwave power and attenuation is given by the following formula [19,22]:
where Mo is the total microwave power produced by the klystron (70 mW) and M is microwave power used during the measurement of the EPR spectrum.
attenuation [dB] = 10 lg[Mo/M]
The EPR spectra parameters of all samples were compared for a microwave power of 2.2 mW. At a power of 2.2 mW, there was no microwave saturation of the EPR line. The content of free radicals in the tested samples were obtained based on measurements at a low microwave power of 2.2 mW.
2.4. Analysed EPR Spectra Parameters
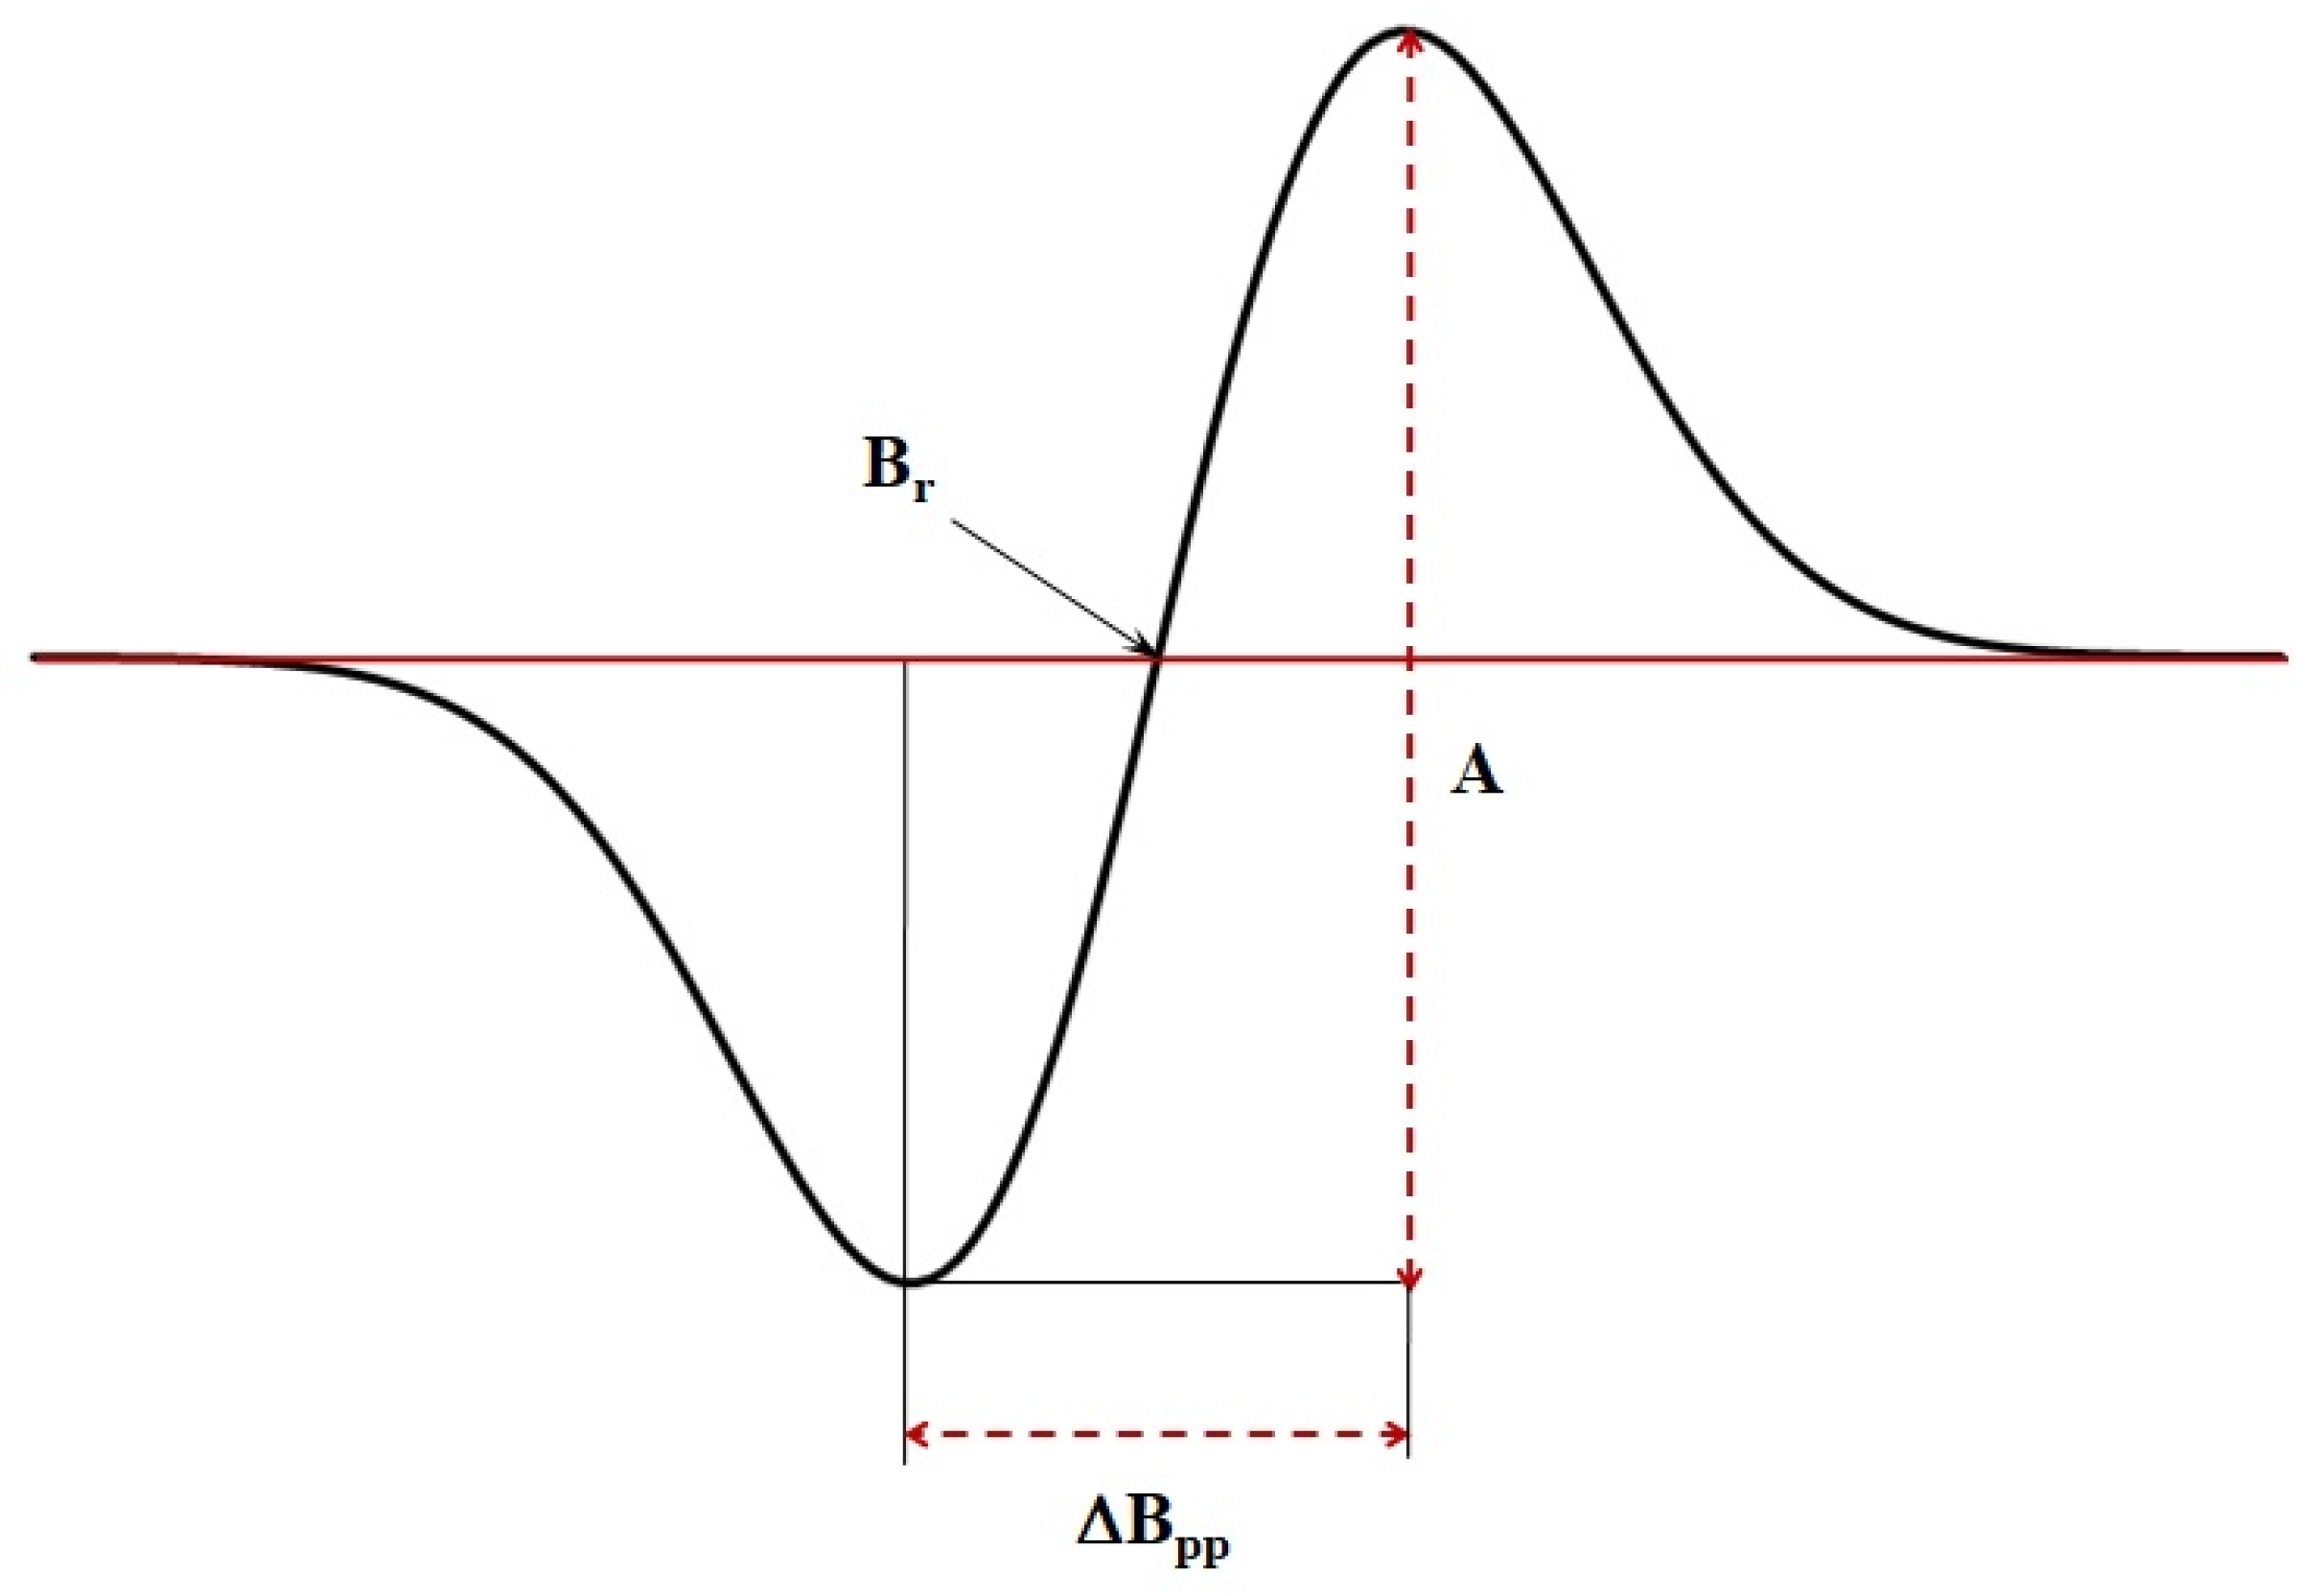
EPR spectra were measured as the first-derivative of absorption (Figure 2). The following parameters of the EPR spectra were analysed: (a) amplitude (A), (b) integral intensity (I), (c) linewidth (ΔBpp), (d) resonance magnetic induction (Br) and (e) g factor.
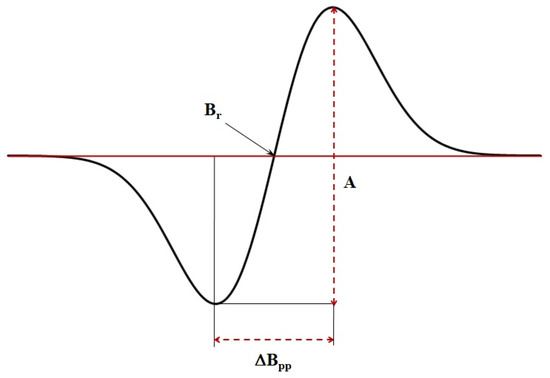
Figure 2.
The exemplary first-derivative EPR spectrum and its parameters: amplitude (A), linewidth (ΔBpp) of line and resonance magnetic induction (Br).
The maximum errors of the measured quantities were determined. Parameter changes smaller than the maximum errors were not included in the results discussion.
The amplitude (A) and integral intensities (I) of the EPR lines increase with increasing of free radical content in the preparations [18,19,20,21,22,23]. Magnetic interactions effect the linewidth (ΔBpp) of the EPR line [18,19,20,21,22,23]. After determining the resonance magnetic induction (Br) from the EPR line (Figure 2), the spectroscopic splitting factor g was determined using the following formula [18,19,20,21]:
where h is Planck’s constant, ν is the microwave frequency, μB is Bohr’s magneton and Br is the resonance magnetic induction.
g = hν/µBBr
The computer programs, spectroscopic programs for recording and analysing spectra from Jagmar (Kraków, Poland), LabVIEW 8.5 from National Instruments (Austin, TX, USA), Origin (OriginLab, Northampton, MA, USA) and Microsoft Excel (Redmond, WA, USA), were used during the measurements and analysis.
The total differential method was used to determined measurement errors. The maximum errors of the measured quantities were determined. Parameter changes smaller than the maximum errors were not included in the results discussion.
2.5. Determination of Free Radical Content in the Pharmaceutical Preparation Storage at Different Physical Conditions
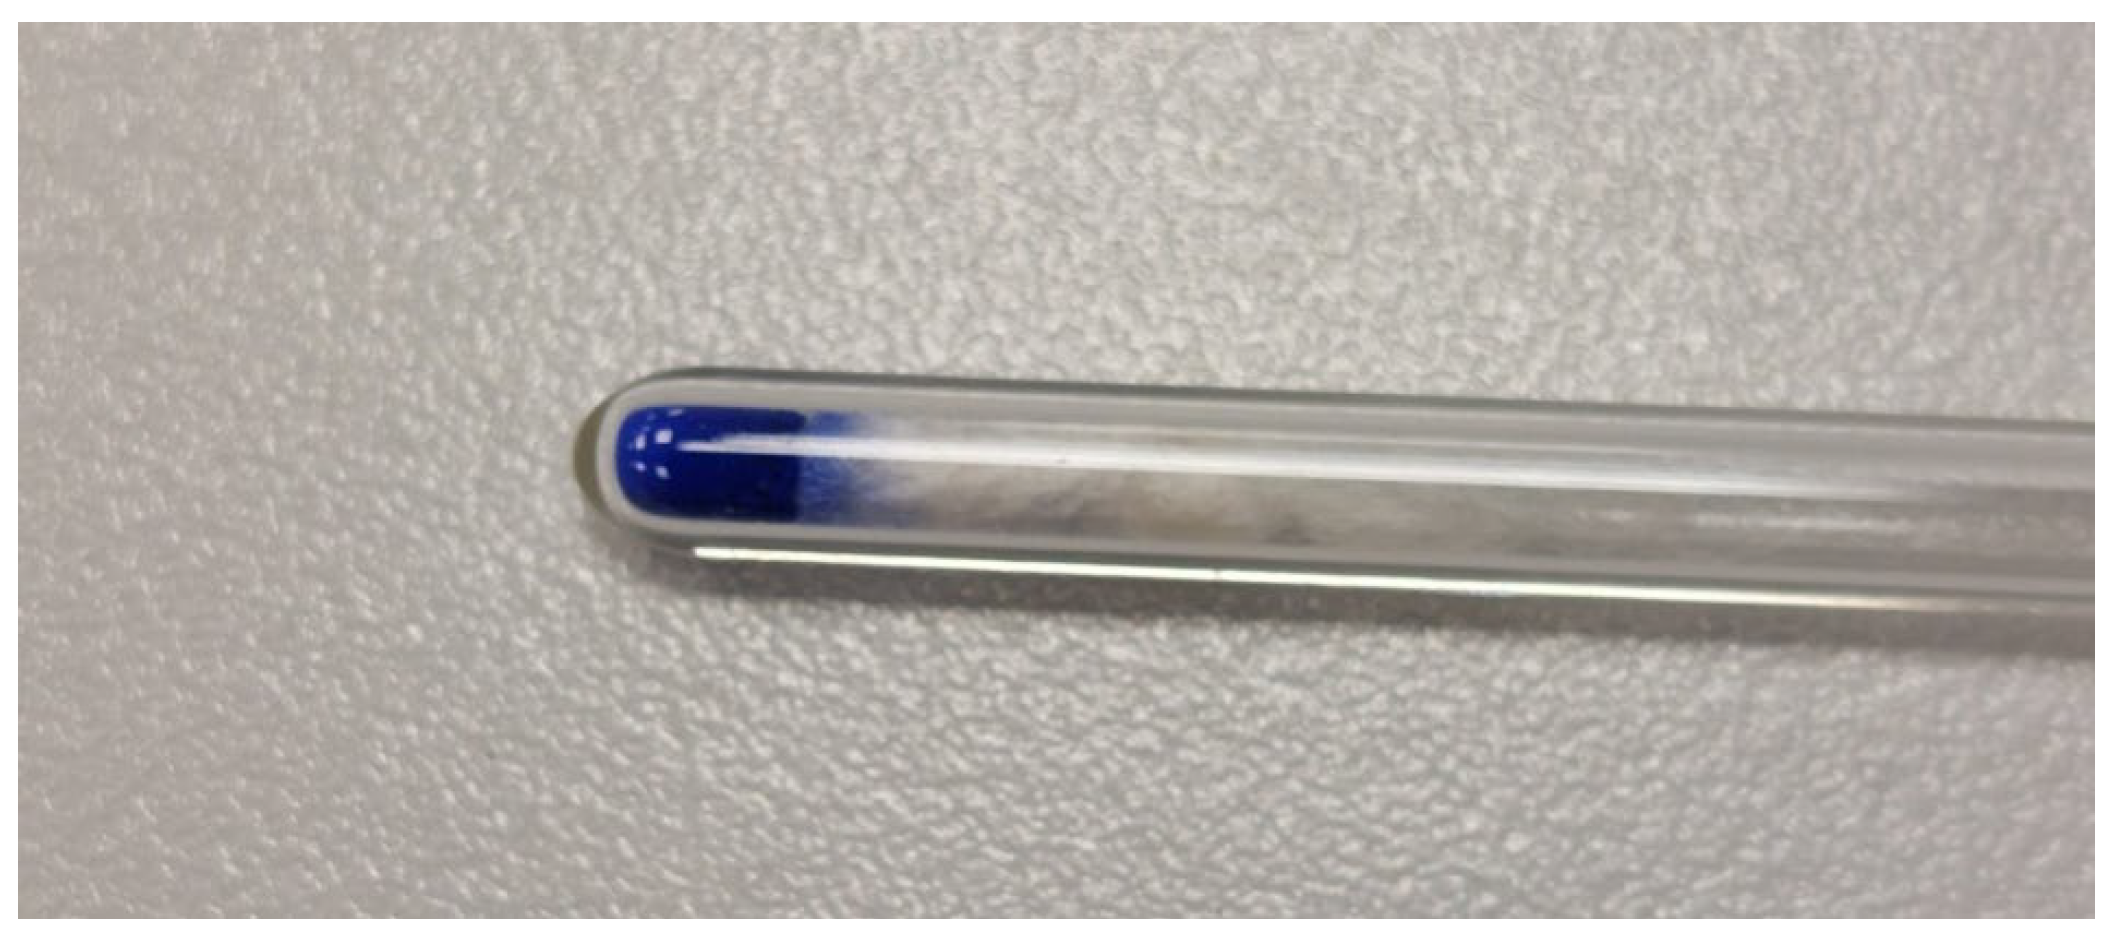
The EPR lines of the examined preparations were compared to the EPR lines of ultramarine (Figure 3) with sulphur paramagnetic centres used as the reference [36,37]. Free radical content (N) in the examined preparation containing spironolactone was determined according to the following formula [18,22,23]:
where nu is the number of paramagnetic centres in ultramarine (used as the reference), Iu is the integral intensity of the EPR line of ultramarine, Ip is the integral intensity of the EPR line of the tested preparation, Wu is the receiver gain for the EPR line of ultramarine, Wp is the receiver gain of the EPR line of the tested preparation and m is the mass of the sample.
N = nu (IpWu)/(IuWpm)
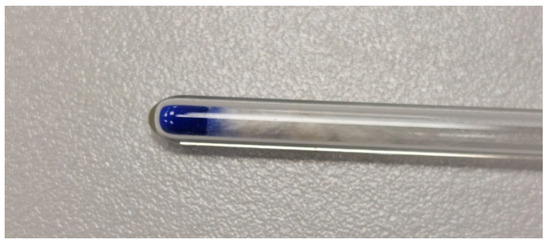
Figure 3.
Ultramarine used in this work as a standard of content of paramagnetic centres.
3. Results and Discussion
3.1. EPR Analysis of the Effect of the Higher Temperature of Storage on the Pharmaceutical Preparation Containing Spironolactone
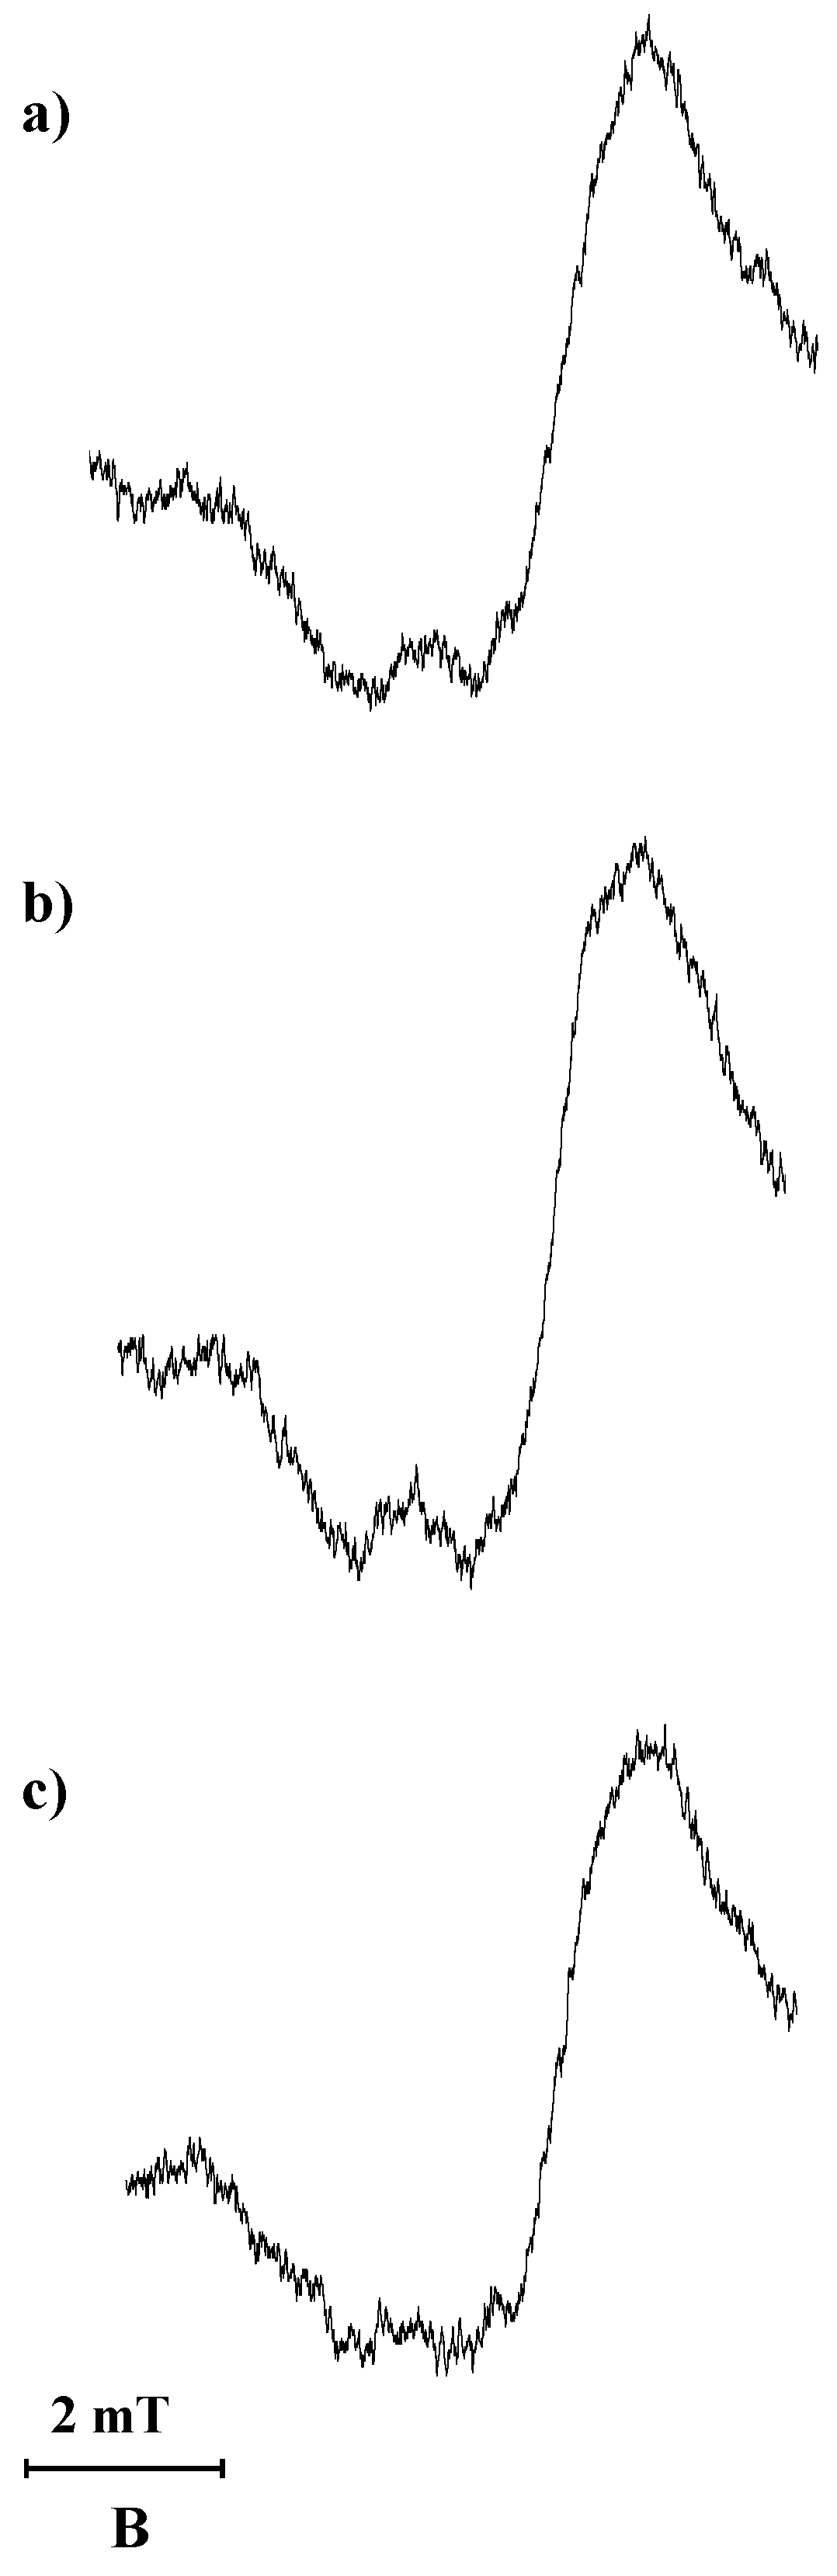
The storage of the tested preparation containing spironolactone at the higher temperature of 50 °C during 30 min results in the formation of free radicals. The EPR spectra with a g factor of 2 appeared for this preparation. The EPR spectrum of the tested preparation containing spironolactone after thermal treatment at a temperature of 50 °C, measured with a microwave power of 2.2 mW, is shown in Figure 4a. The EPR spectrum was not obtained for the pharmaceutical preparation before the exposure to higher temperature and UVA radiation.
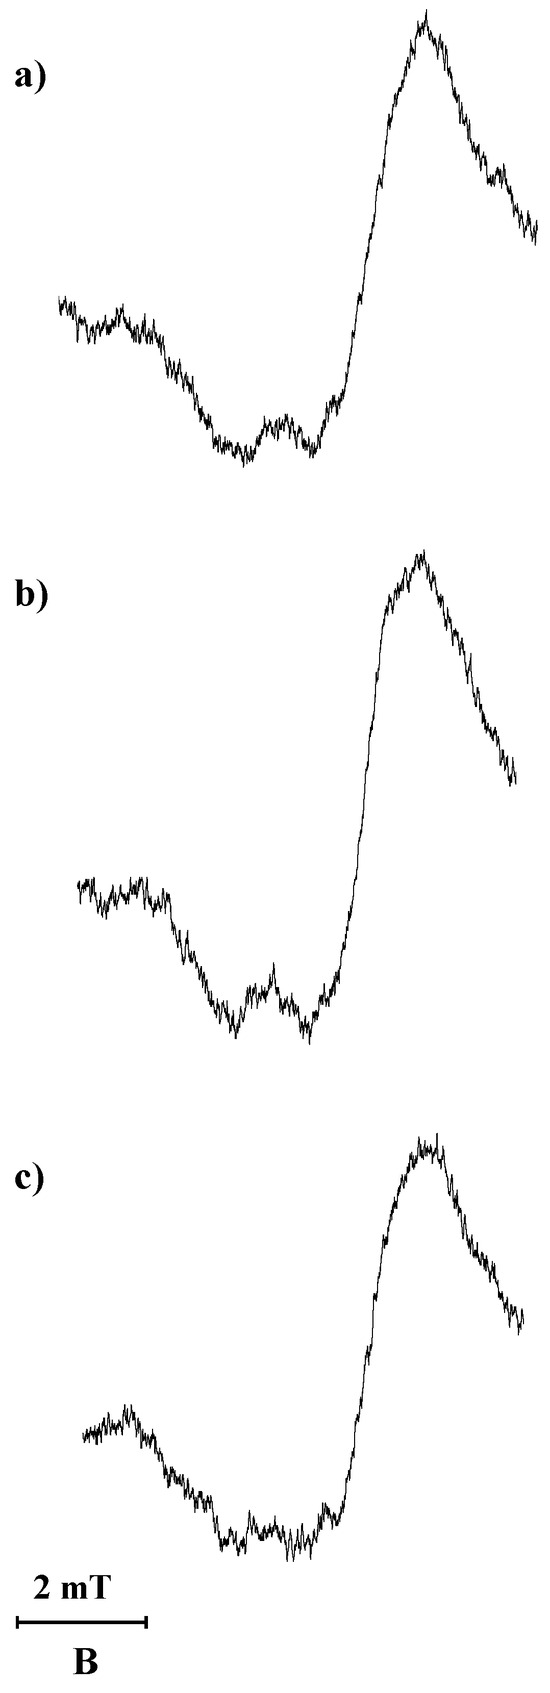
Figure 4.
EPR spectra of the examined pharmaceutical preparation containing spironolactone: (a) storage at the higher temperature of 50 °C for 30 min, (b) exposed to UVA radiation for 30 min and (c) exposed to UVA radiation, followed by the higher temperature of 50 °C for 30 min each. The spectra were measured with a microwave power of 2.2 mW. B is the magnetic induction.
Unfortunately, the complex shape of the EPR spectra only allows determination of the value of the average spectroscopic splitting factor g, and thus the precise determination of the type of free radicals formed is also difficult. Taking into account the chemical structure of the studied substance, it can be assumed that free radicals are formed by the separation of a CH3 group, a hydrogen atom or an oxygen atom from the starting molecules. These changes are accompanied by the formation of unpaired electrons belonging to various free radicals. Different types of free radicals contribute to the creation of the resultant spectrum, which is obtained during the measurement with an EPR spectrometer.
The multicomponent shape of the EPR spectrum indicates that the pharmaceutical preparation under investigation should be particularly protected against uncontrolled, accidental exposure to higher temperature and UVA radiation, as such factors destroy its chemical structure. Modification of the chemical structure during storage of the tested pharmaceutical preparation is not permissible, because it may result in the loss of medicinal properties or may cause free radical toxic effects of the drug in the body. At the same time, EPR spectrometry was shown to be highly useful in assessing the harmful effects of improper storage conditions on a pharmaceutical product containing spironolactone and excipients.
EPR spectra measurements using microwave power levels from 2.2 mW to 70 mW showed that the amplitude (A), integral intensity (I) and width (ΔBpp) of the EPR lines of thermally generated free radicals in the spironolactone preparation depend on the microwave power used. The amplitude (A) of the EPR line, the integral intensity (I) of the EPR line and the linewidth (ΔBpp) of the EPR line of thermally generated free radicals increase with increasing microwave power in the applied power range: 2.2–70 mW.
For the measured EPR spectra, no microwave saturation of the lines was observed, which results from the fast spin-lattice relaxation processes in the preparation containing spironolactone. The amplitude (A) and integral intensity (I) of the EPR lines do not reach a maximum value for measurements carried out with a power level up to 70 mW. A decrease in the values of these parameters of the EPR spectra of the preparation containing spironolactone subjected to heat treatment was not observed for the microwave power levels used.
Table 1 compares the EPR line parameters of the preparation containing spironolactone exposed to a thermal agent (temperature 50 °C) for the spectra measured using selected microwave power levels (M) of 2.2 mW, 7 mW and 55 mW. The values of the amplitude (A), integral intensity (I) and linewidth (ΔBpp) of the EPR line of the preparation containing spironolactone exposed to the temperature of 50 °C increase for higher microwave power levels (Table 1).

Table 1.
Parameters of the EPR spectra: amplitude (A), integral intensity (I) and linewidth (ΔBpp) of the lines recorded with microwave power levels (M) of 2.2 mW, 7 mW and 55 mW for a preparation containing spironolactone exposed to the higher temperature of 50 °C.
3.2. EPR Analysis of the Effect of the Exposition to UVA Radiation During Storage on the Pharmaceutical Preparation Containing Spironolactone
EPR spectra measurements showed that exposure of the tested pharmaceutical preparation containing spironolactone to UVA radiation for 30 min leads to the generation of free radicals. For the preparation exposed to UVA radiation, EPR spectra were recorded in the microwave power range up to 70 mW. The EPR spectrum of the preparation exposed to UVA radiation, for the measurement with microwave power of 2.2 mW, is shown in Figure 4b. The spectroscopic splitting factor g of the recorded EPR lines was near 2. The complex asymmetrical shape of the EPR spectra indicates that several different types of free radicals are formed during storage at the higher temperature of 50 °C and during exposure to UVA radiation.
Sulphur is present in the structure of spironolactone and the sulphur paramagnetic centres may arise. Probably paramagnetic centres in the form of S3•− and S2•− can be formed under the influence of UVA and the higher temperature in the tested preparation. The EPR spectra of the sulphur centres depend on the chemical structure of the tested substance [38]. It seems that additionally formation of C-centred and O-centred centres is probable, but this requires further research. Apart from stable free radicals, some the short-lived free radicals, which were not detected, may be generated as a result of the external influences as UVA and the higher temperature, and they may be registered with EPR by the use of spin traps.
EPR spectra measurements using microwave power levels from 2.2 mW to 70 mW showed that the amplitude (A), integral intensity (I) and width (ΔBpp) of the EPR lines of free radicals generated by UVA radiation in a preparation containing spironolactone depend on the microwave power. Amplitude (A), integral intensity (I) and linewidth (ΔBpp) of the EPR lines of free radicals formed under UVA radiation increase with increasing microwave power levels in the used range from 2.2 mW to 70 mW. For the EPR spectra, no microwave saturation of the lines was observed, which is due to the fast spin-lattice relaxation processes in the preparation with spironolactone. For the tested pharmaceutical preparation exposed to UVA radiation, an increase in the EPR linewidth (ΔBpp) was observed with increasing microwave power.
Table 2 compares the EPR line parameters of the preparation containing spironolactone exposed to UVA radiation for the spectra measured using selected microwave power levels (M) of 2.2 mW, 7 mW and 55 mW. The values of amplitude (A), integral intensity (I) and linewidth (ΔBpp) of the EPR line of the preparation containing spironolactone exposed to UVA radiation increase for higher microwave power levels (Table 2).
Table 2.
Parameters of the EPR spectra: amplitude (A), integral intensity (I) and linewidth (ΔBpp) of the lines recorded with microwave power levels (M) of 2.2 mW, 7 mW and 55 mW for a preparation containing spironolactone exposed to UVA radiation.
3.3. EPR Analysis of the Effect of the Interaction Between Higher Temperature and UVA Radiation on the Pharmaceutical Preparation Containing Spironolactone
Exposure of the tested pharmaceutical preparation containing spironolactone to UVA radiation for 30 min, followed by exposure to the higher temperature of 50 °C for 30 min, results in the generation of free radicals with the EPR spectra with g factor of 2, as measured in the range of microwave power levels of 2.2–70 mW. The EPR spectrum of the preparation exposed to UVA radiation followed by the higher temperature, for the measurement with microwave power of 2.2 mW, is shown in Figure 4c.
The amplitude (A) of the EPR line, the integral intensity (I) of the EPR line and the width (ΔBpp) of the EPR line of free radicals generated in the preparation containing spironolactone in the photolysis (UVA) and thermolysis (temperature 50 °C) processes increase with the increase of microwave power. The EPR spectra are not microwave saturable, which is due to the fast spin-lattice relaxation processes in the preparation containing spironolactone
Table 3 compares the EPR line parameters of the preparation containing spironolactone exposed to UVA radiation and a thermal agent (temperature 50 °C) for spectra measured using the selected microwave power levels (M) of 2.2 mW, 7 mW and 55 mW. The values of amplitude (A), integral intensity (I) and width (ΔBpp) of the EPR line of the preparation containing spironolactone exposed to UVA radiation at a temperature of 50 °C increase for higher microwave power levels (Table 3).
Table 3.
Parameters of the EPR spectra: amplitude (A), integral intensity (I) and linewidth (ΔBpp) of the lines recorded with microwave power (M) of 2.2 mW, 7 mW and 55 mW for a preparation containing spironolactone exposed to UVA radiation and the higher temperature of 50 °C.
3.4. Comparison of the Effects of the Higher Temperature, UVA Radiation, and UVA Radiation and the Higher Temperature on Free Radicals and EPR Spectra of the Pharmaceutical Preparation Containing Spironolactone
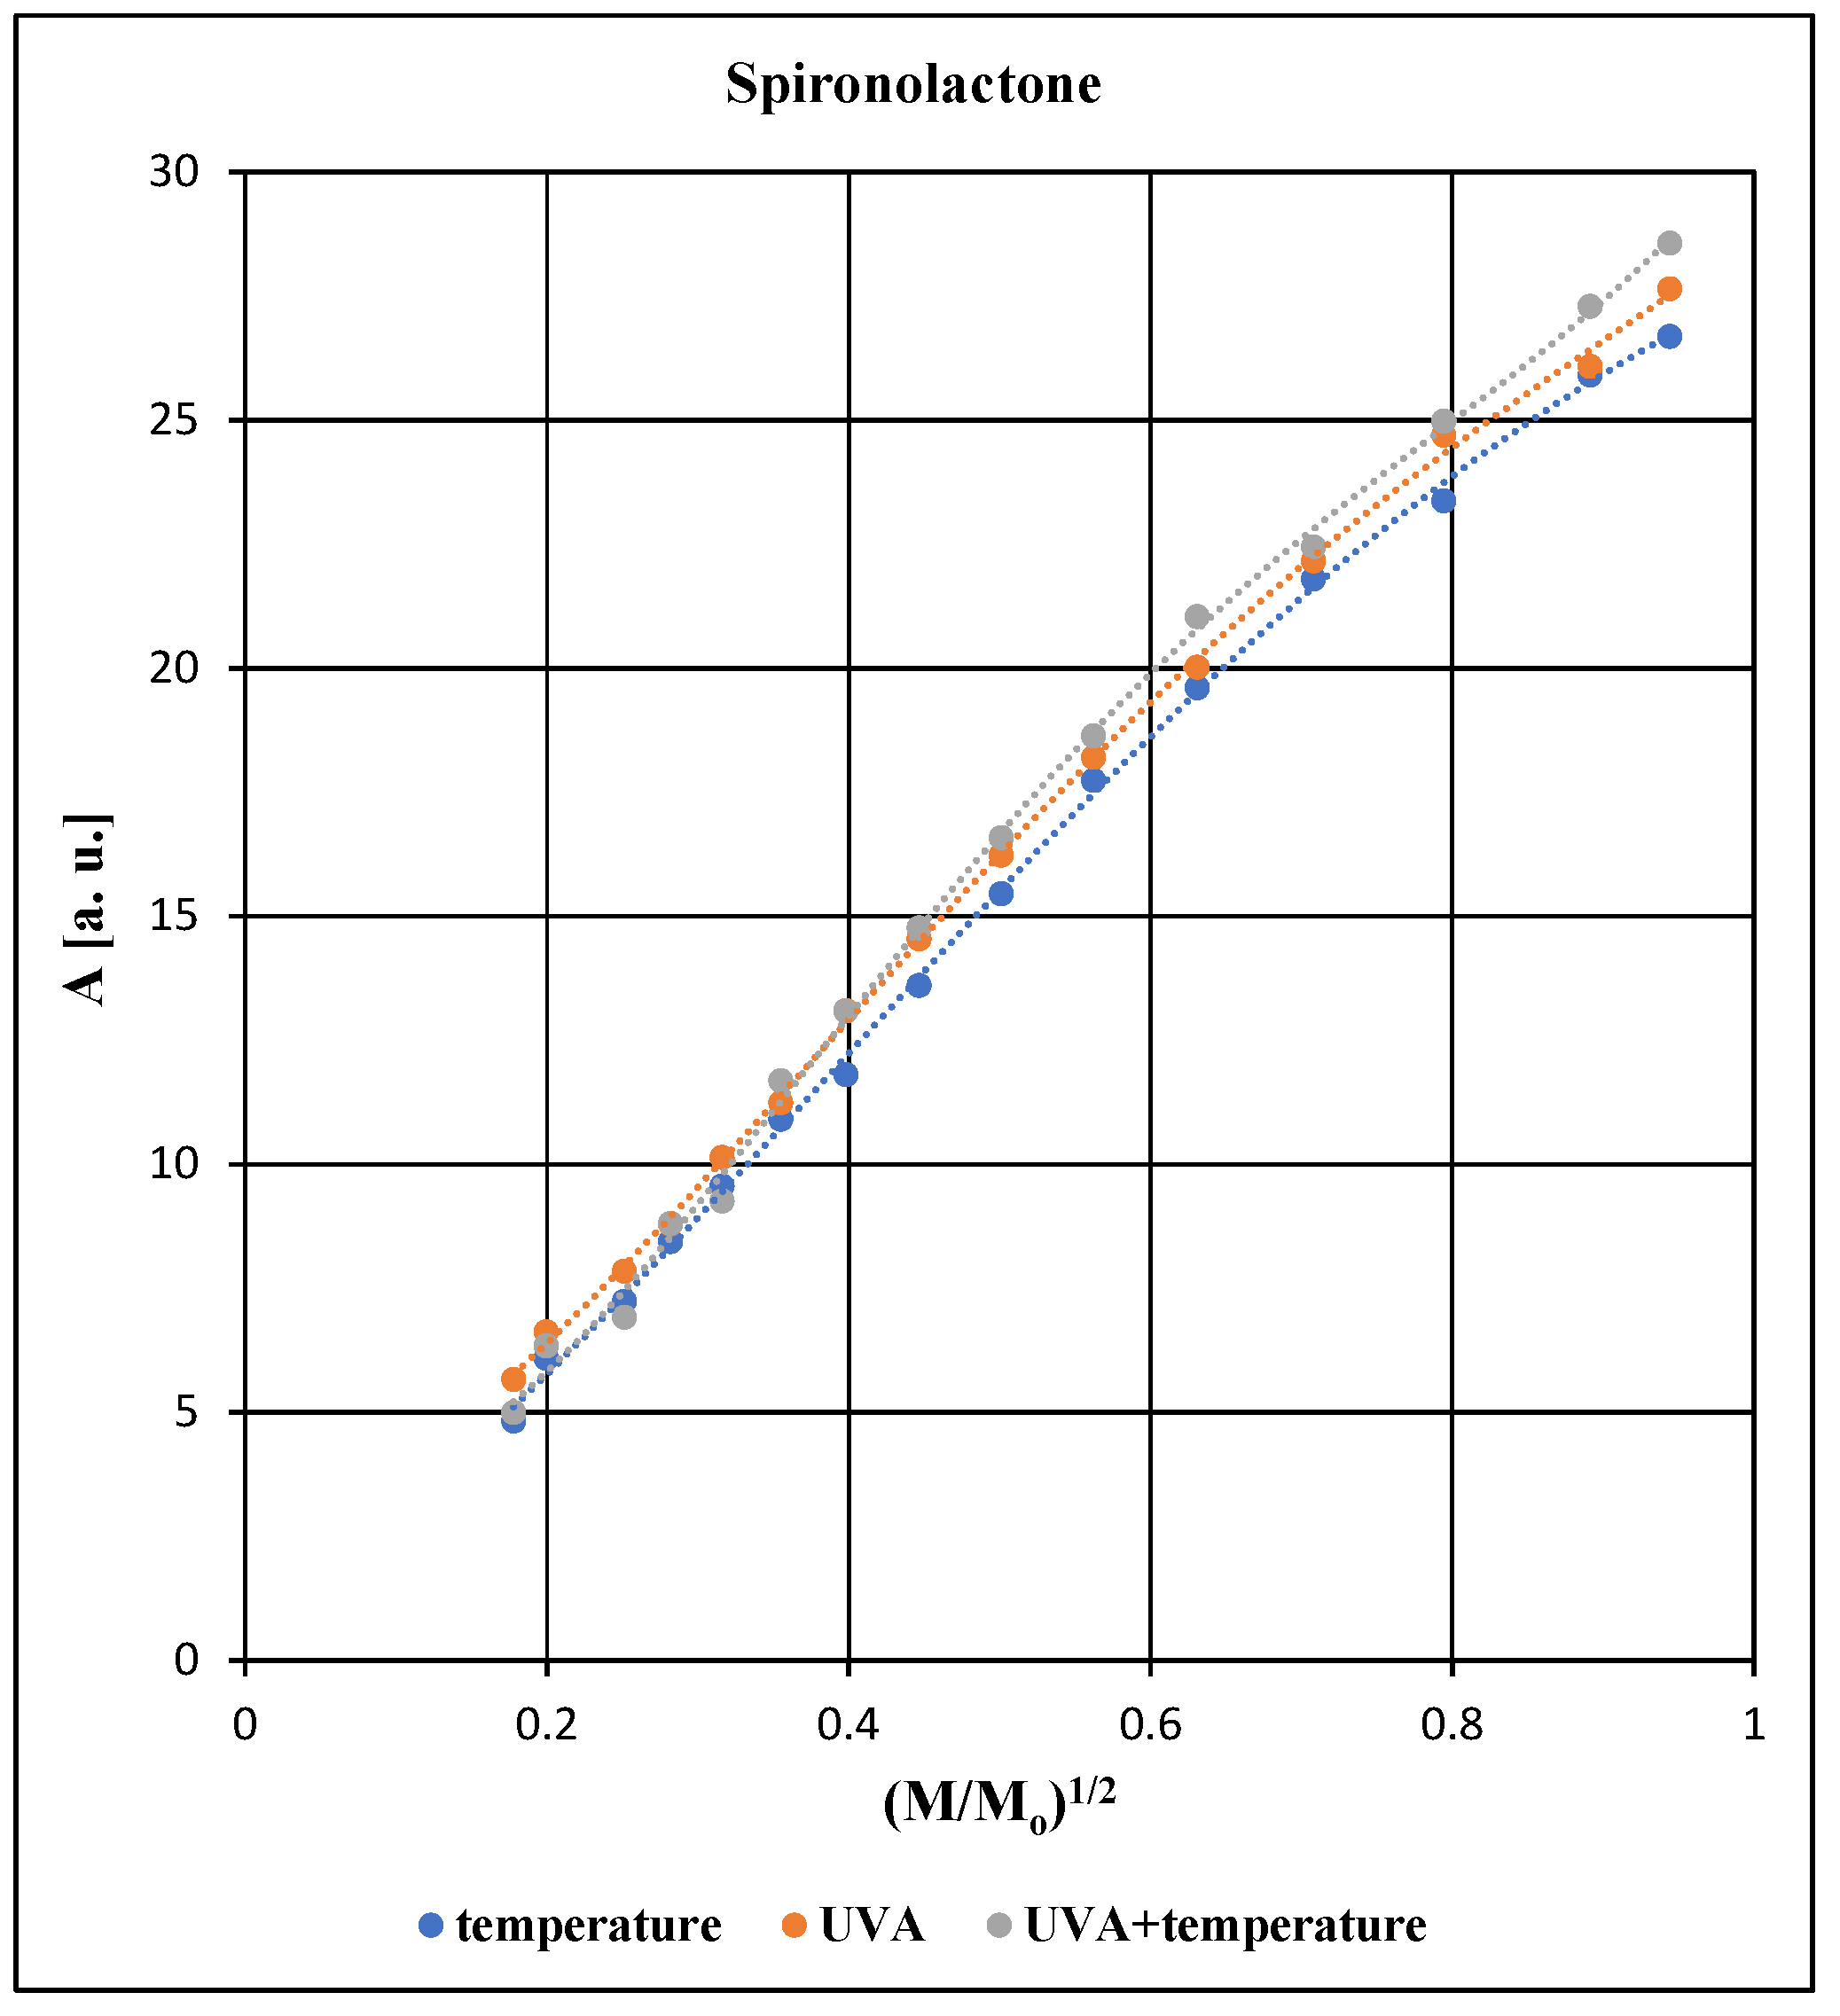
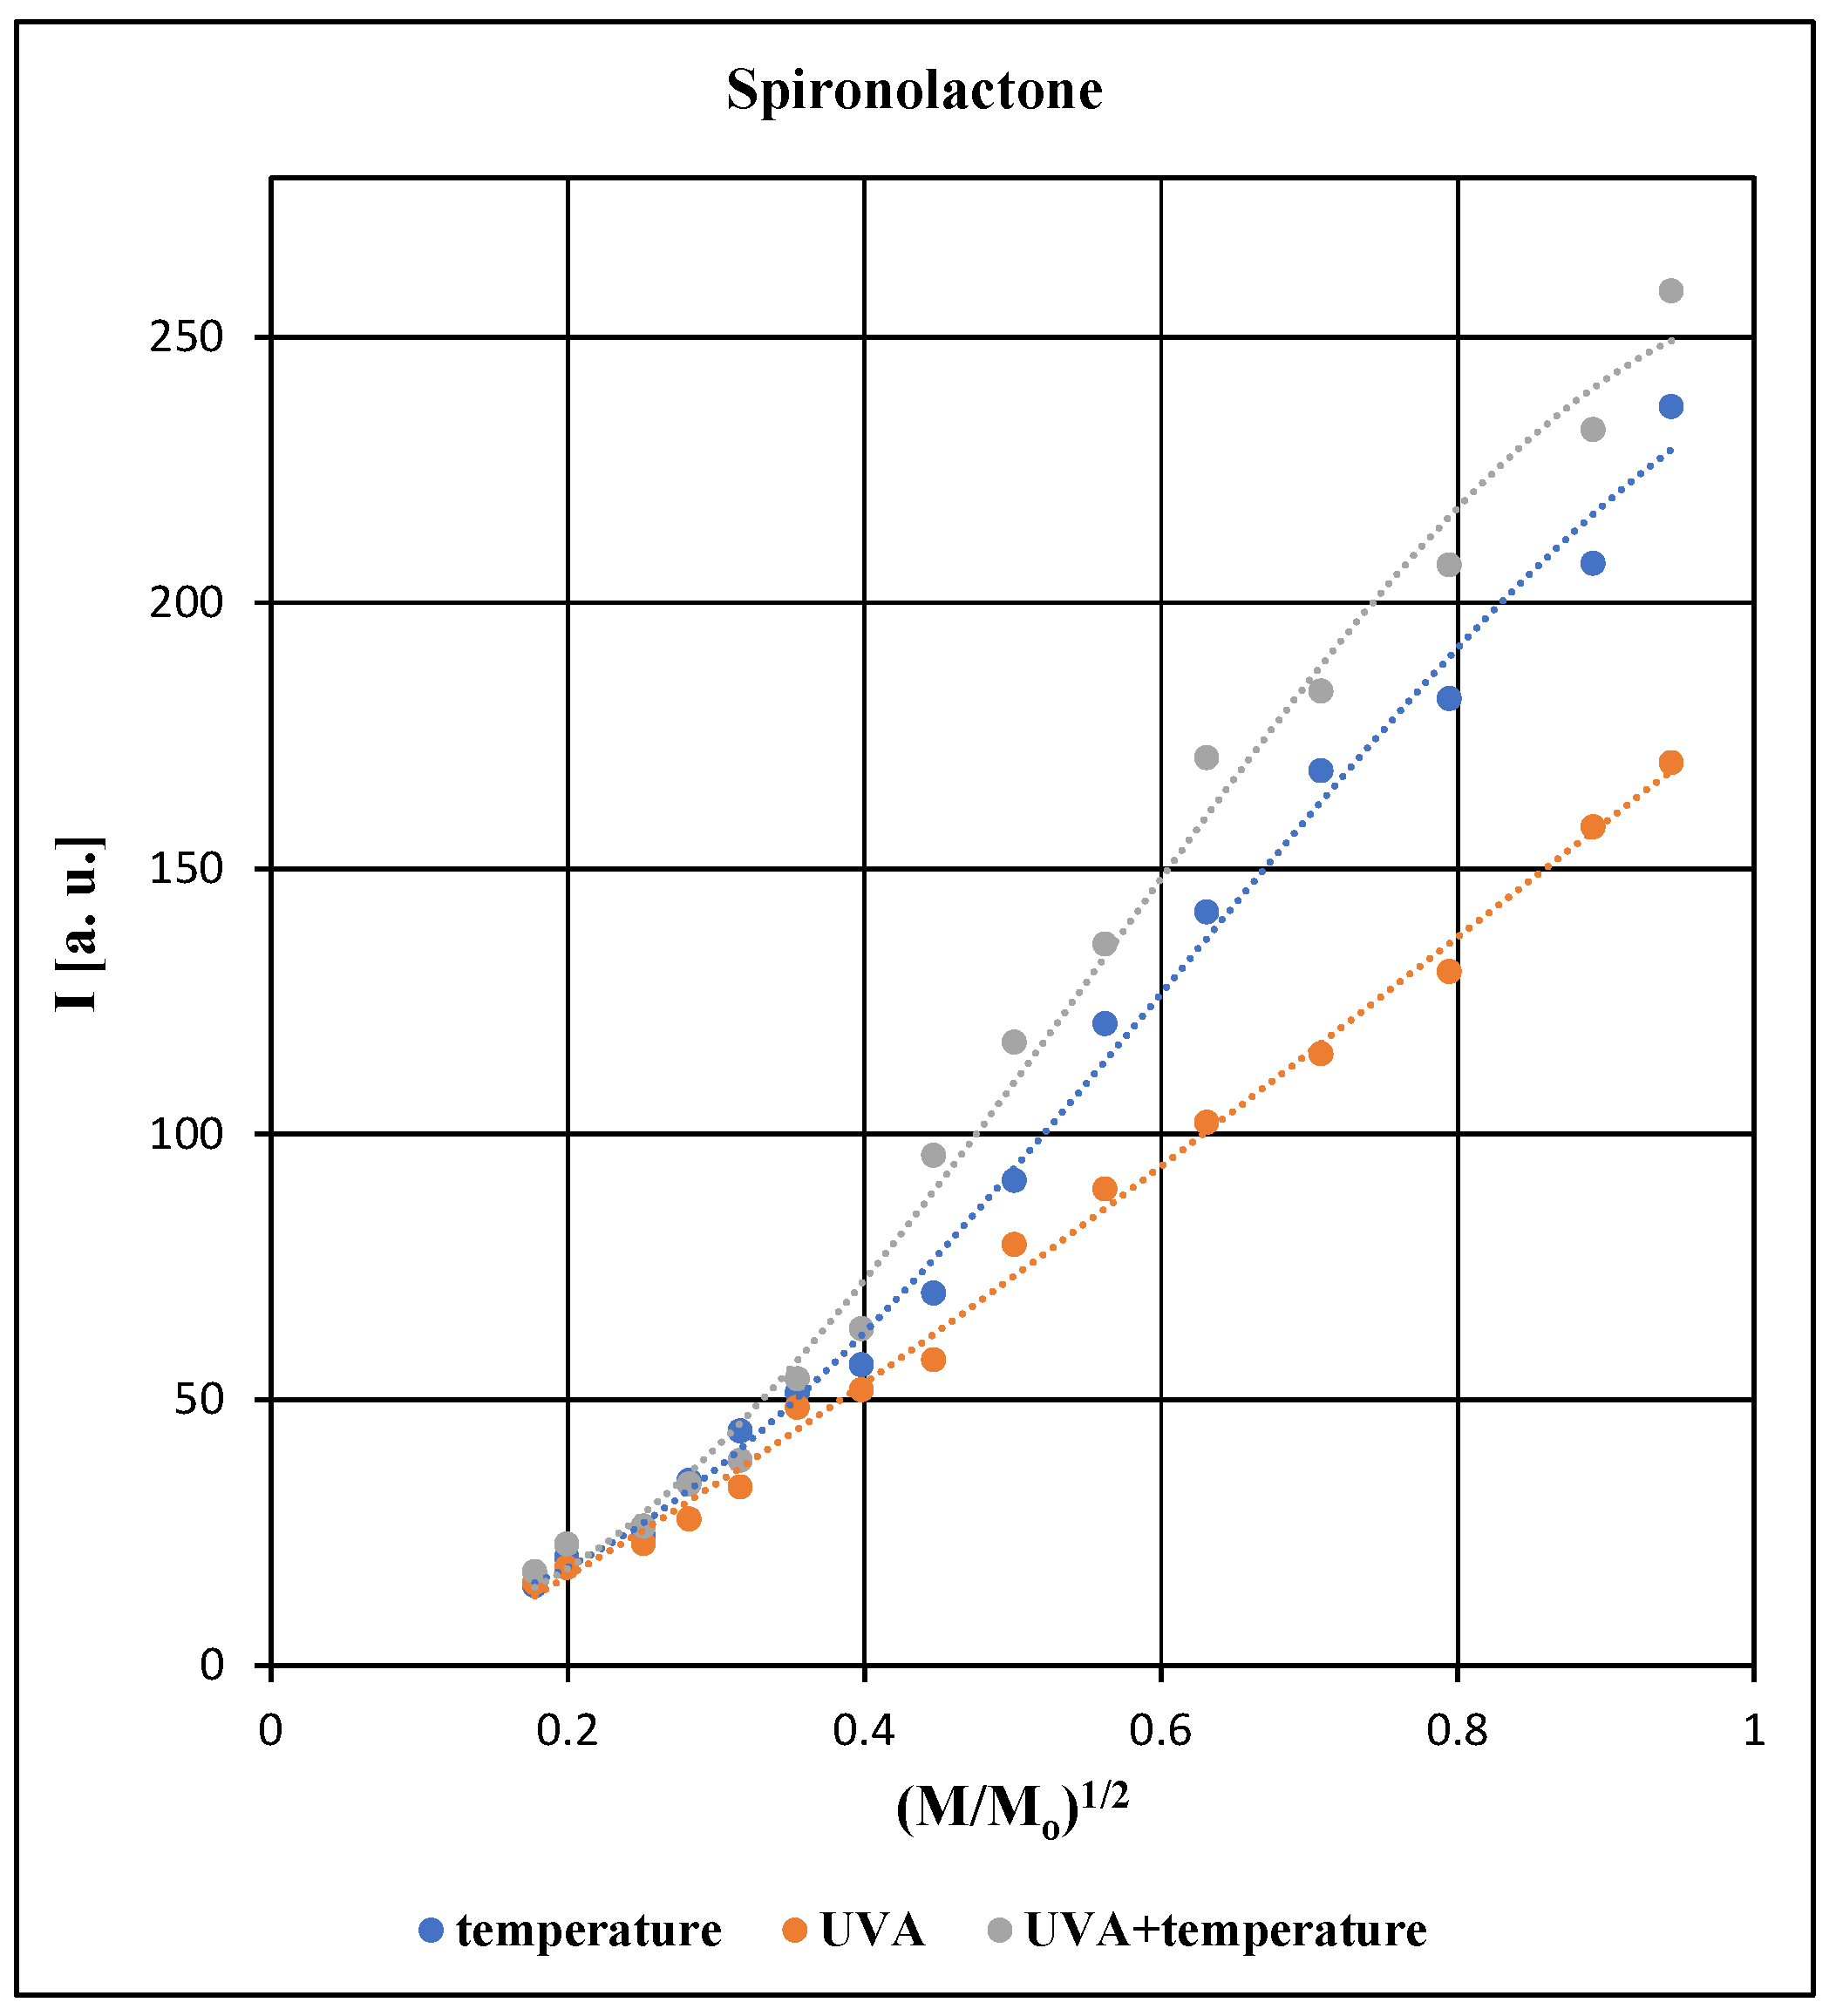
All EPR spectra of the tested pharmaceutical preparation containing spironolactone depend on the microwave power used during the measurements. The effect of microwave power on the amplitude (A), integral intensity (I) and linewidth (ΔBpp) of the EPR line of the spironolactone preparation exposed to individual physical factors is compared in Figure 5, Figure 6 and Figure 7.
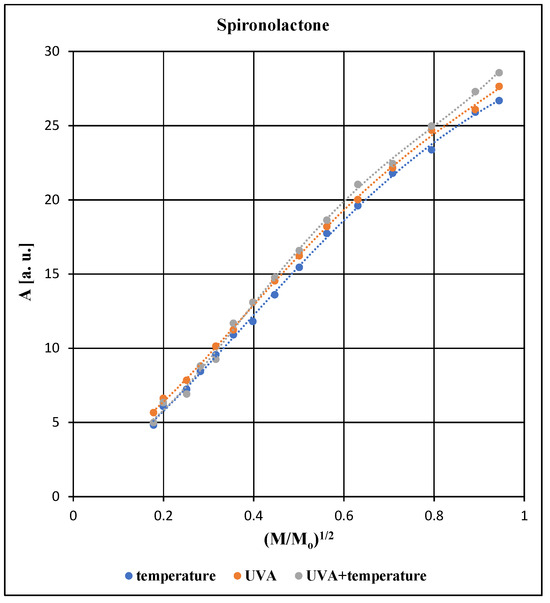
Figure 5.
Comparison of the effect of microwave power on the amplitude (A) of the EPR spectra of a preparation containing spironolactone that was exposed to a temperature 50 °C for 30 min, UVA radiation for 30 min, and UVA radiation for 30 min and then to temperature 50 °C for 30 min. M is the microwave power sent to the resonator during the EPR spectra measurements. Mo is the total microwave power generated by the klystron (70 mW).
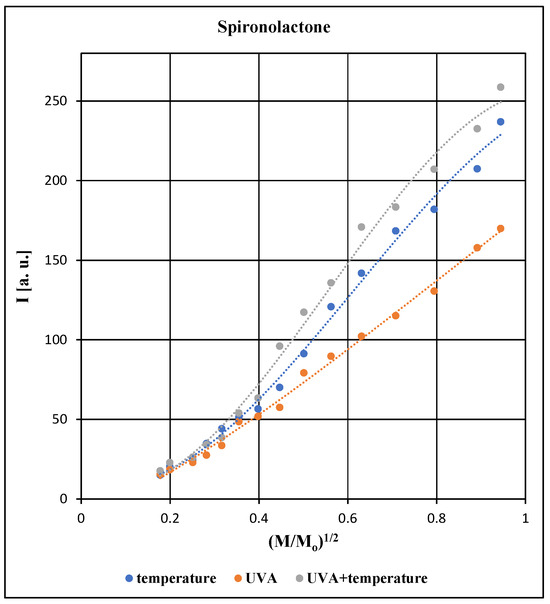
Figure 6.
Comparison of the effect of microwave power on the integral intensity (I) of the EPR spectra of a preparation containing spironolactone that was exposed to a temperature 50 °C for 30 min, UVA radiation for 30 min, and UVA radiation for 30 min and then to temperature 50 °C for 30 min. M is the microwave power sent to the resonator during the EPR spectra measurements. Mo is the total microwave power generated by the klystron (70 mW).
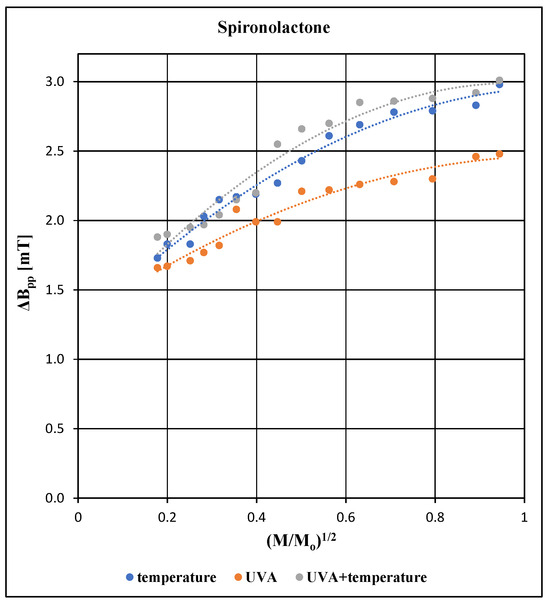
Figure 7.
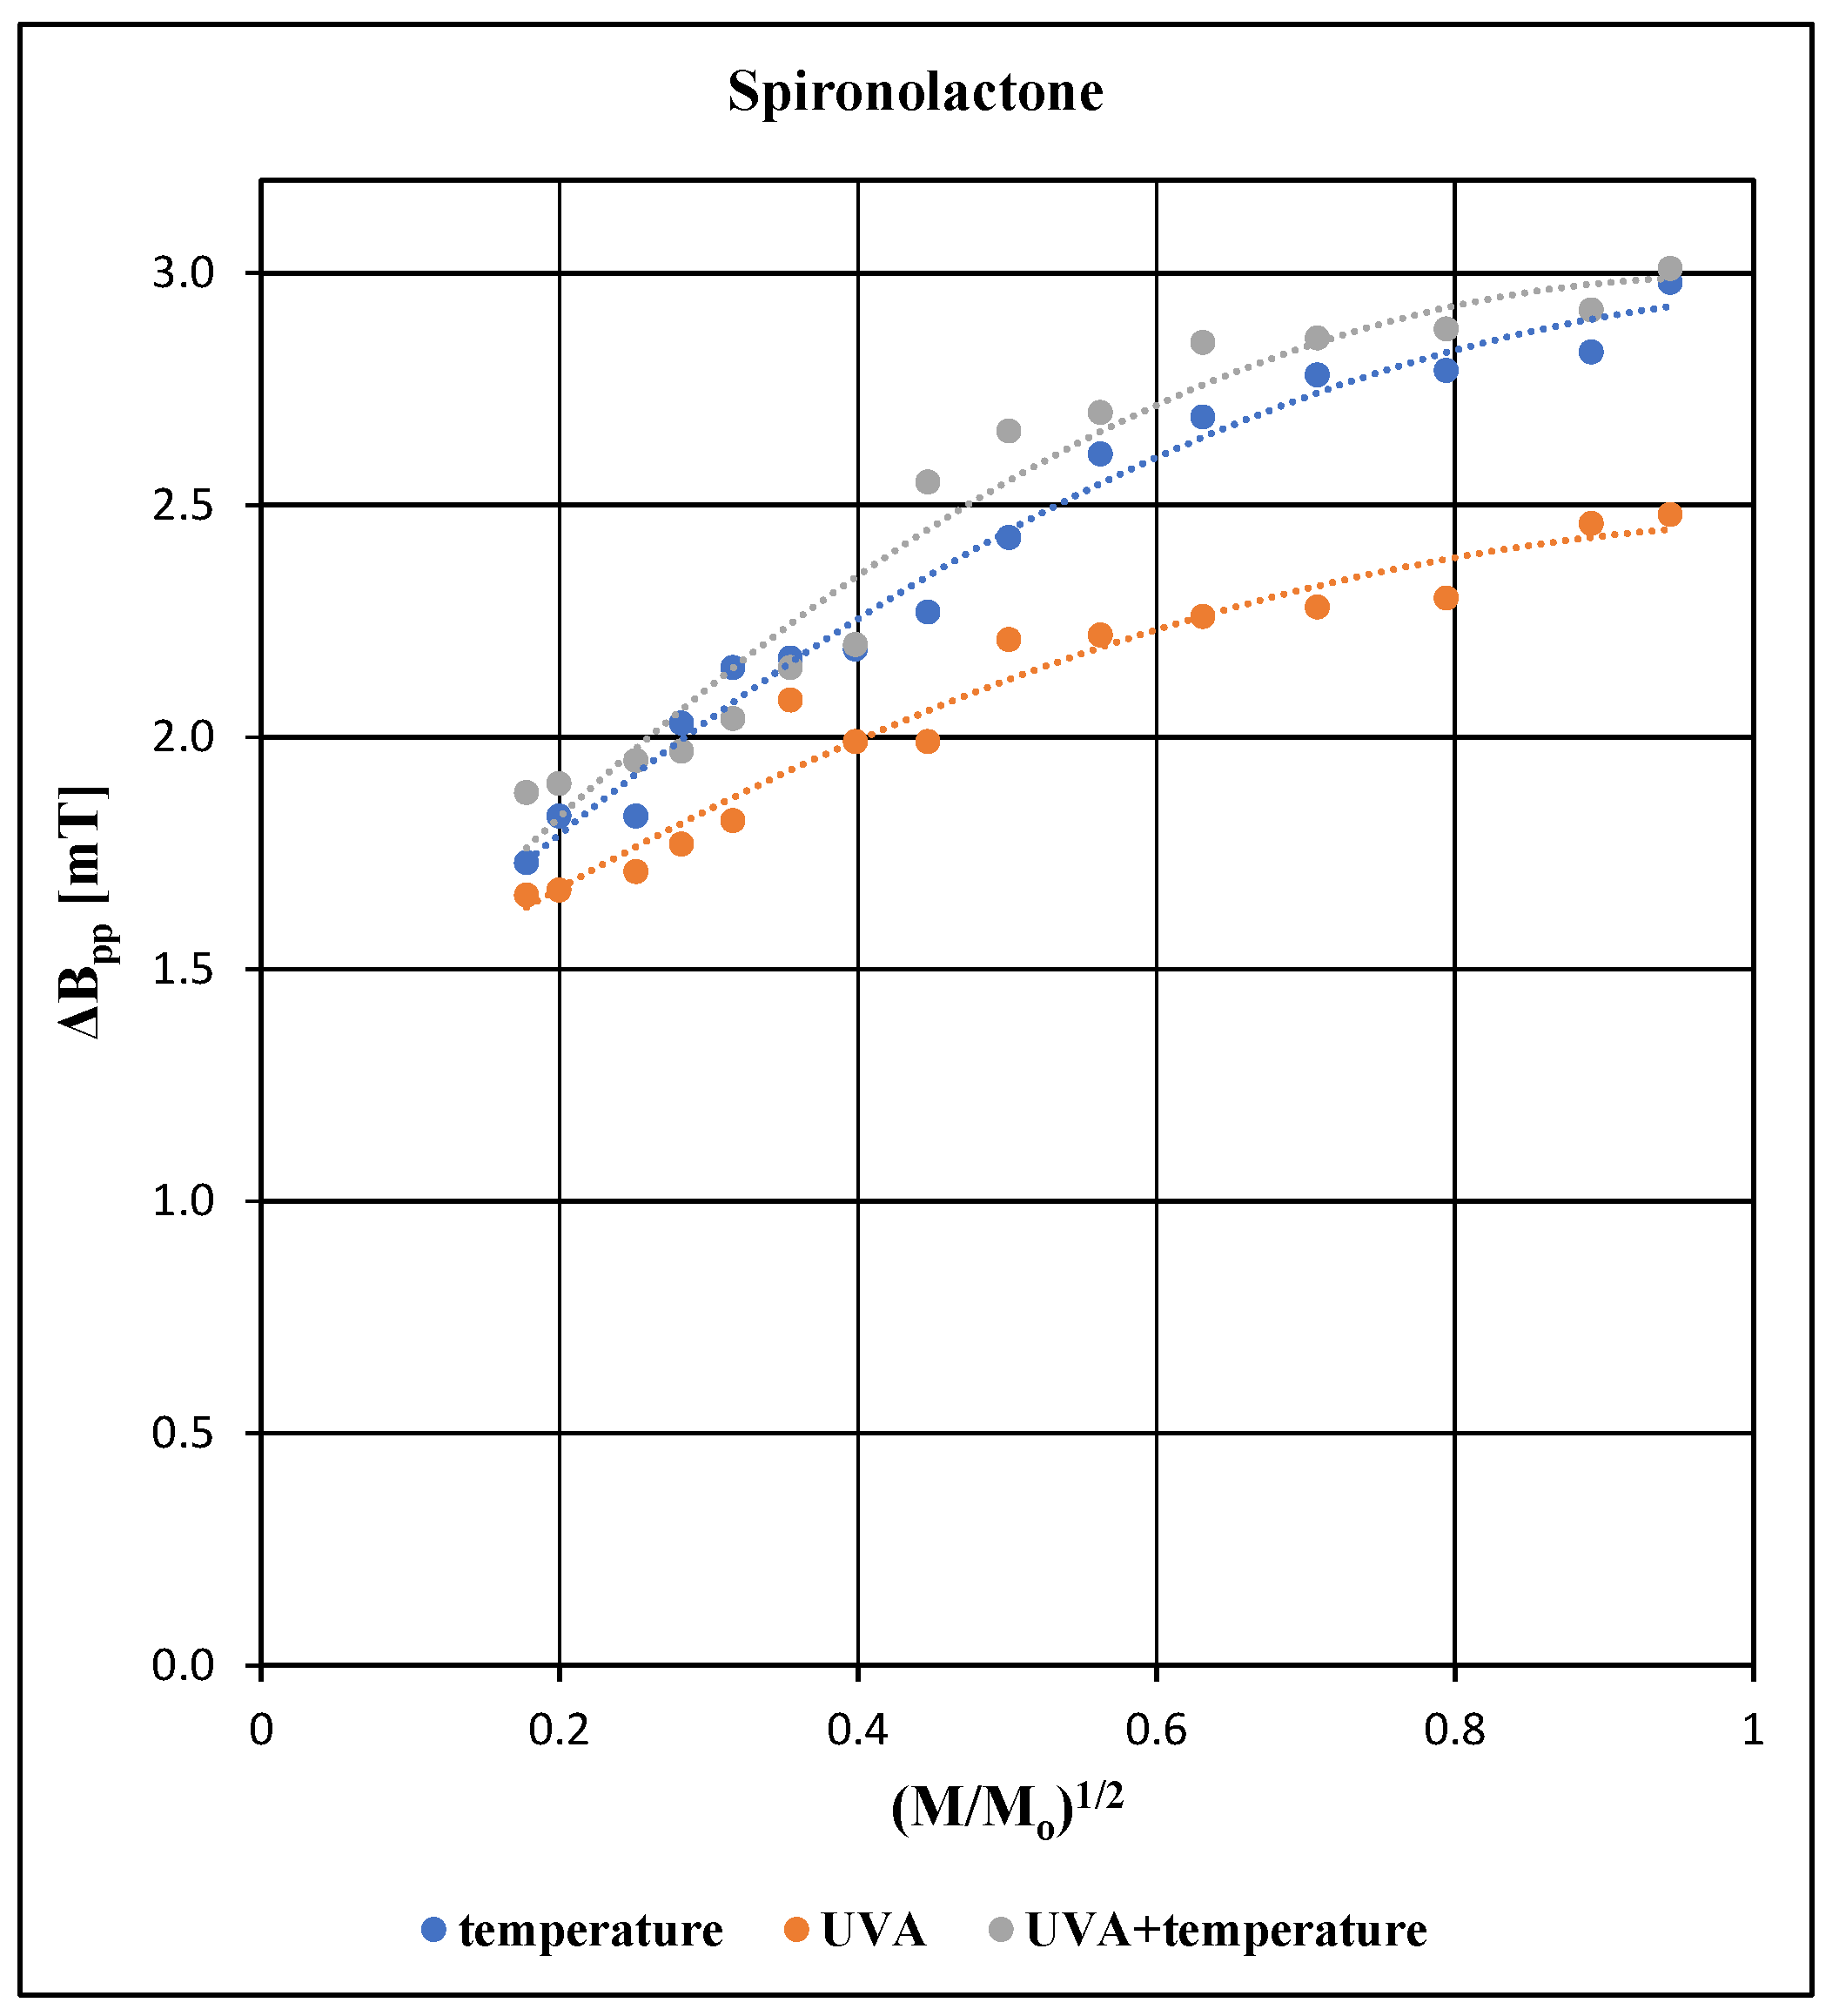
Comparison of the effect of microwave power on the linewidth (ΔBpp) of the EPR spectra of a preparation containing spironolactone that was exposed to a temperature 50 °C for 30 min, UVA radiation for 30 min, and UVA radiation for 30 min and then to temperature 50 °C for 30 min. M is the microwave power sent to the resonator during the EPR spectra measurements. Mo is the total microwave power generated by the klystron (70 mW).
The changes of amplitude (A) with increasing microwave power and the changes of integral intensity (I) with increasing microwave power depend on spin-lattice relaxation processes [18,19,20,21,22]. Spin-lattice relaxation processes involve the release of energy by excited unpaired electrons into the diamagnetic lattice of the preparation. If these processes occur quickly, the microwave saturation of EPR lines appear for higher microwave power levels than in the case of slow spin-lattice relaxation processes. Microwave saturation of EPR lines manifests itself as a decrease in the amplitude (A) value and a decrease in the integral intensity (I) value with the increasing microwave power. This drop in values appears from certain microwave power levels. The value of microwave power of the saturation effect is lower for the slow spin-lattice relaxation processes than for the fast spin-lattice relaxation processes. In the preparations examined in our work the decrease of amplitude (A) and decrease of integral intensity (I), were not observed (Figure 5 and Figure 6). This indicates that rapid spin-lattice relaxation processes occur in the tested pharmaceutical preparation.
For all samples tested with spironolactone, an increase in the amplitude (A), integral intensity (I) and linewidth (ΔBpp) of the EPR lines was observed with increasing microwave power (Figure 5, Figure 6 and Figure 7). The differences between amplitudes (A) and integral intensities (I) are higher for the higher microwave power levels (Figure 5 and Figure 6). Unpaired electrons of free radicals quickly interact with the diamagnetic network of the preparation regardless of the type of agent acting during its storage (Figure 5 and Figure 6). Differences in the linewidth values (ΔBpp) of the EPR lines (Figure 7) may indicate different structural changes in the preparation when it is exposed to the tested physical factors.
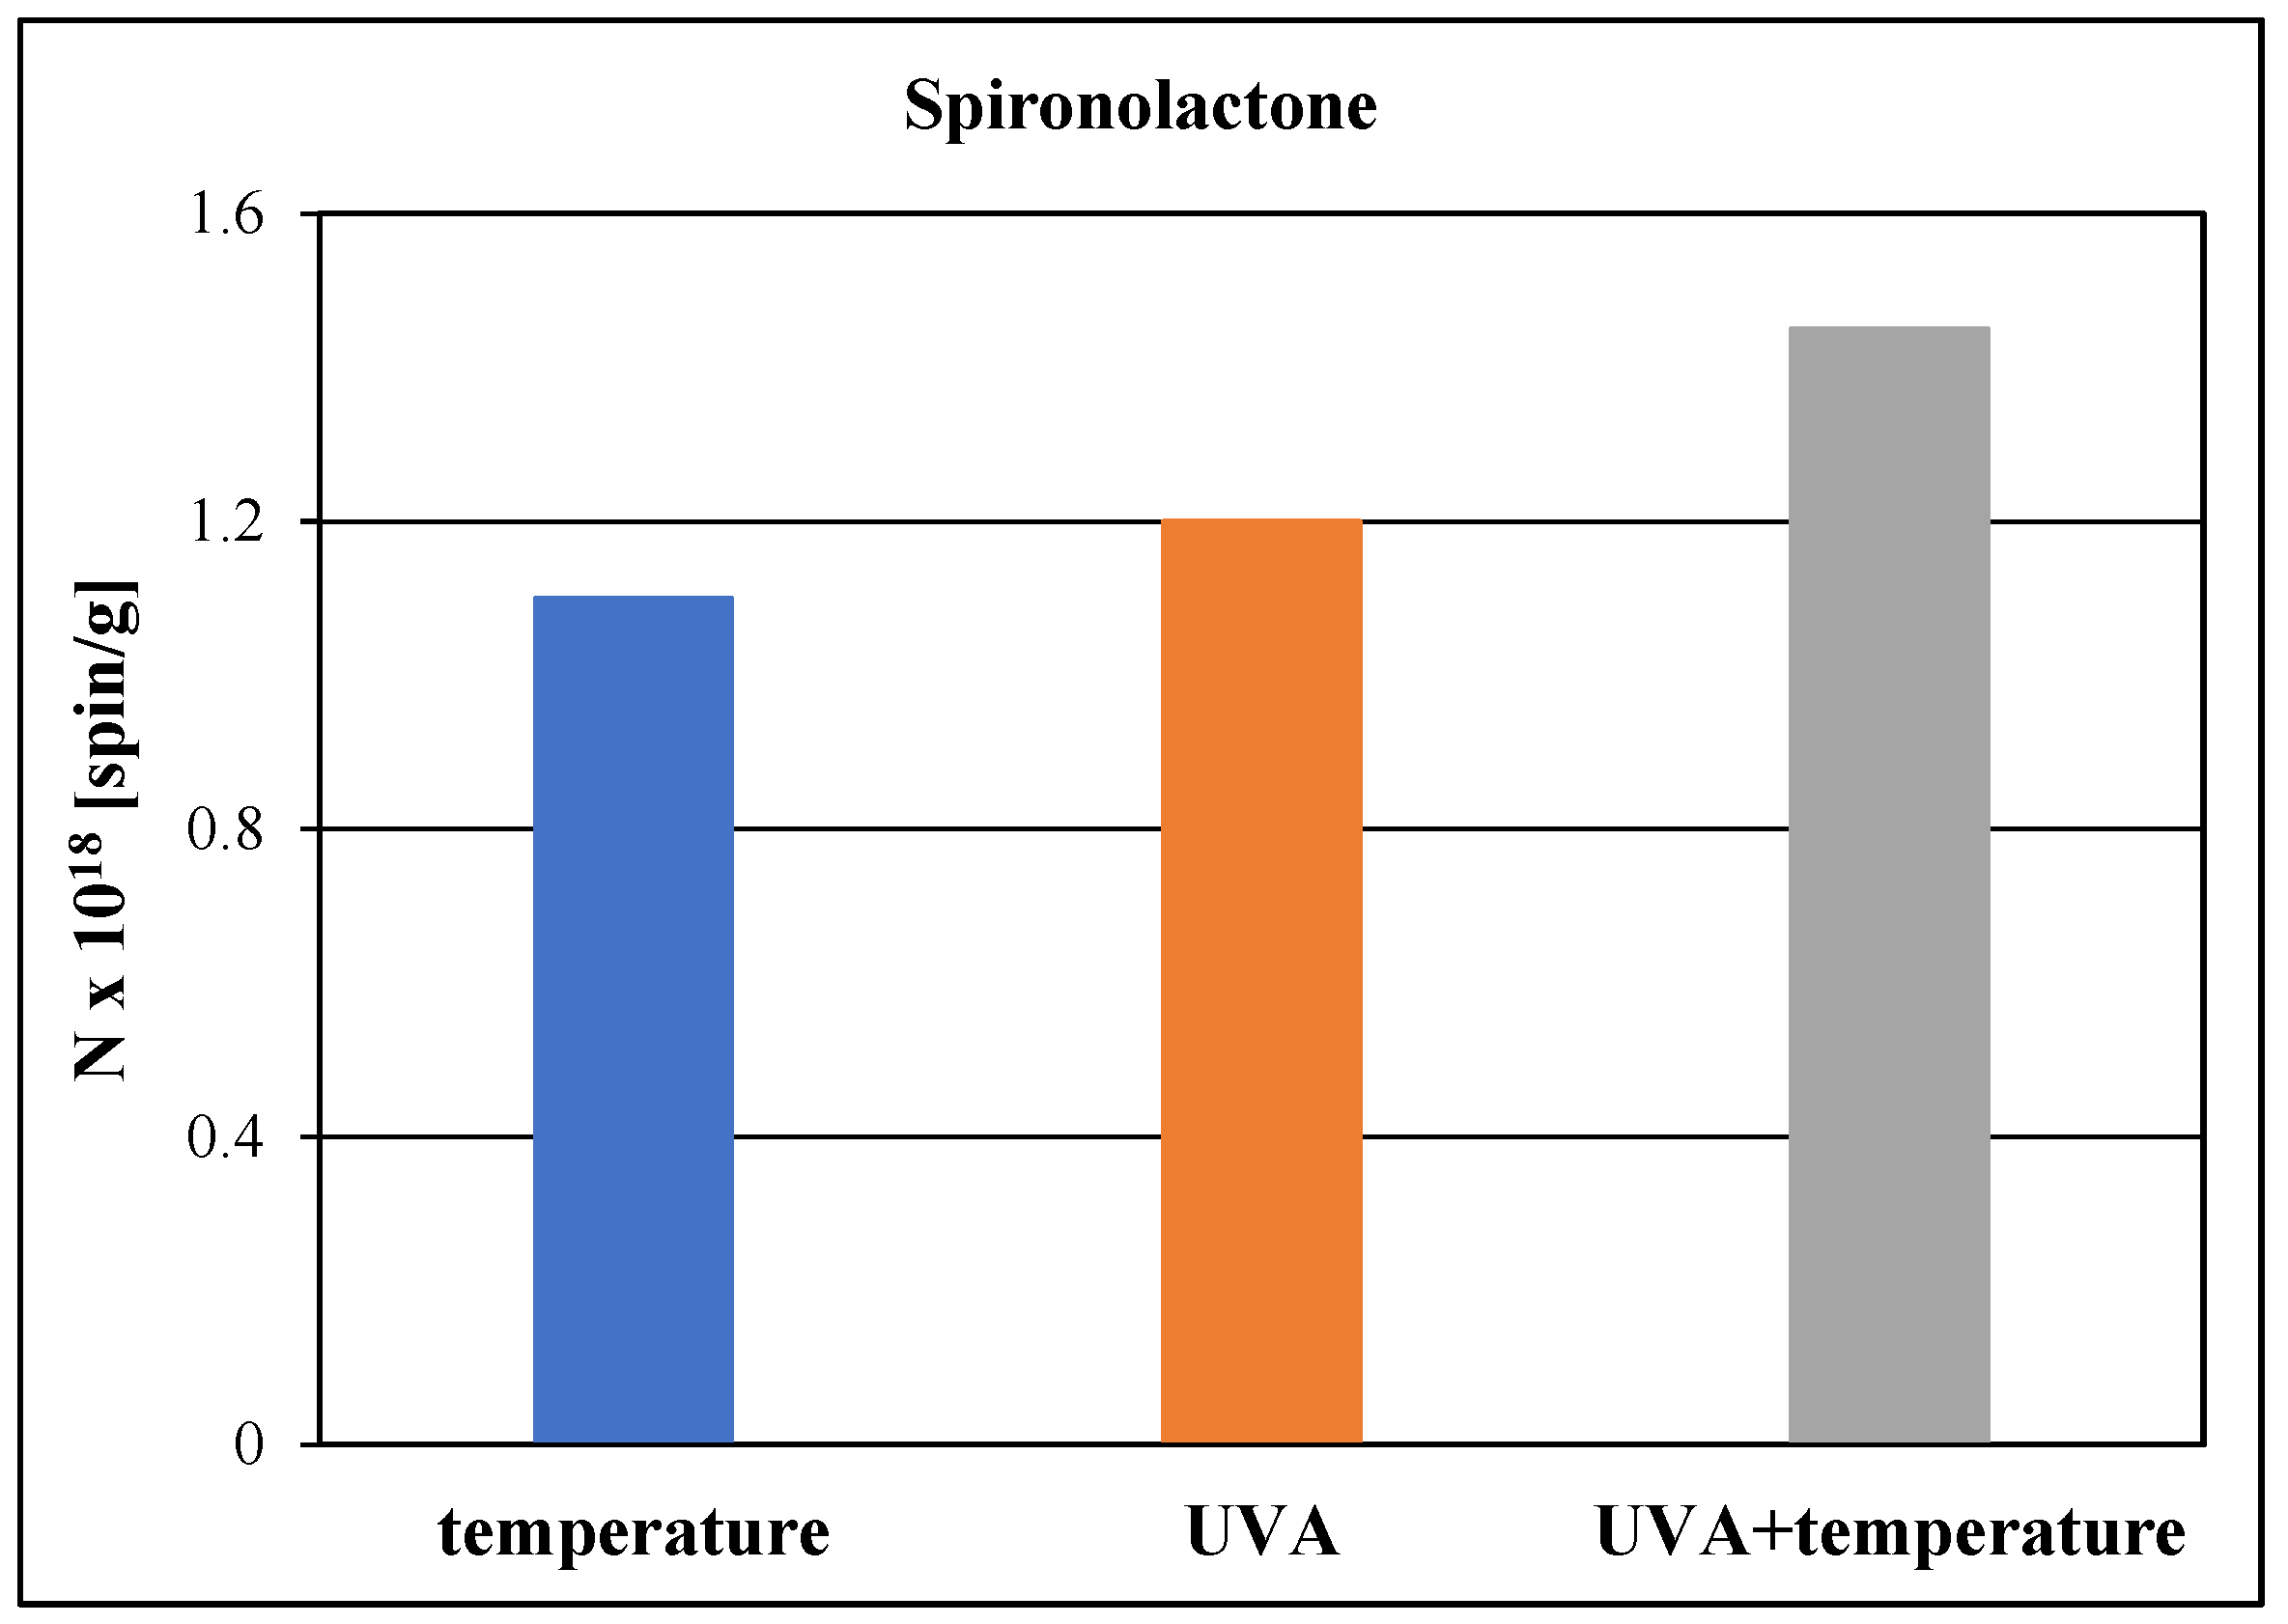
Figure 8 compares the content values (N) of the free radicals in a preparation containing spironolactone exposed to the temperature of 50 °C, UVA radiation, and UVA radiation and the higher temperature of 50 °C. The contents (N) of free radicals in the preparation containing spironolactone are of the order of 1018 [spin/g] (Figure 8). The highest content of (N) free radicals occurs in the preparation containing spironolactone exposed to UVA radiation and then exposed to the higher temperature of 50 °C. Similar, relatively lower, free radical content (N) values occur in the spironolactone preparation exposed to the temperature of 50 °C or exposed to UVA radiation alone.

Figure 8.
Comparison of free radical contents (N) in the preparation containing spironolactone exposed to the temperature of 50 °C for 30 min, UVA radiation for 30 min, and UVA radiation for 30 min and the temperature of 50 °C for 30 min. Contents of free radicals were determined using EPR spectra recorded at a microwave power (M) of 2.2 mW.
Free radical content (N) is proportional to integral intensity (I) [18,19,20,21,22]. Taking into account the integral intensities of the EPR lines recorded at a microwave power of 2.2 mW, differences in the content (N) of free radicals were demonstrated in the preparation subjected to the action of various physical factors. The integral intensity (I) of the EPR line of the preparation exposed to the higher temperature, after exposure to UVA radiation and the higher temperature, increased by 17.6% (Table 1 and Table 3). The integral intensity (I) of the EPR line of the preparation exposed to UVA radiation, after exposure to UVA radiation and the higher temperature, increased by 13.2% (Table 2 and Table 3). The highest content (N) of free radicals occurs in the preparation containing spironolactone exposed to UVA radiation and then exposed to the higher temperature of 50 °C. Similar, relatively lower, free radical content (N) values occur in the spironolactone preparation exposed to the temperature of 50 °C or exposed to UVA radiation.
This result provides information on the storage or transportation conditions of the spironolactone preparation that should be avoided. The harmful effect leading to the destruction of the chemical structure of the tested pharmaceutical preparation is demonstrated by the temperature of 50 °C and UVA radiation. In terms of free radical production, a preparation containing spironolactone is similarly sensitive to the temperatures of 50 °C and UVA radiation. The thermal factor and UVA radiation generate similar amounts of free radicals in the tested preparation (Figure 8). Exposing the preparation to UVA radiation and additionally increasing the temperature to 50 °C results in the formation of additional free radicals (Figure 8). Free radical content studies clearly indicate the sensitivity of the preparation to UVA radiation and thermal energy. The preparation containing spironolactone should not be exposed to these factors.
The measurements of the EPR spectra performed in this work with a microwave frequency of 9.3 GHz, in a wide range of microwave power levels, confirmed the usefulness of the analysis of the EPR spectra parameters amplitude (A), integral intensity (I) and linewidth (ΔBpp) in the study of free radicals formed in the pharmaceutical preparation containing spironolactone depending on storage conditions.
4. Conclusions
- 1.
- The EPR method has shown that all physical factors tested in this study, (a) higher temperature of 50 °C, (b) UVA radiation, and (c) UVA radiation and a higher temperature of 50 °C, cause the formation of free radicals in a pharmaceutical preparation containing spironolactone. During storage, the preparation containing spironolactone should be protected from temperatures 50 °C and from UVA radiation.
- 2.
- The highest number of free radicals occurs in the preparation containing spironolactone exposed to UVA radiation and then exposed to a higher temperature of 50 °C. The EPR spectra of the tested preparation stored under these conditions show the highest integral intensities (I) of the EPR lines.
- 3.
- Similar integral intensities (I) of the EPR lines were obtained for the preparation containing spironolactone exposed to a temperature of 50 °C or exposed to UVA radiation. In these cases, for the contents of free radicals in the preparation containing spironolactone, the integral intensities (I) of the EPR lines are lower than in the case of the preparation exposed to both UVA radiation and the higher temperature of 50 °C.
- 4.
- The changes in the amplitude (A) and integral intensity (I) of the EPR spectra with increasing microwave power indicate the occurrence of fast spin-lattice relaxation processes in the tested pharmaceutical preparation containing spironolactone exposed to the higher temperature of 50 °C, UVA radiation, and UVA radiation and then the temperature of 50 °C.
- 5.
- The usefulness of the analysis of EPR spectra parameters in the study of free radicals generated in pharmaceutical preparations, for example the preparation containing spironolactone, was confirmed.
Author Contributions
Conceptualization, B.P.; methodology, E.B., B.P., M.Z. and E.C.; formal analysis, E.B. and B.P.; investigation, E.B., B.P. and M.Z.; data curation, E.B.; writing—original draft preparation, E.B., B.P., M.Z. and E.C.; writing—review and editing, E.B., B.P., M.Z. and E.C.; and supervision, B.P. All authors have read and agreed to the published version of the manuscript.
Funding
This study was supported by the Medical University of Silesia in Katowice (Poland), partially grant No. BNW-1-104/K/4/F.
Data Availability Statement
The EPR data obtained in this study are available upon request from the authors.
Acknowledgments
We would like to thank Andrzej B. Więckowski from the Institute of Molecular Physics, the Polish Academy of Sciences in Poznań (Poland) and the Institute of Physics of the University in Zielona Góra, for the ultramarine.
Conflicts of Interest
The authors declare no conflicts of interest.
References
- Tejada, E.T.; Pérez, B.G.; Muner, D.S. Review of Drug Storage Conditions, A Case Report. Hosp. Pharm. 2022, 58, 252–254. [Google Scholar] [CrossRef] [PubMed]
- Shafaat, K.; Hussain, A.; Kumar, B.; Hasan, R.; Prabhat, P.; Yadav, V.K. An overview: Storage of pharmaceutical products. World J. Pharm. Pharm. Sci. 2014, 2, 2499–2515. [Google Scholar]
- Shultz, J.; Harvie, M.; McDonald, D.; Manley, J.; Cole, M. Standardizing the storage and labelling of medications: Part 2. Can. J. Hosp. Pharm. 2007, 60, 101–104. [Google Scholar]
- World Health Organization. Good storage and distribution practices for medical products. WHO Drug Inf. 2019, 33, 195–225. [Google Scholar]
- Bajaj, S.; Singla, D.; Sakhuja, N. Stability testing of pharmaceutical products. J. Appl. Pharm. Sci. 2012, 2, 129–138. [Google Scholar]
- Bartosz, G. Druga Twarz Tlenu. Wolne Rodniki w Przyrodzie; Wydawnictwo Naukowe PWN: Warszawa, Poland, 2021. [Google Scholar]
- Qazi, M.A.; Khurshid, I.; Molvi, K.I. Free Radicals and their Management. Am. J. Pharm. Health Res. 2018, 6, 1–10. [Google Scholar] [CrossRef]
- McCord, J.M. The evolution of free radicals and oxidative stress. Am. J. Med. 2000, 108, 652–659. [Google Scholar] [CrossRef]
- Gutowski, M.; Kowalczyk, S. A study of free radical chemistry: Their role and pathophysiological significance. Acta Biochim. Pol. 2013, 60, 1–16. [Google Scholar] [CrossRef]
- Bergendi, L.; Beneš, L.; Ďuračková, Z.; Ferenčik, M. Chemistry, physiology and pathology of free radicals. Life Sci. 1999, 65, 1865–1874. [Google Scholar] [CrossRef]
- Phaniendra, A.; Jestadi, D.B.; Periyasamy, L. Free Radicals: Properties, Sources, Targets, and Their Implication in Various Diseases. Ind. J. Clin. Biochem. 2015, 30, 11–26. [Google Scholar] [CrossRef]
- Chandimali, N.; Bak, S.G.; Park, E.H.; Lim, H.-J.; Won, Y.-S.; Kim, E.-K.; Park, S.-I.; Lee, S.J. Free radicals and their impact on health and antioxidant defenses: A review. Cell Death Discov. 2025, 11, 19. [Google Scholar] [CrossRef] [PubMed]
- Ismail, R.; Tannous, J.H. Free radical quantification in chemical systems: Challenges and future perspectives. Chem. Eng. Res. Des. 2024, 210, 97–111. [Google Scholar] [CrossRef]
- Alkadi, H. A Review on free radicals and antioxidants. Infect. Disord. Drug Targets 2020, 20, 16–26. [Google Scholar] [PubMed]
- Pambuk, C.I.A.; Muhammad, F.M. Free Radicals: The types generated in biological system. MOJ Cell Sci. Rep. 2018, 5, 72–73. [Google Scholar] [CrossRef]
- Morrish, A.H. Fizyczne Podstawy Magnetyzmu; PWN: Warszawa, Poland, 1970. [Google Scholar]
- Eaton, G.R.; Eaton, S.S.; Salikhov, K.M. (Eds.) Foundations of Modern EPR. World Scientific; World Scientific: Singapore; Hackensack, NJ, USA; London, UK; Hong Kong, China, 1998. [Google Scholar]
- Stankowski, J.; Hilczer, W. Wstęp do Spektroskopii Rezonansów Magnetycznych; Wydawnictwo Naukowe PWN: Warszawa, Poland, 2005. [Google Scholar]
- Dyrek, K. Elektronowy rezonans paramagnetyczny. In Fizyczne Metody Badań w Biologii, Medycynie i Ochronie Środowiska; Hrynkiewicz, A.Z., Rokita, E., Eds.; Wydawnictwo Naukowe PWN: Warszawa, Poland, 2013; pp. 136–159. [Google Scholar]
- Wertz, J.E.; Bolton, J.R. Electron Spin Resonance. Theory and Practical Applications; Springer: New York, NY, USA; London, UK, 1986. [Google Scholar]
- Weil, J.A.; Bolton, J.R. Electron Paramagnetic Resonance: Elementary Theory and Practical Applications, 2nd ed.; John Wiley & Sons: New York, NY, USA, 2007. [Google Scholar]
- Pilawa, B.; Ramos, P. Spektroskopia EPR. Ćwiczenia Dla Studentów Analityki Medycznej i Medycyny; Śląski Uniwersytet Medyczny w Katowicach: Katowice, Poland, 2017. [Google Scholar]
- Zejc, A.; Gorczyca, M. Chemia Leków: Podręcznik Dla Studentów Farmacji i Farmaceutów; Wydawnictwo Lekarskie PZWL: Warszawa, Poland, 2013. [Google Scholar]
- Janiec, W. Kompendium Farmakologii; Wydawnictwo Lekarskie PZWL: Warszawa, Poland, 2012. [Google Scholar]
- Kostowski, W.; Herman, Z. Farmakologia: Podstawy Farmakoterapii; Wydawnictwo Lekarskie PZWL: Warszawa, Poland, 2010. [Google Scholar]
- Janiec, W. Farmakodynamika: Podręcznik Dla Studentów Farmacji; Wydawnictwo Lekarskie PZWL: Warszawa, Poland, 2013. [Google Scholar]
- Grześk, G.; Bogdan, M.; Kubica, A.; Demidowicz, K.; Sinkiewicz, W. Zastosowanie antagonistów receptora dla aldosteronu w leczeniu niewydolności serca. Chor. Serca I Naczyń 2005, 2, 29–32. [Google Scholar]
- Bury, K.; Nessler, J. Miejsce diuretyków w leczeniu niewydolności serca w świetle aktualnych wytycznych. Przegl. Lek. 2016, 73, 424–429. [Google Scholar]
- Raszeja-Wanic, B.; Wanic-Kossowska, M. Leki moczopędne. Arter. Hypertens. 2007, 11, 1–31. [Google Scholar]
- Ernst, M.; Moser, M. Stosowanie leków moczopędnych u pacjentów z nadciśnieniem tętniczym. N. Engl. J. Med. 2009, 361, 2153–2164. [Google Scholar] [CrossRef]
- Filipiak, K.; Sokólski, M. Leki hamujące układ renina–angiotensyna–aldosteron—Porównanie grup leków i ich wskazań terapeutycznych. Chor. Serca I Naczyń 2017, 14, 287–290. [Google Scholar]
- Kapur, G.; Valentini, R.P.; Imam, A.A.; Mattoo, T.K. Treatment of Severe Edema in Children with Nephrotic Syndrome with Diuretics Alone—A Prospective Study. Clin. J. Am. Soc. Nephrol. 2009, 4, 907–913. [Google Scholar] [CrossRef]
- Lainscak, M.; Pelliccia, F.; Rosano, G.; Vitale, C.; Schiariti, M.; Greco, C.; Speziale, G.; Gaudio, C. Safety profile of mineralo-corticoid receptor antagonists: Spironolactone and eplerenone. Int. J. Cardiol. 2015, 200, 25–29. [Google Scholar] [CrossRef]
- Agarwal, R. Spironolactone and chlorthalidone—Old drugs, new uses—But approach with caution. Nephrol. Dial. Transplant. 2022, 37, 407–408. [Google Scholar] [CrossRef] [PubMed]
- Lim, H.; Hamdani, W.N. Spironolactone versus Eplerenone in Patients with Resistant Hypertension: A Systematic Review and Indirect Meta-analysis. J. Asian Pac. Soc. Cardiol. 2024, 3, e12. [Google Scholar] [CrossRef]
- Więckowski, A.B.; Wojtowicz, W.; Śliwa-Nieściór, J. Temperature dependence of the EPR linewidth of ultramarine blue. Magn. Reson. Chem. 1999, 37, S150–S153. [Google Scholar] [CrossRef]
- Kowalak, S.; Jankowska, A.; Zeidler, S.; Wieckowski, A.B. Sulfur radicals embedded in various cages of ultramarine analogs prepared from zeolites. J. Solid State Chem. 2007, 180, 1119–1124. [Google Scholar] [CrossRef]
- Kowalak, S.; Jankowska, A.; Mikołajska, E. Using of zeolite LOS for preparation of sulfur pigments. Microporous Mesoporous Mater. 2010, 127, 126–132. [Google Scholar] [CrossRef]
Disclaimer/Publisher’s Note: The statements, opinions and data contained in all publications are solely those of the individual author(s) and contributor(s) and not of MDPI and/or the editor(s). MDPI and/or the editor(s) disclaim responsibility for any injury to people or property resulting from any ideas, methods, instructions or products referred to in the content. |
© 2025 by the authors. Licensee MDPI, Basel, Switzerland. This article is an open access article distributed under the terms and conditions of the Creative Commons Attribution (CC BY) license (https://creativecommons.org/licenses/by/4.0/).