Article

Response Surface Methodology-Based Optimization of AZ91 Composites Reinforced with Short Carbon Fibers for Enhanced Mechanical and Wear Properties

1
Department of Mechanical Engineering, College of Engineering, Imam Mohammad Ibn Saud Islamic University, Riyadh 11432, Saudi Arabia
2
Department of Metallurgical and Materials Engineering, Faculty of Petroleum and Mining Engineering, Suez University, Suez 43221, Egypt
3
Canal High Institute of Engineering and Technology, Suez 43512, Egypt
4
Department of Civil and Environmental Engineering, College of Engineering and Computers, Umm Al-Qura University, Al-Lith 28425, Saudi Arabia
5
Department of Materials Science & Engineering, Texas A&M University, College Station, TX 77843, USA
6
Mechanical Department, Faculty of Technology and Education, Suez University, Suez 43221, Egypt
*
Authors to whom correspondence should be addressed.
Processes 2025, 13(6), 1697; https://doi.org/10.3390/pr13061697
Submission received: 29 April 2025 / Revised: 22 May 2025 / Accepted: 26 May 2025 / Published: 28 May 2025
(This article belongs to the Special Issue Fiber-Reinforced Composites: Latest Advances and Interesting Research)

Abstract

:
This study aims to enhance the mechanical and wear properties of AZ91 magnesium alloy by reinforcing it with 23 vol.% short carbon fibers (SCFs) aligned in normal (AZ91C-N) and parallel (AZ91C-P) orientations via squeeze-casting. The microstructure and elemental distribution maps were analyzed using an advanced SEM-EDS system. A response surface methodology (RSM) based on a Face-Centered Composite Design (FCCD) was employed to optimize the properties under varying temperature (20–300 °C) and wear load (1–5 N) conditions. The ultimate compressive strength (UCS), yield strength (YS), reduction in height at fracture (Fr), reduction in height at maximum stress (Sr), volume loss, and wear rate were analyzed and optimized. ANOVA confirmed the significant influence of the experimental parameters. A statistical model was developed, with validation showing deviations less than 0.05. The optimized conditions resulted in a UCS of 253 MPa, a YS of 193 MPa, an Fr of 26.1%, an Sr of 21.7%, a volume loss of 0.066 cm3, and a wear rate of 840 cm3/m. The worn surface and surface roughness were also investigated and discussed. The orientation of SCFs significantly influenced wear resistance and surface roughness. This study demonstrates the effectiveness of RSM in optimizing AZ91-SCF composites for high-performance applications.

1. Introduction

Magnesium (Mg) alloys, which are recognized as among the lightest structural metals, are extensively utilized in the automotive, aerospace, and sports industries [1,2,3,4,5,6,7]. AZ91 Mg alloy is recognized for its good vibration-damping capabilities and high strength-to-weight ratio, establishing it as the most prevalent and extensively utilized series of Mg alloys [8,9,10,11]. However, the mechanical strength and wear resistance of AZ91 Mg alloy are insufficient to meet the growing demands of the aerospace and lightweight equipment industries, creating a pressing need to develop advanced Mg-based composites with enhanced performance [12]. The mechanical properties of Mg-based composites are significantly influenced by the type, quantity, intrinsic characteristics, and alignment of the reinforcements. Among the reinforcements, carbon fibers are particularly prominent due to their substantial impact on the directional strength and structural stability of the composites. Furthermore, the processing method and its control parameters play a pivotal role in determining the overall performance of the fabricated composites [13,14]. Among the different production methods, squeeze-casting techniques are widely used worldwide to manufacture Mg metal matrix composites (Mg-MMCs). This method is favored, as it combines the benefits of both forging and casting processes, enabling high-quality mass production at a low cost. Additionally, squeeze-casting allows for the production of complex structural parts with minimal casting defects, a short process time, and overall cost efficiency [15,16,17,18]. However, several attempts have been made to incorporate carbon reinforcements into the AZ91 matrix alloy to produce composite materials using alternative production methods [19,20,21]. Gu et al. [19] fabricated AZ91-based composites using a pressurized liquid metal infiltration process that incorporated both coated and uncoated carbon fiber fabric as reinforcement. Their results showed that the coated carbon fiber/AZ91 composite exhibited superior damping capacity at low temperatures compared to the uncoated version. In fact, this study focused on interface design through carbon coating to enhance damping properties but was limited to low-temperature applications (≤170 °C) and did not explore the mechanical–tribological performance. Also, Kandemir et al. [20] investigated how the length (100 and 500 μm) and content (2.5 and 5.0 wt.%) of recycled short carbon fibers (RSCFs) affected the microstructure and mechanical properties of RSCFs/AZ91 composites produced using stir-casting and hot extrusion. They found that aligned RSCFs refined the alloy’s grains and intermetallic phases. Composites with 2.5 wt.% RSCFs showed increased hardness (16–20%) and yield strength (5–15%) but decreased ductility. Increasing the RSCF content to 5.0 wt.% negatively impacted the strength and further reduced the ductility due to fiber clustering and micro-cracks. Additionally, RSCF reinforcement did not improve creep resistance. The shortcoming of this work is that it examined extruded composites with low fiber content (≤5 wt.%), but their processing led to fiber breakage and offered no control over fiber orientation. Chen et al. [21] developed a liquid–solid extrusion using a vacuum pressure infiltration process to fabricate SCF-reinforced AZ91D parts with complex shapes for automotive applications. The produced composite exhibited a compressive strength of 487 MPa, representing a 40% increase over the AZ91D alloy (335 MPa), although with reduced compressive strain (half that of AZ91D). The fiber orientation significantly influenced the load-bearing capacity, with fibers parallel to the shear direction outperforming perpendicular ones. Peng et al. [11] used molecular dynamics (MD) simulations to explore the effect of monolayer graphene (1LG) orientation on the mechanical properties of AZ91/1LG Mg composites under uniaxial tension. The results revealed that both Young’s modulus and tensile strength decrease as the 1LG orientation angle increases. Specifically, orientation angles of 0–10° improve these properties, with a 21.7% increase in Young’s modulus and a 19.7% increase in tensile strength at 0°. In contrast, angles of 20–90° reduce these properties. While the authors conducted MD simulations to demonstrate graphene orientation effects, their work remained theoretical, lacking experimental validation of the predicted bulk composite properties. Alrasheedi et al. [22] investigated the low-cycle and high-cycle fatigue behavior of AZ91 alloy reinforced with a high-volume fraction of SCFs at 20 °C and 250 °C, targeting truck piston applications. Their S–N curves revealed that the AZ91/SCF composite exhibited a significantly higher fatigue strength of 55 MPa under high-cycle fatigue conditions at 250 °C, compared to the 37 MPa observed for the unreinforced AZ91 matrix alloy. Beniyel et al. [23], using response surface methodology (RSM) with a Box–Behnken design and genetic algorithm optimization, investigated how load, sliding distance, and velocity affect the wear behavior of an AZ91D-Mg alloy. They found that the wear rate increased proportionally with increasing load, sliding distance, and velocity. Based on the abovementioned literature, the performance of AZ91-based composites is significantly influenced by key factors such as the fiber–matrix interface design, fiber orientation, volume fraction, and manufacturing techniques. These parameters govern the homogeneity of reinforcement distribution and the optimization of mechanical properties in both normal and parallel directions relative to the reinforcement plane. Given the growing applications of these composites in aerospace and transportation industries, these processing parameters remain a focal point of ongoing research. RSM and other theoretical optimization approaches have been widely employed to refine processing parameters for diverse materials [24,25,26,27,28,29]. For instance, Der et al. [28] demonstrated the critical role of precision laser cutting in optimizing the manufacturing of thermoplastic-based thermal management systems, highlighting how parameter selection (e.g., power and speed) significantly influences material performance. Their multi-criteria decision-making (MCDM) approach, which combined experimental analysis with SWARA-weighted optimization, established that polypropylene cut at 90 W and 15 mm/s delivered superior results. This methodology underscores the broader applicability of systematic parameter optimization in material processing. Huang et al. [29] used a 3 kW fiber laser to apply CoCrCuFeNi high-entropy alloy coatings to 45 steel. The research systematically examined how laser power, scanning speed, and powder feed rate affect the coating’s shape, dilution, hardness, and RSM. The goal was to find the optimal processing conditions for coating with a high shape ratio, high maximum hardness, and a dilution rate between 10% and 20%. The study determined that a laser power of 773.65 W, a scanning speed of 5 mm/s, and a powder feed rate of 15 g/min yielded the desired coating properties, specifically, a shape ratio of 5.07, a dilution rate of 14.29%, and a microhardness of 186.8 HV. The accuracy of the predicted values was confirmed through validation experiments, with errors remaining below 10%.
Based on the introduction above and in light of the existing literature, it is evident that AZ91 Mg alloy and its composites demonstrate significant potential for lightweight applications in aerospace and transportation industries. However, critical challenges remain in optimizing their performance under combined mechanical and tribological loading conditions across operational temperature ranges. Previous research has predominantly examined isolated factors, such as processing techniques, reinforcement types, fiber–matrix interface characteristics, and volume fraction, often without developing a framework to integrate these parameters for composite performance. Furthermore, determining how controlled fiber orientation affects surface roughness and wear behavior, especially at high SCF volume fractions (23%), remains an area of interest that needs to be explored. Thus, this study directly addresses these critical knowledge gaps by implementing an integrated optimization methodology that systematically examines the interdependent relationships among processing parameters, temperature-dependent mechanical behavior, and wear performance characteristics.
The novelty of the current study is derived from three key advancements in the field of magnesium matrix composites: (1) the development of a squeeze-casting technique that enables the precise control of short carbon fiber (SCF) orientation (parallel/normal) at an industrially viable 23 vol.%, overcoming the fiber breakage and porosity limitations of conventional extrusion/stir-casting methods; (2) a systematic investigation, for the first time, of the combined mechanical–wear performance of AZ91/SCF composites across a broad temperature range (20–300 °C), addressing a critical knowledge gap for high-temperature applications in the aerospace and automotive industries; and (3) the integration of RSM with 3D surface topography analysis to establish quantitative relationships among SCF alignment, surface roughness, and wear resistance, yielding a predictive framework for composite design.
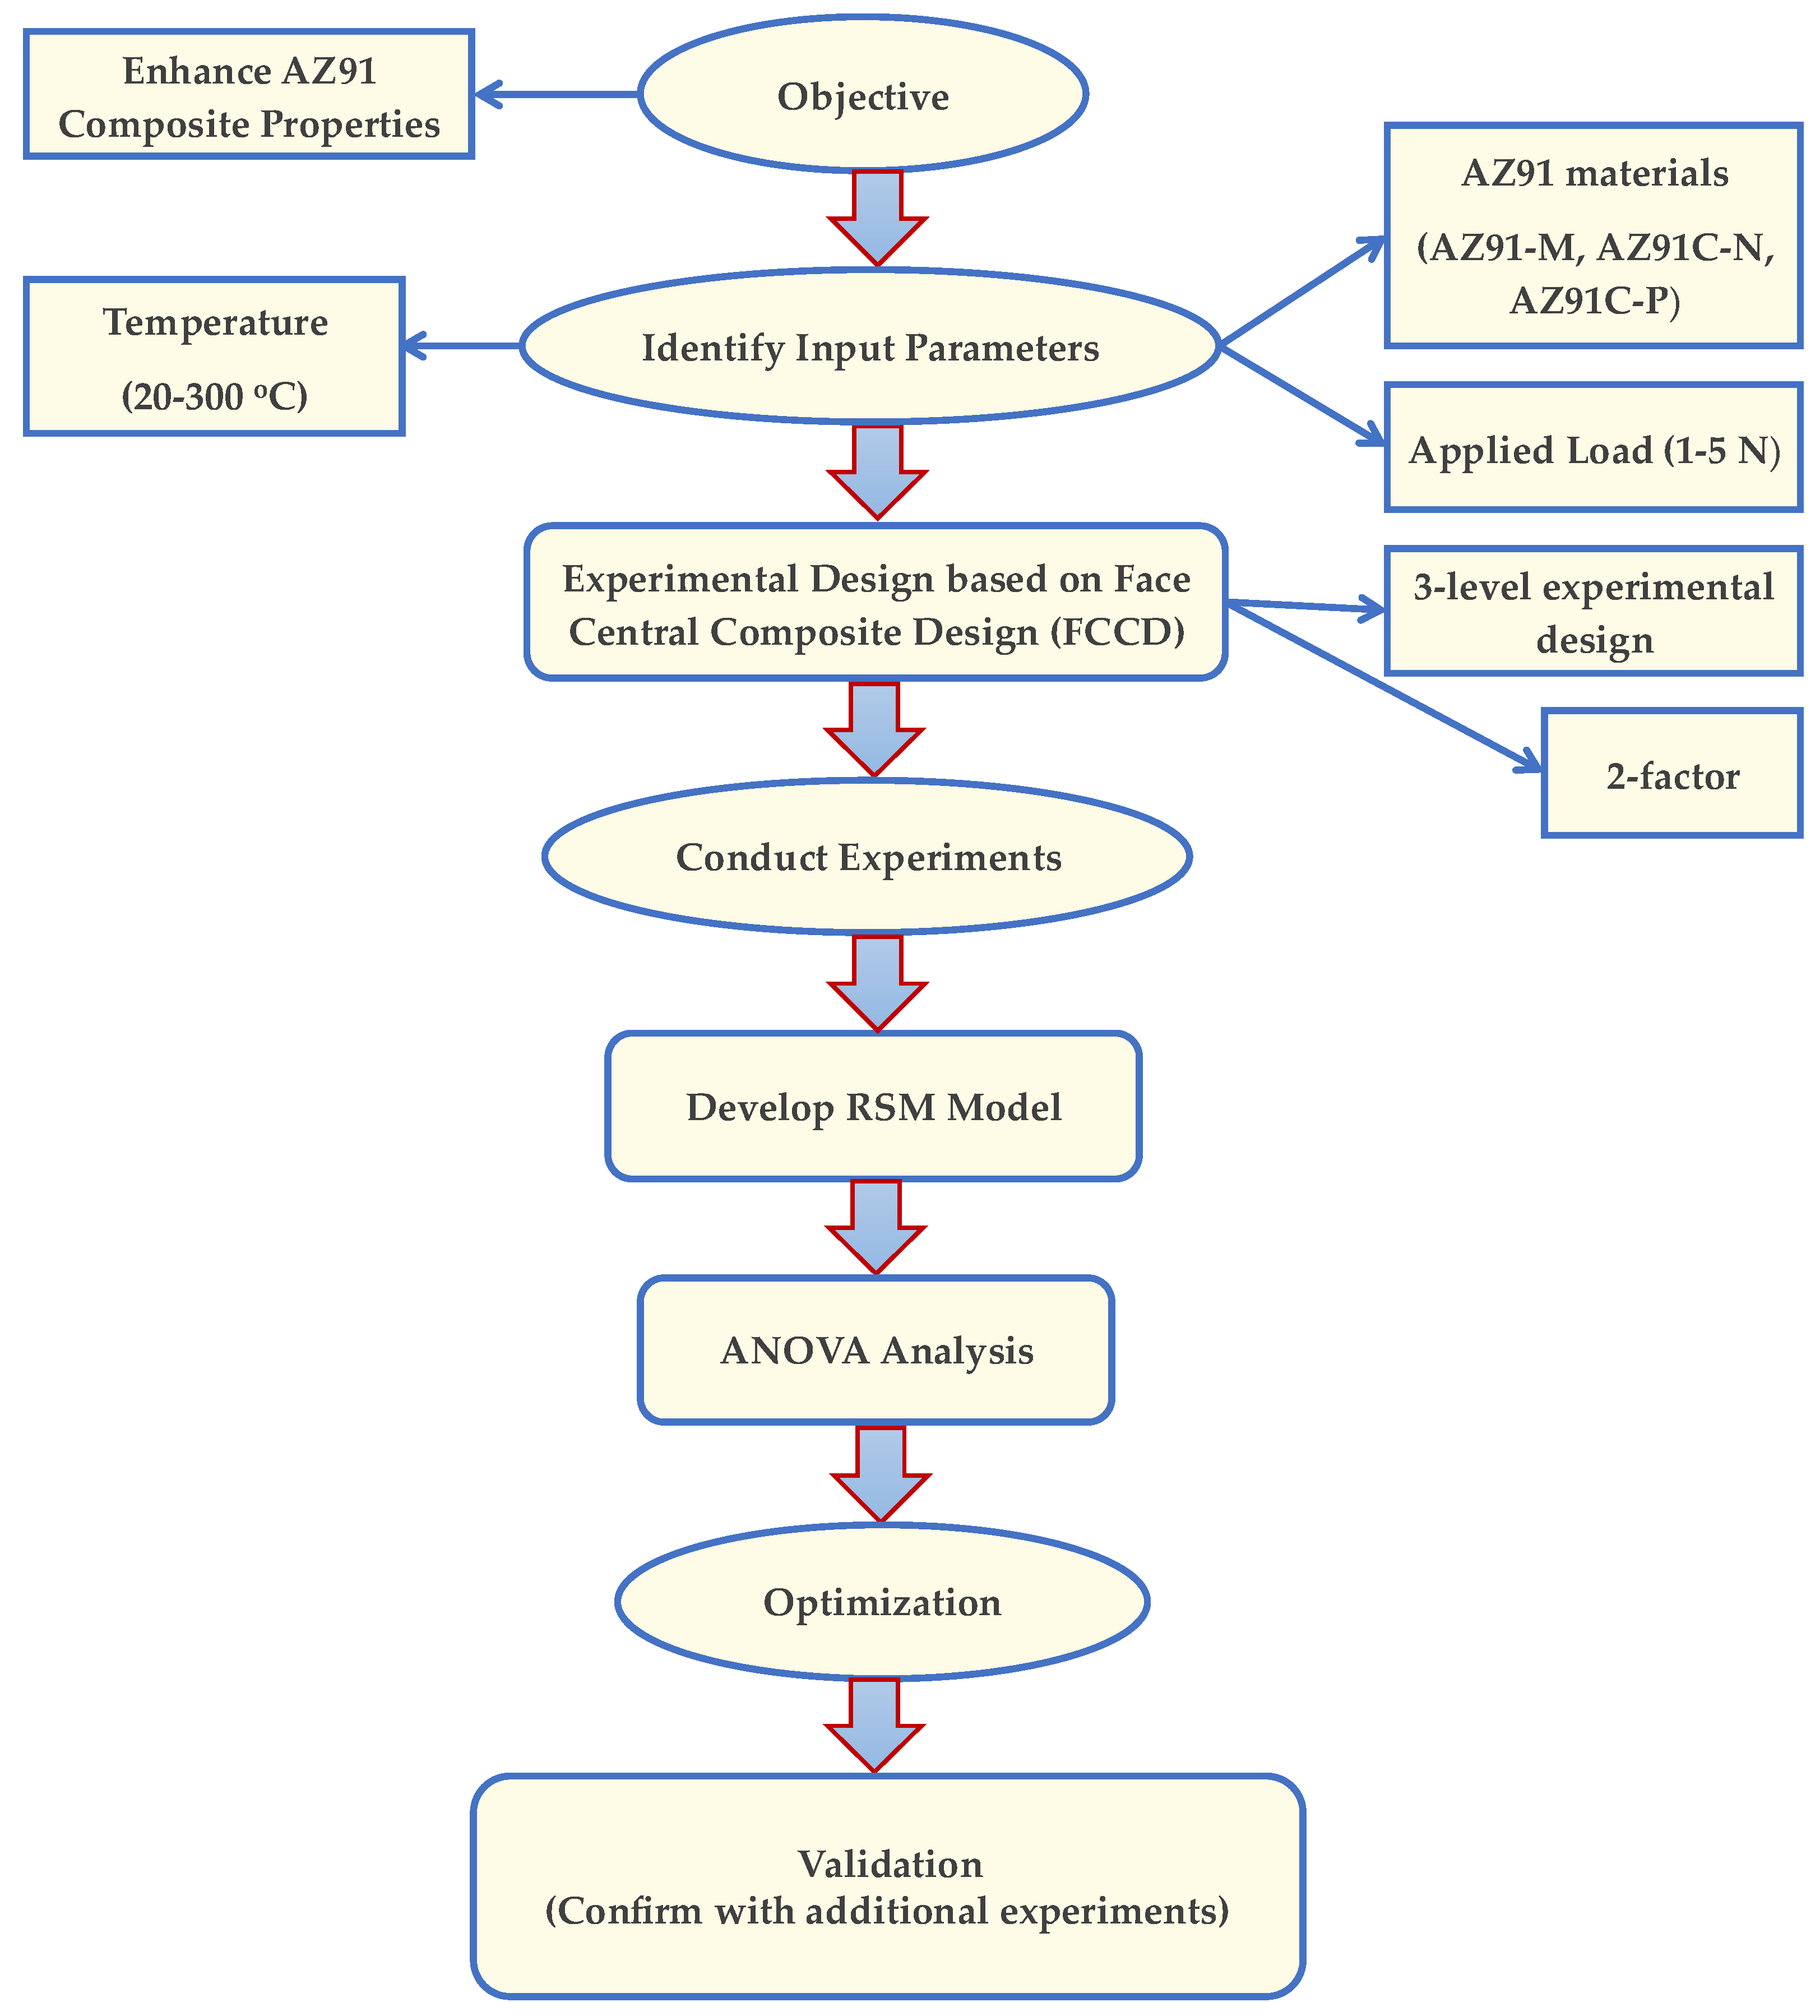
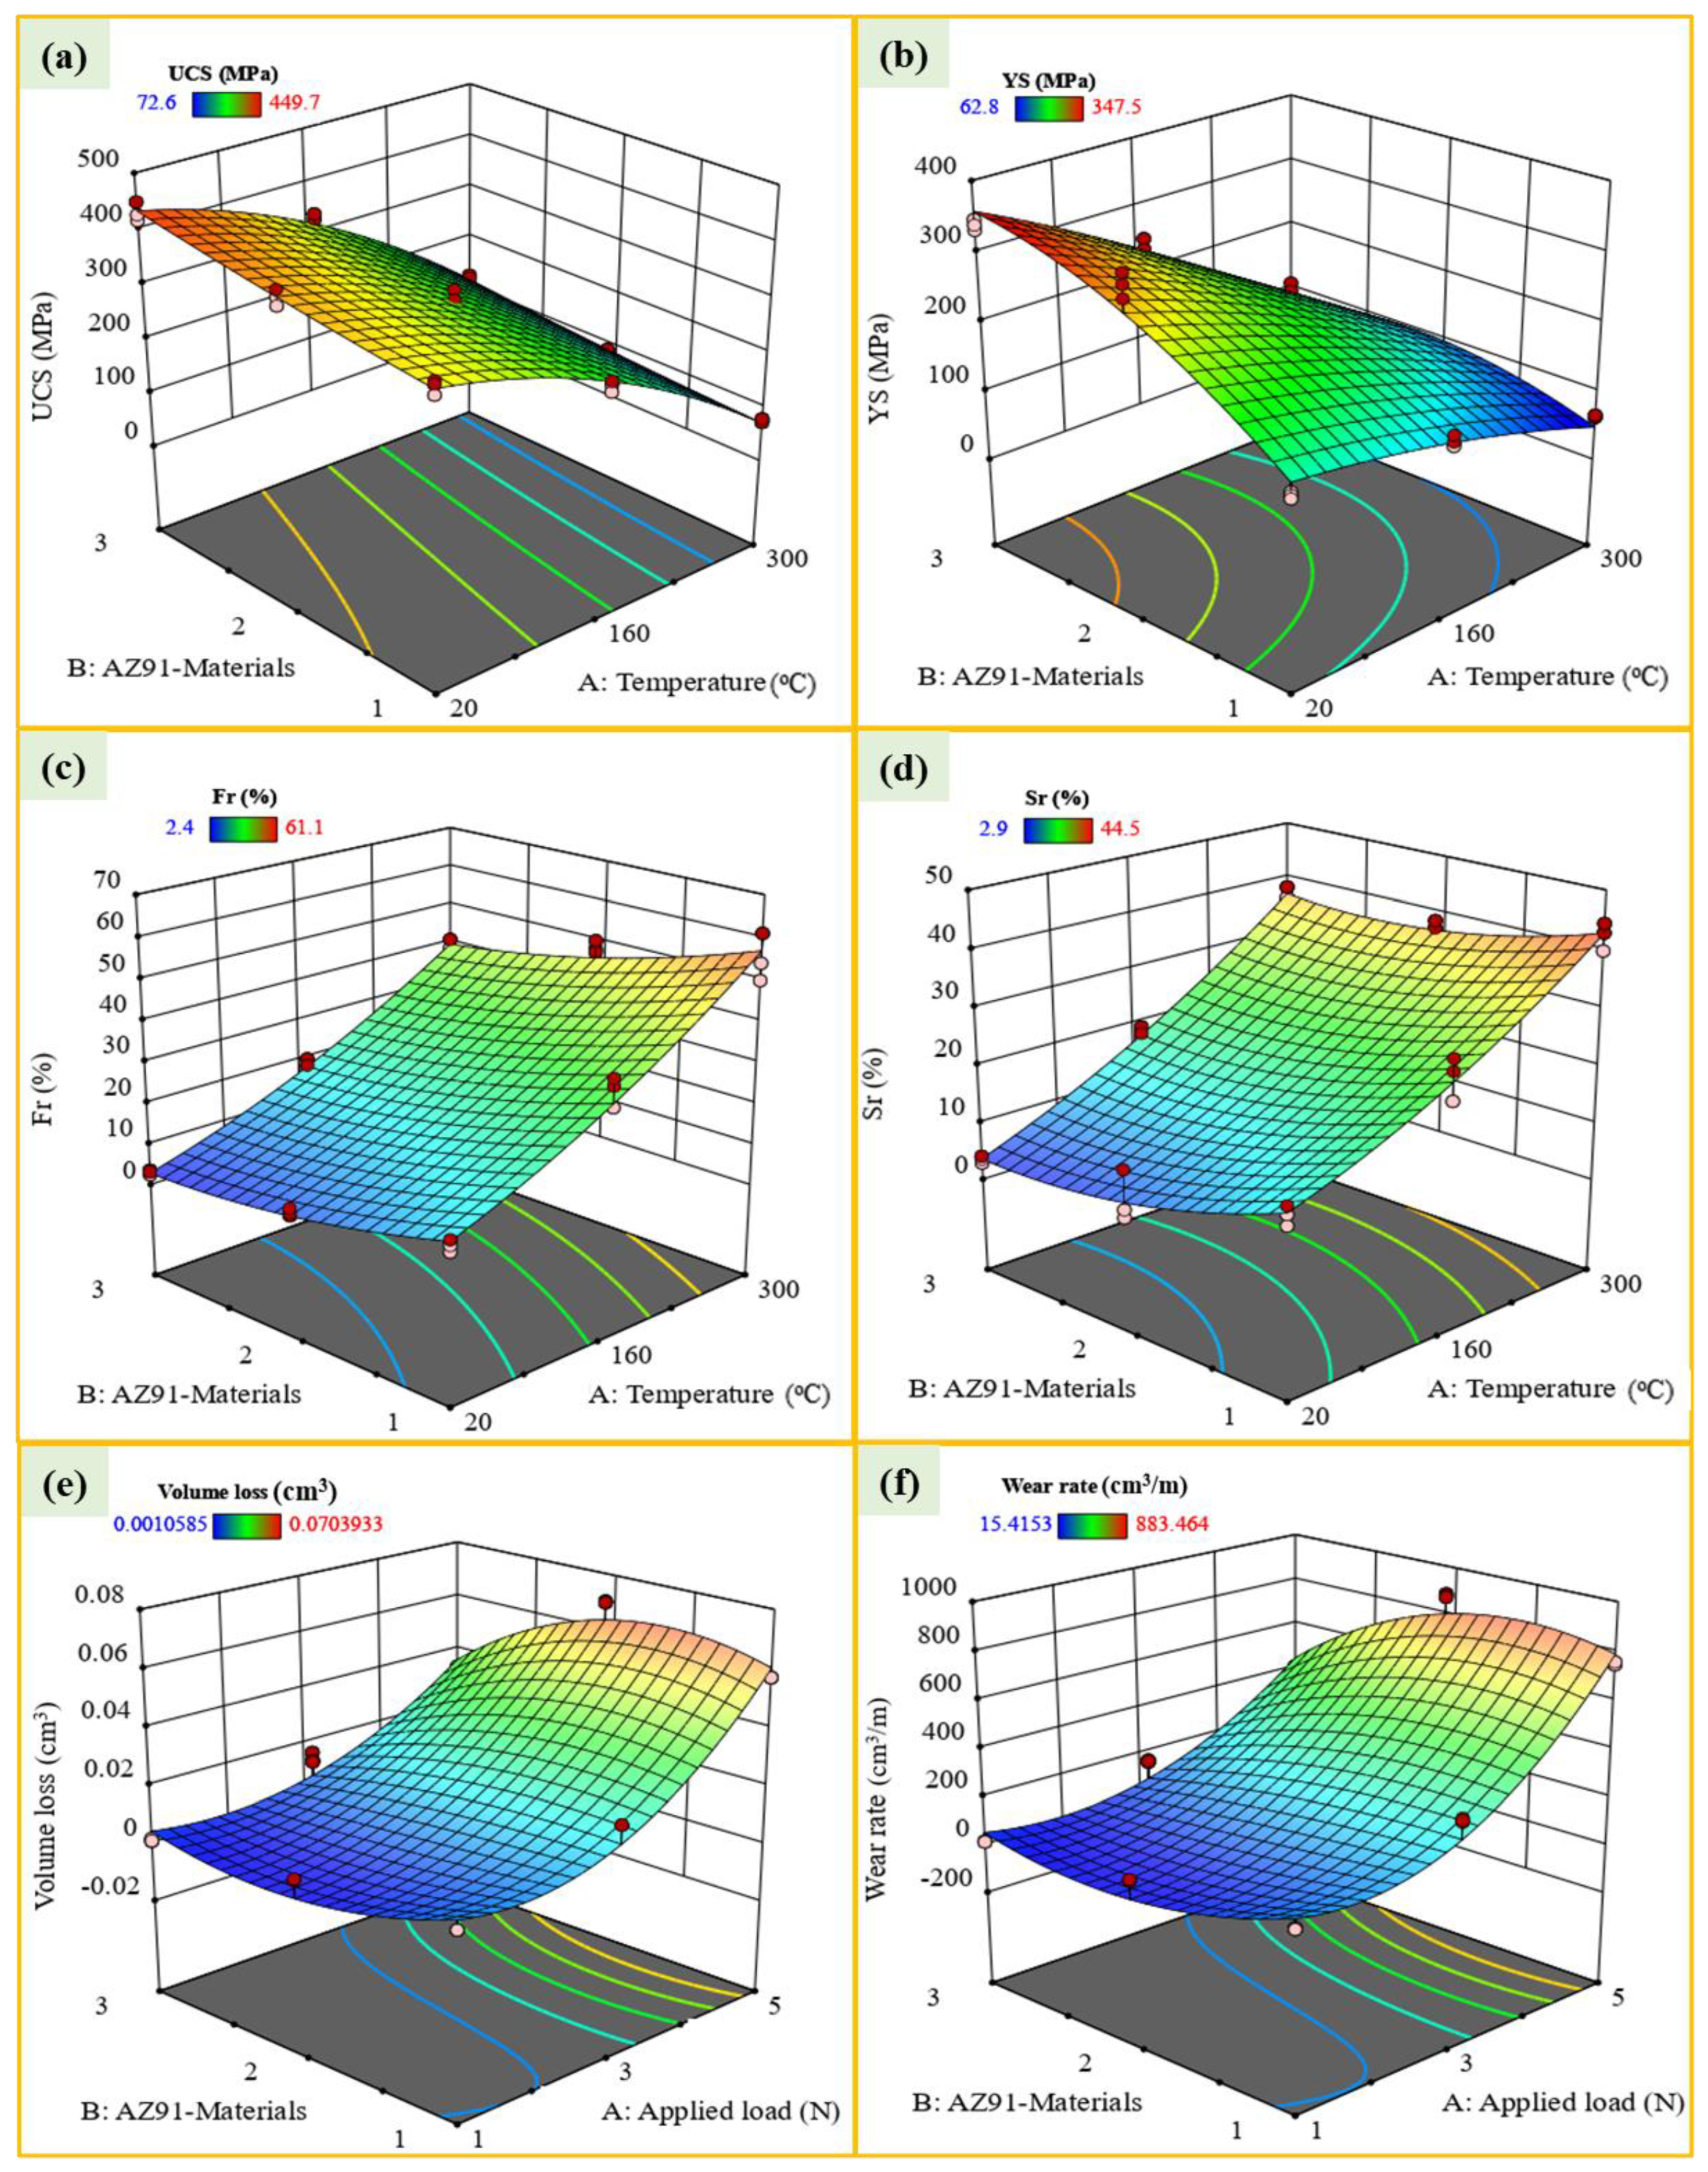
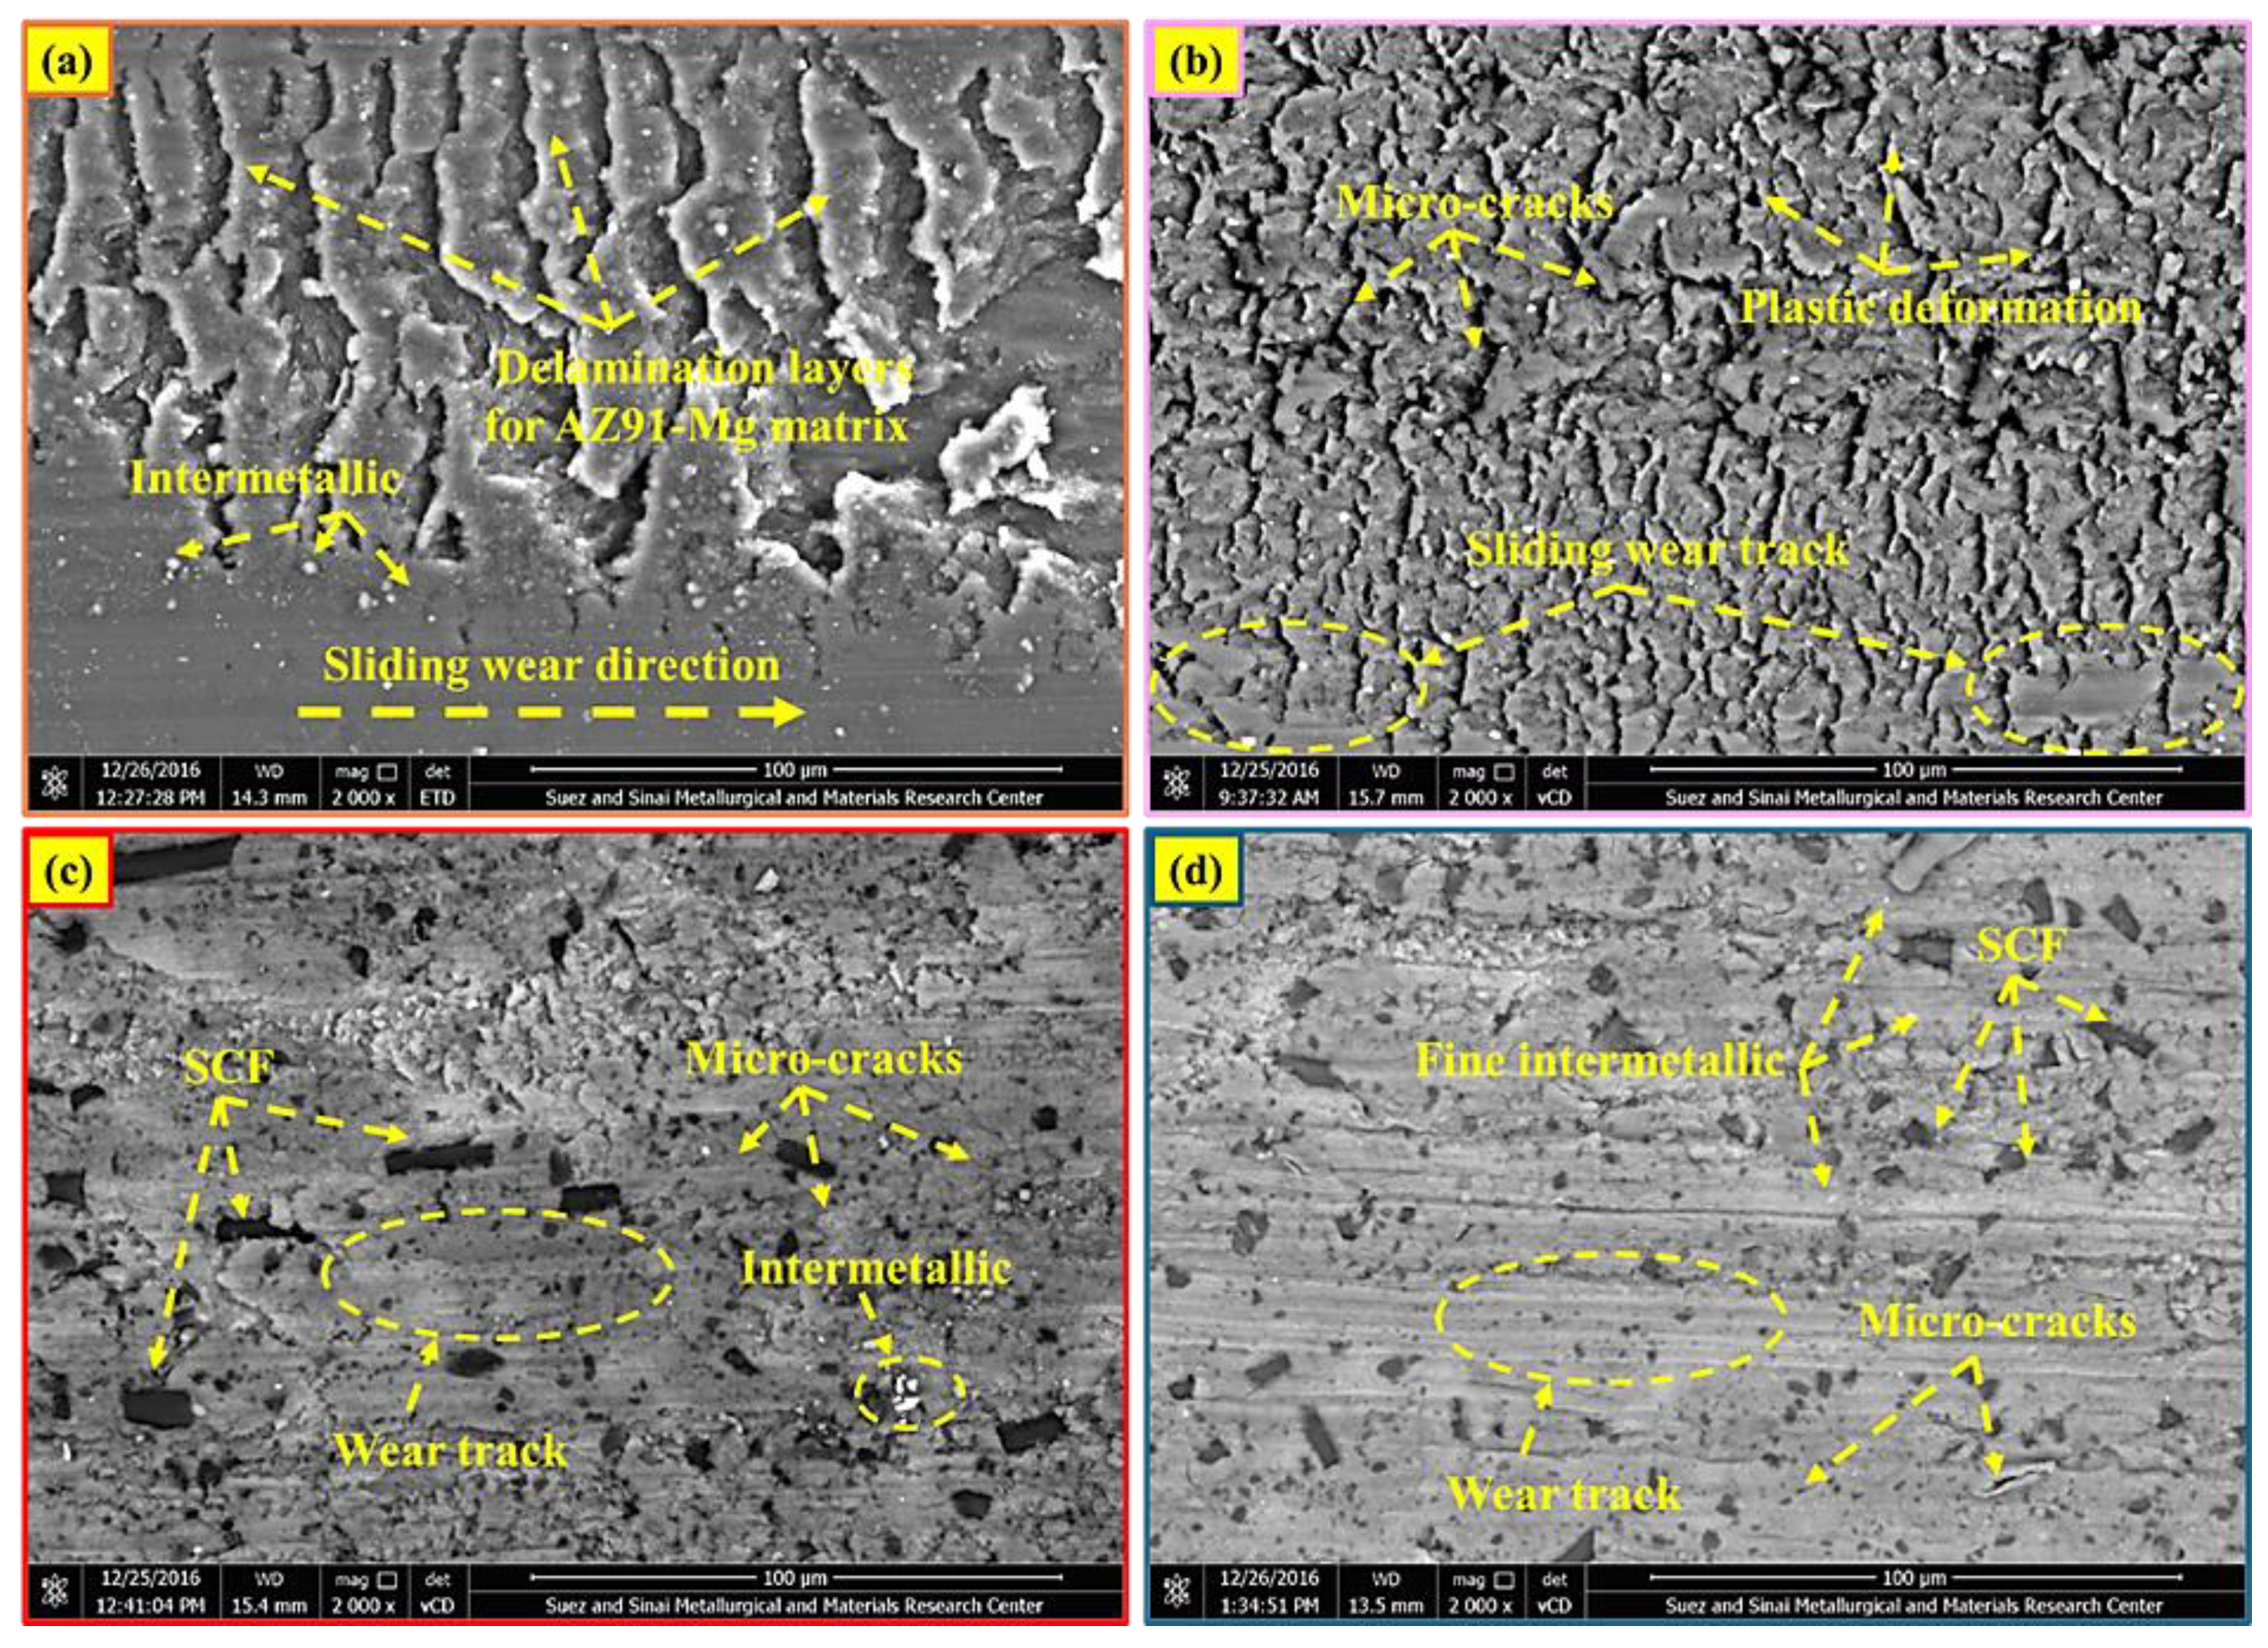
Finally, this study introduces a novel approach, utilizing RSM to optimize the ultimate compressive strength (UCS), yield strength (YS), reduction in height at fracture (Fr), and reduction in height at maximum stress (Sr) of squeeze-cast AZ91 Mg alloy and its 23 vol.% SCF-reinforced composites across a broad temperature range (20–300 °C). Additionally, the wear behavior in terms of volume loss, wear rate, worn surface morphology, and worn surface roughness is investigated under varying load conditions (1–5 N) for three distinct materials: the AZ91 matrix, Composite-N, and Composite-P.
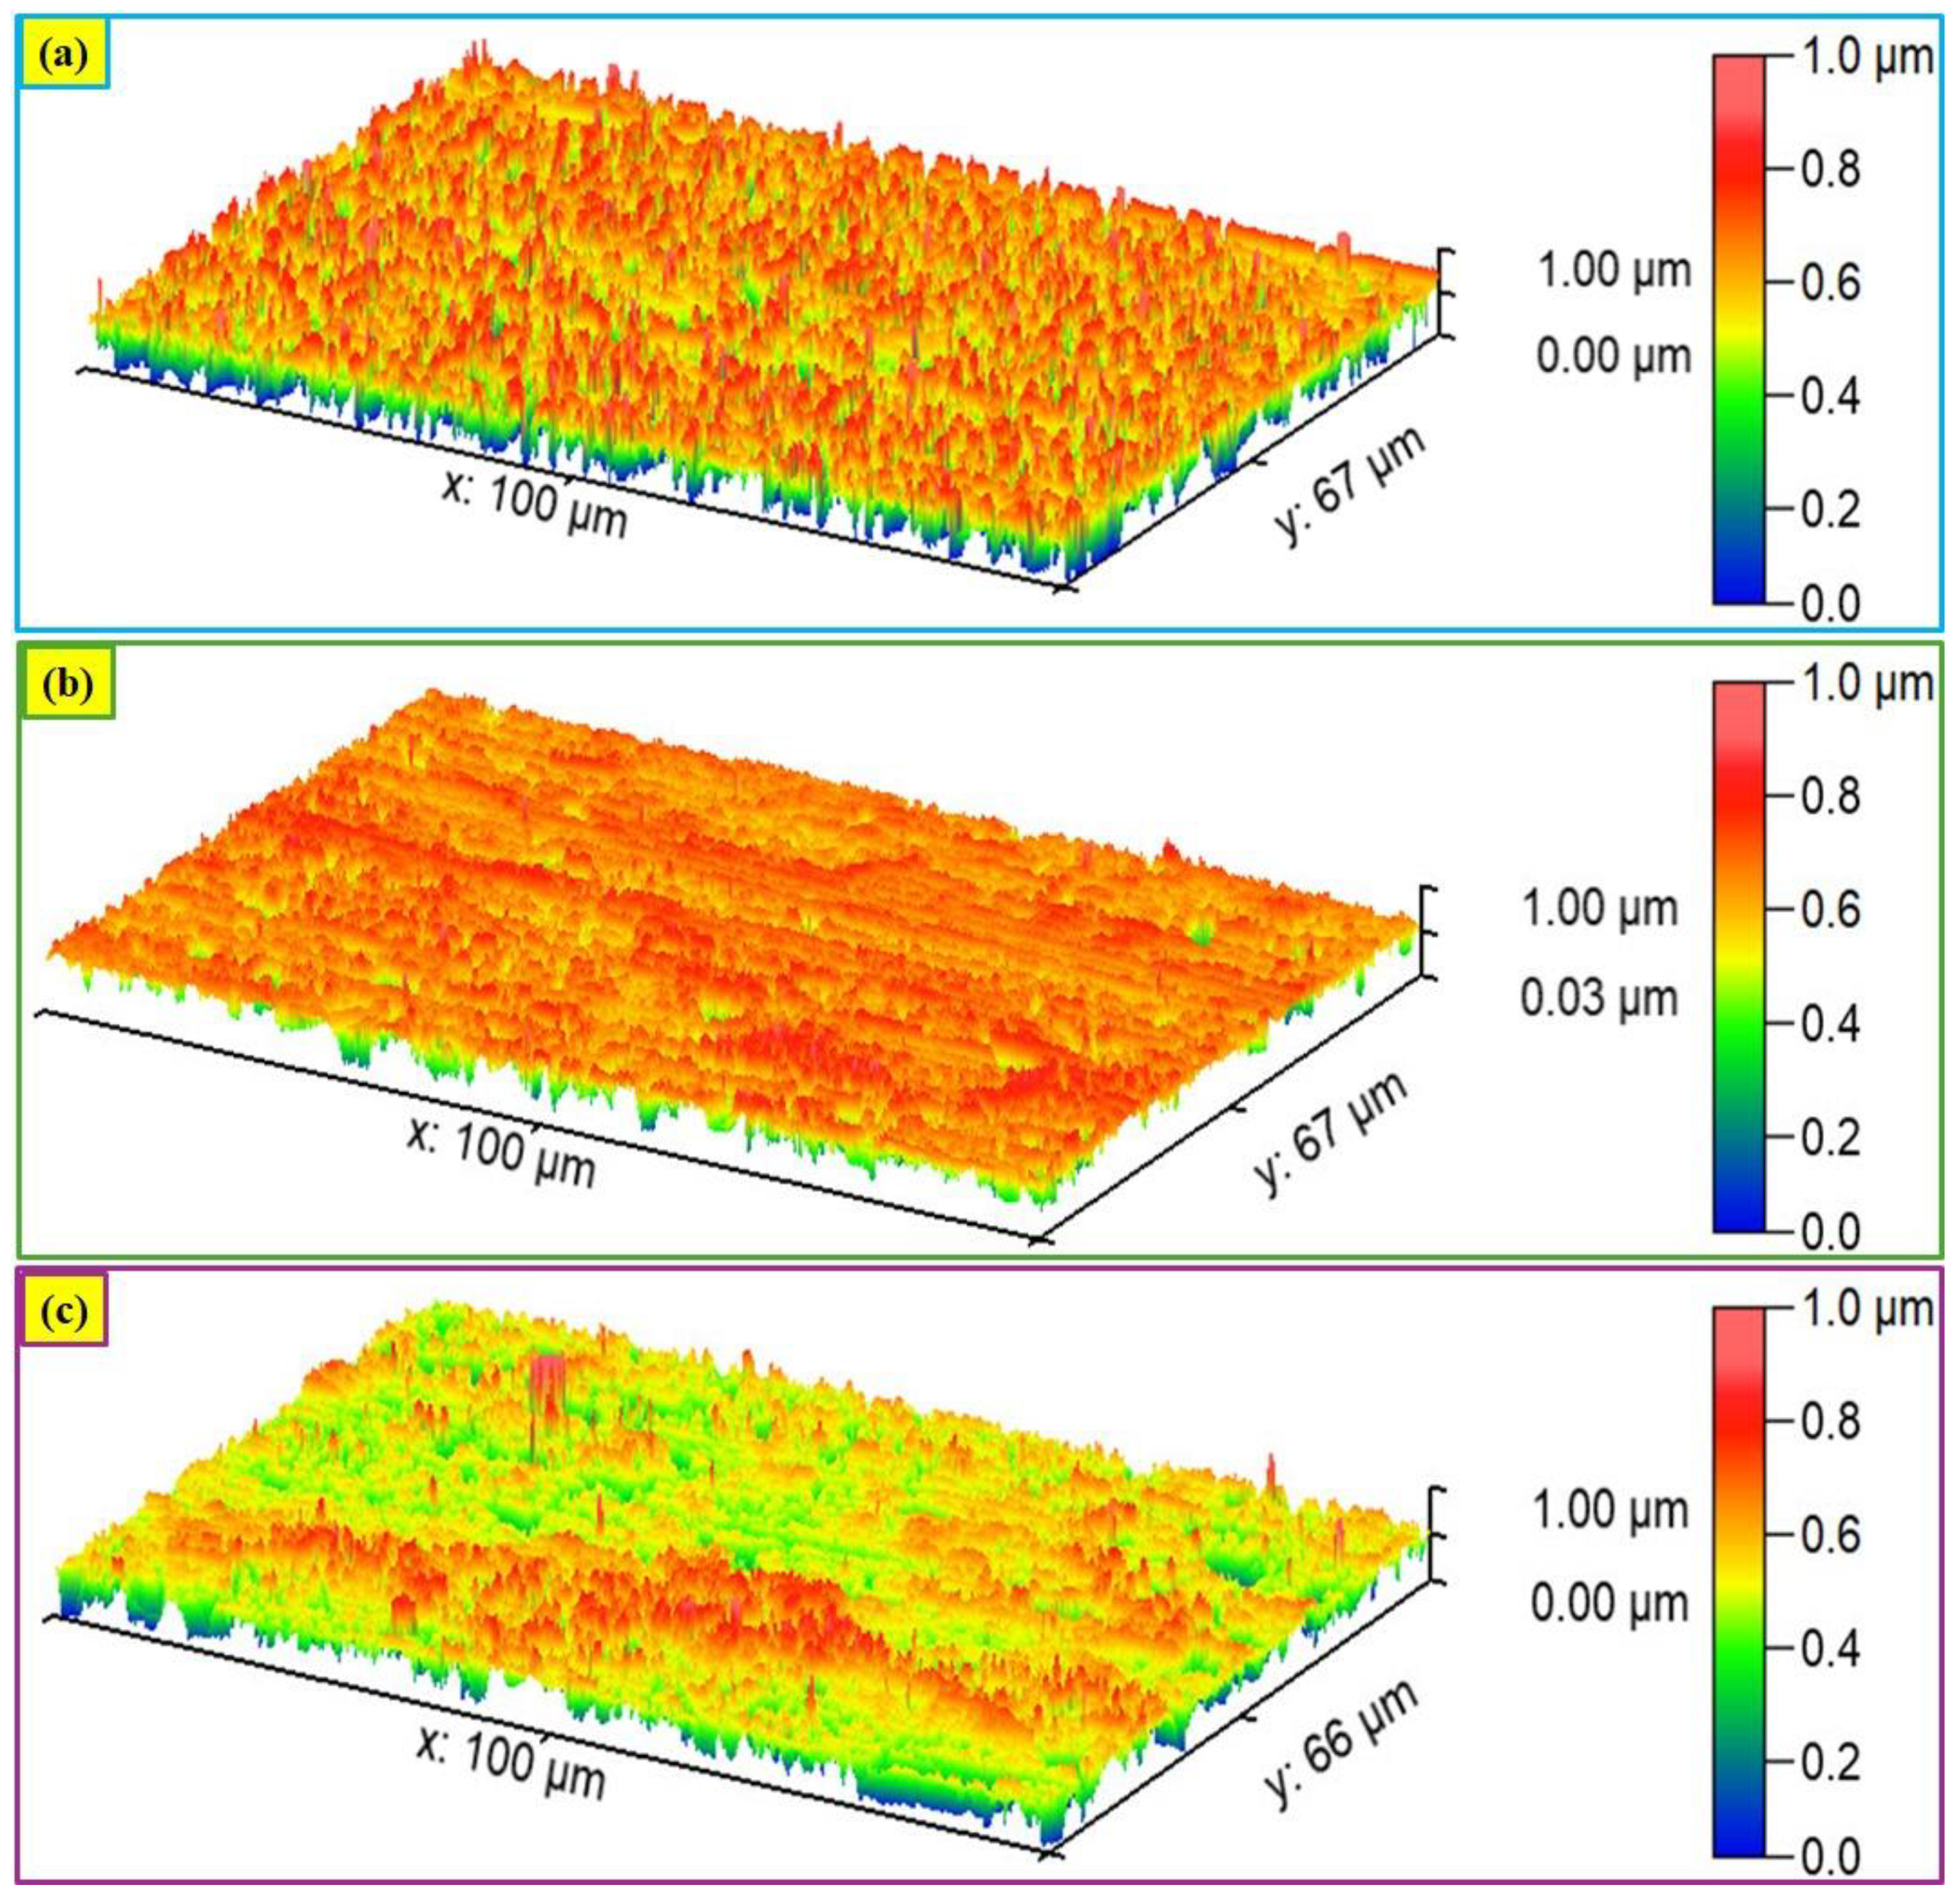
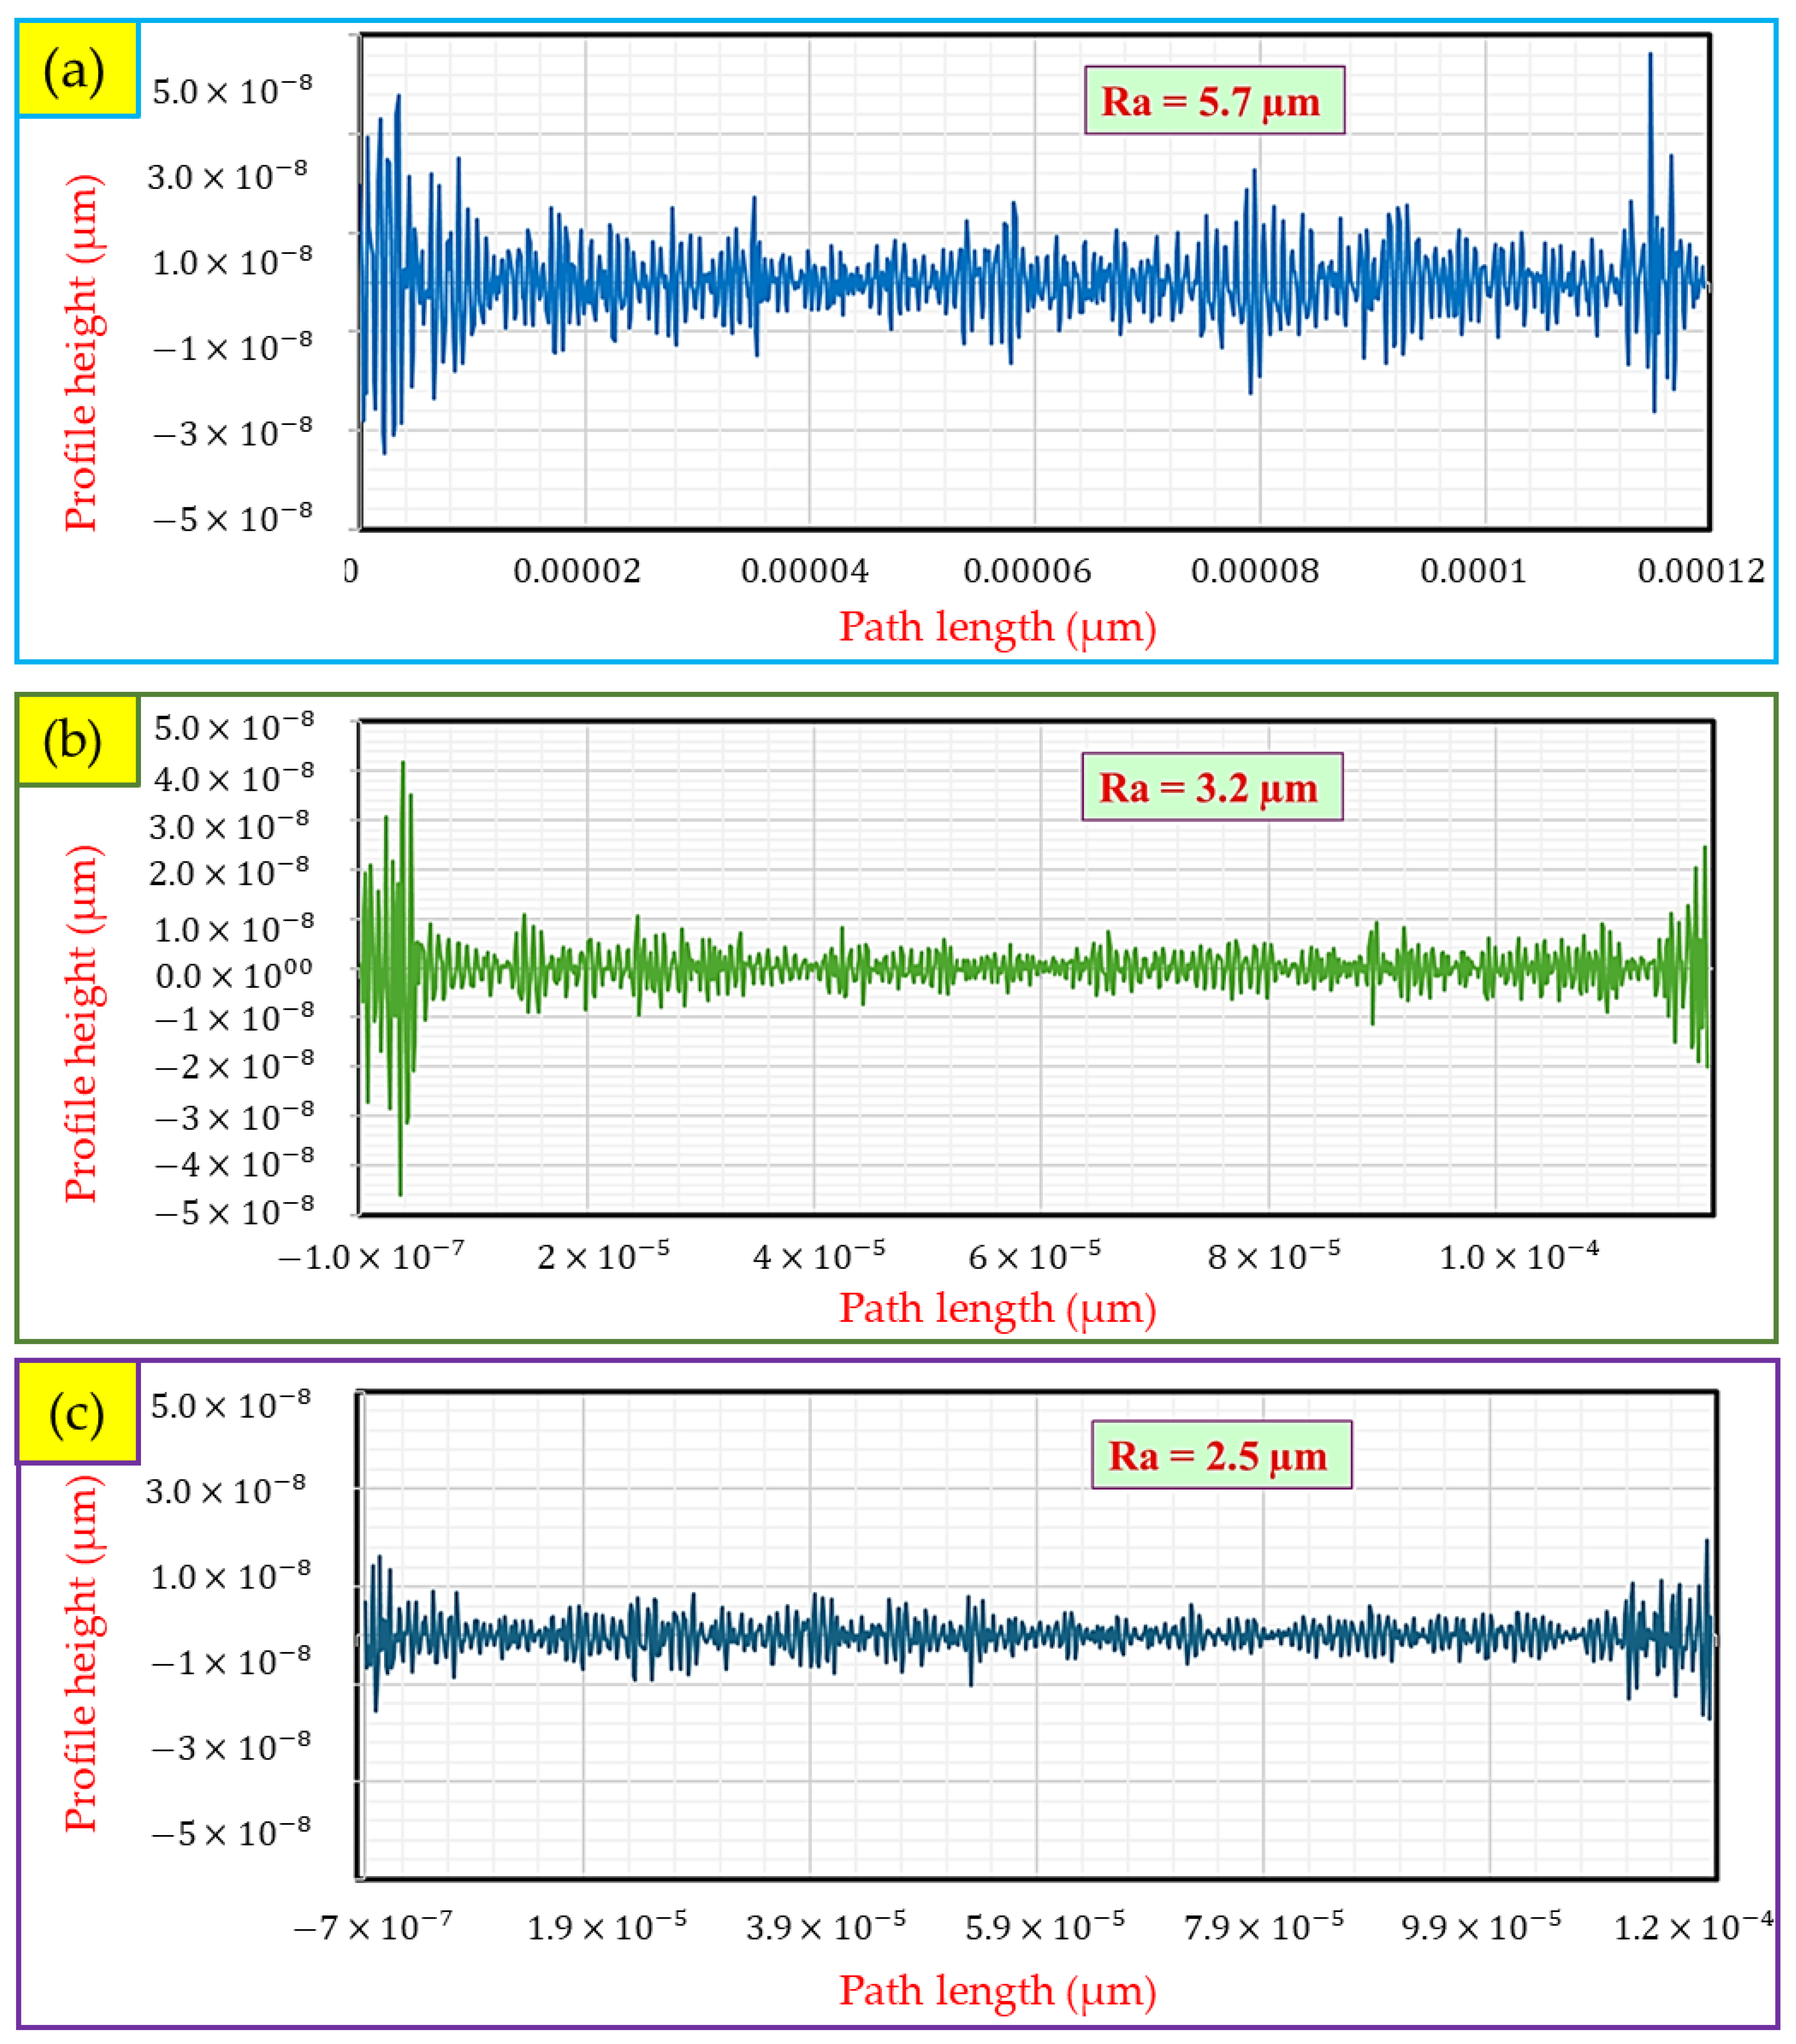
Optimization is performed using RSM-based Face-Centered Composite Design (FCCD) via Design-Expert software V10, targeting maximum mechanical performance and wear resistance. Furthermore, the influence of processing variables on metallographic characteristics, density, and hardness is examined. A key objective is to correlate SCF orientation with surface roughness parameters, providing critical insights into the surface quality of AZ91 and its high-fiber content composites. By integrating mechanical and wear behavior optimization with advanced statistical modeling, this work represents a significant advancement in magnesium-based composites, paving the way for their use in high-temperature and wear-resistant applications.

2. Materials and Methods

2.1. Sample Preparation

The AZ91-based composite, reinforced with 23 vol.% short carbon fibers (SCFs), was fabricated using the squeeze-casting technique. In this study, the AZ91-Mg alloy served as the matrix material, and its chemical composition is provided in Table 1. The SCFs, used as the reinforcement material, were provided by SIGRAFIL, SGL Carbon GmbH (Germany), with the specifications given in Table 1 [12]. A preform with randomly distributed reinforcement material (SCFs) was prepared for the squeeze-casting process. The preform and casting mold were preheated to 400 °C, and molten AZ91 Mg alloy heated to a temperature of 730 °C was poured onto the preform. A compaction pressure of 80 MPa was applied to ensure the infiltration of the AZ91 melt into the carbon fibers, and the resulting composite was rapidly cooled to solidify. For comparison, AZ91 alloy samples were also produced under the same casting conditions. Specimens from casted materials were extracted, machined, and coded as follows: AZ91-M (unreinforced Mg matrix), Composite-N (machined normal to the reinforced plane), and Composite-P (machined parallel to the reinforced plane). These codes were provided as the starting materials for the response surface method (RSM).

2.2. Characterization of Materials

The density of the AZ91M and composite specimens was determined using Archimedes’ principle. Furthermore, the theoretical density was estimated by applying the rule of mixtures, and the relative densities were subsequently calculated using Equation (1), as follows:
R e l a t i v e   d e n s i t y = E x p e r i m e n t a l   d e n s i t y T h e o r e t i c a l   D e n s i t y × 100
After metallographically preparing the composite samples, the microstructure characteristics and elemental distribution maps were analyzed for both the unreinforced AZ91 alloy and SCF-reinforced AZ91 composites (oriented in normal and parallel directions). The examination was conducted using a Quanta FEG 250 scanning electron microscope (SEM-Quanta FEG 250-FEI Company, Hillsboro, OR, USA) equipped with an advanced energy-dispersive X-ray spectroscopy (EDS) system. Moreover, a Vickers hardness tester machine (Model: HWDV-7S, TTS Unlimited, Osaka, Japan) was used to measure the hardness of the AZ91 M- specimen and the two composites at room temperature at a load of 20 N and a holding time of 15 s. Additionally, the hardness test was performed in various locations on the surface of the sample to attain the average value. The material behavior under compression was investigated using a universal testing machine (model: Schenck-Trebel RMC100, Deer Park, NY, USA). The test was carried out at a 10−4 s−1 strain rate at 20, 160, and 300 °C. According to the ASTM G99 standard, dry sliding wear tests were carried out using a homemade pin-on-disc machine (model: WT-M1-SSMMR-CSE, Suez, Egypt), as shown in Figure 1. The disc surface and pins were cleaned with acetone before testing. All wear tests were conducted using fixed sliding distances of 1.34 × 10⁴ m and varying applied loads of 1, 3, and 5 N. The specimen and counter face disc were cleaned with organic solvents to get rid of traces after each test. To determine the wear rate and volume loss, the pin was weighed before the following testing with an accuracy of 0.1 mg. Also, the surface roughness for worn surfaces for produced composites was measured using the Gwyddion-2.60 program to determine the surface roughness parameters, namely, the mean deviation from the nominal surface, Ra, the roughness root mean square, Rq, the roughness maximum height, Rt, the roughness maximum valley depth, Rv, the maximum height of roughness peak, Rp, the average maximum height of the profile, Rz, and the waviness root mean square, Wq. Table 2 presents the RSM parameters and their codes.

2.3. Mathematical Modeling

The adopted methodology for conducting experimental studies and achieving optimized mechanical properties and wear behavior is shown as an outflow chart in Figure 2. To improve the mechanical and wear characteristics of composites fabricated using the squeeze-casting technique, the experiments were designed employing the FCCD of RSM while taking into account the temperature, AZ91-Materials, and various applied loads. Analysis of variance (ANOVA) was used to examine the RSM model, and the desirability function was used for multi-objective optimization. The output response can be improved, optimized, and developed using the response surface methodology, which is mathematically represented by Equation (2) [24].
Y =   β o + i = 1 k β i   X i +   i = 1 k β i i   X 2 i +   i j β i j   X i X j +   ε
Here, Y , β o , β i X i , β i i X 2 i , β i j X i X j , k, and ε are the predicted response, constant coefficient, linear main effect, non-linear effect, and the interaction effect of factors, representing the number of process parameters and error, respectively. The mathematical variables were estimated using ANOVA and FCCD. The important aspects of the squeeze-casting method were evaluated using RSM data analysis based on the two-factor, three-level FCCD method (L27 orthogonal array). The R2 coefficient of determination was used to express the experimental response to the polynomial mathematical modeling equation to a reasonable degree. The polynomial equation’s importance of each term is estimated with 92% confidence using the mathematical model’s F-test. According to the proposed statistical design, second-order polynomial equations were used to estimate the various squeeze-casting conditions, as long as correlations existed between the experimental factors of the AZ91-Materials (AZ91-M, AZ91C-N, and AZ91C-P), different temperatures (20, 160, and 300 °C), and various applied loads (1, 3, and 5 N) and the response of ultimate compressive strength (UCS), yield strength (YS), reduction in height at the fracture (Fr), reduction in height at maximum stress (Sr), volume loss, and wear rate. The entire squeeze-casting design matrix with the observed response characteristics is shown in Table 3 and Table 4.

3. Results and Discussion

3.1. Microstructure Features of AZ91-Mg Alloy and Its Composite Materials

To assess the microstructural features and uniformity of the squeeze-cast AZ91 alloy, SEM images and elemental mapping were conducted. Figure 3a,b show the AZ91-M alloy microstructure and Figure 3c–f show the distribution of its key alloying elements. The mapping results align with the nominal composition of AZ91 (Table 1) and verify the dispersion of intermetallic phases across the material. This confirms the structural homogeneity of the as-cast AZ91 microstructure. The form and shape of intermetallic compounds (β-Mg17Al12 and Al4Mn) in cast Mg alloys are influenced by several factors, such as the production method, solidification time, and presence of alloying elements [30]. As shown in Figure 3a,b, the microstructure of AZ91-M (as-cast without SCFs) contains a smooth gray region known as the α-Mg matrix with secondary dendritic arms. It also contains a bright background known as eutectic phase β-Mg17Al12 and lamellar α-Mg [31]. The formed intermetallic eutectic phase can be attributed to an increased concentration of aluminum alloying element [12,13].
The microstructural features of the AZ91 Mg-based composites reinforced with 23 vol.% SCFs were examined through the elemental mapping of the microstructures. Figure 4a–f show results for the AZ91C-N composite, while Figure 5a–f present data for the AZ91C-P composite. All composite samples showed good dispersed and well-bonded carbon fibers in the AZ91-M. This highlights the benefits of squeeze-casting technology in the production of specialized magnesium-based materials with high-volume fractions of SCFs [32]. Figure 4a,b depict the longitudinal direction for SCFs dispersed in the AZ91-M at low and high magnifications. The high-magnification image (Figure 4b) reveal micro-cracks and fiber pull-outs for the SCFs in the AZ91-M. The reason can be attributed to the Mg matrix and carbon fibers having different thermal expansion coefficients. Furthermore, in the Mg/SCF composite, interfacial debonding and sliding might also be anticipated [33]. The mapping SEM images (Figure 4c–f) confirmed the presence and location of both AZ91-M elements and the SCFs.
On the other hand, for the AZ91C-P composite, in Figure 5a,b, the SCFs had cylindrical cross-sections that fell within the range diameter of the SCFs. No porosity or casting defects were observed in either the AZ91-M or the composite. Moreover, there is no micro-cracking or pull-out of the carbon fibers. This suggests that the high-pressure squeeze-casting process, following the proposed parameters, effectively produced dense, high-quality composite materials. The location of the SCFs within the AZ91-M, along with the presence of its constituent elements, was determined and confirmed by mapping the SEM images presented in Figure 5c–f.

3.2. Hardness and Density

Figure 6 and Figure 7 illustrate the densities and hardness values of the AZ91-Mg alloy and its composites, AZ91C-N and AZ91C-P [12]. The relative density is determined by comparing the measured density to the theoretical density. The theoretical density for the matrix is 1.80 g/cm3, while for the composites, it is calculated using a mixture rule based on the densities of the base alloy and reinforcing fibers, resulting in values of 1.76 and 1.78 g/cm3 for the AZ91-N and the AZ91C-P, respectively. The relative densities of the AZ91-N and AZ91C-P composites are higher than that of the AZ91-Mg alloy. The hardness value of AZ91-BM is 70 ± 3 HV, which increases to 106 ± 4 HV and 111 ± 2 HV for composite specimens that contain 23 vol.% short carbon fibers in AZ91C-N and AZ91C-P, respectively. This increase in hardness can be attributed to the addition of a high-volume fraction (23 vol.%) of reinforcing SCFs. Adding only 7 vol% SCF to Mg alloy AZ91 [34] resulted in a hardness increase of 22% compared to the matrix hardness. This finding aligns with previous reports by various authors on different Mg-based composites with varying volume fractions of SCFs [34,35,36].

3.3. Development of Mathematical Models

The effects of the linear, quadratic, and interaction terms on the responses of ultimate compressive strength (UCS), yield strength (YS), reduction in height at fracture (Fr), reduction in height at maximum stress (Sr), volume loss, and wear rate were evaluated using ANOVA. Table 5, Table 6, Table 7, Table 8, Table 9 and Table 10 highlight the ANOVA results for the AZ91-Mg alloy and its composite. For compressive strength (UCS), yield strength (YS), reduction in height at fracture (Fr), reduction in height at maximum stress (Sr), volume loss, and wear rate, the F-values are 559.04, 92.46, 159.01, 199.43, 33.80, and 37.78, respectively. Similarly, the p-value of the developed models (p < 0.0001) indicates that the model demonstrated a good relationship with the residual and that the variables observed are significant, as of p < 0.05. Hence, input parameters such as AZ91-Materials (AZ91-M, AZ91C-N, and AZ91C-P) and temperatures (20, 160, and 300 °C) played a significant role in the response. All parameters had p-values greater than 0.05, indicating that their contributions to the response are negligible. However, the contribution of other factors is < 0.05, indicating that the contribution is significant, implying that the model is statistically adequate to represent the data. Thus, a significant correlation exists between the response models and the residuals, as shown by the residual correlation coefficients (R2) of 0.9925, 0.9565, 0.9743, 0.9794, 0.9257, and 0.9330 for UCS, YS, Fr, Sr, volume loss, and wear rate, respectively. The Adeq. Precision calculates the signal-to-noise ratio (S/N). The precision value of Adeq. Indicates that the signal is 60.927 times stronger than the noise. This demonstrates that the developed models are capable of navigating design space. While interaction terms AB (p = 0.0575) and B2 (p = 0.4030) in the UCS model (Table 5) showed marginal statistical significance, they were retained to preserve model hierarchy. This approach ensures the physical interpretability of temperature–material interactions while maintaining continuity across all response models.
Equations (3)–(8) show the predictive models of the experimental outcome obtained through multi-regression analysis. According to these equations, terms with positive coefficients had a positive impact on the output, while terms with negative coefficients had a negative impact. To accomplish this, factor B (AZ91-Materials) had a synergistic effect on compressive strength and yield strength response, whereas it had a negative impact on Fr and Sr. In contrast, factor A (temperature) demonstrated an opposing effect on the compressive strength and yield strength, while having a positive impact on Fr and Sr. To determine the difference between predicted and actual values, charts were created. Figure 8 demonstrates that all actual values match the predicted values, proving that model parameters are accurate.
UTS (MPa) = +343.86659 − (0.245680 × A) + (19.83095 × B) − (0.052381 × A × B) − (0.002308 × A2) + (4.40556 × B2)
Ys (MPa) = −51.90538 + (0.138358 × A) + (249.79190 × B) − (0.303679 × A × B) − (0.000711 × A2) − (35.96778 × B2)
Fr (%) = +26.63927 + (0.103461 × A) − (16.49270 × B) − (0.009810 × A × B) + (0.000179 × A2) + (2.68000 × B2)
Sr (%) = +27.88964 + (0.050454 × A) − (18.11905 × B) + (0.008036 × A × B) + (0.000137 × A2) + (3.17778 × B2)
Volume loss (cm3) = +0.074136 − (0.036512 × Applied load) − (0.064682 × B) + (0.026595 × Applied load × B) + (0.005384 × Applied load2) + (0.014726 × B2) − (0.000736 × Applied load2 × B) − (0.006052 × Applied load × B2)
Wear rate (cm3/m) = +916.29616 − (436.72479 × Applied load) − (788.93321 × B) + (310.61737 × Applied load × B) + (67.54037 × Applied load2) + (179.78863 × B2) − (8.52864 × Applied load2 × B) − (72.14907 × Applied load × B2)
Figure 9 displays the normal probability plots of residuals for the four key mechanical responses of UCS, YS, Fr, and Sr. In Figure 9a, the normal plot of residuals for UCS shows that the residual points align closely along the straight line, with minimal deviation. This alignment indicates that the residuals are approximately normally distributed, which validates one of the primary assumptions of the ANOVA analysis. The points follow the reference line almost uniformly across the entire range of standardized residuals, from approximately −2.0 to +2.0, suggesting that the quadratic model for UCS is appropriate and well-fitted to the experimental data. Similarly, Figure 9b for YS demonstrates a good linear alignment of residuals with the normal probability line. The distribution appears slightly more scattered compared to UCS, particularly at the extremes of the distribution, but still maintains reasonable conformity to normality. This validates the statistical adequacy of the YS model, despite the marginally significant lack of fit observed in the ANOVA results, as listed in Table 6. The normal probability plot for a reduction in Fr, as shown in Figure 9c, exhibits excellent linearity across most of the standardized residual range. A few points at the upper tail show slight deviation, but this minor departure does not significantly compromise the normality assumption. The overall linearity confirms that the model for Fr adequately captures the relationship between the experimental variables and this response parameter. Figure 9d for Sr shows the most consistent alignment with the normal probability line among all four responses. The residuals are very well distributed along the reference line, with minimal deviation, even at the extremes. This exceptionally good fit validates the statistical robustness of the Sr model and suggests high predictive accuracy, which is consistent with the high R2 value of 0.9794 reported in Table 8. Collectively, these normal probability plots substantiate the adequacy of the developed quadratic models for all four mechanical responses. The normality of residuals, coupled with the high R2 values, ranging from 0.9565 to 0.9925, and reasonable Adeq Precision values, ranging from 27.65 to 60.93, confirms that the models possess good predictive capability. This statistical validation reinforces the reliability of the optimization results presented in the subsequent sections.

3.4. Influence of Relationship Between Process Variables and Response Models

The result analysis among all variables at a preferred area in the taken-into-account design space is displayed using a disturbance plot. Figure 10 depicts the disturbance plot for the (a) UCS, (b) YS, (c) Fr, (d) Sr, (e) volume loss, and (f) wear rate. With the other components held constant, the extraction yield response was obtained by varying just one element over its range. At the center of the design area, the plot shows how each factor impacts the output response (e.g., AZ91-Materials; AZ91-M, AZ91C-N, and AZ91C-P and temperature). For the UCS and YS, the temperature factor did not show a favorable impact, while it yielded a favorable impact on Fr, Sr, volume loss, and wear rate. Meanwhile, the curvature line of AZ91-Materials indicates a significant impact of this variable on the UCS, as well as the YS in the design area, and can be seen in Equations (3)–(8) and Table 5, Table 6, Table 7, Table 8, Table 9 and Table 10.
To improve the ability to comprehend surface modeling through a clear schematic vision, a surface response may be graphically drawn in the 3D structure. The mathematical calculations derived from the UCS, YS, Fr, Sr, volume loss, and wear rate results were used to produce all of the subsequent 3D surface response plots. Any plot can be used to observe the relationship between any two influences and a single response, as shown in Figure 11 and Figure 12. Additionally, it has the ability to forecast results in the chosen domain for a given situation. The surface plots have two variables while maintaining optimal values for the others. The 3D surface plots in Figure 13a–f show how the important factors affect UCS, YS, Fr, Sr, volume loss, and wear rate. The AZ91-Materials (AZ91-Matrix, AZ91C-N, and AZ91C-P) have the greatest influence on tensile and yield strength, whereas temperature has the least influence, as shown in Figure 13a,b. Furthermore, it was discovered that AZ91-Materials had the least impact on these parameters, as shown in Figure 13c–f, whereas temperature had the greatest influence on the Fr, Sr, volume loss, and wear rate. The boundaries represent the response values that fall between the four points, as shown by the RSM contours. It has been observed that by increasing parameter levels, the compressive strength and yield strength of AZ91C-P materials that are reinforced with SCFs in various orientations improve and reach their maximum at low temperatures. In contrast, the Fr, Sr, volume loss, and wear rate increase as the temperature rises, while the SCF orientation is changed from AZ91C-Parallel to AZ91C-Matrix.
The wear test results show that weight loss increases with increasing wear loads (1–5 N) for the matrix material (AZ91-M) and the two composites (Composite-N and Composite-P). At lower loads (1–3 N), AZ91-M exhibits higher weight loss than the composites due to its lower hardness and compressive strength. The composites benefit from the addition of carbon fiber reinforcement, which forms a lubricating graphite film during wear testing, thereby reducing friction and heat. Figure 14 displays SEM images of the worn surfaces of the AZ91 Mg alloy and its composites reinforced with 23 vol.% SCFs. The addition of SCFs to the AZ91-M leads to a decrease in volume loss and wear rate compared with the AZ91-M, as seen from the wear track features. This is due to carbon acting as a lubricant between the rubbing surfaces, reducing the friction between them. Figure 14a,b depict the worn surface of the AZ91-M, which contains micro-cracks and deep grooves that result in delamination layers forming in the AZ91-Mat under a 5 N applied load. Thus, the AZ91-M exhibits the highest volume loss and wear rate compared to AZ91C-N and AZ91C-P. The AZ91-M alloy suffers from severe abrasion, delamination, and plastic deformation due to hard intermetallic particle pull-out and oxide formation, leading to deep grooves and micro-cracks. At 5 N, Composite-N shows the highest weight loss, while Composite-P performs the best. This is because, at high loads, Composite-N experiences fiber pull-out due to thermal expansion mismatch, thus weakening the bond between fibers and the magnesium matrix (Figure 14c). In contrast, Composite-P maintains better wear resistance, as its fibers (oriented normally to the surface) sustain a continuous lubricating film without fiber detachment (Figure 14d). Finally, it can be concluded that the carbon fiber-reinforced composites exhibit reduced wear via a protective graphite film that minimizes abrasion and delamination, resulting in shallower wear tracks and suppressed plastic deformation.
To evaluate the surface quality of the composites reinforced by 23 vol.% SCF and produced with varying carbon fiber directions, roughness data are derived using Ra, Rq, Rt, Rv, Rp, Rz, and Wq values. Also, to account for any potential variations in surface topography, we conducted measurements for each composite sample evenly across three distinct samples under the same composition and processing conditions. These measurements were taken along different directions on the XY-plane. The surface roughness, Ra, along the XY-plane is typically used to compute the arithmetic mean value of several roughness measurements, which expresses the chipping pits, plastic deformation, and delamination layers for the surfaces after the wear test. Figure 15 depicts the 3D worn surface roughness topography of the AZ91 Mg alloy and composites, in which it can be observed that the addition of SCF leads to improved surface quality. Additionally, as illustrated in Figure 16, the average surface roughness, Ra, parametric alignment values are 2.5, 3.2, and 5.7 μm for the AZ91C-P, AZ91-N, and AZ91C-M composite samples, respectively. The decreased pull-out carbon fibers on the surface are responsible for the drop in surface roughness parameter values measured from the AZ91C-P samples. Additionally, the information on surface roughness parameters, shown in Figure 17, can aid in the design of fiber-reinforced metal matrix composites and the identification of critical elements that can be used to mimic the behavior of fiber-reinforced metals. Thus, several studies have used different reinforcement techniques to investigate the combination of magnesium alloys and carbon fibers [37,38,39,40,41]. Furthermore, the orientation of the carbon fiber influences the roughness values of the cast specimen. This information will be very helpful in designing fiber-reinforced metal matrix composites and identifying critical elements that can be used to simulate the behavior of fiber-reinforced metals. As a result, using this information can aid in developing cost-effective automotive replacements.

3.5. Validation of the Developed Mathematical Models

The experiments were conducted to verify the accuracy of regression Equations (3)–(8) by producing and testing the three AZ91-Materials (AZ91-M, AZ91C-N, and AZ91C-P) The results of the experiment were satisfactory, as evidenced by the data presented in Table 11 and Table 12. Additionally, Equation (9) can be used to determine the percentage error.
P e r c e n t a g e   e r r o r   E % = A c t u a l   v a l u e P r e d i c t e d   v a l u e P r e d i c t e d   v a l u e × 100

4. Conclusions

This study developed an integrated optimization approach, using RSM based on an FCCD to enhance the mechanical and wear properties of squeeze-cast AZ91 magnesium alloy reinforced with 23 vol.% SCFs. This study focused on the effects of fiber orientation (normal: AZ91C-N; parallel: AZ91C-P), temperature (20–300 °C), and applied load (1–5 N) on the materials’ performance. The interactions between process variables and responses, including UCS, YS, Fr, Sr, volume loss, and wear rate, were systematically analyzed. The RSM-FCCD approach demonstrated excellent predictive capability, achieving high prediction accuracy (R2 > 0.92 for all responses). ANOVA revealed that temperature predominantly influenced UCS, YS, Fr, and Sr, while the applied load had the strongest impact on volume loss and wear rate. At 20 °C, the AZ91C-P composite exhibited superior mechanical properties, with the highest hardness, UCS, and YS, whereas the unreinforced AZ91-M alloy showed the lowest properties. Elevated temperatures (up to 300 °C) increased Fr and Sr in all produced composites. Notably, SCF reinforcement significantly improved surface quality, with AZ91C-P achieving the lowest roughness (Ra = 2.5 μm) due to optimized fiber–matrix adhesion and reduced pull-out. Fiber orientation was critical, underscoring the importance of alignment in tailoring composite performance. The validated RSM model demonstrated strong agreement between predicted and experimental values, offering a reliable tool for optimizing SCF-reinforced composites. These findings advance the design of lightweight, high-performance materials for automotive and aerospace applications, reducing development costs and time through predictive modeling.

Future Work

  • Develop experimental procedures to evaluate the AZ91 Mg alloy and its composites’ cyclic and dynamic behavior.
  • Update our current models to incorporate cyclic loading effects and strain rate dependence.
  • Use experimental data to validate the extended statistical models and evaluate their predictive power
  • Characterize failure mechanisms to link microstructure with performance.

Author Contributions

Conceptualization, R.A.F., M.M.E.-S.S., S.A. and R.G.E.; methodology, R.A.F., M.M.E.-S.S., S.A. and R.G.E.; software, S.A., A.A. and N.H.A.; investigation, N.H.A., S.A. and A.B.; resources, M.M.E.-S.S. and A.B.; data curation, R.G.E., A.B. and A.A.; writing—original draft preparation, R.A.F., R.G.E., A.A. and S.A.; writing—review and editing, R.A.F., N.H.A., M.M.E.-S.S., S.A. and A.A.; visualization, R.G.E., A.B. and S.A.; supervision, M.M.E.-S.S. and N.H.A.; project administration, S.A. and N.H.A.; funding acquisition, S.A. and N.H.A. All authors have read and agreed to the published version of the manuscript.

Funding

This work was supported and funded by the Deanship of Scientific Research at Imam Mohammad Ibn Saud Islamic University (IMSIU) (grant number IMSIU-DDRSP2503).

Data Availability Statement

The original contributions presented in this study are included in the article. Further inquiries can be directed to the corresponding author.

Conflicts of Interest

The authors declare no conflicts of interest.

Nomenclature

ANOVAAnalysis of variance.
RSMResponse surface methodology.
FCCDFace central composite design.
SCFsShort carbon fibers.
UCSUltimate compressive strength.
YSYield strength.
FrReduction in height at the fracture.
SrReduction in height at maximum stress.
DfDegrees of freedom for the model.
CV %Coefficient of variation.
R2Regression coefficient.
Adeq precisionSignal-to-noise ratio.
RaRoughness average.
RqRoot mean square roughness.
RtMaximum height of the roughness.
RvMaximum roughness valley depth.
RpMaximum roughness peak height.
RzAverage maximum height of the profile.
WqRoot mean square waviness.

References

  1. Mokhtarishirazabad, M.; Azadi, M.; Hossein Farrahi, G.; Winter, G.; Eichlseder, W. Improvement of High Temperature Fatigue Lifetime in AZ91 Magnesium Alloy by Heat Treatment. Mater. Sci. Eng. A 2013, 588, 357–365. [Google Scholar] [CrossRef]
  2. Mahmudi, R.; Kabirian, F.; Nematollahi, Z. Microstructural Stability and High-Temperature Mechanical Properties of AZ91 and AZ91 + 2RE Magnesium Alloys. Mater. Des. 2011, 32, 2583–2589. [Google Scholar] [CrossRef]
  3. Badkoobeh, F.; Mostaan, H.; Rafiei, M.; Bakhsheshi-rad, H.R. Friction Stir Welding/Processing of Mg-Based Alloys: A Critical Review on Advancements and Challenges. Materials 2021, 14, 15–17. [Google Scholar] [CrossRef]
  4. Tharumarajah, A.; Koltun, P. Is There an Environmental Advantage of Using Magnesium Components for Light-Weighting Cars? J. Clean. Prod. 2007, 15, 1007–1013. [Google Scholar] [CrossRef]
  5. Iwaszko, J.; Strzelecka, M. Microstructure and Corrosion Resistance of AZ91 Magnesium Alloy after Surface Remelting Treatment. Materials 2022, 15, 8980. [Google Scholar] [CrossRef]
  6. Wei, J.; He, C.; Qie, M.; Liu, Y.; Zhou, H.; Kang, C.; Qin, G. Achieving High Strength-Ductility of AZ91 Magnesium Alloy via Wire-Arc Directed Energy Deposition Assisted by Interlayer Friction Stir Processing. Addit. Manuf. 2024, 94, 104453. [Google Scholar] [CrossRef]
  7. Srinivas, A.; Pavan, D.; Venkatesha, B.K.; Rao, R.R.; Mohith, L. Study on Mechanical Properties of AZ91 Magnesium Alloy. Mater. Today Proc. 2022, 54, 291–294. [Google Scholar] [CrossRef]
  8. Tan, Q.; Atrens, A.; Mo, N.; Zhang, M.X. Oxidation of Magnesium Alloys at Elevated Temperatures in Air: A Review. Corros. Sci. 2016, 112, 734–759. [Google Scholar] [CrossRef]
  9. Zhen, Z.; Xi, T.; Zheng, Y.; Li, L.; Li, L. InVitro Study on Mg-Sn-Mn Alloy as Biodegradable Metals. J. Mater. Sci. Technol. 2014, 30, 675–685. [Google Scholar] [CrossRef]
  10. Salleh, M.N.M.; Ishak, M.; Quazi, M.M.; Aiman, M.H. Microstructure, Mechanical, and Failure Characteristics of Laser-Microwelded Az31b Mg Alloy Optimized by Response Surface Methodology. Int. J. Adv. Manuf. Technol. 2018, 99, 985–1001. [Google Scholar] [CrossRef]
  11. Peng, D.; Song, Z.; Zhang, Y.; Wang, X.; Hou, H.; Zhao, Y. Strengthening/Weakening Effect of Graphene Orientation Angle on Mechanical Properties of AZ91 Magnesium Matrix Composites. J. Magnes. Alloys 2025, 1–14, in press. [Google Scholar] [CrossRef]
  12. Ataya, S.; El-Sayed Seleman, M.M.; Latief, F.H.; Ahmed, M.M.Z.; Hajlaoui, K.; Elshaghoul, Y.G.Y.; Habba, M.I.A. Microstructure and Mechanical Properties of AZ91 Rein-Forced with High Volume Fraction of Oriented Short Carbon Fibers. Materials 2022, 15, 4818. [Google Scholar] [CrossRef] [PubMed]
  13. Ataya, S.; El-Sayed Seleman, M.M.; Latief, F.H.; Ahmed, M.M.Z.; Hajlaoui, K.; Soliman, A.M.; Alsaleh, N.A.; Habba, M.I.A. Wear Characteristics of Mg Alloy AZ91 Reinforced with Oriented Short Carbon Fibers. Materials 2022, 15, 4841. [Google Scholar] [CrossRef]
  14. Jiang, C.; Gu, L.; Xiong, H.; Wang, J.; Zhou, L.; Shen, M.; Wang, J.; Ying, T.; Zeng, X. Review of Progress on Fabrication Technology of Mg Matrix Composites. J. Magnes. Alloys 2024, 12, 4768–4807. [Google Scholar] [CrossRef]
  15. Jiang, J.; Yan, J.; Liu, Y.; Hu, G.; Wang, Y.; Ding, C.; Zou, D. Numerical Simulation and Experimental Validation of Squeeze Casting of AlSi9Mg Aluminum Alloy Component with a Large Size. Materials 2022, 15, 4334. [Google Scholar] [CrossRef]
  16. Soni, S.K.; Chen, Y.; Liu, K. The Squeeze Casting Parametric Effect on Magnesium Metal Matrix Composite the Squeeze Casting Parametric Effect on Magnesium Metal Matrix Composite. IOP Conf. Ser. Mater. Sci. Eng. 2020, 988, 012112. [Google Scholar] [CrossRef]
  17. Moosa, A.; Al-Khazraji, K.; Muhammed, O. Tensile Strength of Squeeze Cast Carbon Fibers Reinforced Al-Si Matrix Composites. J. Miner. Mater. Charact. Eng. 2011, 10, 127–141. [Google Scholar] [CrossRef]
  18. Alsaleh, N.A.; Ataya, S.; Latief, F.H.; Ahmed, M.M.Z.; Ataya, A.; Abdul-Latif, A. LCF and HCF of Short Carbon Fibers Reinforced AE42 Mg Alloy. Materials 2023, 16, 3686. [Google Scholar] [CrossRef]
  19. Gu, J.; Zhang, X.; Gu, M. The Damping Capacity of AZ91 Magnesium Matrix Composites Reinforced with the Coated Carbon Fiber Fabric. Mater. Trans. 2004, 45, 1743–1747. [Google Scholar] [CrossRef]
  20. Kandemir, S.; Bohlen, J.; Dieringa, H. Influence of Recycled Carbon Fiber Addition on the Microstructure and Creep Response of Extruded AZ91 Magnesium Alloy. J. Magnes. Alloys 2023, 11, 2518–2529. [Google Scholar] [CrossRef]
  21. Chen, B.; Qi, L.; Fu, J.; Zhang, Q.; Zhou, J. Preparation of the High Compressive Performance Special-Shaped Csf/AZ91D Composite Part Using the Liquid-Solid Extrusion Following Vacuum Pressure Infiltration Process. J. Magnes. Alloys 2024, 13, 1617–1629. [Google Scholar] [CrossRef]
  22. Alrasheedi, N.H.; El-Sayed Seleman, M.M.; Ahmed, M.M.Z.; Ataya, S. Fatigue and Fracture Behaviors of Short Carbon Fiber Reinforced Squeeze Cast AZ91 at 20 °C and 250 °C. Crystals 2023, 13, 1469. [Google Scholar] [CrossRef]
  23. Beniyel, M.; Sivapragash, M.; Vettivel, S.C.; Senthil Kumar, P.; Ajith Kumar, K.K.; Niranjan, K. Optimization of Tribology Parameters of AZ91D Magnesium Alloy in Dry Sliding Condition Using Response Surface Methodology and Genetic Algorithm. Bull. Pol. Acad. Sci. Tech. Sci. 2021, 69, e135835. [Google Scholar] [CrossRef]
  24. Albaijan, I.; Ahmed, M.M.Z.; El-Sayed Seleman, M.M.; Touileb, K.; Habba, M.I.A.; Fouad, R.A. Optimization of Bobbin Tool Friction Stir Processing Parameters of AA1050 Using Response Surface Methodology. Materials 2022, 15, 6886. [Google Scholar] [CrossRef]
  25. Vakili-Azghandi, M.; Fattah-alhosseini, A.; Keshavarz, M.K. Optimizing the Electrolyte Chemistry Parameters of PEO Coating on 6061 Al Alloy by Corrosion Rate Measurement: Response Surface Methodology. Measurement 2018, 124, 252–259. [Google Scholar] [CrossRef]
  26. Köksal, F.; Beycioğlu, A.; Dobiszewska, M. Optimization Based on Toughness and Splitting Tensile Strength of Steel-Fiber-Reinforced Concrete Incorporating Silica Fume Using Response Surface Method. Materials 2022, 15, 6218. [Google Scholar] [CrossRef]
  27. Barakat, W.S.; Younis, M.K.; Sadoun, A.M.; Fathy, A.; Habba, M.I.A. Optimization of the Accumulative Roll Bonding Process Parameters and SiC Content for Optimum Enhancement in Mechanical Properties of Al-Ni-SiC Composites. Alex. Eng. J. 2023, 76, 131–151. [Google Scholar] [CrossRef]
  28. Der, O.; Ordu, M.; Basar, G. Optimization of Cutting Parameters in Manufacturing of Polymeric Materials for Flexible Two-Phase Thermal Management Systems. Mater. Test. 2024, 66, 1700–1719. [Google Scholar] [CrossRef]
  29. Huang, Y.; Hu, Y.; Zhang, M.; Mao, C.; Wang, K.; Tong, Y.; Zhang, J.; Li, K. Multi-Objective Optimization of Process Parameters in Laser Cladding CoCrCuFeNi High-Entropy Alloy Coating. J. Therm. Spray Technol. 2022, 31, 1985–2000. [Google Scholar] [CrossRef]
  30. Wang, X.J.; Hu, X.S.; Wu, K.; Deng, K.K.; Gan, W.M.; Wang, C.Y.; Zheng, M.Y. Hot Deformation Behavior of SiCp/AZ91 Magnesium Matrix Composite Fabricated by Stir Casting. Mater. Sci. Eng. A 2008, 492, 481–485. [Google Scholar] [CrossRef]
  31. Bonnah, R.C.; Fu, Y.; Hao, H. Microstructure and Mechanical Properties of AZ91 Magnesium Alloy with Minor Additions of Sm, Si and Ca Elements. China Foundry 2019, 16, 319–325. [Google Scholar] [CrossRef]
  32. Shirvanimoghaddam, K.; Hamim, S.U.; Akbari, M.K.; Fakhrhoseini, S.M.; Khayyam, H.; Pakseresht, A.; Ghasali, E.; Zabet, M.; Munir, K.S.; Jia, S.; et al. Carbon Fiber Reinforced Metal Matrix Composites: Fabrication Processes and Properties. Compos. Part A-Appl. Sci. Manuf. 2017, 92, 70–96. [Google Scholar] [CrossRef]
  33. Russell-Stevens, M.; Todd, R.; Papakyriacou, M. The Effect of Thermal Cycling on the Properties of a Carbon Fibre Reinforced Magnesium Composite. Mater. Sci. Eng. A-Struct. Mater. Prop. Microstruct. Process. 2005, 397, 249–256. [Google Scholar] [CrossRef]
  34. Olszówka-Myalska, A.; Myalski, J. Magnesium Alloy AZ31—Short Carbon Fiber Composite Obtained by Pressure Die Casting. Solid State Phenom. 2015, 229, 115–122. [Google Scholar] [CrossRef]
  35. Ataya, S.; Alsaleh, N.A.; El-Sayed Seleman, M.M. Strength and Wear Behavior of Mg Alloy AE42 Reinforced with Carbon Short Fibers. Acta Metall. Sin. Engl. Lett. 2019, 32, 31–40. [Google Scholar] [CrossRef]
  36. Anilan Ajukumar, K.; AjithKumar, K.K.; Kunjayyappan Ravikumar, K.; Deva Rajan, T.P.; Subramonia Pillai, U.T.; Chandrasekhara Pai, B. Fabrication and Characterization of Short Carbon Fiber Reinforced AZ91 Mg Alloy Composites. Mater. Sci. Forum 2012, 710, 347–352. [Google Scholar] [CrossRef]
  37. Lv, G.; Wang, F.; Du, X.; Mao, P.; Zhou, L.; Wei, Z.; Li, J. Microstructure, Mechanical and Wear Properties of Short Carbon Fiber-Reinforced AM50 Magnesium Matrix Composite. Int. J. Met. 2023, 18, 3028–3046. [Google Scholar] [CrossRef]
  38. Abas, M.; Al Awadh, M.; Habib, T.; Noor, S. Analyzing Surface Roughness Variations in Material Extrusion Additive Manufacturing of Nylon Carbon Fiber Composites. Polymers 2023, 15, 3633. [Google Scholar] [CrossRef]
  39. Bedmar, J.; Torres, B.; Rams, J. Manufacturing of Aluminum Matrix Composites Reinforced with Carbon Fiber Fabrics by High Pressure Die Casting. Materials 2022, 15, 3400. [Google Scholar] [CrossRef]
  40. Rutzen, M.; Lauff, P.; Niedermeier, R.; Fischer, O.; Raith, M.; Grosse, C.U.; Weiss, U.; Peter, M.A.; Volkmer, D. Influence of Fiber Alignment on Pseudoductility and Microcracking in a Cementitious Carbon Fiber Composite Material. Mater. Struct. Mater. Constr. 2021, 54, 58. [Google Scholar] [CrossRef]
  41. Johansson, P.; Marklund, P.; Björling, M.; Shi, Y. Effect of Roughness on the Running-in Behavior and Tribofilm Formation of Carbon Fiber Reinforced PTFE Composite in Trace Moisture Environment. Wear 2022, 500–501, 204367. [Google Scholar] [CrossRef]
Figure 1. Schematic representation of a pin-on-disc wear testing machine.
Processes 13 01697 g001
Figure 2. Outflow chart for optimizing process variables.
Processes 13 01697 g002
Figure 3. (a) Microstructure of the AZ91-M alloy, (b) a higher-magnification view of (a), and the distribution maps of its key alloying elements: (c) all collected elements, (d) Mg, (e) Al, and (f) Zn.
Processes 13 01697 g003
Figure 4. (a) Microstructure of the AZ91C-N composite reinforced with 23 vol.% SCFs, (b) a magnified view of (a), and the elemental distribution maps of (c) all detected elements, (d) Mg, (e) C fibers, and (f) Al.
Processes 13 01697 g004
Figure 5. (a) Microstructure of the AZ91C-P composite reinforced with 23 vol.% SCFs, (b) a magnified view of (a), and the elemental distribution maps of (c) all detected elements, (d) Mg, (e) C fibers, and (f) Al.
Processes 13 01697 g005
Figure 6. Densities of AZ91-M, AZ91C-N, and AZ91C-P specimens.
Processes 13 01697 g006
Figure 7. Hardness values of AZ91-M, AZ91C-N, and AZ91C-P specimens.
Processes 13 01697 g007
Figure 8. Comparison of measured versus predicted values for: (a) UCS (Mpa), (b) YS (Mpa), (c) Fr (%), (d) Sr (%), (e) volume loss (cm3) and (f) wear rate (cm3/m).
Processes 13 01697 g008
Figure 9. Normal probability plots of residuals for: (a) UCS in MPa, (b) YS in MPa, (c) Fr in %, and (d) Sr in %. Varied symbols and colors represent influential residuals based on the model’s fit.
Processes 13 01697 g009
Figure 10. Disturbance plots illustrating the influence of temperature (A), AZ91-Materials (B), and applied load (A) on the responses of (a) UCS, (b) YS, (c) Fr, (d) Sr, (e) volume loss, and (f) wear rate.
Processes 13 01697 g010
Figure 11. Effect of process variables on responses of (a) UCS, (b) YS, (c) Fr, and (d) Sr.
Processes 13 01697 g011
Figure 12. Effect of process variables on responses of (a) volume loss and (b) wear rate.
Processes 13 01697 g012
Figure 13. A 3D contour of the effects of temperature, AZ91-Materials, and applied load on (a) UCS, (b) YS, (c) Fr, (d) Sr, (e) volume loss, and (f) wear rate.
Processes 13 01697 g013
Figure 14. SEM images of worn surfaces of (a) and (b) AZ91-M, (c) AZ91C-N, and (d) AZ91C-P at a 5 N applied load.
Processes 13 01697 g014
Figure 15. Three-dimensional worn surface roughness; (a) AZ91-M, (b) AZ91C-N, and (c) AZ91C-P.
Processes 13 01697 g015
Figure 16. Waviness roughness profile; (a) AZ91-M, (b) AZ91C-N, and (c) AZ91C-P.
Processes 13 01697 g016
Figure 17. Surface roughness parameters for AZ91-M alloy and its composites.
Processes 13 01697 g017
Table 1. Chemical composition of the AZ91-M and specifications of the SCFs.
AZ91-Mg Alloy
ElementAlSiZnMnNiCuMg
wt.%8.940.030.870.190.0010.002Balance
SCFs
PurityDiameterLengthDensityElastic ModulusStrength
>955–6 µm80–120 µm1.76 gm/cm3280 GPa180 MPa
Table 2. Studied parameters and their codes.
Process VariablesUnitsExperimental Codes
Temperature°C20160300
Applied loadN135
AZ91-Materials-AZ91-M (1)AZ91C-N (2)AZ91C-P (3)
Table 3. FCCD and RSM design matrix for AZ91-Materials with response variables.
Exp. RunInput Process VariablesResponse Variables
A: Temperature, °CB: AZ91-MaterialsCompressive Strength, MPAYield Strength, MPaFr, %Sr, %
1201351.1136.115.115.3
23003117.893.438.636.2
3203449.7346.72.42.9
4202405.7347.56.23.1
51603328.5228.119.719.1
61602274.6210.417.616.7
71603307233.118.0617.9
8300179.265.754.144.5
9300172.663.15042.9
10300287.169.747.136.4
11202377.9312.77.94.5
123003957640.838.1
13202393.1331.56.811.3
141603338.2249.116.916.7
151601261.4118.136.427.6
1620136914113.813.9
171602286.5196.820.118.1
181601242.711238.229.7
19203417331.683.584.1
203003123.4106.837.235.8
21203427.1338.93.13.6
22300288.67149.938.4
231602305.3204.118.917.3
24201374.8145.412.312.1
25300283.667.847.837.1
261601256.1127.631.522.7
27300173.562.861.139.9
Table 4. RSM experimental design matrix and responses.
Exp. RunInput Process VariablesResponse Variables
A: Applied Load, NB: AZ91-MaterialsVolume Loss, cm3Wear Rate, cm3/m
1510.0698876869.458
2320.001058518.5141
3110.0061797877.8789
4120.0573617759.547
5320.0035393349.544
6330.00968473128.953
7520.0064044979.8787
8130.0036516945.5449
9310.0161003155.673
10120.0701124874.461
11310.0012256315.4153
12110.0244137312.382
13530.0065168583.8783
14330.0244192319.388
15320.00970686126.959
16130.0327019407.102
17520.0125905158.355
18310.0038202244.5447
19510.0020612817.2271
20510.0703933883.464
21530.0244027328.386
22110.0573838750.544
23530.0573728748.55
24330.0323677407.102
25510.00971792132.962
26320.0335933407.102
27110.0130919163.289
Table 5. ANOVA for UCS-reduced quadratic model.
SourceSum of SquaresDfMean SquaresF-Valuep-Value
Model4.467 × 105589,349.63559.04<0.0001Significant
A, Temperature4.185 × 10514.185 × 1052618.39<0.0001
B, AZ91-Materials15,213.49115,213.4995.19<0.0001
AB645.331645.334.040.0575
A212,282.36112,282.3676.85<0.0001
B2116.451116.450.72860.4030
Residual3356.3821159.83
Lack of Fit436.643145.550.89730.4617Not significant
Pure Error2919.7418162.21
Cor Total4.501 × 10526
Std. Dev.12.64R20.9925
Mean258.76Adjusted R20.9908
CV %4.89Predicted R20.9876
Adeq precision60.9266
Table 6. ANOVA for YS-reduced quadratic model.
SourceSum of SquaresDfMean SquaresF-Valuep-Value
Model2.609 × 105552,186.1492.46<0.0001Significant
A, Temperature1.711 × 10511.711 × 105303.23<0.0001
B, AZ91-Materials59,165.71159,165.71104.83<0.0001
AB21,690.30121,690.3038.43<0.0001
A21165.0111165.012.060.1655
B27762.0917762.0913.750.0013
Residual11,852.7121564.41
Lack of Fit10,145.5733381.8635.66<0.0001Significant
Pure Error1707.141894.84
Cor Total2.728 × 10526
Std. Dev.23.76R20.9565
Mean177.30Adjusted R20.9462
CV %13.40Predicted R20.9293
Adeq precision27.6520
Table 7. ANOVA for Fr-reduced quadratic model.
SourceSum of SquaresDfMean SquaresF-Valuep-Value
Model8127.6851625.54159.01<0.0001Significant
A, Temperature7017.9717017.97686.51<0.0001
B, AZ91-Materials970.351970.3594.92<0.0001
AB22.63122.632.210.1516
A273.64173.647.200.0139
B243.09143.094.220.0527
Residual214.672110.22
Lack of Fit103.59334.535.590.0068Significant
Pure Error111.09186.17
Cor Total8342.3626
Std. Dev.3.20R20.9743
Mean26.49Adjusted R20.9681
CV %12.07Predicted R20.9573
Adeq precision35.9442
Table 8. ANOVA for Sr-reduced quadratic model.
SourceSum of SquaresDfMean SquaresF-Valuep-Value
Model4734.225946.84199.43<0.0001Significant
A, Temperature4309.0114309.01907.57<0.0001
B, AZ91-Materials305.871305.8764.42<0.0001
AB15.19115.193.200.0881
A243.56143.569.170.0064
B260.59160.5912.760.0018
Residual99.71214.75
Lack of Fit9.6933.230.64600.5955Not significant
Pure Error90.01185.00
Cor Total4833.9326
Std. Dev.2.18R20.9794
Mean22.44Adjusted R20.9745
CV %9.71Predicted R20.9674
Adeq precision38.1523
Table 9. ANOVA for volume loss-reduced quadratic model.
SourceSum of SquaresDfMean SquaresF-Valuep-Value
Model0.013570.001933.80<0.0001Significant
A, Applied load0.006110.0061106.91<0.0001
B, AZ91-Materials0.000210.00022.890.1054
AB0.000210.00023.460.0783
A20.001510.001525.76<0.0001
B20.000110.00011.240.2797
A2B0.000010.00000.60720.4454
AB20.000610.000610.270.0047
Residual0.0011190.0001
Lack of Fit0.001110.00112195.26<0.0001Significant
Pure Error8.815 × 10−6184.897 × 10−7
Cor Total0.014626
Std. Dev.0.0076R20.9257
Mean0.0244Adjusted R20.8983
CV %30.91Predicted R20.8653
Adeq precision15.5096
Table 10. ANOVA for wear rate-reduced quadratic model.
SourceSum of SquaresDfMean SquaresF-Valuep-Value
Model2.209 × 10673.155 × 10537.78<0.0001Significant
A, Applied load9.486 × 10519.486 × 105113.60<0.0001
B, AZ91-Materials38,855.58138,855.584.650.0440
AB40,788.72140,788.724.880.0396
A22.447 × 10512.447 × 10529.30<0.0001
B28063.1118063.110.96560.3381
A2B4655.2114655.210.55750.4644
AB283,287.81183,287.819.970.0052
Residual1.587 × 105198350.56
Lack of Fit1.583 × 10511.583 × 1057415.77<0.0001Significant
Pure Error384.181821.34
Cor Total2.367 × 10526
Std. Dev.91.38R20.9330
Mean309.86Adjusted R20.9083
CV %29.49Predicted R20.8786
Adeq precision15.9876
Table 11. Confirmation of experiments on the UCS, YS, Fr, and Sr.
Exp.No.AZ91-MaterialsTemperature, °C UCS, MPaYS, MPaFr, %Sr, %
AZ91-M (1) Actual323.1 ± 4134.7 ± 1.724.6 ± 0.3221.2 ± 0.5
1.100Predicted315.23138.2823.9820.17
|Error|, %2.52.592.595.11
Actual221 ± 2.5104.1 ± 1.940.1 ± 0.730.6 ± 0.2
2.200Predicted216.17100.4138.7230.13
|Error|, %2.233.673.561.56
Actual143.9 ± 2.674.5 ± 0.845.9 ± 0.737.4 ± 0.7
3.250Predicted149.3476.1547.4336.13
|Error|, %3.642.173.233.52
AZ91C-N (2) Actual361.5 ± 9.7258.7 ± 4.613.9 ± 0.311.8 ± 0.3
1.100Predicted343.03249.814.5512.39
|Error|, %5.383.564.474.76
Actual243.7 ± 2.5178.9 ± 1.329.1 ± 0.422.9 ± 0.12
2.200Predicted238.74181.5728.323.15
|Error|, %2.081.472.831.08
Actual165.3 ± 2142.3 ± 0.135.3 ± 0.628.7 ± 0.4
3.250Predicted169.29142.1236.5229.56
|Error|, %2.360.133.342.91
AZ91C-P (3) Actual394 ± 7.4301.3 ± 6.210.2 ± 0.1311.2 ± 0.12
1.100Predicted379.65289.3810.4710.96
|Error|, %3.784.122.582.19
Actual266 ± 2192.93 ± 1.122.8 ± 0.221.7 ± 0.4
2.200Predicted270.12190.7823.2522.52
|Error|, %1.531.131.943.64
Actual189.6 ± 4131.7 ± 2.231.66 ± 0.3430.3 ± 0.5
3.250Predicted198.05136.1530.9829.34
|Error|, %4.273.272.193.27
Table 12. Confirmation of experiments on the volume loss and wear rate.
Exp.NoAZ91-MaterialsApplied Load, N Volume Loss, cm3Wear Rate, cm3/m
AZ91-M (1) Actual0.0109978 ± 0.00008153.003 ± 3.14
1.2Predicted0.0108340146.984
|Error|, %1.514.1
Actual0.0349004 ± 0.00011517132456.475 ± 0.9
2.4Predicted0.0346720458.313
|Error|, %0.660.4
AZ91C-N (2) Actual0.0040895 ± 0.0000838347553.2249 ± 0.98
1.2Predicted0.004264051.343
|Error|, %4.13.67
Actual0.0368539 ± 0.000359325525459.652 ± 5.6
2.4Predicted0.0361480448.968
|Error|, %1.952.38
AZ91C-P (3) Actual0.0028440 ± 0.00004550428.0477 ± 0.6
1.2Predicted0.002938026.983
|Error|, %3.23.95
Actual0.0179567 ± 0.000338483795216.543 ± 2.7
2.4Predicted0.0186600222.008
|Error|, %3.772.46
Disclaimer/Publisher’s Note: The statements, opinions and data contained in all publications are solely those of the individual author(s) and contributor(s) and not of MDPI and/or the editor(s). MDPI and/or the editor(s) disclaim responsibility for any injury to people or property resulting from any ideas, methods, instructions or products referred to in the content.

